[COPY] Markets Update - 1/2/25
Update on US equity and bond markets, US economic reports, the Fed, and select commodities with charts!
To subscribe to these summaries, click below (it’s free!).
To invite others to check it out (sharing is caring!),
Link to posts - Neil Sethi (@neilksethi) / X (twitter.com)
Note: links are to outside sources like Bloomberg, CNBC, etc., unless it specifically says they’re to the blog.
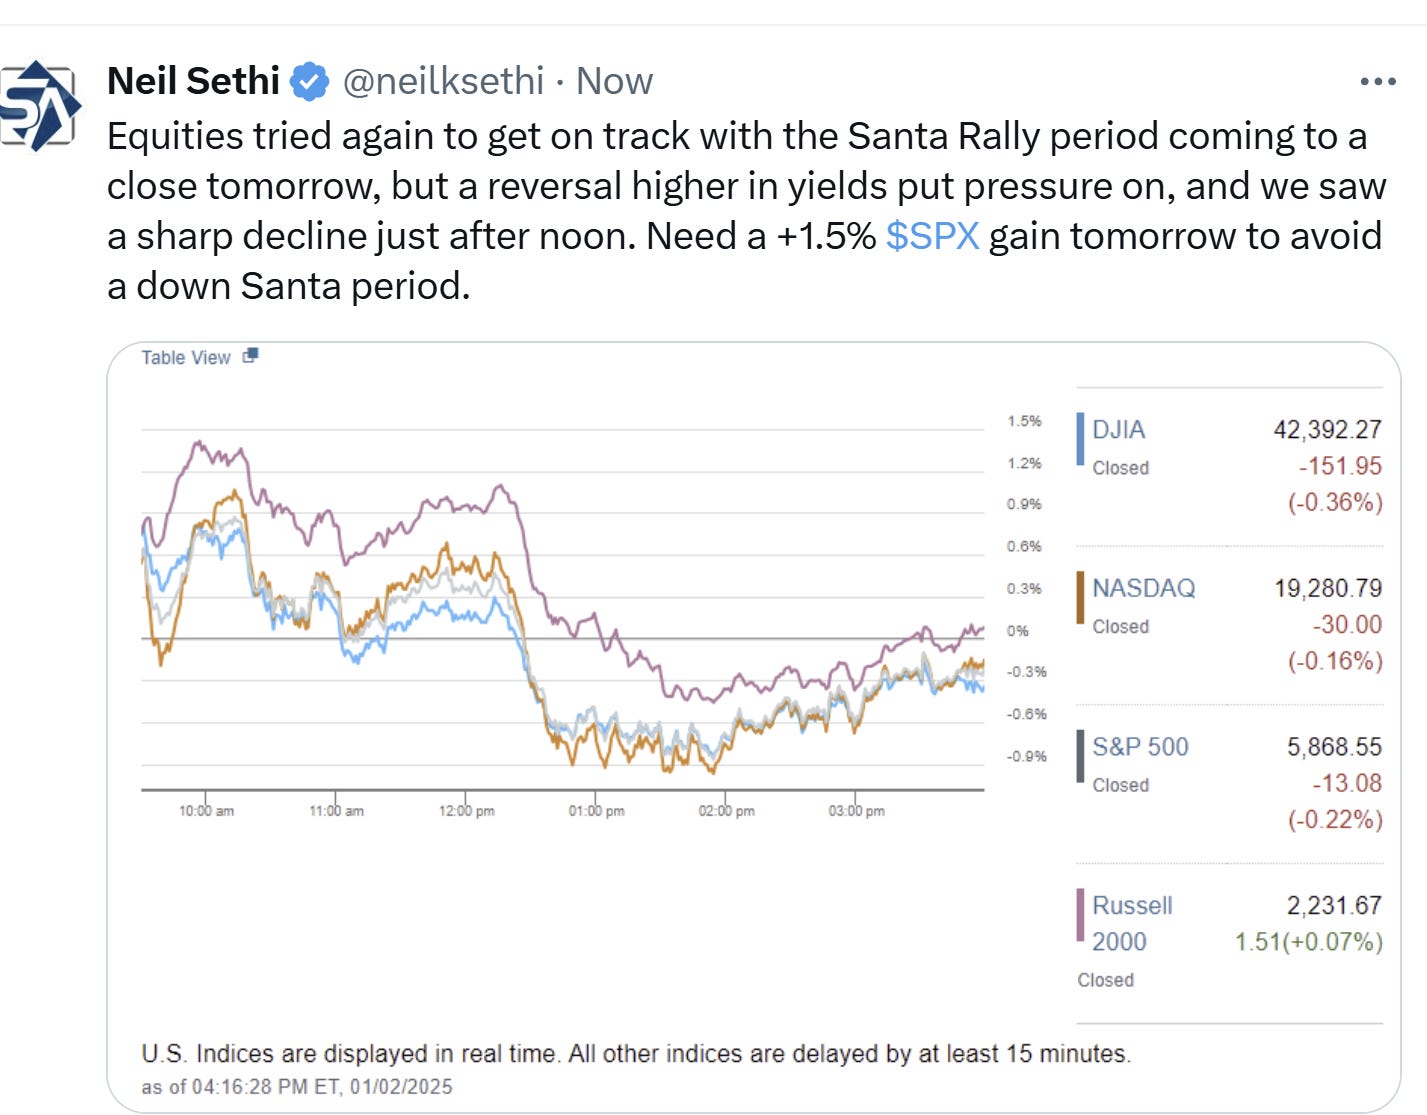
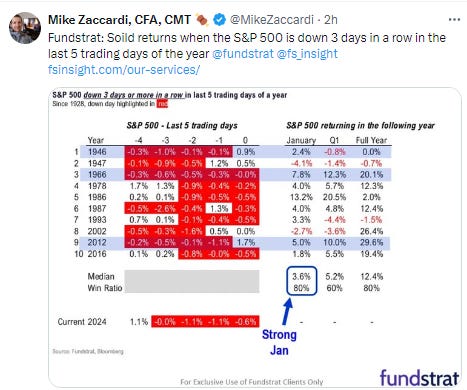
US large cap equities started off 2025 as they ended 2024, finishing lower after reversing an early rally attempt. The S&P 500 has now fallen for five straight trading sessions, its longest losing streak since a six-day slide in April of last year. Again the reversal seemed to be catalyzed by long duration bonds moving higher. The losses mean it will be a tough task for the indices to manage a positive Santa Rally period which ends tomorrow.
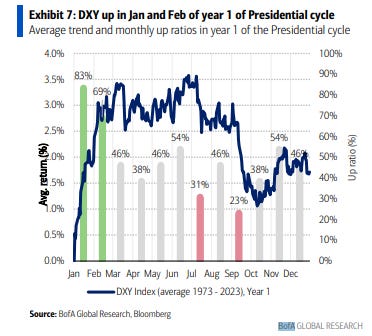
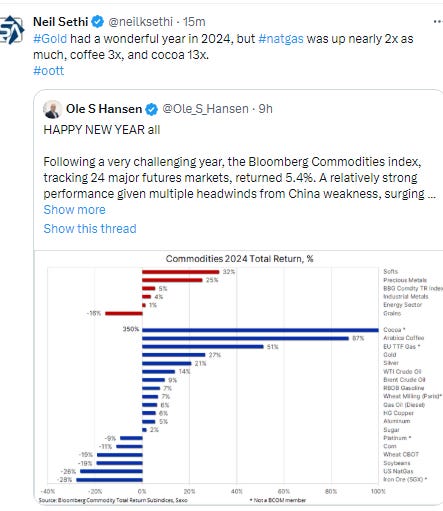
Elsewhere, the dollar jumped to new 2+ year highs, but gold, crude, and bitcoin all made significant gains nonetheless. Nat gas and copper were little changed.
The market-cap weighted S&P 500 was -0.2%, the equal weighted S&P 500 index (SPXEW) -0.3%, Nasdaq Composite -0.2% (and the top 100 Nasdaq stocks (NDX) -0.2%), the SOX semiconductor index +0.8%, and the Russell 2000 +0.1%.
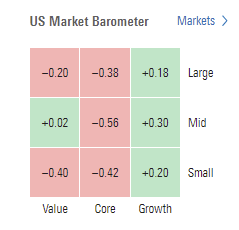
Morningstar style box showed relatively subdued moves across styles with growth outperforming.
Market commentary:
“If you think about the market moving two steps forward, one step back, we’re in that one-step back phase after a stellar, really, 2024. … Valuations and sentiment have swung to the optimistic euphoric side, so we’re seeing the market work through those overbought conditions in the short term,” Edward Jones senior investment strategist Angelo Kourkafas told CNBC.
“If we don’t want to buy at all-time highs, you can now still earn good money in cash. Let it sit there, wait for a better entry point, and wait for it in certain stocks,” Liz Young Thomas, head of investment strategy at SoFi, said on “Halftime Report.”
“The argument that irrational exuberance, animal spirits and bubble-like optimism were the primary drivers behind the market’s levitation seem largely inconsistent with stronger data and more subdued recession risks,” UBS strategist Jonathan Golub said in a note to clients Thursday. “Either way, it is clear that investors are extremely optimistic as we enter 2025. Maybe this exuberance is reason for concern. Maybe 2025 will be another gangbuster year,” Golub continued.
“At the beginning of the year, analysts tend to be pretty optimistic — you have pretty robust year-on-year earnings forecasts,” Daniel Morris, chief market strategist at BNP Paribas Asset Management, said on Bloomberg TV. “Even if we don’t quite get say 20% earnings growth for Nasdaq, the way analysts might suggest, if it’s only 15, likely markets will do well.”
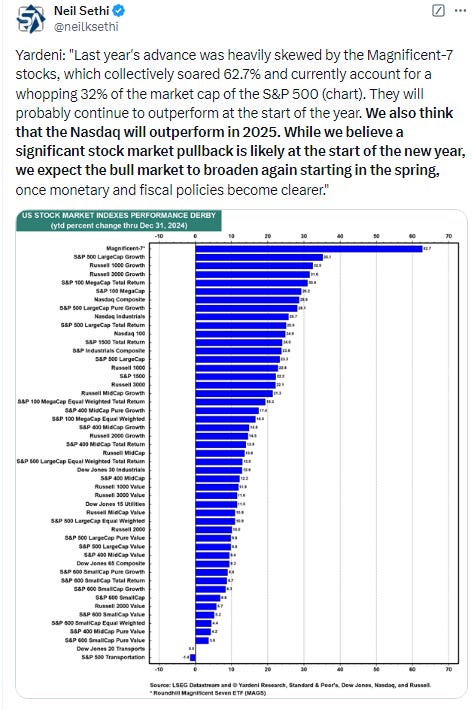
For corporate earnings, 2025 will be a “show-me year,” according to Lisa Shalett at Morgan Stanley Wealth Management, who warned that the dominance of the Magnificent Seven — the big technology stocks responsible for the bulk of last year’s gains — was teetering. “This idea that they as a group can trade together and lead the market may falter in 2025,” she said. It’s a call echoed by others on Wall Street, including Bank of America Corp.’s Savita Subramanian. As for the grim slide in the final days of 2024, it’s “too soon to call it a bad omen,” Shalett told Bloomberg Television.
What Bloomberg strategists are saying... “While the notable absence of a Santa Rally has previously led to a rebound in stocks for the month of January, the year’s first trading day doesn’t offer a great signal for the whole 12-month period. Over the past four years, for example, it has actually been a contrarian indicator, Deutsche Bank notes. The S&P 500 ended the year inversely of how it started. Extending that analysis back to 1928, the year’s first trading day and the SPX’s annual performance have a poor correlation and have only moved in tandem ~50% of the time.”
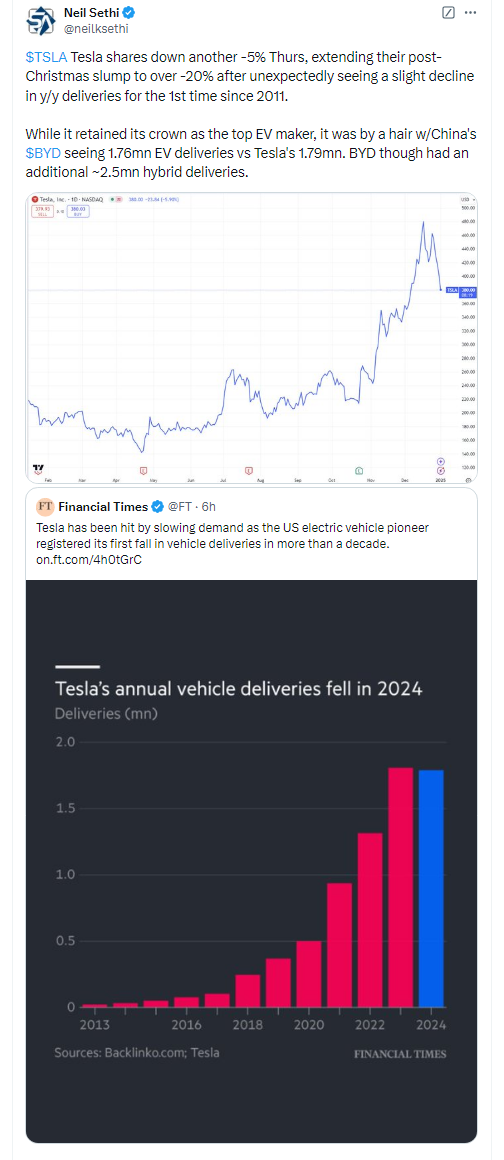
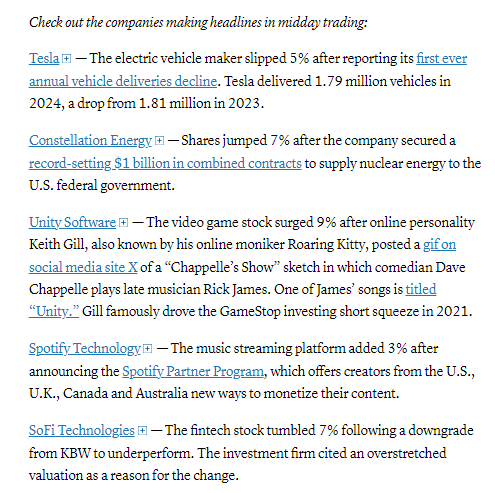
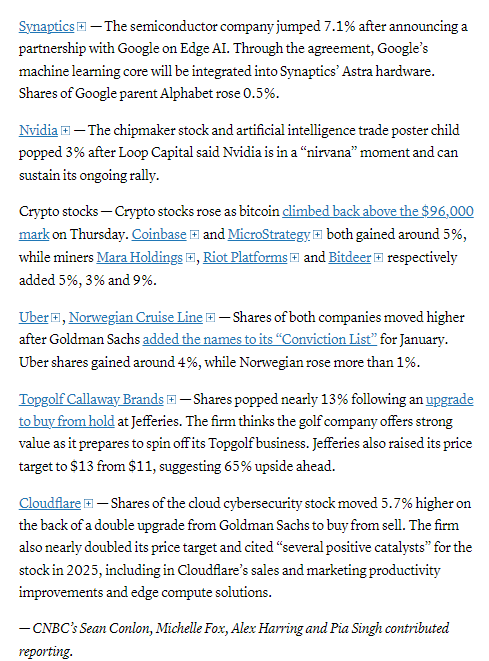
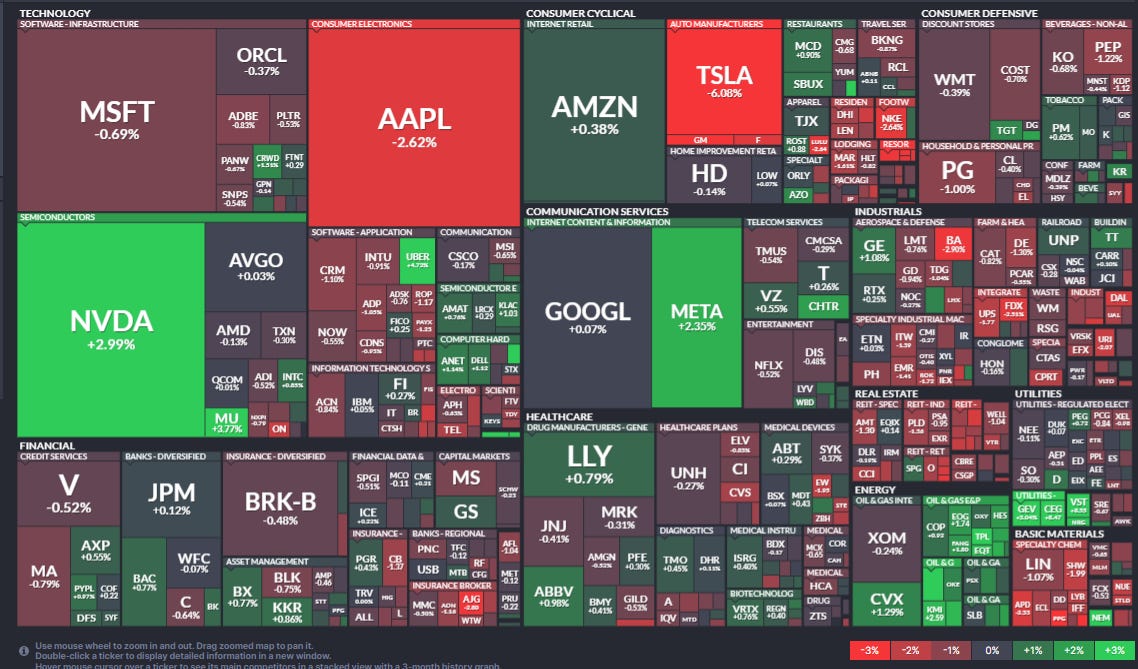
In individual stock action, Apple (AAPL 243.85, -6.57, -2.6%) and Tesla (TSLA 379.28, -24.56, -6.1%) extended early declines as the major indices moved to session lows. Apple shares reacted to some cautious comments on iPhone demand from the analyst at UBS. Tesla's weakness followed its Q4 deliveries report, which saw the company's first annual decline in deliveries since 2011. The stock has registered its worst five-day drop in more than two years. Microsoft (MSFT 418.58, -2.92, -0.7%) was another influential loser with no specific catalyst, turning lower after trading up as much as 1.1% at its intraday high. Chipmaker Nvidia rose 3%, helping to somewhat offset the declines from other Big Tech stocks.
Some tickers making moves at mid-day from CNBC.
In US economic data:
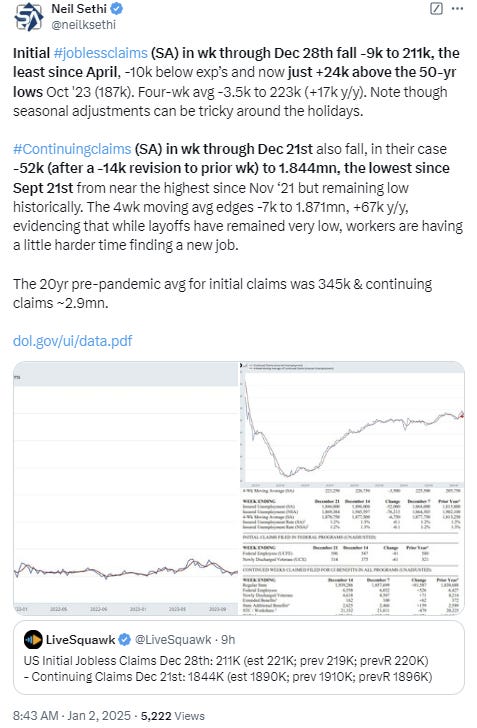
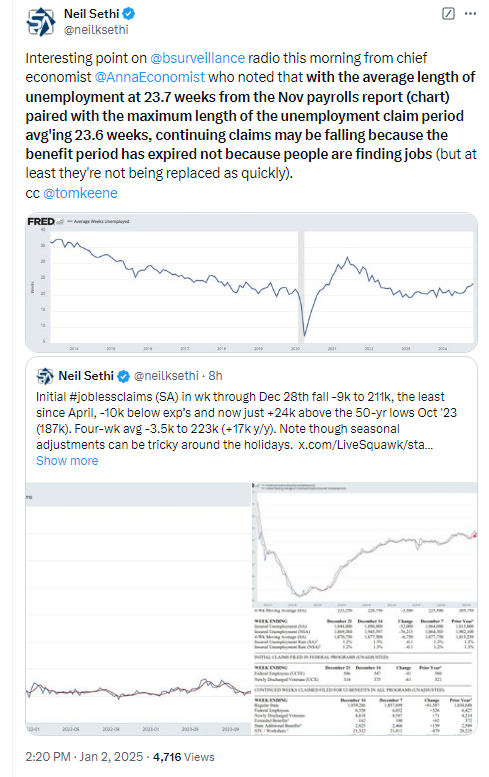
Weekly jobless claims fell back (but note seasonal adjustments).
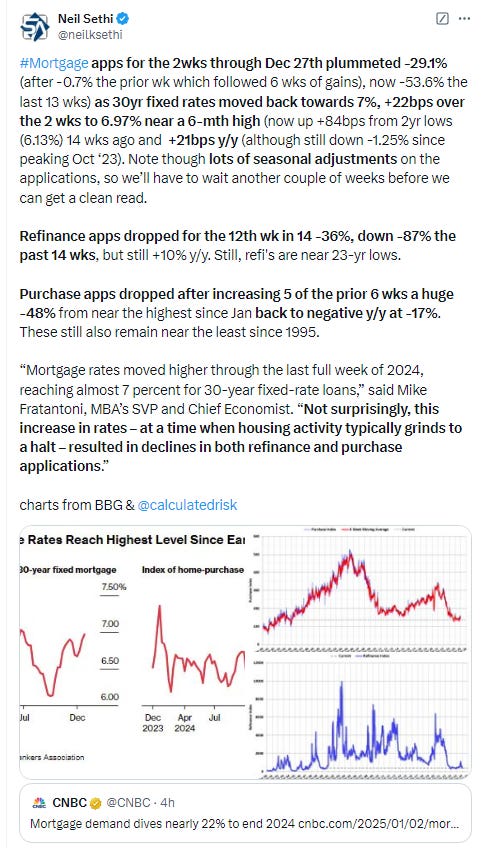
Weekly mortgage applications plummeted (but note seasonal adjustments).
S&P’s final Dec manufacturing PMI came in weaker than expected showing a modest but slightly larger contraction than November.
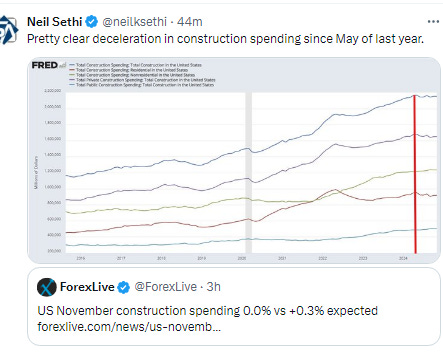
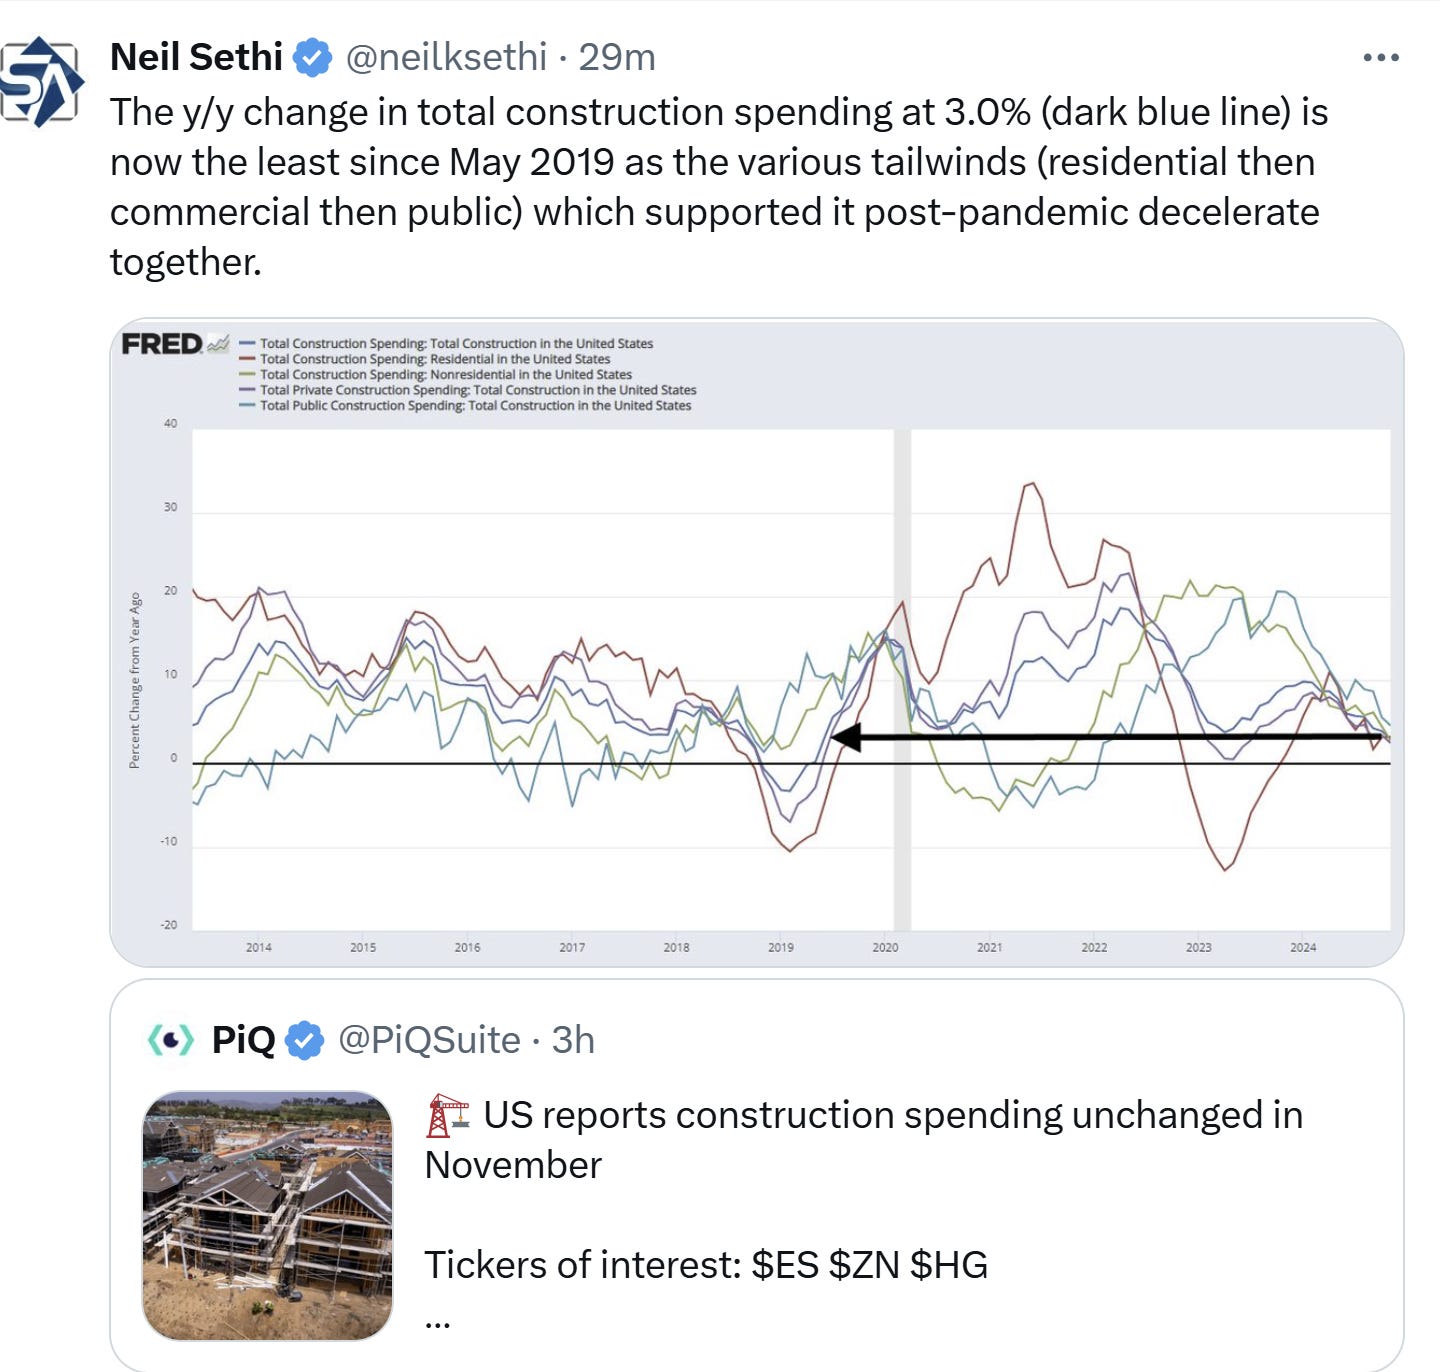
Construction spending in Nov came in flat after a strong Oct continuing an overall slowdown since peaking in May of last year.
Link to posts - Neil Sethi (@neilksethi) / X (twitter.com) for more details.
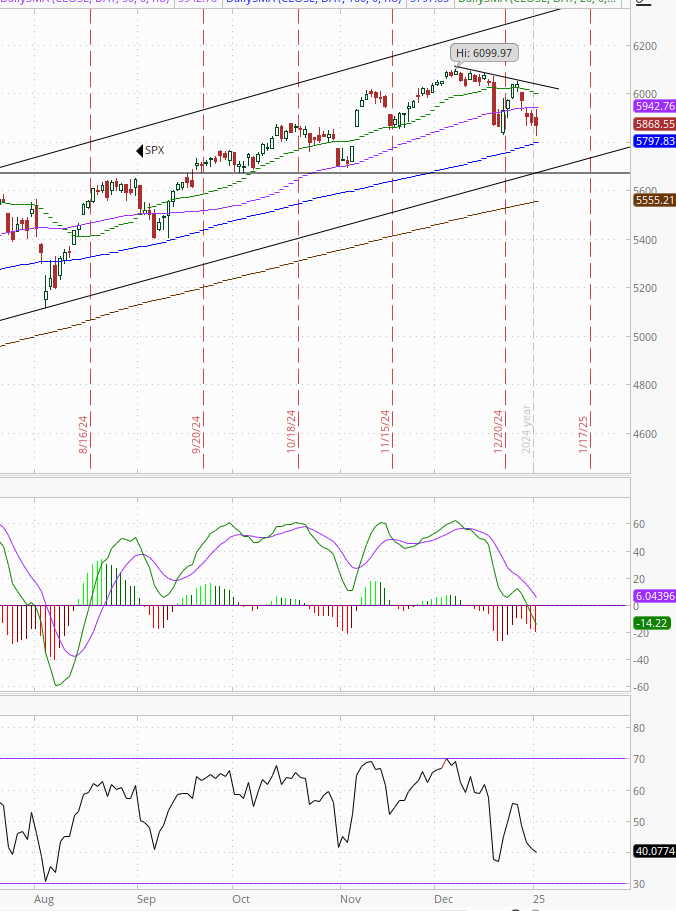
The SPX failed again at retaking its 50-DMA for a 3rd session. As noted Monday, “that’s a negative technical pattern. Adding to that the daily MACD remains weak, and the RSI is under 50, so we look lower until it can get back over the purple line.”
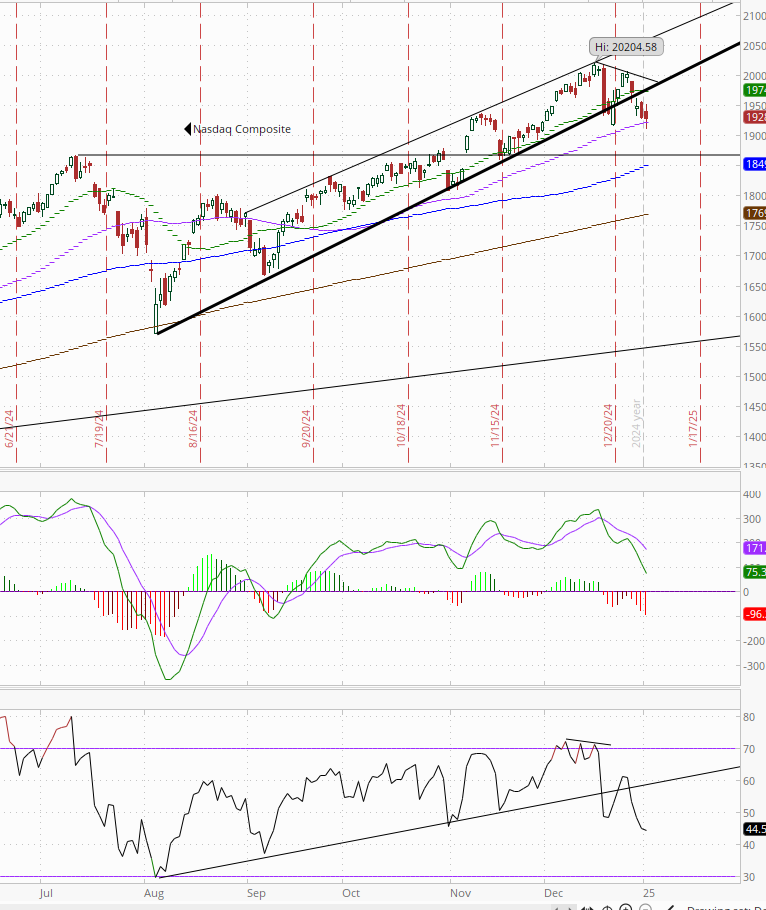
The Nasdaq Composite for its part was able to regain its 50-DMA after falling below during the session, remaining under its uptrend channel back to August. Its daily MACD remains weak, and its RSI is also now under 50.
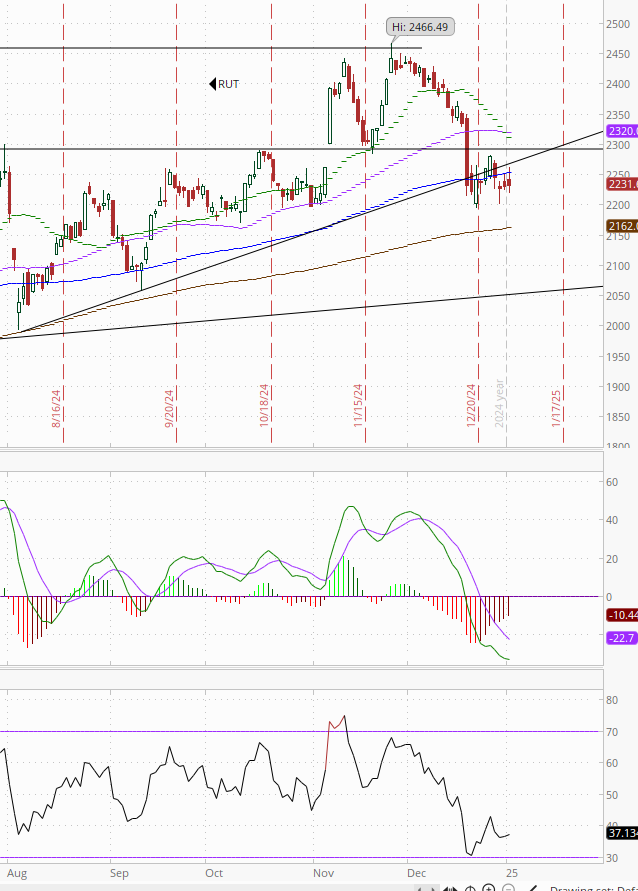
RUT (Russell 2000) for its part remains under its 100-DMA. Daily MACD & RSI remain the weakest of the three.
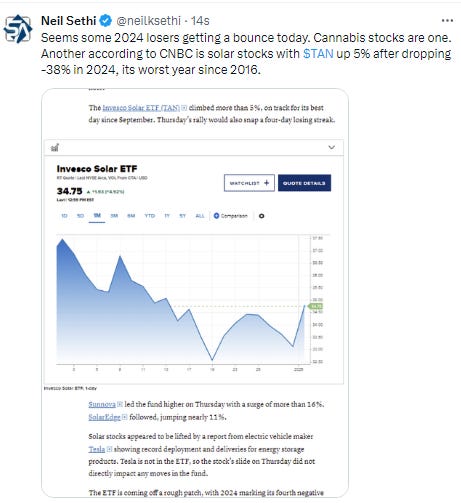
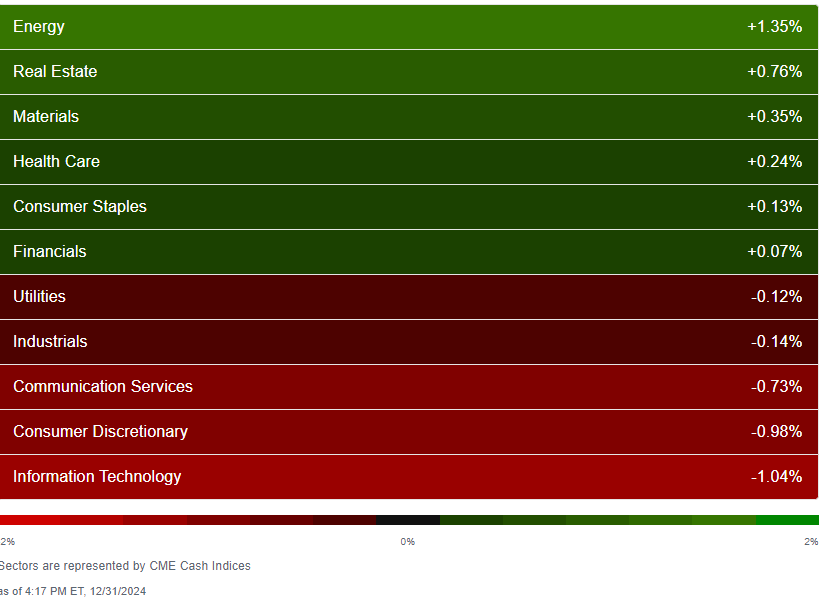
Equity sector breadth from CME Indices weakened to just 4 green sectors from 6 Tues (still better than none Fri & Mon I guess), with energy once again in the lead and only sector up over 1% (4th straight session energy finished first). Unlike Tuesday though the megacap growth sectors didn’t trade as one block although cons discr finished in the bottom three for a 4th session pressured by the continued decline in Tesla. Three total sectors were down around -1% or more, up from two Tues, but much better than the eight Mon.
Stock-by-stock $SPX chart from Finviz sees a little more dispersion but still more red than green. Tesla has been bright red since Christmas.
Positive volume (the percent of volume traded in stocks that were up for the day) remained over 50% for both indices at 57 and 70% respectively, the 2nd straight session for the NYSE and the eighth for the the Nasdaq despite the weak index action (more on that below). These are very strong numbers in that respect. Positive issues (percent of stocks trading higher for the day) also improved to over 50% on both indices at 54 & 53% respectively.
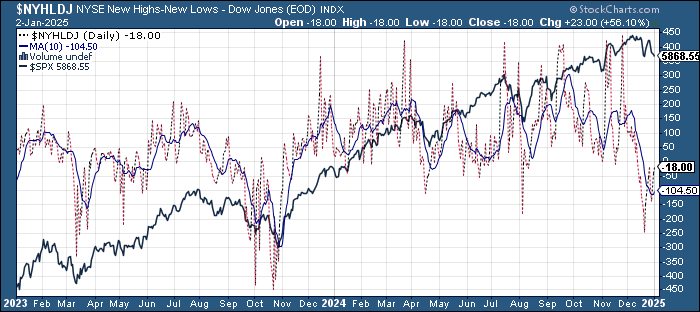
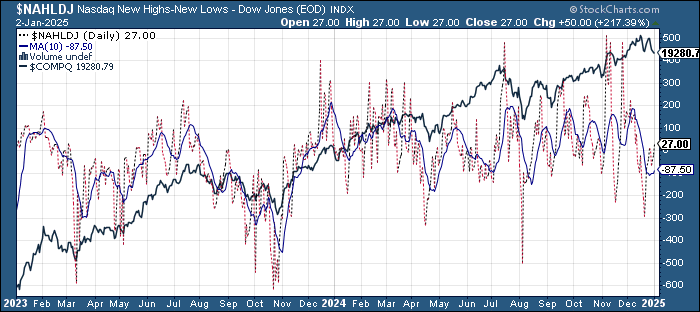
New highs-new lows (charts) also improved with the NYSE up to -19 from -140 on Mon (still negative for a 13th session though), while the Nasdaq moved back into positive territory at 25 from -68 Mon. Both are back above their 10-DMAs and both are now curling up (more bullish).
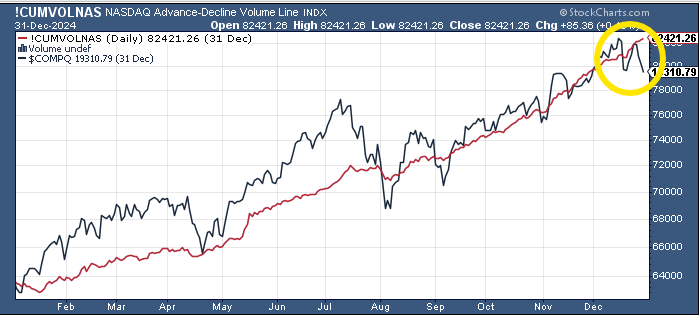
As a side note, the continued strength in the Nasdaq volume advance/decline line despite the weakness in the index is unusual. As you can see from the chart the A/D line normally dips or at least goes sideways when we see a sharp pullback in the index, but not this time.
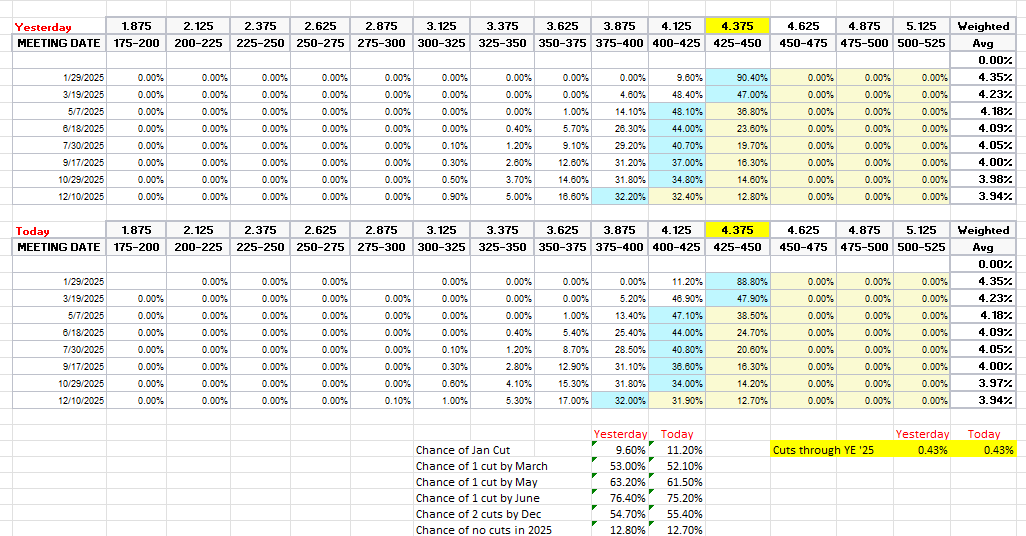
FOMC rate cut probabilities from CME’s #Fedwatch were little changed still pricing in a 2nd cut in 2025 at better than 50% (55%). Overall 2025 cut expectations at 43bps. First cut remains in March at 52%. Chance of no cuts at 13%.
I had previously noted the market seemed quite aggressively priced to me, and that I continued to expect at least two cuts, and it seems the market is moving in my direction. Of course it’s all just a big guess as we know it will all come down to the data.
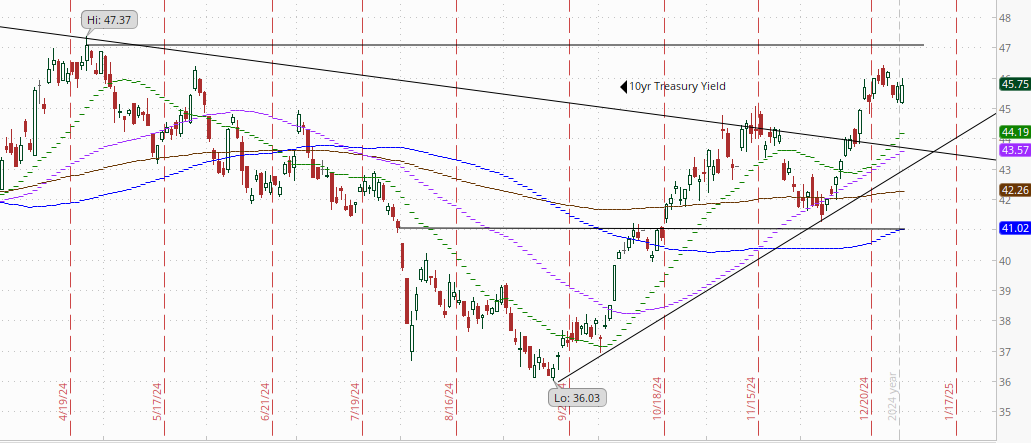
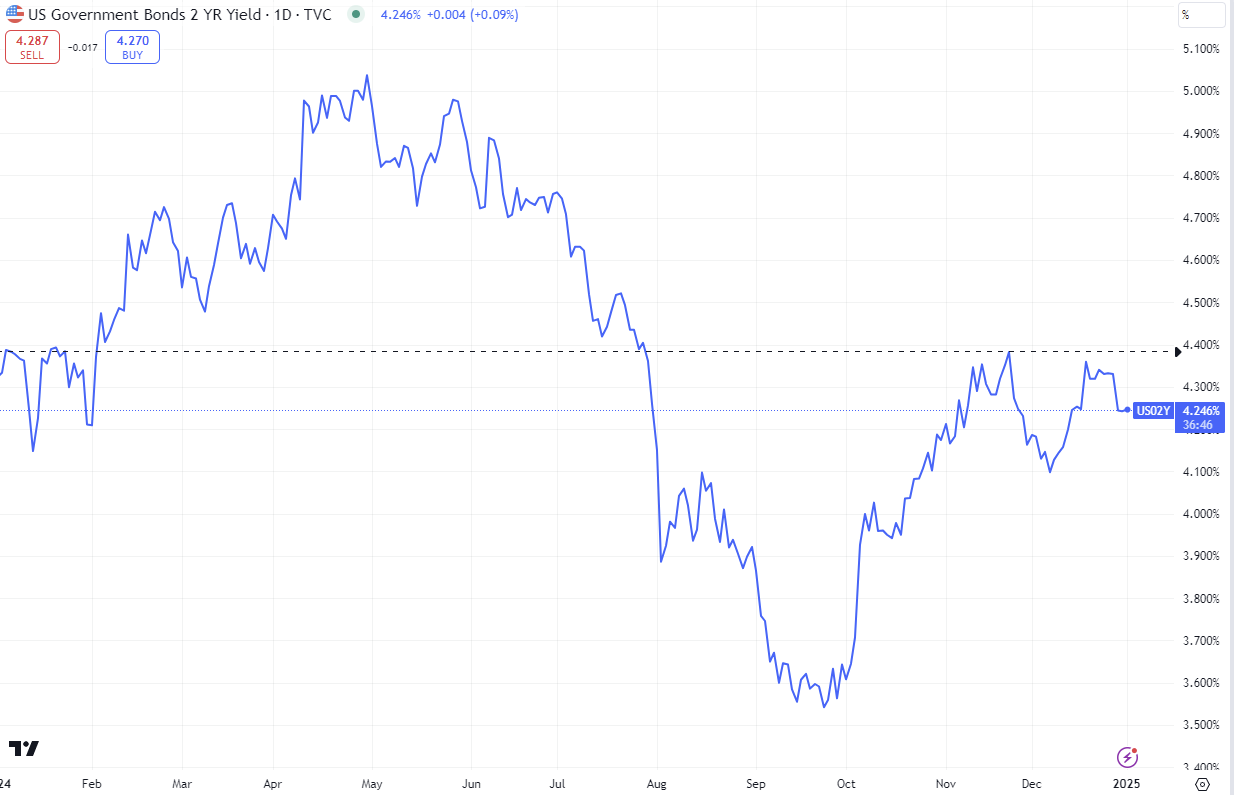
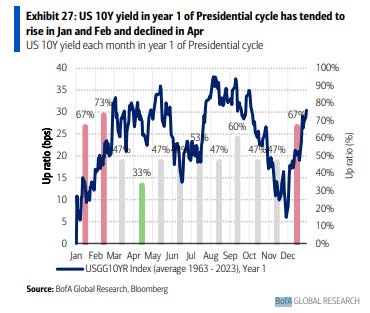
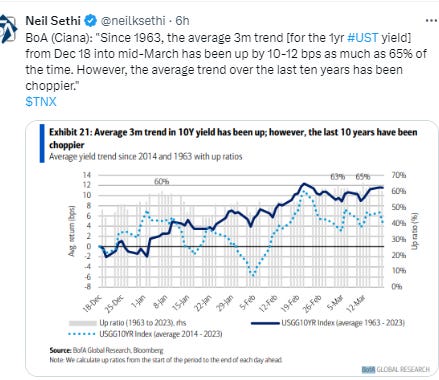
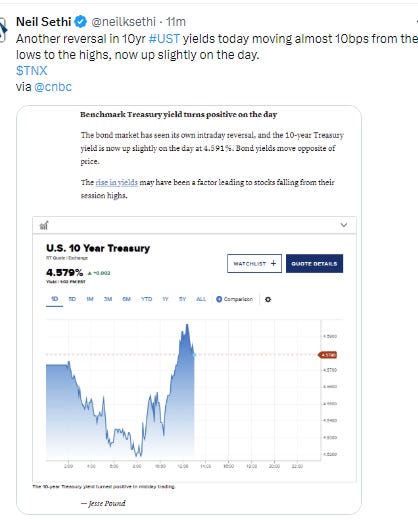
Longer duration Treasury yields again rebounded after falling to 1-week lows early in the session with the 10yr yield up +1bps at 4.58%, 5bps below the recent high, and +19bps since the Dec FOMC meeting (& +82bps from the Sept FOMC meeting), as I’ve said the past 2 weeks “still eyeing the 4.7% level”. The 2yr yield, more sensitive to Fed policy, was +1bp to 4.25%, off a 2-week low.
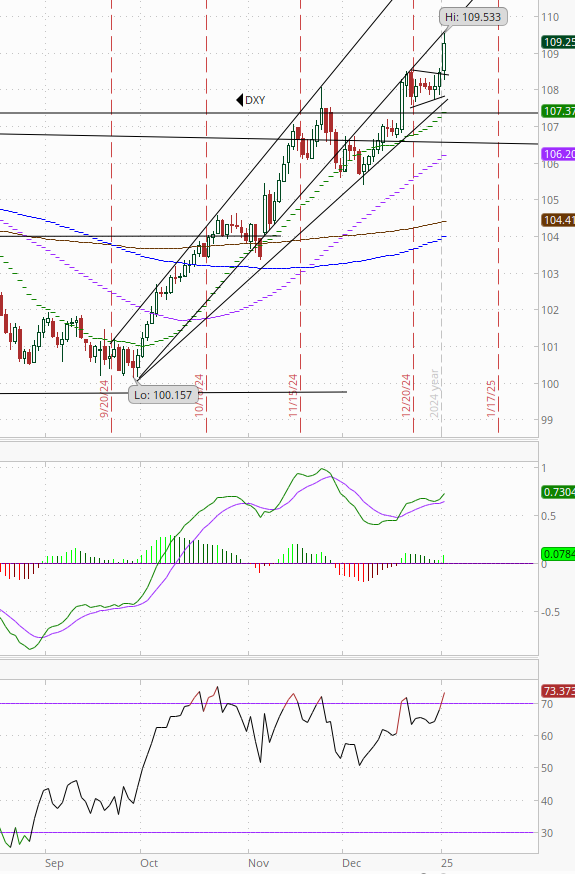
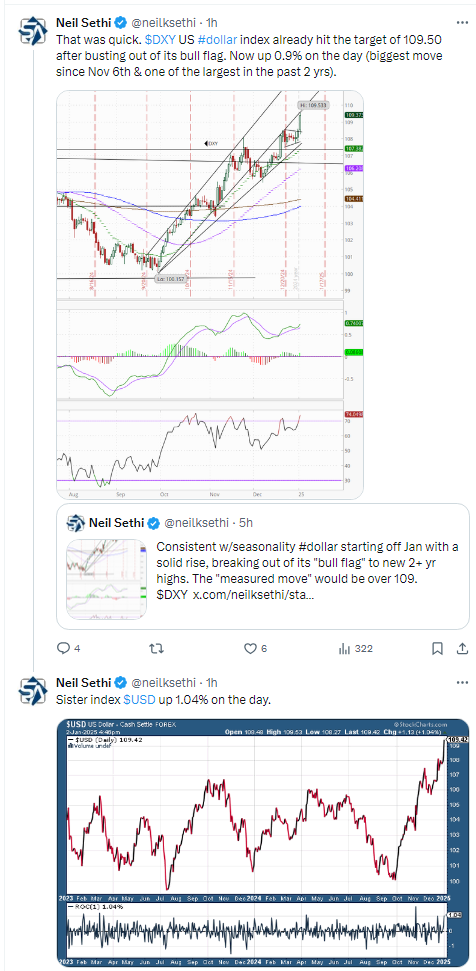
Dollar ($DXY) had a big day. After completing the break out of its flag pattern (which I said Tuesday would measure to over 109) it did just that jumping +0.9% to 109.50 before settling back a touch. Daily MACD and RSI tilt positive but it’s the most overbought since Oct.
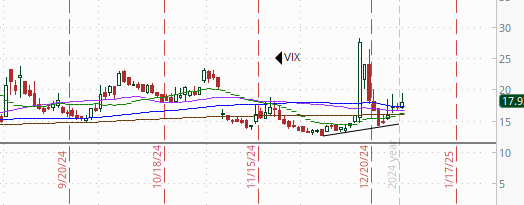
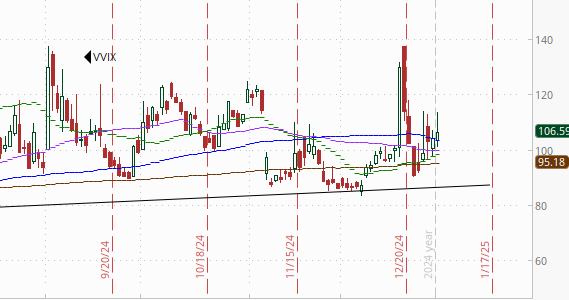
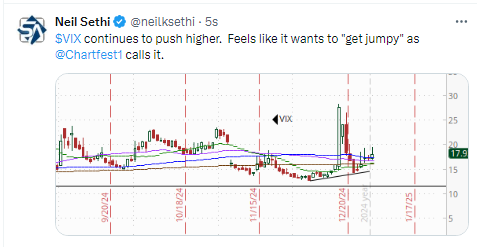
The VIX edged higher again remaining relatively elevated at 17.9 (consistent w/1.16% daily moves over the next 30 days), and continuing to push up towards the 20 level. The VVIX (VIX of the VIX) edged to 106, further over the 100 “stress level” identified by Nomura’s Charlie McElligott (consistent with “elevated” volatility and daily moves in the VIX over the next 30 days (normal is 80-100)).
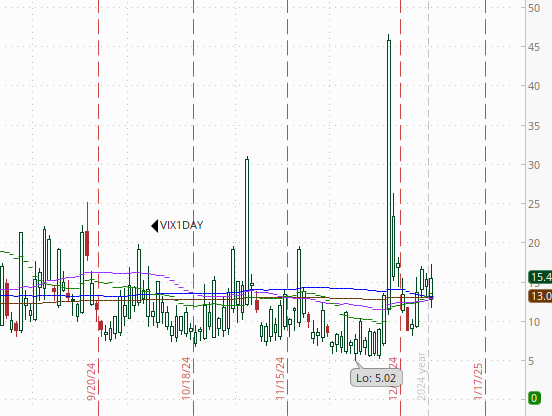
1-Day VIX also remains relatively elevated at 15.4, well above the sub-10 readings we were seeing before the Dec FOMC meeting, looking for a move of 0.97% Friday.
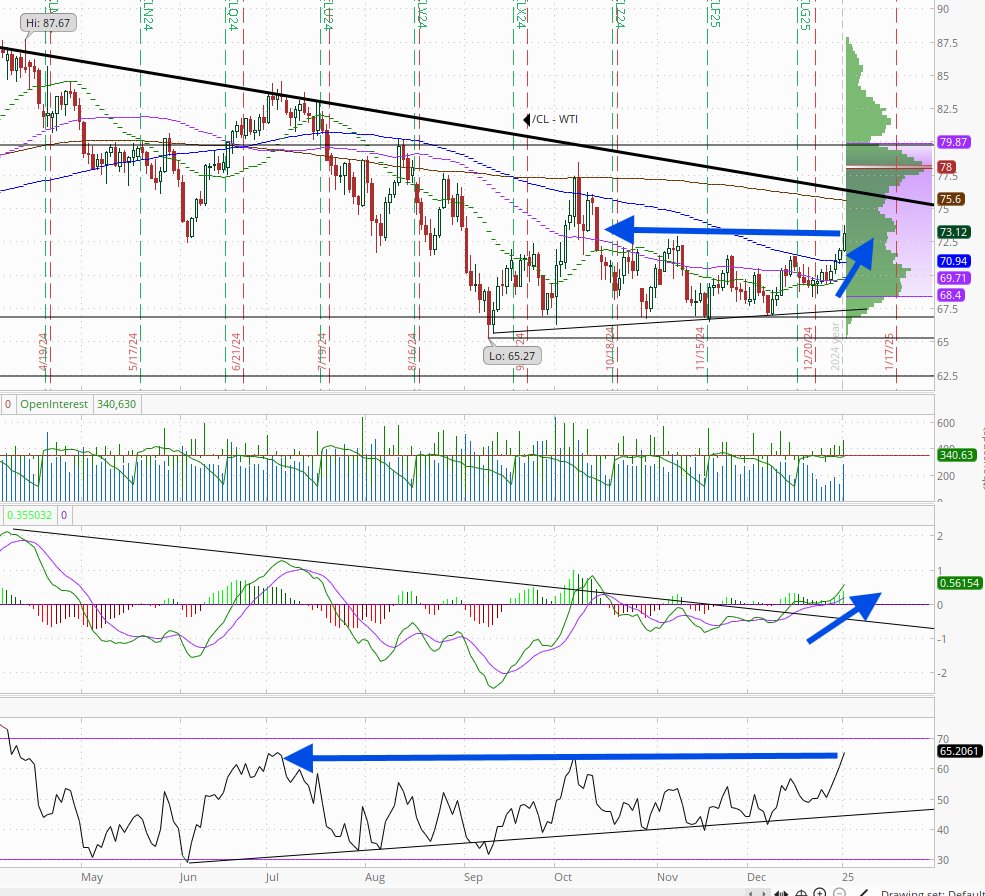
WTI up for a 4th day, moving out of its range since November, gaining momentum with the daily relative strength now the highest since July and a "go long" signal on the MACD. Price the highest since Oct.
I’ve said the past 3 weeks, “it needs to get over the 100-DMA which seems to have become resistance since August, then the $72.50 level,” and now it’s done both. Would be surprised if it doesn't make it to the $75 resistance area.
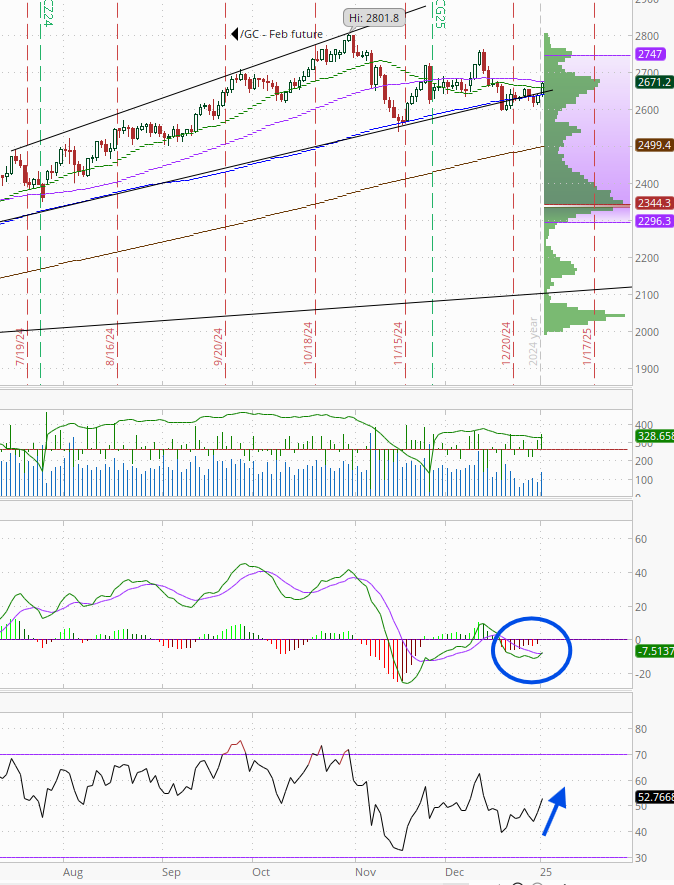
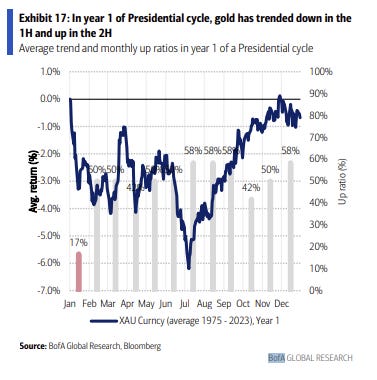
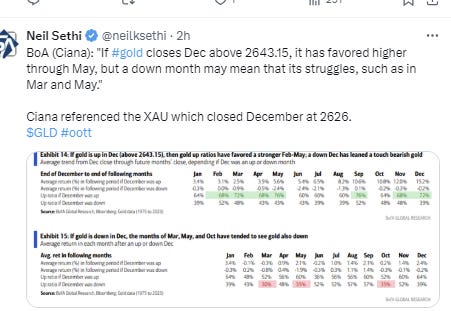
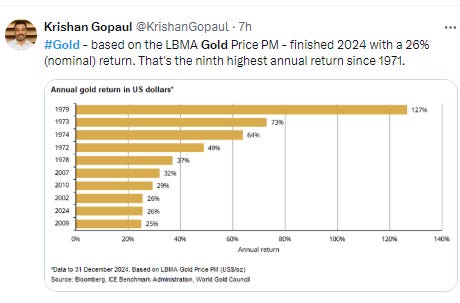
Gold a solid gain which took it through its 100-DMA to just below its 50-DMA. Daily MACD has crossed over to "cover shorts" signal (circle) & daily RSI over 50 and moving higher (arrow). If it can push through the 50-DMA (purple line), it could get going.
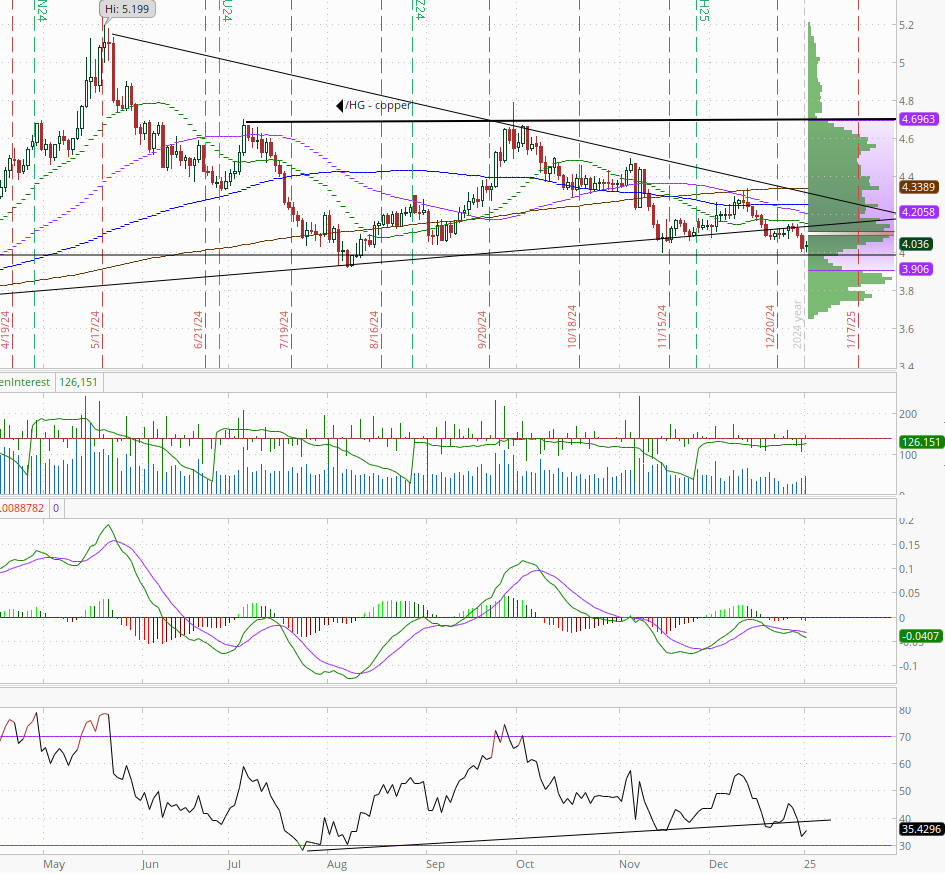
Copper (/HG) remains victim to the weak China data remaining near the lowest close since August just above the $4 mark it has only tested once (for one session) since then previously. Its RSI and MACD remain negative for now with the former around the least since Aug.
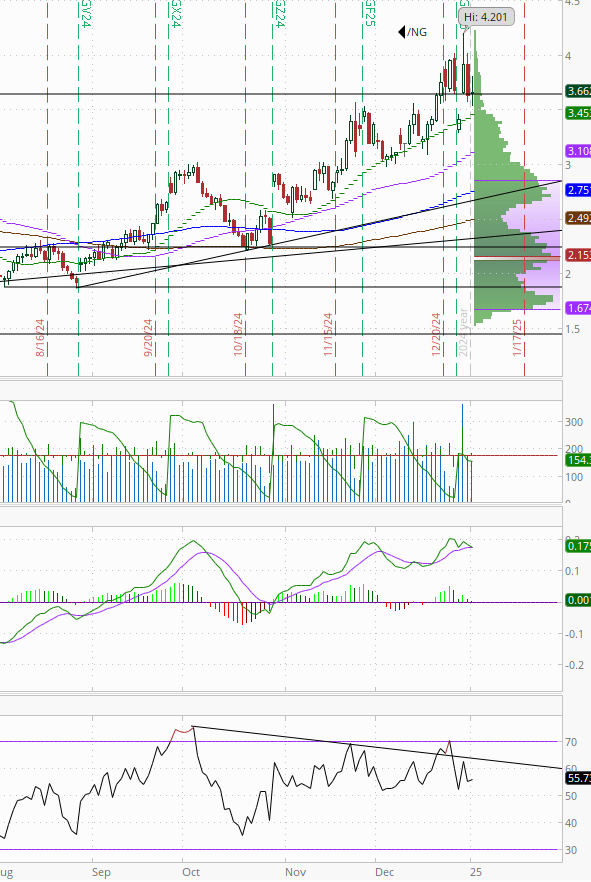
Nat gas (/NG) little changed today after several very volatile days. It fell below the $3.65 breakout level but was able to just recover it. I said Tuesday I wouldn’t at all be surprised to see it fall at least back down towards the 20-DMA (green line) which it sort of did today I guess. Daily MACD and RSI remain positive for now (though we still have the negative RSI divergence) but are close to turning less positive.
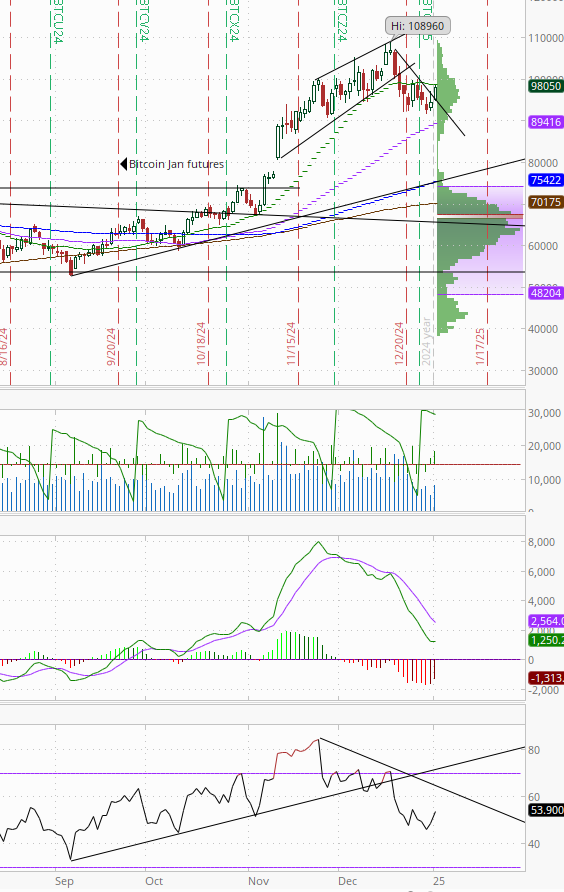
Bitcoin futures up for a 2nd session back to the 20-DMA which capped its rallies since it fell below two weeks ago. The daily MACD remains very weak though, and the RSI is just off the weakest since mid-October although back over 50.
The Day Ahead
In US economic data, we’ll end our “holiday” period (US economic data picks up considerably next week) with the ISM manufacturing PMI.
We do have a Fed speaker in Richmond Fed President Barkin (not a 2025 voter though), but no Treasury auctions or notable earnings.
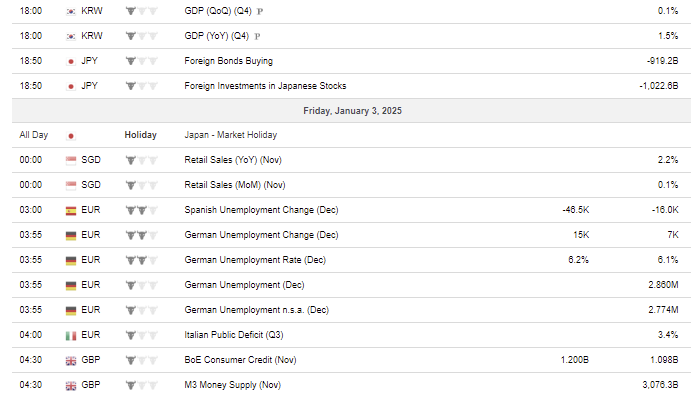
Ex-US we’ll get Dec Germany employment, Nov UK consumer credit & Mexico employment, and South Korea preliminary Q4 GDP.
Also, investors will be watching the House speaker vote to see if Mike Johnson will retain his position. GOP squabbling over his reelection could bode ill for the president-elect’s agenda, according to Tom Essaye, founder of the Sevens report. If Johnson’s confirmation takes several rounds of voting over several days, “that will be a bad sign for Republican unity and hopes for quick action on pro-growth policies will take a hit,” he wrote.
Link to X posts - Neil Sethi (@neilksethi) / X (twitter.com)
To subscribe to these summaries, click below (it’s free!).
To invite others to check it out,


