
CPI - Feb 2026
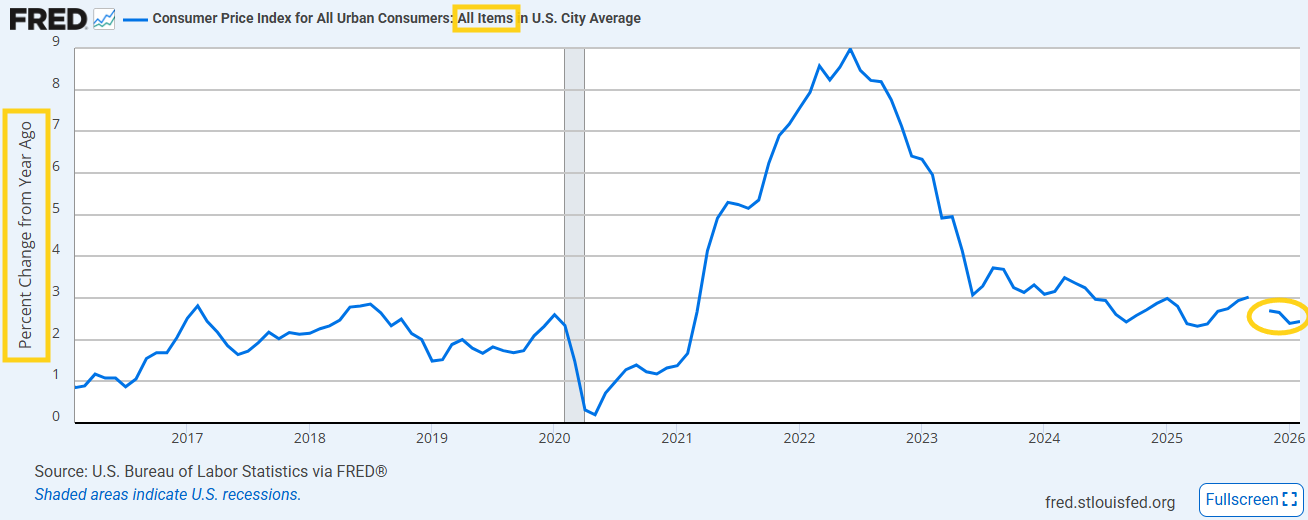
Feb (so before start of Iran conflict) headline and core CPI come in as expected with core y/y the least since March 2021

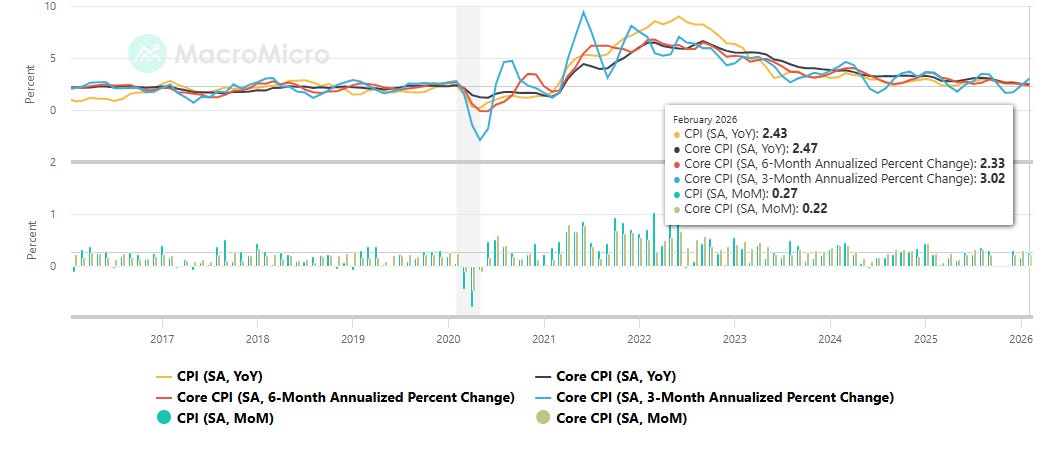
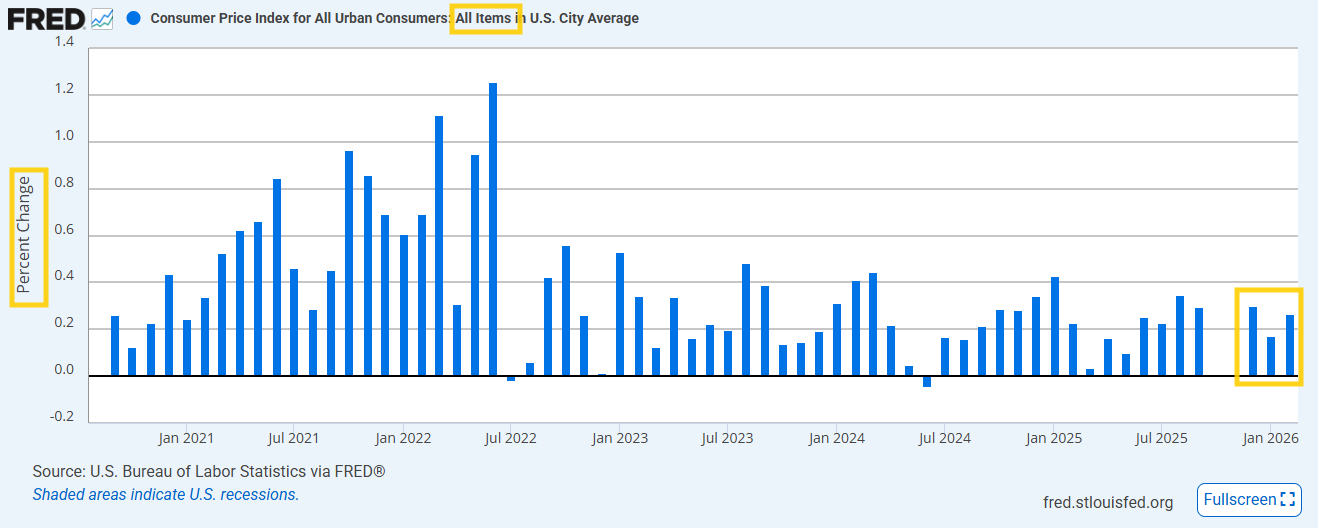
US CPI Unrounded (M/M) Feb: 0.267% (prev 0.171%)
- CPI Unrounded (Y/Y): 2.414% (prev 2.386%)
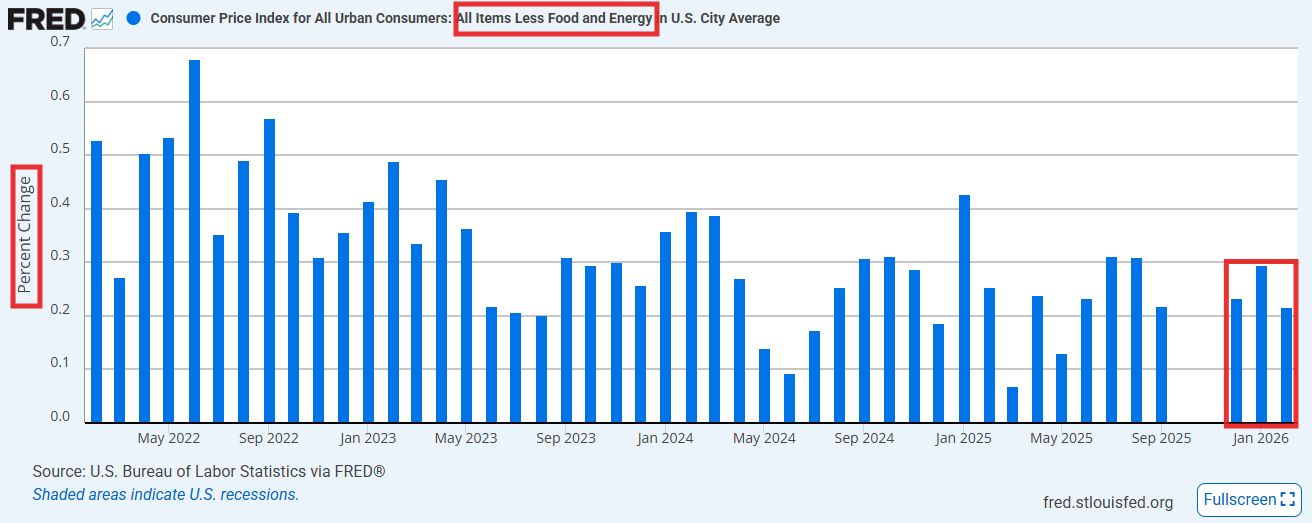
- CPI Core Unrounded (M/M): 0.216% (prev 0.295%)
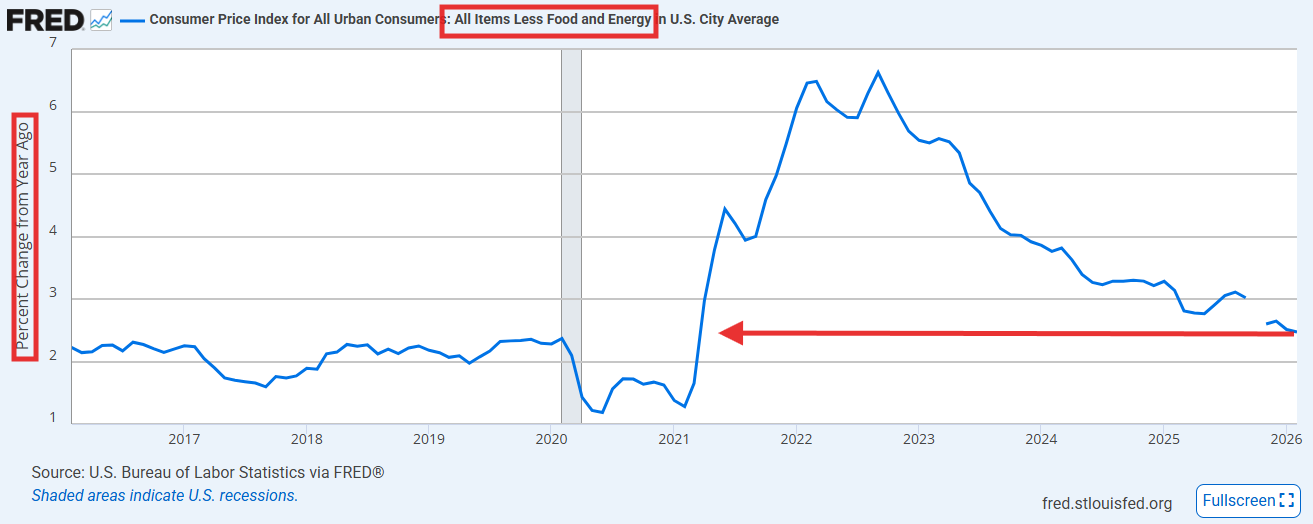
- CPI Core Unrounded (Y/Y): 2.457% (prev 2.504%)
US CPI Supercore (M/M) Feb: 0.350% (prev 0.593%)
- CPI Supercore (Y/Y): 2.746% (prev 2.671%)
US Feb (so before the start of the Iran conflict) headline CPI sees a slight acceleration to +0.3% as expected (+0.27% unrounded) from January’s +0.2% (+0.17% unrounded, which was the least since May excluding the Oct placeholder). The y/y headline ticked up as a result to +2.4% (unrounded +2.41% vs. Jan’s +2.39%, also the least since May).
Core, however, decelerated to +0.2% also as expected (+0.22% unrounded, the least since May (and it hasn’t had a hotter than expected m/m read since 2024)) with core y/y holding at +2.5% (unrounded +2.46% vs. Jan’s +2.50%), the least since Mar ‘21. On a 3-month annualized basis though, it was 3.02%.
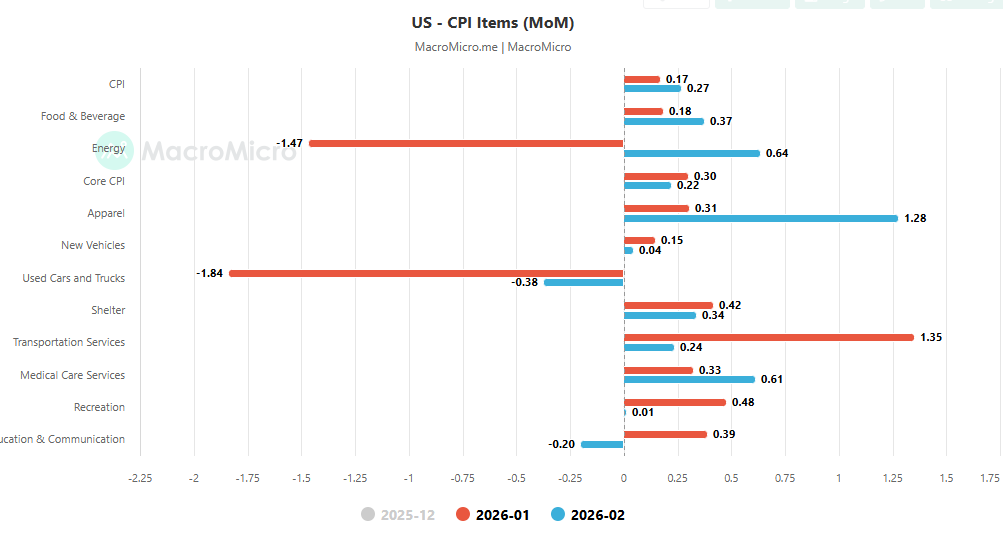
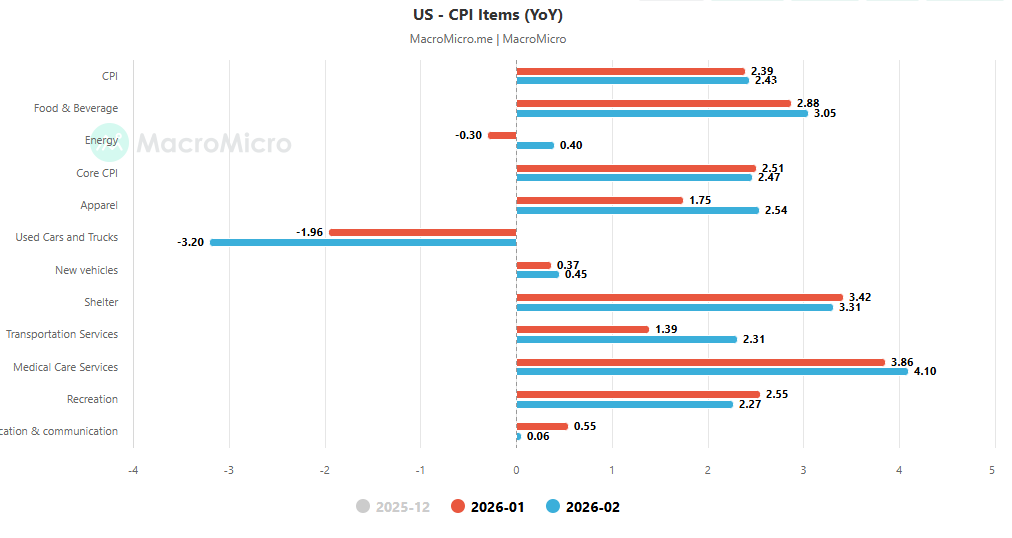
Energy swung from tailwind to headwind at +0.6% m/m the most since Sept and representing a third of the headline increase (gasoline +0.8%, nat gas +3.1%, partially offset by electricity -0.7%), after Jan’s -1.5%. Y/y energy is +0.5% (gasoline -5.6%, but electricity +4.8% and nat gas +10.9%).
Food accelerated to +0.4% from Jan’s +0.2%, which had cooled though from +0.7% in Dec (the most since Aug ‘22), with groceries also +0.4%. Three of the six major grocery store food groups increased:
-fruits & vegetables +1.4%, led by fresh vegetables which posted their largest gain since 2017 with lettuce +12.2% and tomatoes +6.4%,
-nonalcoholic beverages +0.8% including coffee +1.8%, and
-other food at home +0.8% including candy & chewing gum +3.7%),
while falling were dairy -0.6% (cheese -1.2%),
-cereals & bakery products -0.2% (but after Jan’s +1.2%), and
-meats/poultry/fish/eggs were flat (eggs -3.8% m/m, -42.1% y/y).
Dining out also accelerated to +0.3% from +0.1% in Jan (which had cooled from +0.7% in Dec, the most since Oct ‘22), with both full service and limited service each +0.3%. Food y/y is +3.1% (groceries +2.4%, dining out +3.9%, the latter down from +4.0% in Jan which was the most since July ‘24).
Core Goods edged up +0.1% after a flat read in January. Feb’s advance led by apparel jumping +1.3%. Used cars fell -0.4% after -1.8% in Jan, new vehicles and medical goods were flat. Core goods are +1.02% y/y, the least since June.
Core Services decelerated a tenth to +0.3%. Shelter (the largest component of CPI) though held at +0.2% for a second month. OER (owners’ equivalent rent, roughly a quarter of CPI) came in at +0.2% while rent of primary residence slowed to +0.1%, its smallest 1-month increase since January 2021.
Transportation services cooled sharply to +0.2% from Jan’s +1.4% jump (helped by a continued drop in vehicle insurance -0.3% after -0.4% in Jan and airfares retreating to +1.4% after +6.5% in Jan (still +7.1% y/y though). Insurance costs were up just +0.2% y/y, the least since 2021. The improvement in transportation services was despite repair and maintenance costs increasing +0.9%.
Medical care services though accelerated to +0.6% from +0.3% in Jan, as hospital services remained elevated (+0.6% in Feb after +0.9% in Jan and +1.0% in Dec).
Core services are +2.9% y/y, the least since Sept ‘21, shelter +3.0%, the least since Aug ‘21, rent inflation +2.7% the least since Oct ‘21.
Supercore (core services ex-housing), which has been a focus of many FOMC members, decelerated to +0.35% from Jan’s +0.59%, which had been the most in a year (January effect?), with the y/y ticking up modestly to +2.746% from +2.671%, which was the least since Sept ‘21.
“At least going into this energy price shock, inflation does seem to be stabilizing and we are seeing some confirmation that the tariff effect on inflation is fading now,” said Sal Guatieri, senior economist at BMO Capital Markets.
But also keep in mind that missing data on housing-cost increases in October—the result of last year’s government shutdown—are likely keeping shelter readings and all year-over-year inflation readings artificially low. But that downward bias should disappear in the April inflation report, with measured inflation picking up as a result.
https://www.bls.gov/news.release/cpi.toc.htm
Core charts:
Other charts/tables:
To subscribe to these summaries, click below.
To invite others to check it out,