
CPI - Jan 2026
Headline comes in a tenth cool, core in-line with goods inflation tame, "supercore" hotter but core and supercore y/y fall to least since 2021

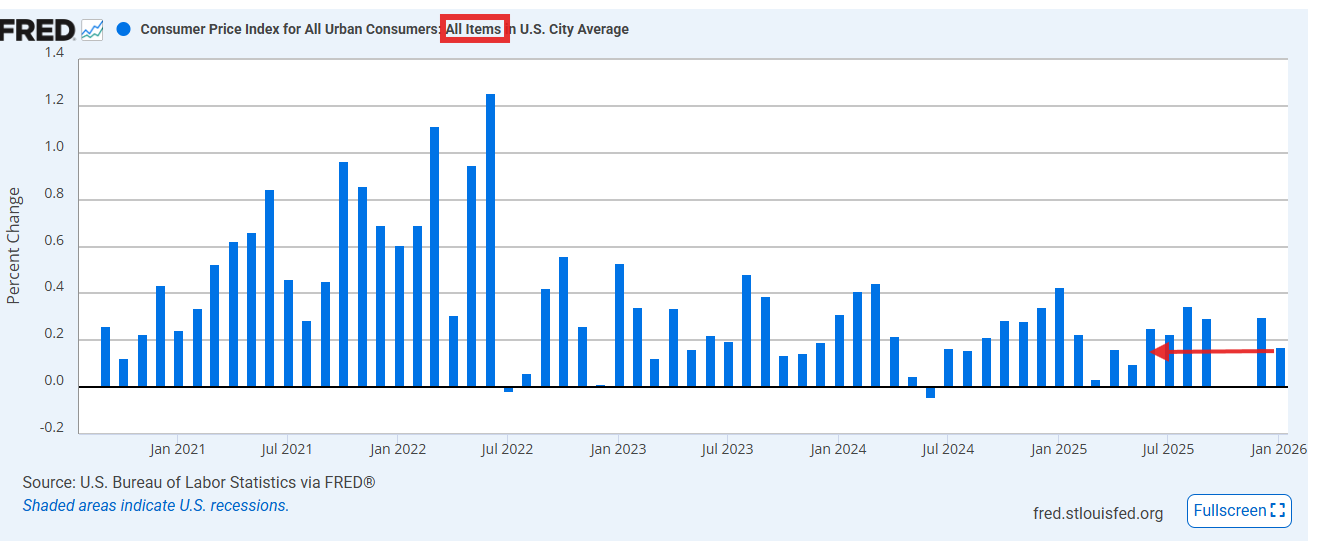
US CPI (M/M): 0.2% (est 0.3%; prev 0.3%)
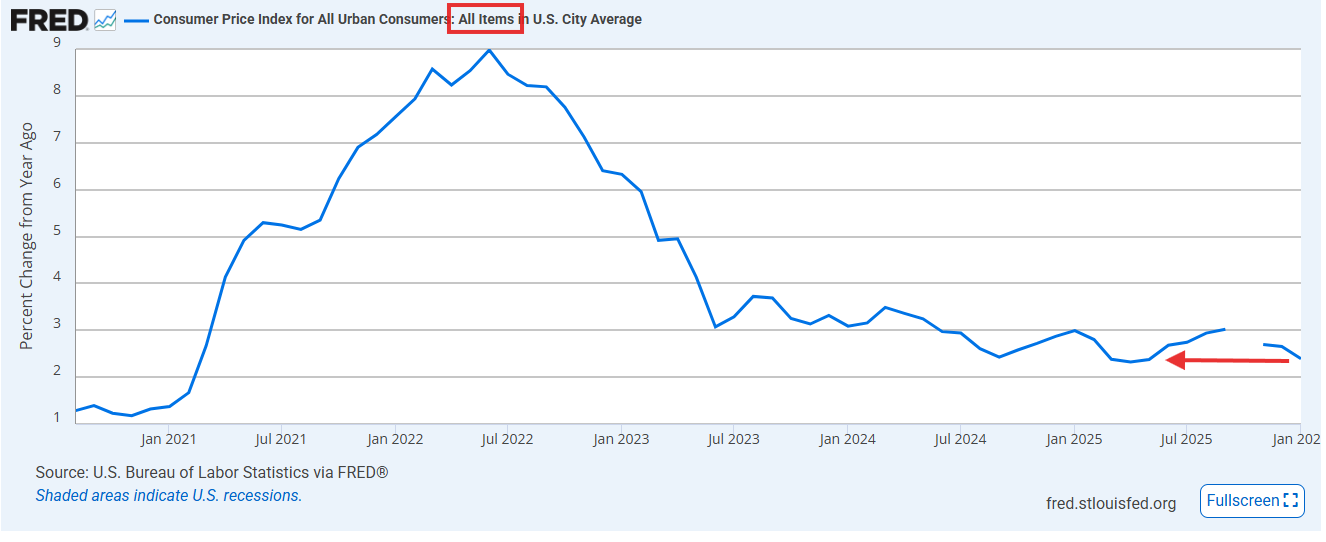
- CPI (Y/Y) Jan: 2.4% (est 2.5%; prev 2.7%)
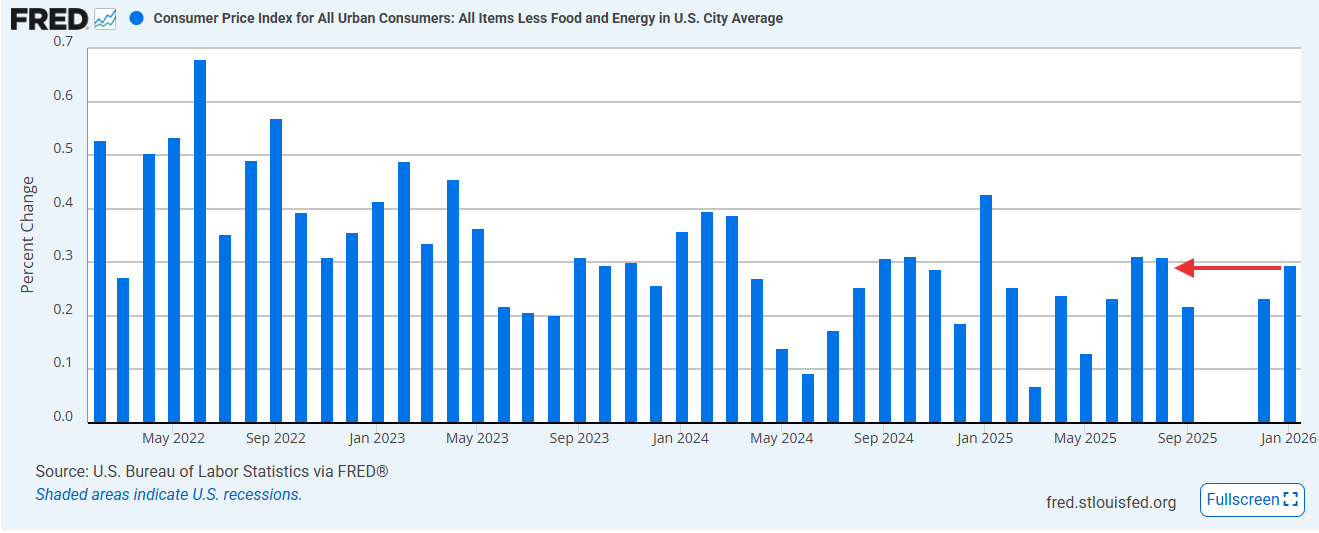
- Core CPI (M/M): 0.3% (est 0.3%; prev 0.2%)
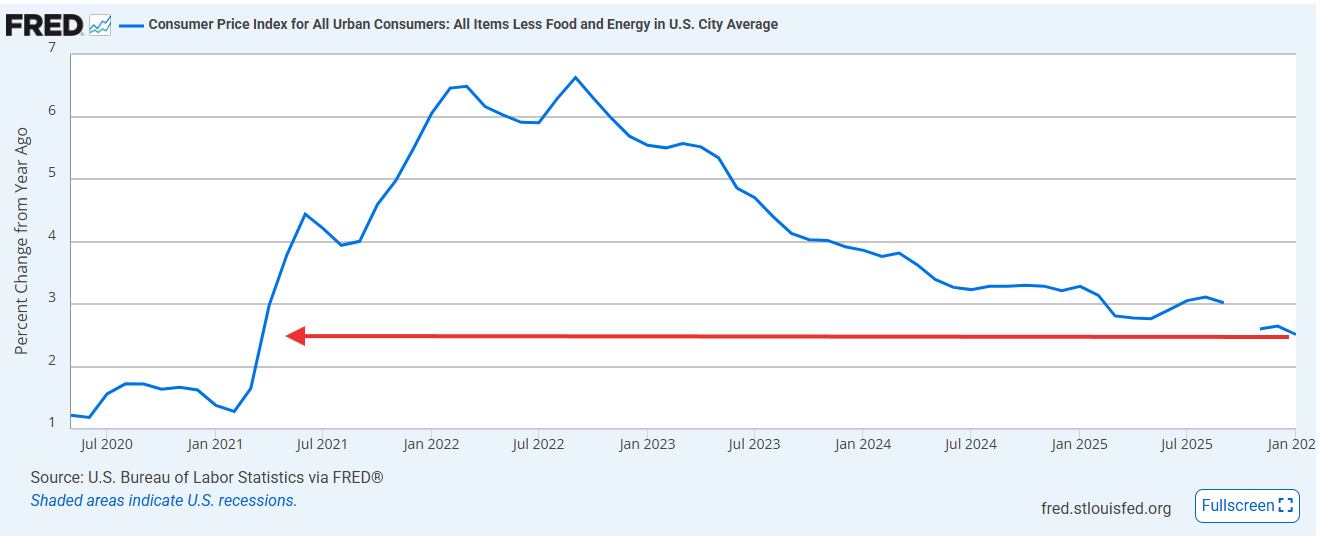
- Core CPI (Y/Y): 2.5% (est 2.5%; prev 2.6%)
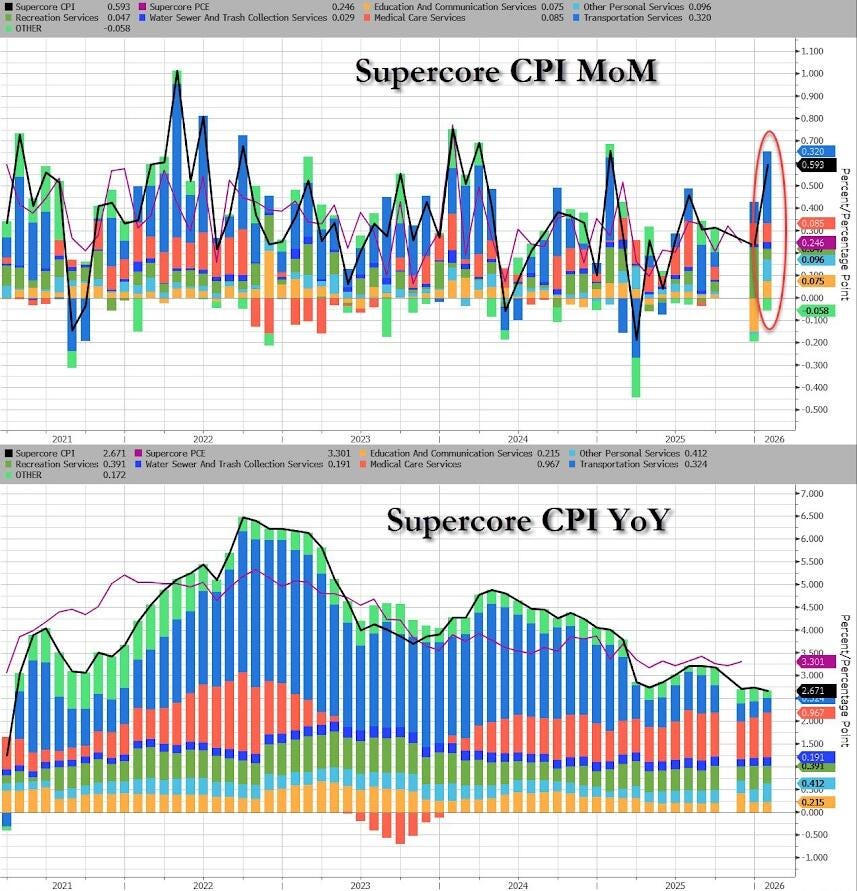
US CPI Supercore (M/M) Jan: 0.593% (prev 0.287%)
- CPI Supercore (Y/Y): 2.671% (prev 2.741%)
Despite fears of “residual seasonality” that would lead to a hot print (as we have often seen in January) US Jan headline CPI comes in cool at +0.2% (+0.17% unrounded (excluding the 0% placeholder for Oct, the least since May), The y/y headline also comes in a tenth light at +2.4% (unrounded +2.39% also the least since May).
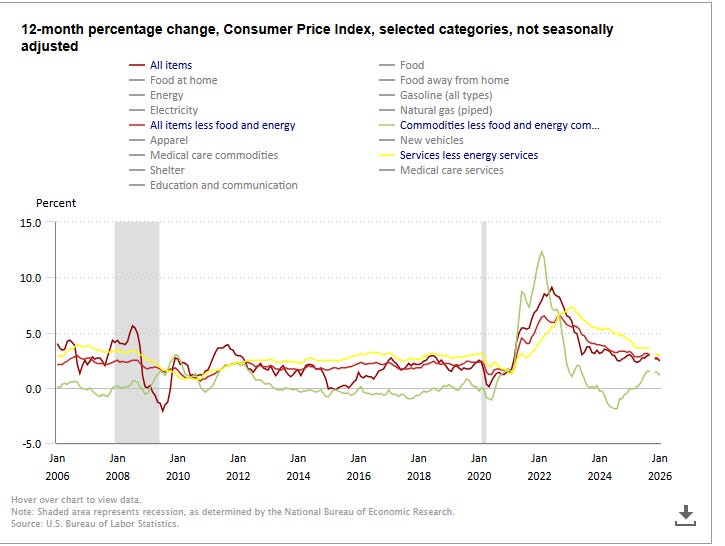
Core though was in-line at +0.3% (+0.295% unrounded, the hottest since Aug, but it hasn’t had a hotter than expected m/m read since 2024) with core y/y also as expected at +2.5% (2.51% unrounded) the least since Mar ‘21.
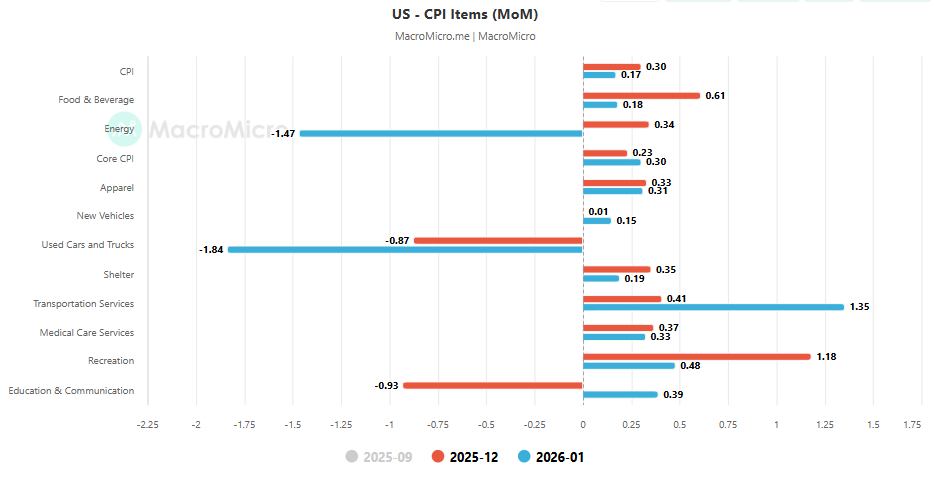
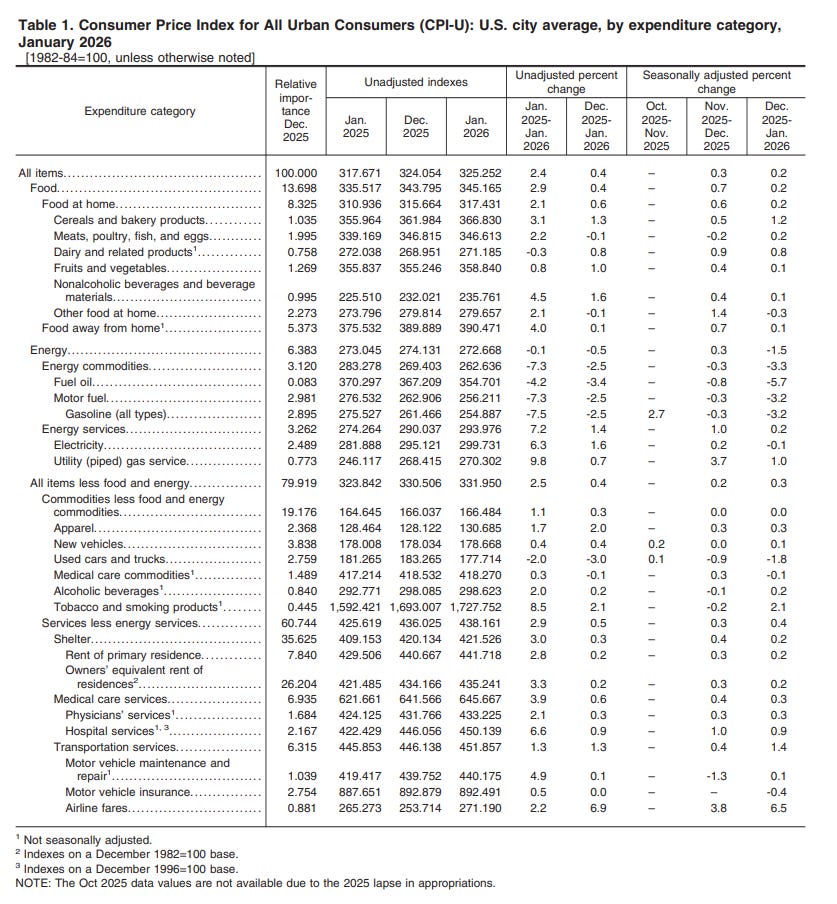
Energy flattered the headline number at -1.5% m/m (led by gasoline -3.2% offset some by nat gas +1.0%), -0.1% y/y (gasoline -7.5%, but electricity +6.3% and nat gas +9.8%).
Food cooled to +0.2% from +0.7%, which was the most since Aug ‘22, with groceries decelerating to +0.2% (as in Dec though five of six major grocery store food groups increased (led by cereal/baked goods +1.2% and dairy +0.8% (dairy also led Dec +0.9%) while just “other” declined), while dining out also cooled, in its case to +0.1% also from +0.7% in Dec, the most since Oct ‘22. Food y/y is +2.9% (groceries +2.1%, dining out +4.0%, down a tenth from the most since July ‘24).
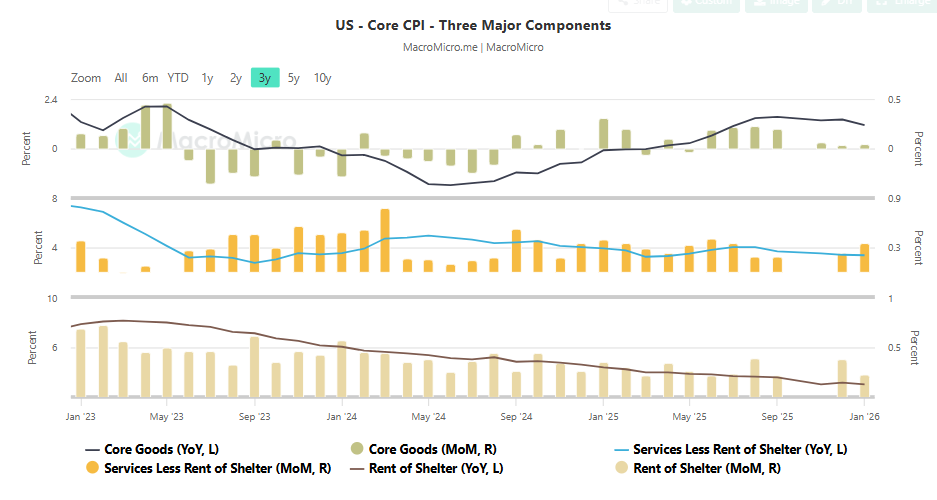
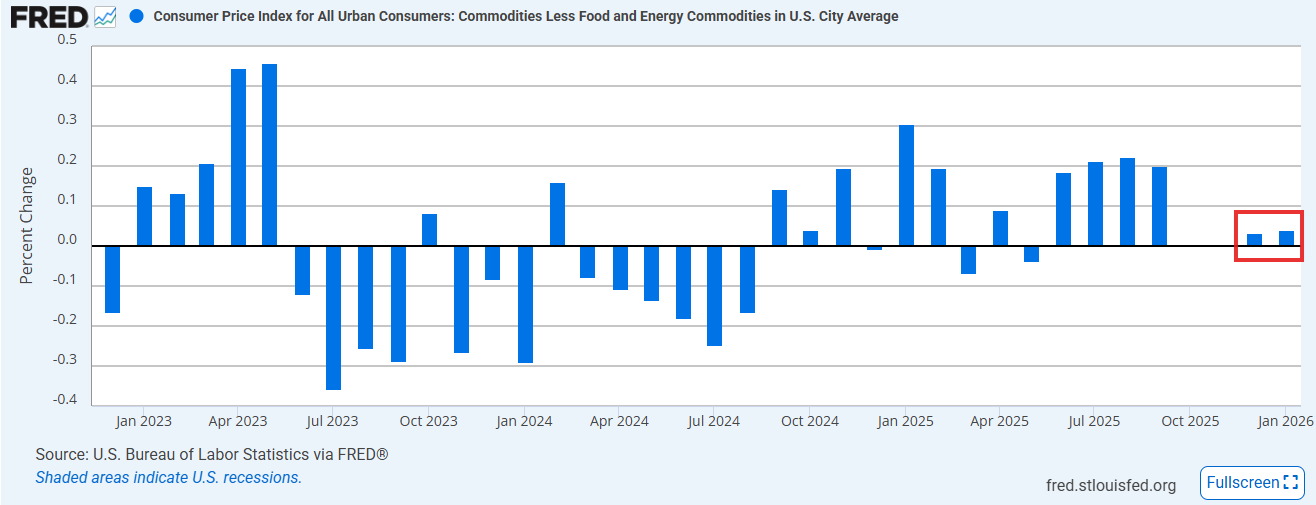
Core Goods which were expected to get a boost from start-of-year price increases, not so much, coming in flat (+0.04% unrounded) after +0.03% in Dec held back by large component used cars dropping -1.8%, medical goods -0.1% while new cars were just +0.1%. That offset apparel +0.3% and a jump in tobacco prices (+2.1%) the latter of which is small weighting (less than a tenth of new and used cars). Core goods are +1.1% y/y.
Core Services though accelerated a tenth to +0.4% even as shelter (the largest component of CPI) halved to +0.2%. That was in part offset by a jump in transportation services +1.4% (led by air fares +6.5% now +2.2% y/y).
Major shelter components OER (owners equivalent rent which is roughly a quarter of CPI) and rent of primary residence both came in at +0.2% (down a tenth from Dec)
Core services are +2.9% y/y, the least since Sept ‘21, shelter +3.0%, the least since Aug ‘21, rent inflation +2.8% the least since Oct ‘21.
Supercore (core services ex-housing), which has been a focus of many FOMC members, though accelerated to +0.593%, the most in a year (January effect?), from +0.287% on the back of the jump in airfares, recreation, education costs, and continued hot hospital services, although the y/y moderated to 2.671%, the the least since Sept ‘21.
https://www.bls.gov/news.release/cpi.toc.htm
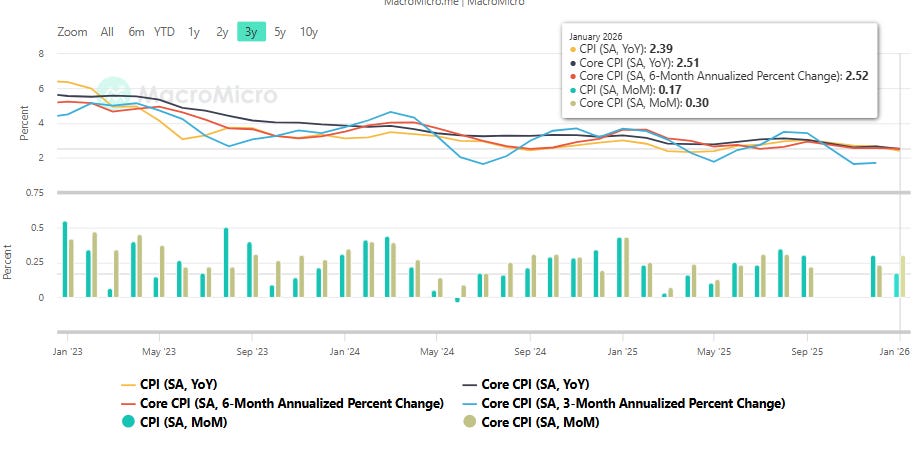
headline charts (2):
core charts (2):
core goods m/m
To subscribe to these summaries, click below.
To invite others to check it out,