CPI - July 2026
July CPI comes in as expected with core y/y slowing to least since March 2021. Real average weekly earnings negative m/m though for fourth month in five, y/y was weakly positive.

US CPI (M/M) Jun: -0.4% (est -0.1%; prev +0.5%)
- CPI (Y/Y): +3.5% (est +3.8%; prev +4.2%)
- Core CPI (M/M): 0.0% (est +0.2%; prev +0.2%)
- Core CPI (Y/Y): +2.6% (est +2.8%; prev +2.9%)
US CPI Supercore (M/M) Jun: -0.20% (prev +0.27%)
- CPI Supercore (Y/Y): +3.17% (prev +3.67%)
Executive Summary
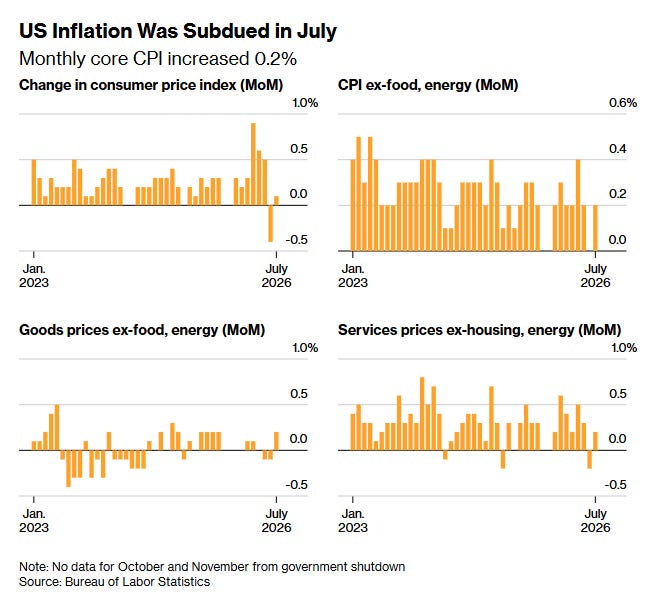
US July headline CPI rose +0.1% from June (m/m, +0.07% to two decimals) after June’s -0.4% decline, with the rate from a year earlier (y/y) easing to +3.4% (+3.37%) from +3.5%, the lowest since March. As rounded all four metrics matched estimates.
Energy fell for a second month at -1.44% (gasoline -2.73%) after June’s -5.71%, taking energy y/y down to +14.73% from +15.70%.
Core CPI rose +0.2% (+0.22%) after June’s -0.01% decline, with core y/y easing to +2.5% (+2.48%) — the slowest pace since March 2021.
Shelter rose just +0.14% but still accounted for roughly two-thirds of the entire monthly all-items increase. Underneath, though owners’ equivalent rent and rent of primary residence both re-accelerated to +0.26%, though shelter y/y kept easing to +3.18%.
Core Goods flipped positive at +0.20%, the largest increase since August, after two consecutive declines, driven in part by computers, peripherals, and smart home assistants +3.52% m/m, the second most on record. Core goods y/y remains weak though at +0.81%.
Core Services rose +0.23% (from +0.03%), largely on June’s one-off drags reversing: medical care services swung to +0.56% from -0.12%, motor vehicle insurance fell just -0.27% after June’s -2.01%, and airfares snapped back +2.11%.
Supercore (core services ex-shelter) fell to +2.78% y/y, the lowest since September 2021, though it turned positive on the month at +0.19%. A similar metric (core services ex-housing) was +2.84% a little above the lows of the year.
Real average weekly earnings fell -0.02% m/m, the fourth decline in five months, leaving the y/y just modestly positive at +0.15%.
Markets took it calmly: pricing for a September hike fell to 42% from 50% pre-print, with a 74% chance of a hike this year (from 79%); the 10-year eased to around 4.66% and stock futures hit session highs.