
Dec JOLTS
Job openings fall to least since Sep 2020 and layoffs moved higher but so did hires and quits the last three remaining in their recent ranges.

Numbers reported are m/m unless otherwise indicated. Also as most people report on these seasonally adjusted, I do as well, but note that can cause issues with seasonal distortions. The note goes through openings, then hires, then quits, then layoffs.
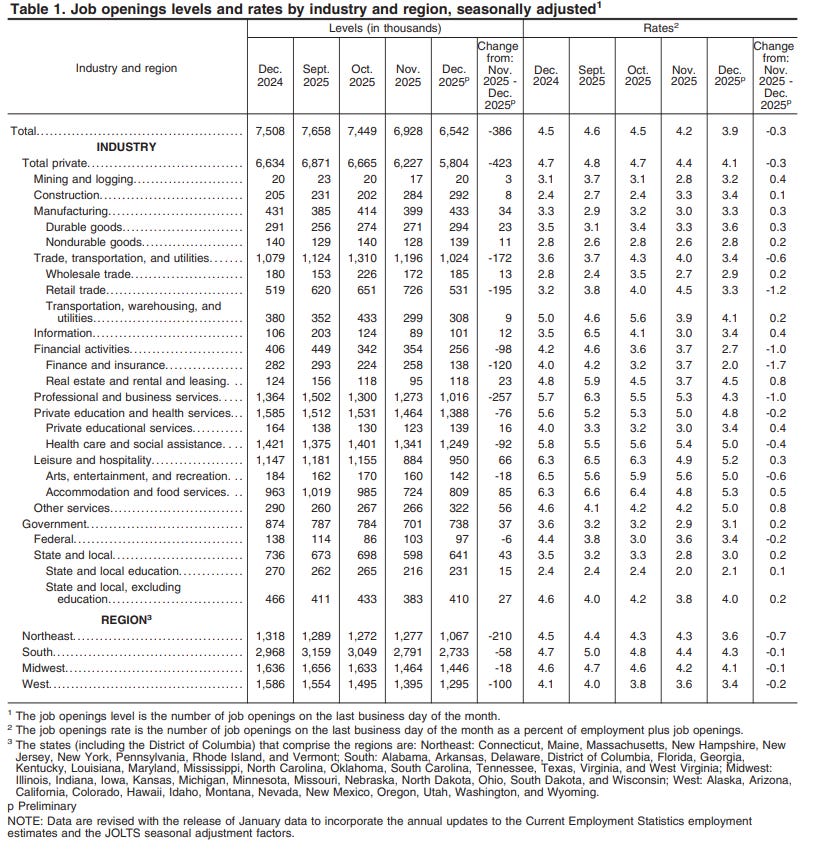
US JOLTS Job Openings Dec: 6.542M (est 7.250M; prev 7.146M; prev R 6.928M)
- Job Openings Rate: 3.9% (prev 4.3%; prev R 4.2%)
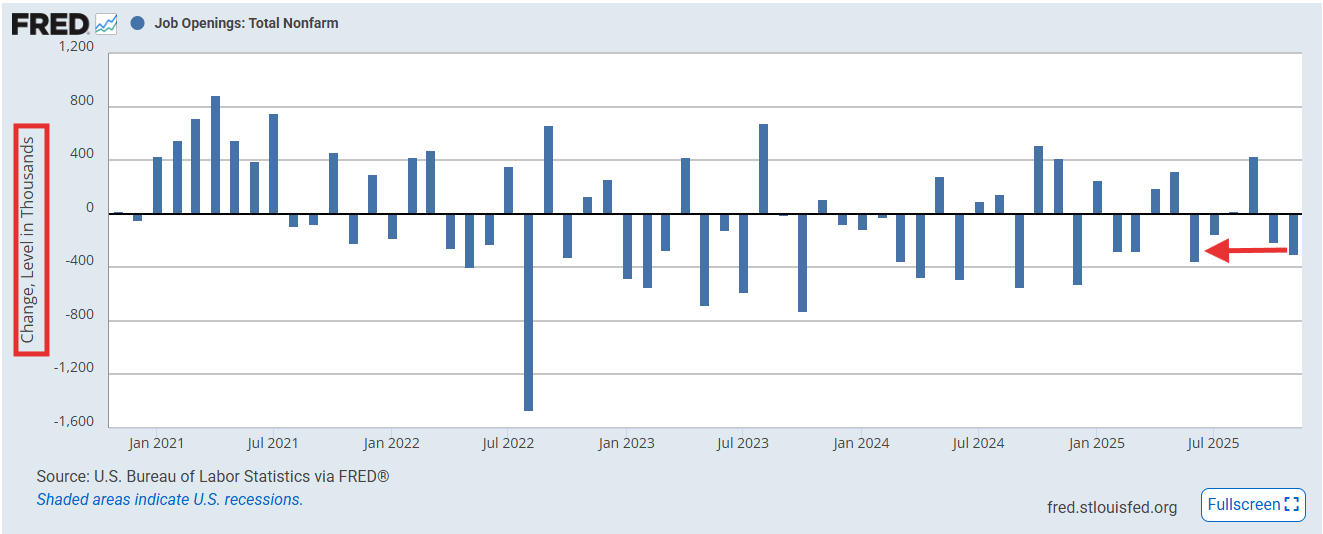
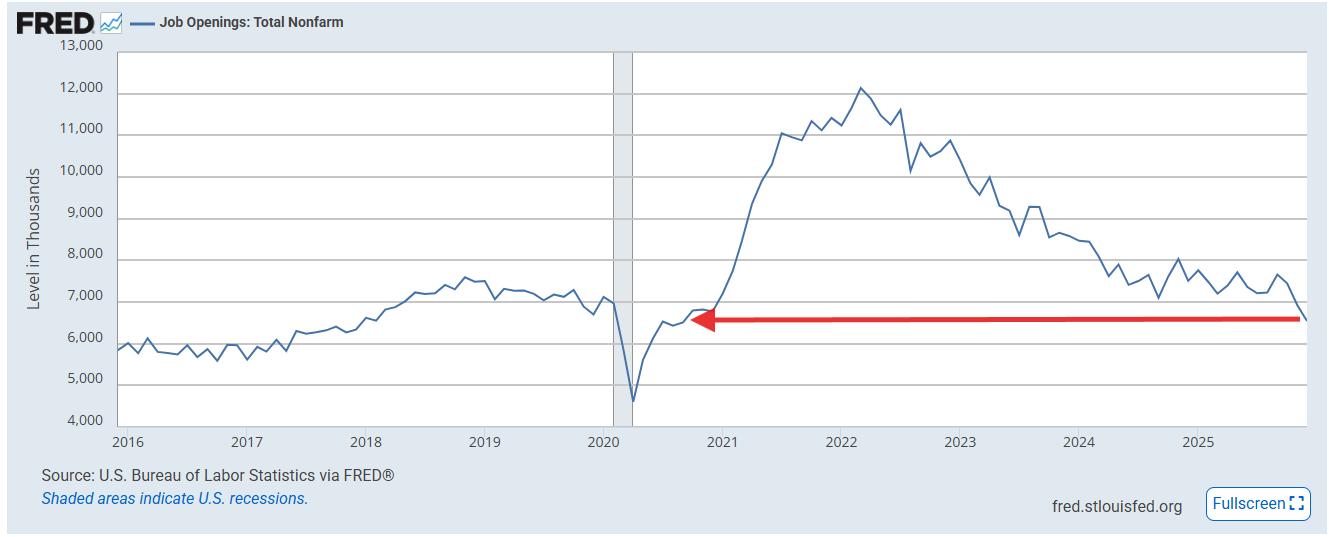
Dec JOLTS report sees job openings (SA) drop -386k (after a -218k revision to Nov), the largest drop since June, (and second largest of 2025), taking the index to 6.9286mn, the least since Sep 2020, well below estimates for 7.250mn. The peak in Mar ‘22 was 12.2mb. The level Jan 2020 was 7.124mn (so we are now -580k below).
The drop was led by prof/biz services -257, retail trade -195k (after leading in Nov), finance -120k, and health care (-92k), the last of which we saw in the Jan Challenger data having the most job cuts since Apr 2020.
On the positive side accommodation/food services was +80k (after though dropping -261k in Nov), and manufacturing (+34k) and construction (+8k) both saw gains. Government was +37k led by state/local +34k (federal -6k).
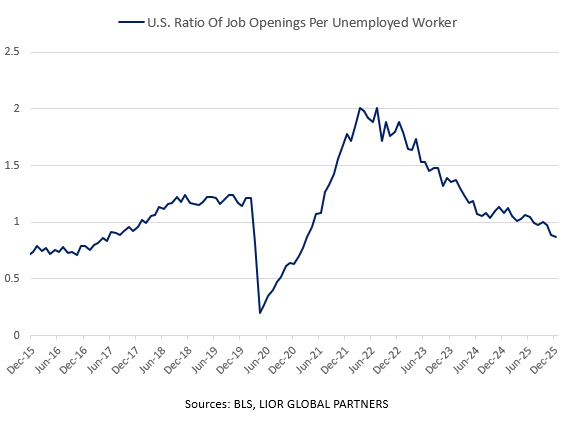
Ratio of openings to employment fell back to 3.9% from 4.2% while the ratio of openings to unemployed workers (chart) dropped to just 0.87, the least since Mar ‘21. At its peak it was 2. It was 1.21 Jan 2020.
https://www.bls.gov/news.release/pdf/jolts.pdf
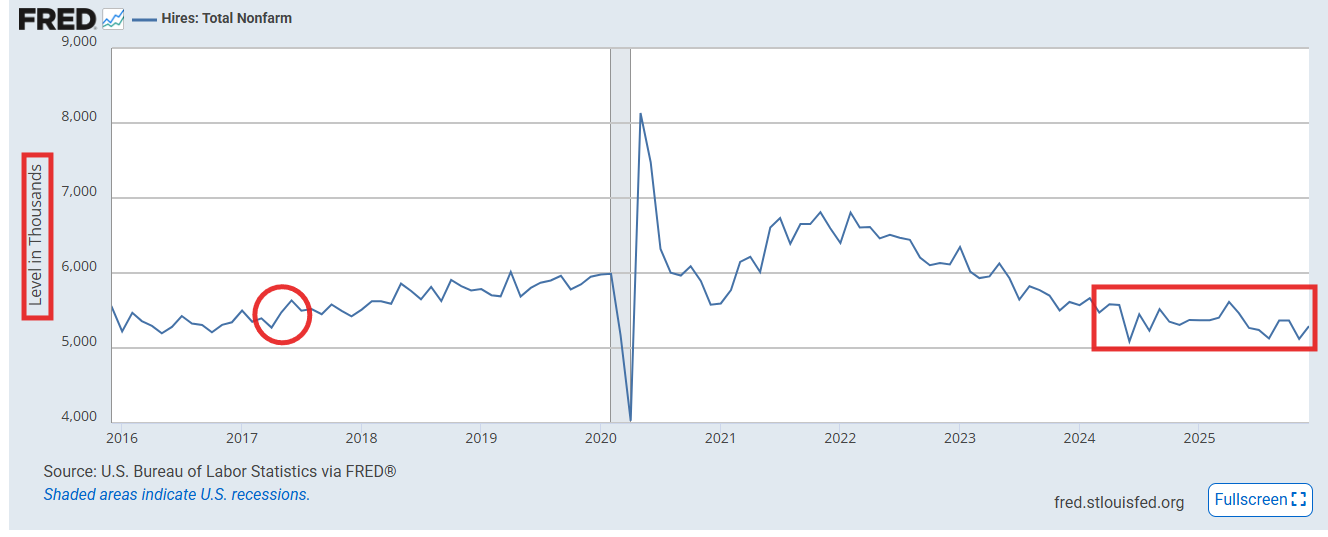
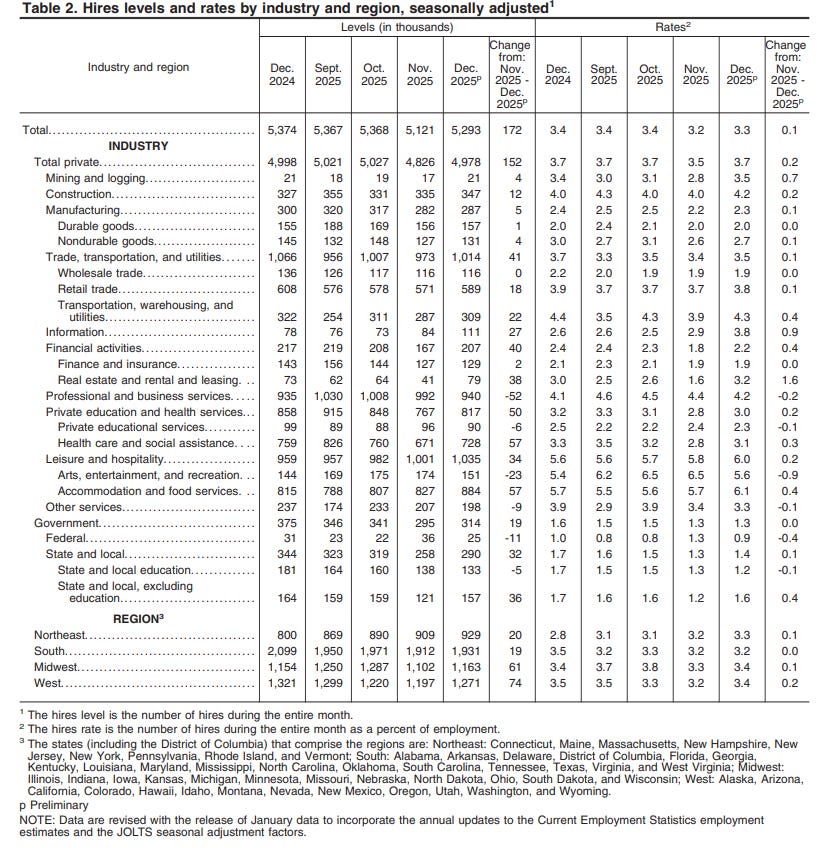
JOLTS hires though rebounded +172k after -247k in Nov (which was the biggest decline since June ‘24), which left the total at 5.293mn, in the middle of its range since May ‘23 (but pre-pandemic they haven’t been this low since Apr 2017 (circle)). Hires are now around -700k below Feb ‘20 levels (6.0mn)).
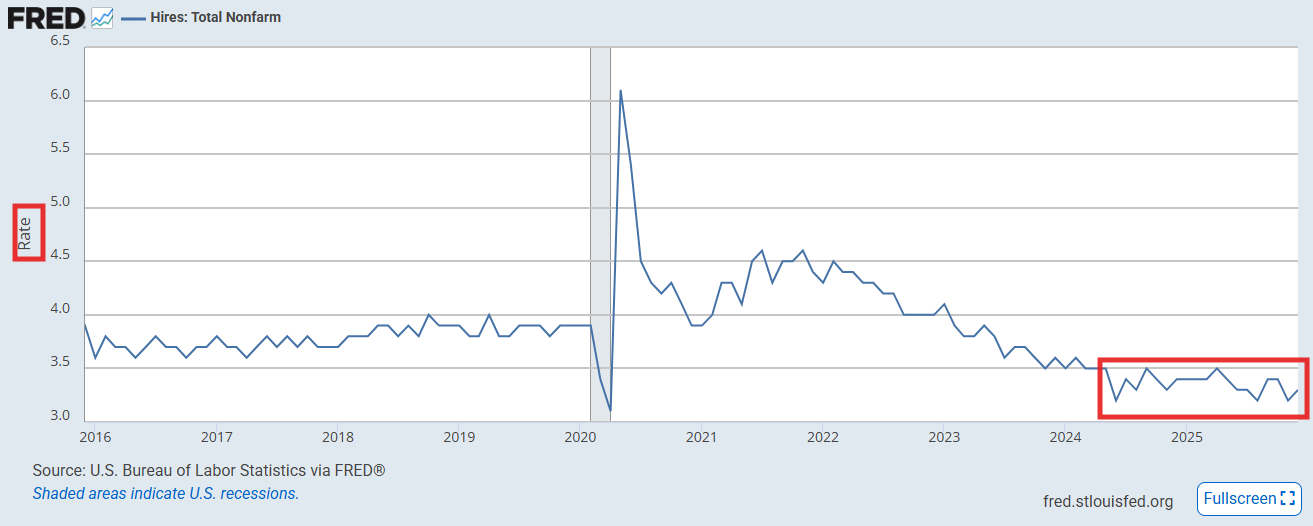
The hiring rate also improved a tenth to 3.3% from the joint lowest since April ‘20 (and pre-pandemic the least since Mar ‘13).
Hiring led by health care/social assistance and accommodation/food services (both +57k). But only four categories saw declines led by prof/biz services (which also led the drop in job openings) -52k, arts/entertainment, “other” services and federal government.
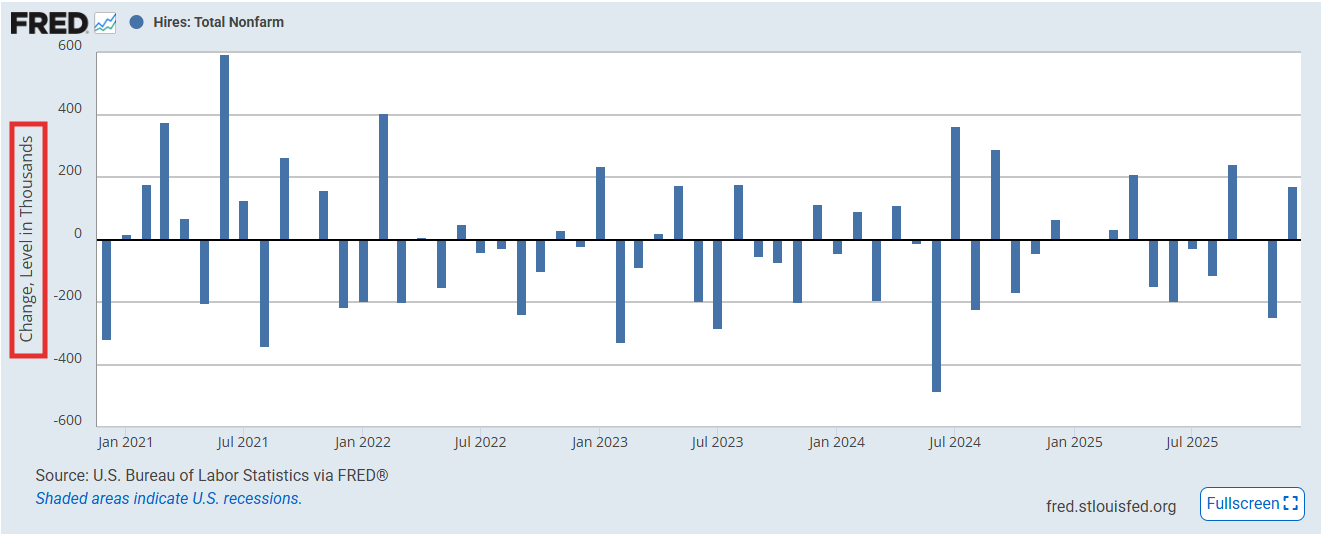
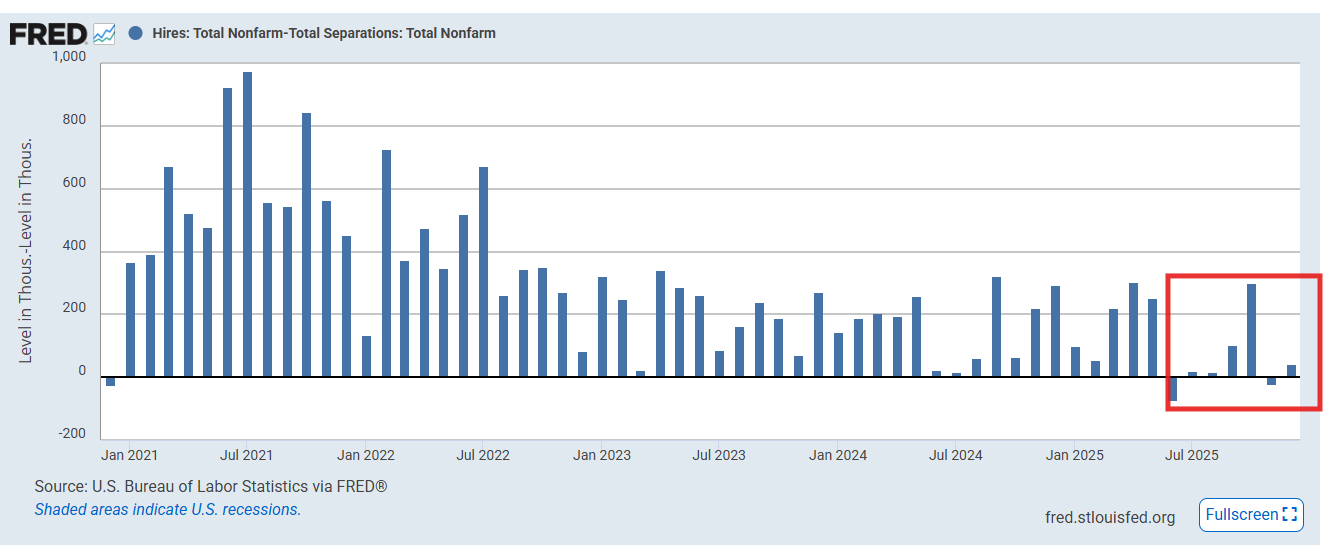
With separations coming in at 5.25k, net hires-separations turned back positive +42k, after being revised to a -23k drop (from +11k) in Nov. Outside of Oct (when it was +29k, the highest since Apr), this was the highest read since May.
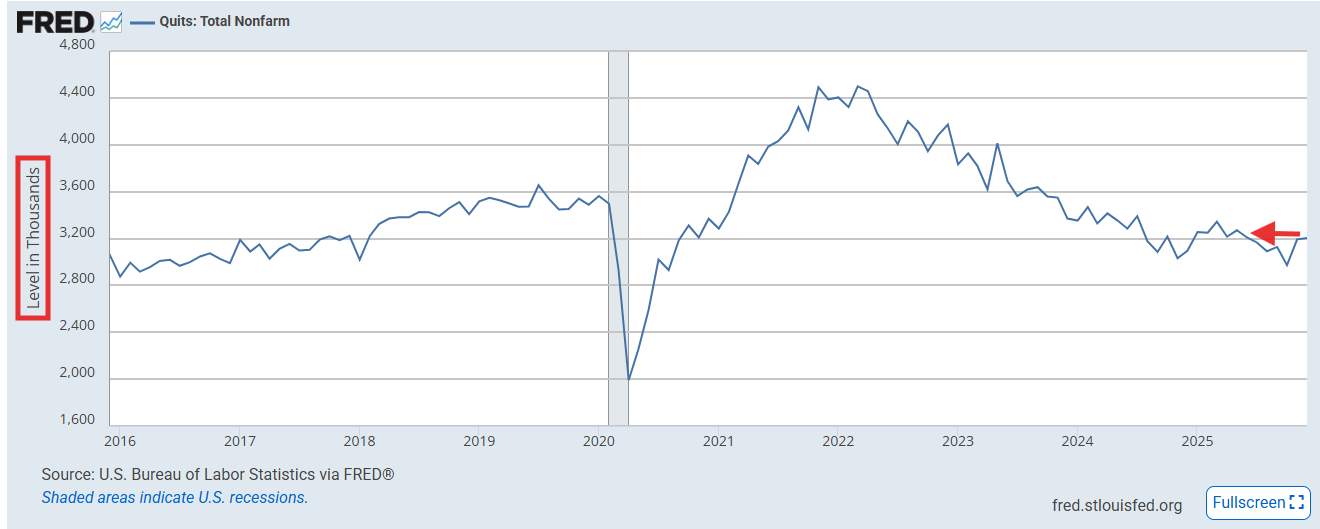
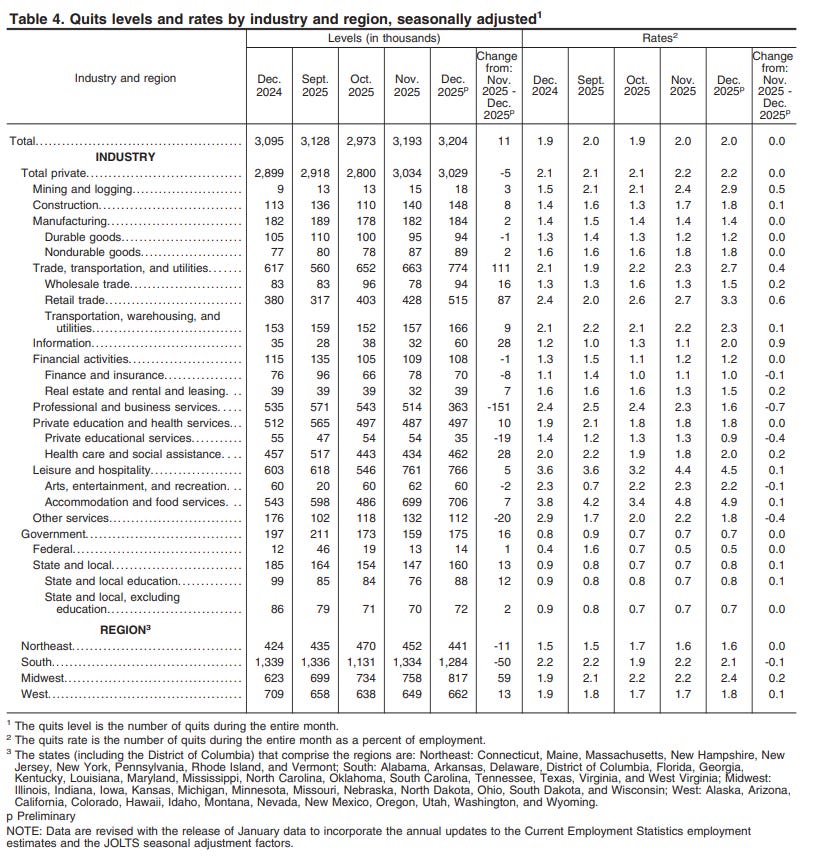
Quits Level: 3.204M (est 3.102M; prev 3.161M; prev R 3.193M)
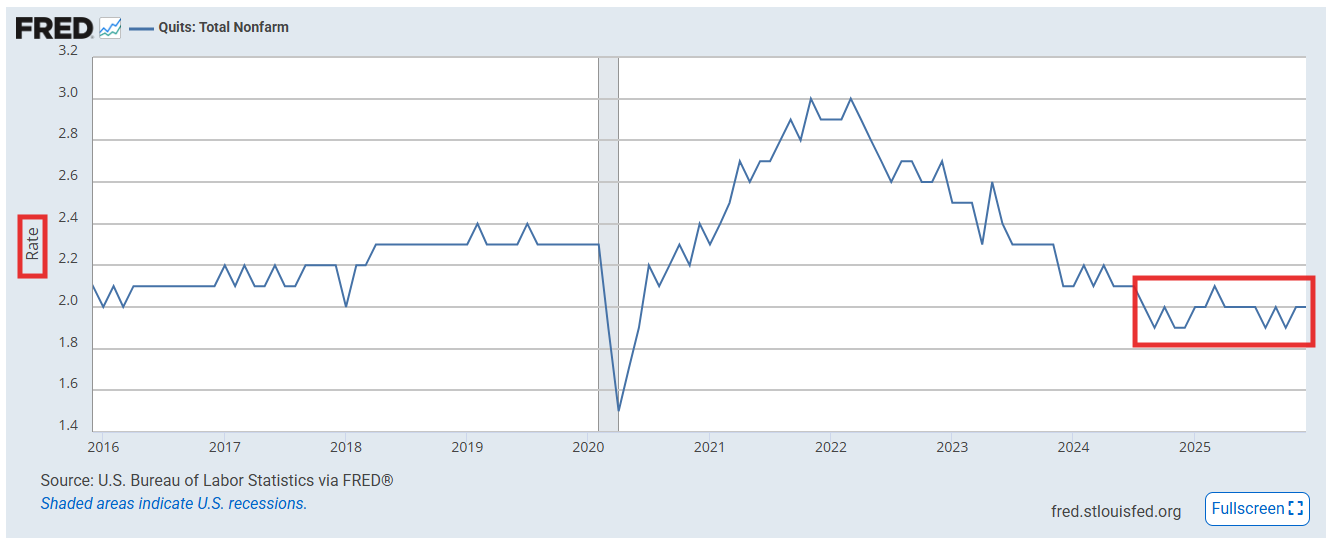
- Quits Rate: 2.0% (prev 2.0%)
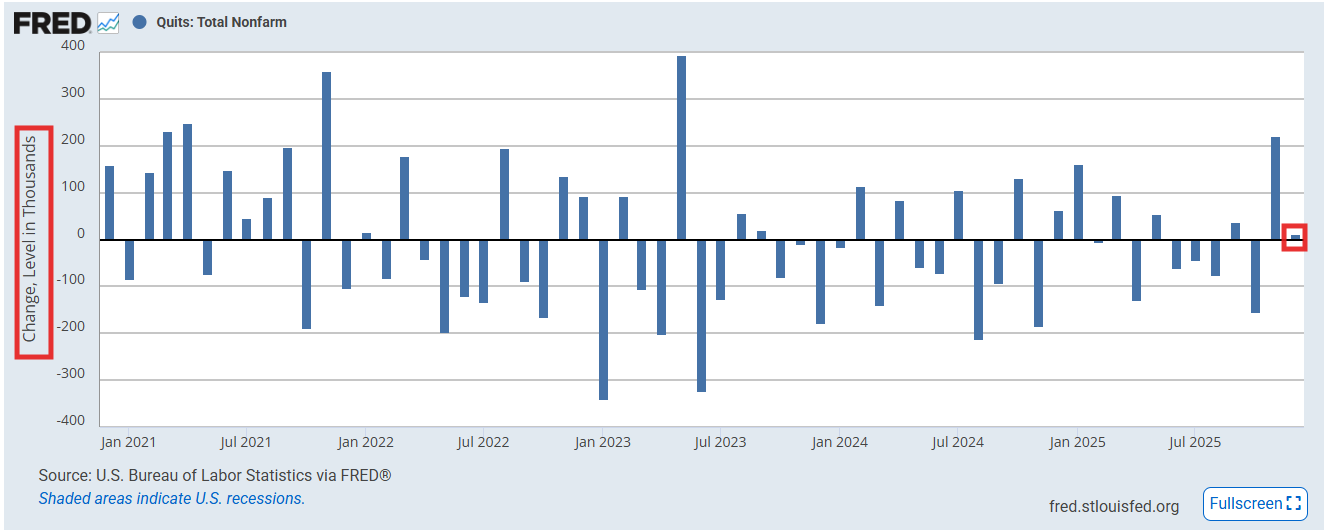
JOLTS quits (considered another measure of labor market tightness (people don’t quit their job unless they are confident they can find another one (or don’t need one)) did improve but just +11k (after +220k in Nov, the biggest jump since May ‘23) to 3.193mn, still the highest since July, after in Oct hitting the least since Aug ‘20 (and before the pandemic March ‘16). Dec is still -370k below Jan ‘20 levels (3.57mn).
The quits rate remained 2.0%, still four tenths below the Jan ‘20 level. The prepandemic average was 2.3%.
Retail trade +87k led the increase. Next highest was IT +28k. Like openings and hires, prof/biz services easily led to the downside -151k.
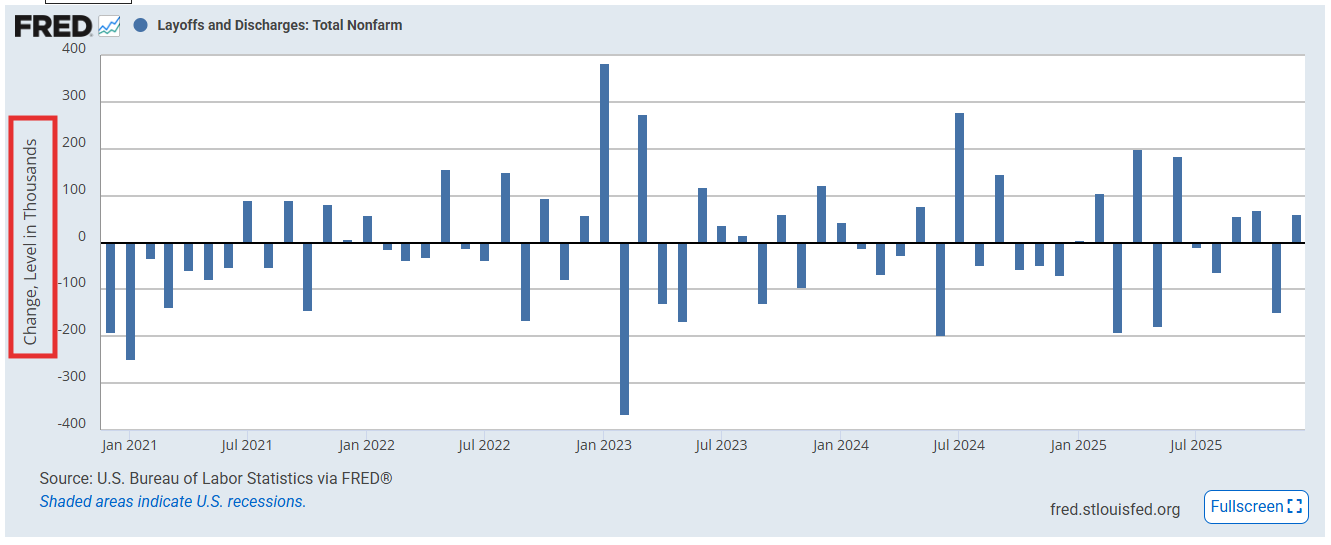
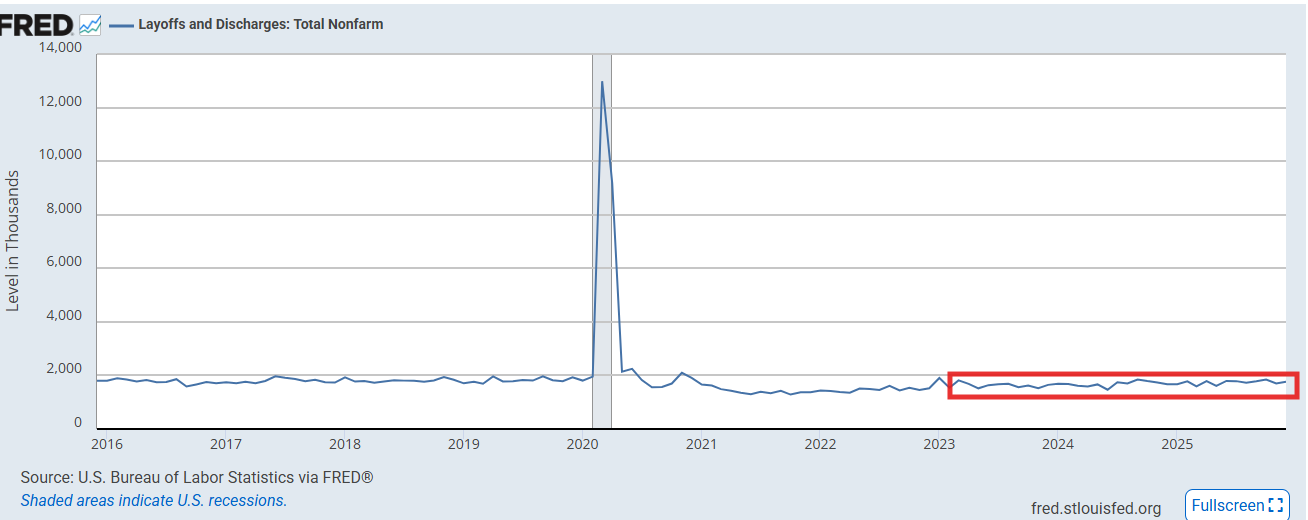
Layoffs Level: 1.762M (est 1.732M; prev 1.687M; prev R 1.701M)
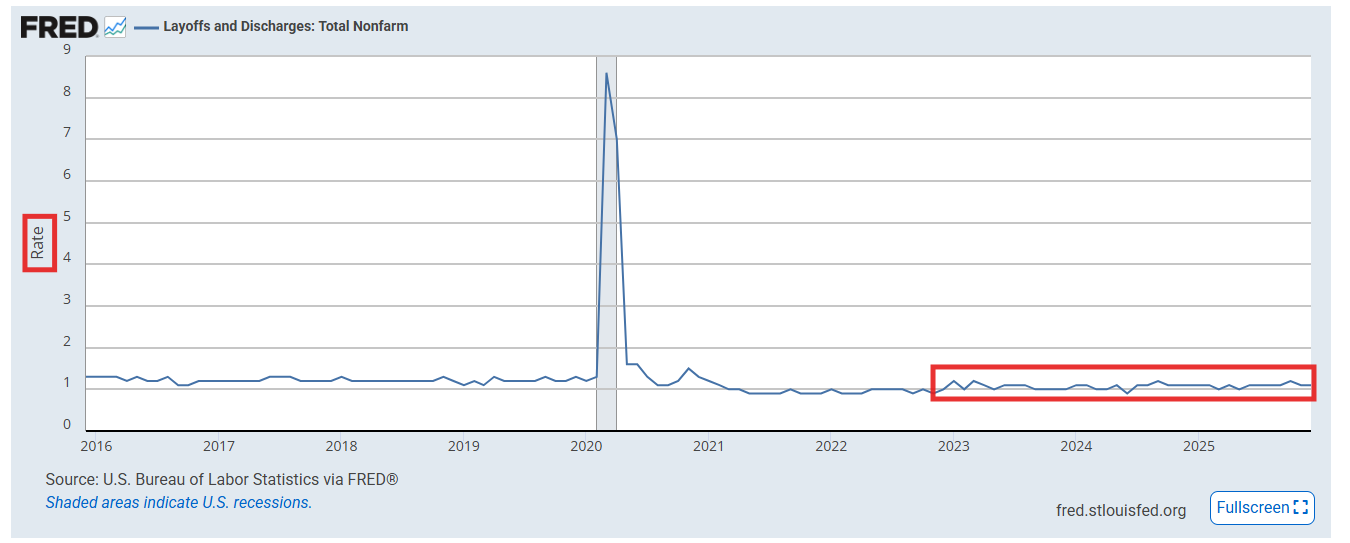
- Layoffs Rate: 1.1% (prev 1.1%)
Layoffs overall remained a positive from the JOLTS report. While they did increase +61k to 1.762mn (after a +14k revision to Nov) they remain in its narrow range of 1.5 to 1.9mn, and are nearly -200k below Feb ‘20 levels (1.95mn).
Layoffs were led by transportation/warehouse/utilities +103k. Next highest was accommodation/food services +27k While prof/biz services led in drops in openings, quits, and hires it also saw the biggest drop in layoffs -53k.
The layoff rate remained at 1.1%, two tenths above its record low and a tenth below the rate Jan ‘20, so again these remain a little below pre-pandemic levels.
https://www.bls.gov/news.release/pdf/jolts.pdf
To subscribe to these summaries, click below.
To invite others to check it out,