

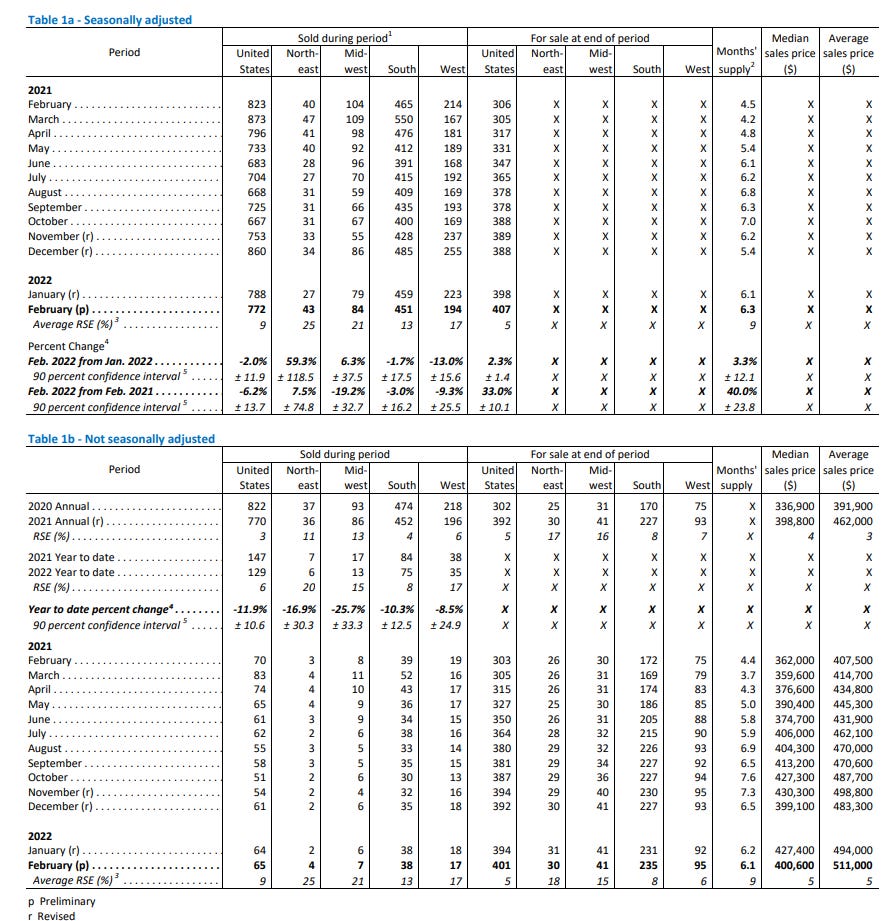
February New Home Sales: -2.0% M/M to 772K vs. 810K expected and 788K prior (revised from 801K)
February New Home Sales: -2.0% M/M to 772K vs. 810K expected and 788K prior (revised from 801K)
New home sales down for a second month but remain very strong historically with a lack of inventory the biggest issue

February New Home Sales: -2.0% M/M to 772K vs. 810K expected and 788K prior (revised from 801K)
- Median sales price of new houses sold in February was $400.6K, down from $423.3K in January
Microsoft Word - newressales_auto_text.docx (census.gov)

Going to give a quick summary and then provide a link to Bill McBride’s really excellent report that goes into more detail with lots of great charts.
After a falling back in January following a very strong December, February new home sales fell back a little further -2.0% m/m to 772k, missing estimates for 810k. December was revised up to 860k.
Y/y down not as much as we’ve seen recently (-6.6%) as February last year was impacted by the winter storms. And we continue to remain well above 2019 levels.
Median prices, which had fallen sharply in December to $399.1k (revised up from $377.7k), and moved strongly higher to a near record high in January at $427.4k (record is $430.3k in October), fell back again to $400.6k. Average selling price though increased to a new record high of $511k.
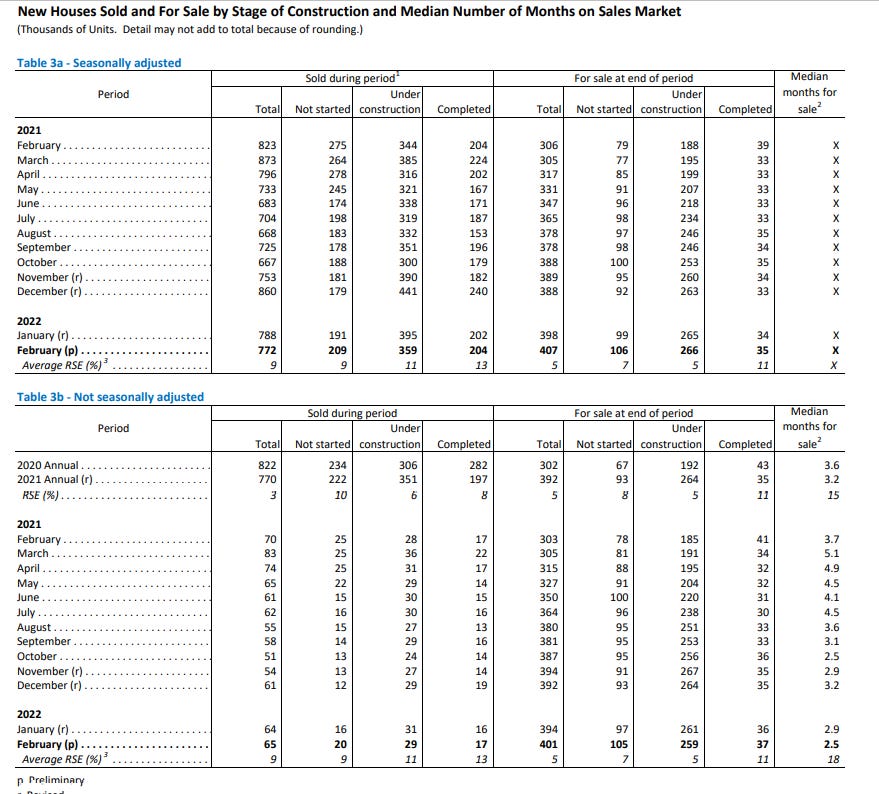
Inventories increased a little (to 407k from 398k (January was revised lower)) and with the lower sales, months of supply increased to to 6.3 months (up from 6.1 months). This is up from the all time low of 3.5 months in October 2020, and is at the high end of the "normal" range of 4-6 months, but the makeup of that inventory remains an issue as Bill details in the linked piece. In summary, there remains a wide separation between supply of homes that have been completed (near record lows) versus supply not yet started (near record highs) or under construction (well above normal levels). So while there are a normal amount of homes "for sale" there's a very low number that actually exist today, which indicates a continuing backlog of homes for homebuilders to work through.

Regionally, a lot of dispersion this month as is typical with a big jump in the NE (+59.3%), smaller increase in MW (6.3%), and drops in the South (-1.7%) and West (-13.0%). Y/y NE is up and the other regions down. Full table below.
Here is the link to Bill’s report.
To see more content, including summaries of most major U.S. economic reports and my morning and nightly updates go to Neil’s Newsletter | Neil Sethi | Substack for newer posts or https://sethiassociates.blogspot.com for the full history.
Thanks for Bill McBride link.