
Markets Update - 11/25/25
Update on US equity and bond markets, US economic reports, the Fed, and select commodities with charts!

To subscribe to these summaries, click below (it’s free!).
To invite others to check it out (sharing is caring!),
Link to posts - Neil Sethi (@neilksethi) / X
Note: links are to outside sources like Bloomberg, CNBC, etc., unless it specifically says they’re to the blog. Also please note that I do often add to or tweak items after first publishing, so it’s always safest to read it from the website where it will have any updates.
Finally, if you see an error (a chart or text wasn’t updated, etc.), PLEASE put a note in the comments section so I can fix it.
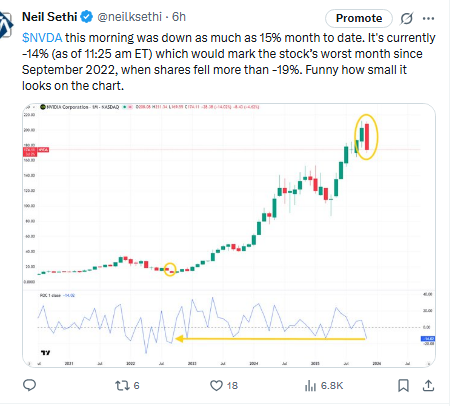
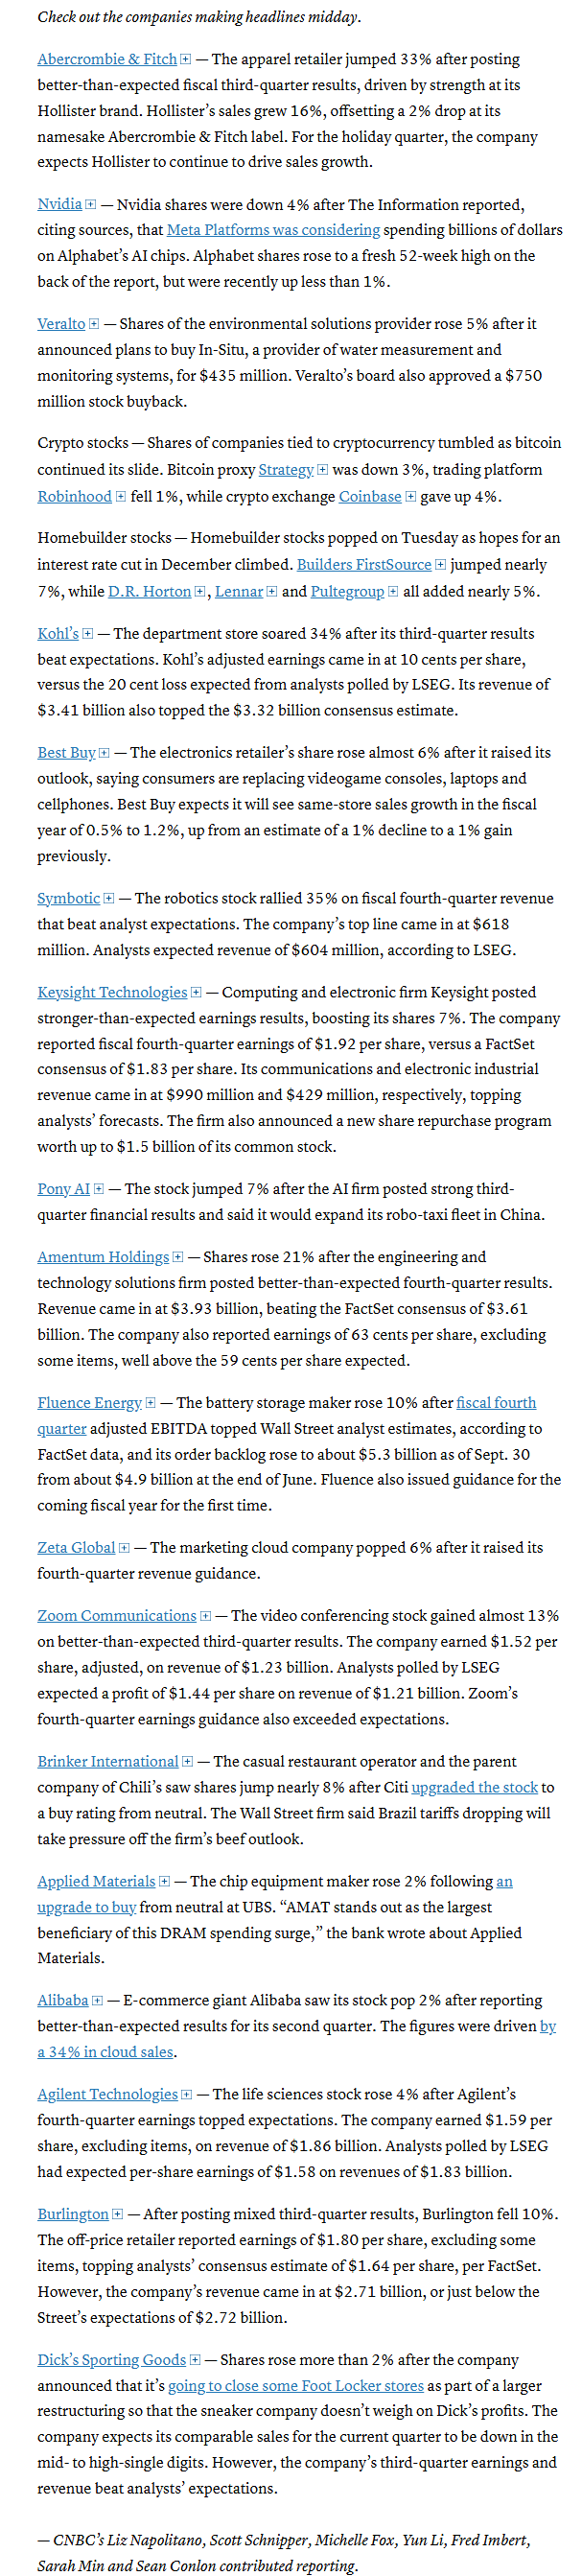
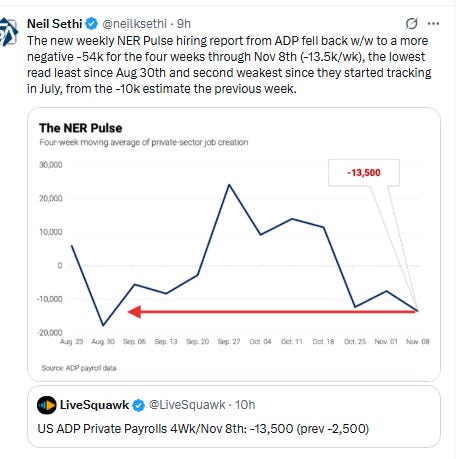
US equity indices opened mixed but with modest changes following the release of delayed reports showing weaker than expected Sept retail sales and an in-line Sept PPI print (but with core cooler than expected). Also the weekly ADP employment update showed an increase in job losses. Meanwhile the large cap indices were being pulled in different directions by some of the largest components. Nvidia shares were down more than 4% premarket after The Information reported that Meta Platforms was considering spending billions of dollars on Alphabet’s AI chips (NVDA shares ended -2.6%). Advanced Micro Devices Inc. slipped 6% (ended the day -4.2%). Alphabet shares in contrast were up more than 4% on the back of the report (ended the day +1.5%).
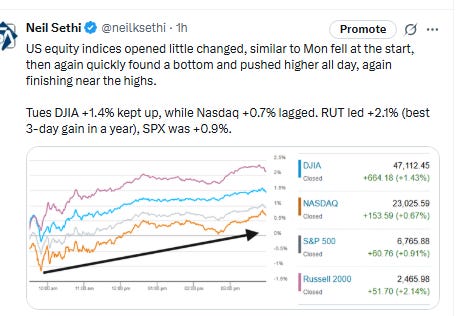
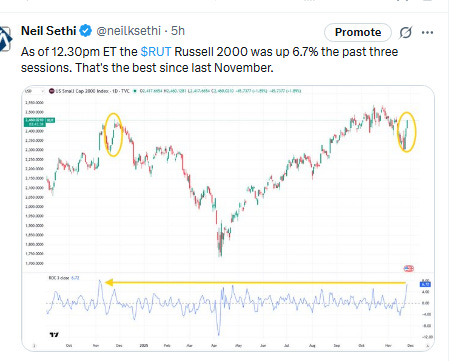
Similar to Monday, the indices fell just after the open, but also like Monday quickly found a bottom in the first 30 minutes and from there pushed higher all day, again finishing near the highs. In contrast to Monday, though, today the DJIA +1.4% kept up, while Nasdaq +0.7% lagged. The small cap Russell 2000 led +2.1% capping its best 3-day gain in a year, while SPX ended +0.9% but the equal-weight version was +1.5%.
Elsewhere, Treasury yields fell back again, and the dollar did as well. Gold though was higher again joined by copper, while crude, natgas, and bitcoin were lower.
The market-cap weighted S&P 500 (SPX) was +0.9%, the equal weighted S&P 500 index (SPXEW) +1.5%, Nasdaq Composite +0.7% (and the top 100 Nasdaq stocks (NDX) +0.6%), the SOXX semiconductor index +0.2%, and the Russell 2000 (RUT) +2.1%.
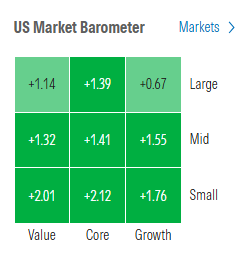
Morningstar style box shows widespread gains for a third session but more evenly distributed with large growth the relative underperformer.
Market commentary:
“You saw a lot of that washout, and it really started at the end of October as we had some liquidity that came out of out of the market,” Abby Yoder, U.S. equity strategist at JPMorgan Private Bank, said Monday on CNBC’s “Closing Bell” referring to the recent pullback. “But within this technical-driven move in terms of the AI and tech-related names, you still had this really solid fundamental backdrop in terms of the AI story and the AI spending story,” Yoder continued. “Now, I think going forward, it sets up nicely as we head into the end of the year, but I think there’s going to be a little bit more of a discerning eye.”
“Nvidia shares have come under pressure this morning on reports of increased competition in AI chips, a development likely to add to an already shaky risk backdrop. More competition naturally raises questions about the company’s future profitability, as it implies reduced pricing power. There may appear to be limitless demand for chips, but at some point, that demand will meet its limit.” ——Skylar Montgomery Koning, BBG macro strategist
“Nvidia is the biggest position in my portfolio and I am not worried at all by a 3% dip,” said Fares Hendi, global fund manager at Prevoir Asset Management in Paris. “It’s healthy that in a functioning market economy Google goes into this market, it just shows its vast potential.”
“As compute becomes cheaper, will that increase consumption? Yes, it likely will increase consumption and demand for it. We’re seeing that play out, I think, in real time with Meta buying chips from Google,” Ron Albahary, LNW’s chief investment office told CNBC. “I think that bodes well for the broader AI space.”
“What I’m more concerned about, or thinking about, is the second-order effects on the broader players like Microsoft and Amazon,” Albahary added. “Is this a moment in which you might see a change in leadership from the Nvidia’s of the world?”While AI stocks have seen tumultuous trading over recent days, Roth senior analyst Rohit Kulkarni said the sector should have more room to grow. He said 2026 could be the year when AI starts a multiyear growth period. “Recent market jitters have come from rising skepticism about AI’s long-term potential and renewed worry that the massive investments of the past year may not generate sufficient returns,” he wrote to clients in a Tuesday note. “But reading through the tea leaves, we see more evidence supporting the opposite view: the fundamental signals point to AI innovation not having hit its ceiling, and underlying economic drivers continue to trend in the right direction.” Kulkarni said Alphabet’s strong Gemini 3 model should lead to major breakthroughs in models tied to Nvidia’s Blackwell chips. He said building constraints provide a “stabilizing force” for the industry and stretch out the cycle, while hyperscalers are seeing better returns on invested capital.
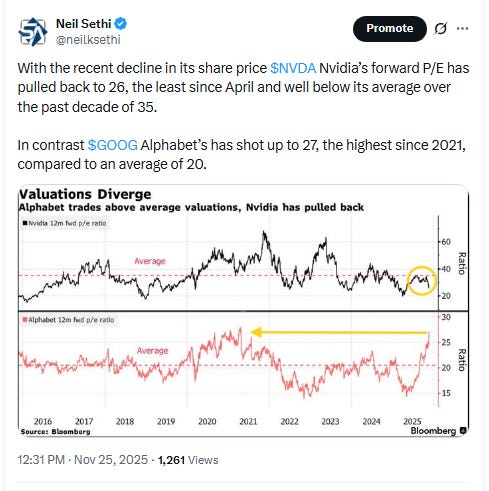
While shares of the Google parent look overbought on a short-term basis, they could be poised to outperform AI darling Nvidia Corp. over the coming months, according to Jonathan Krinsky of BTIG. Alphabet shares have been rising more quickly than Nvidia since earlier this year, turning a trend that had been in place for years on its head, and signaling that a breakout could be brewing. “The recent hype of Alphabet’s ... Gemini has caused a surge in GOOGL stock. While we wouldn’t chase that strength on a tactical basis, when we look at the long-term chart of GOOGL vs. Nvidia ... the ratio is trying to breakout of a multi-year base. So on a relative basis, we think GOOGL has a strong chance of outperforming NVDA over the next 3-6 months,” Krinsky said.
“The combination of weak private payrolls and subdued retail sales figures was enough to push traders to lean into a December rate cut once more. They’re now showing the strongest conviction in a reduction since policymakers last gathered in October. The revival in rate-cut bets certainly comes at an opportune time for risk assets as they attempt to recover from last week’s turmoil, and bodes well for a year-end rally barring any major economic shocks.” — Kristine Aquino, Managing Editor, Markets Live
“It’s really quite unique in the history of the Fed to have such a confrontation of hawkish and dovish narratives,” said Raphael Thuin, head of capital market strategies at Tikehau Capital. “The lack of visibility on the Fed’s next move could be a big risk this year and for 2026 too.”
Add the Oxford Economics team to the “no cut” camp for a December Federal Reserve rate cut. Grace Zwemmer, the firm’s associate economist, said in a client note that September’s wholesale inflation report, released Tuesday, is stale, but the real economy “is still holding up.” That should allow the Federal Reserve to hold rates steady in December, she said.
Ron Albahary, LNW’s chief investment officer: “I can’t predict the future, but it seems like the narrative is trending towards a Fed rate cut [on] Dec. 10, supportive of a Santa Claus rally.”
It’s unclear if these gains will hold for a year-end rally, but a lower-rate environment could help push stocks higher in the long run, said Jason Draho, head of asset allocation, Americas, at UBS Global Wealth Management.
“Investors and Fed officials became increasingly fogged in by the absence of critical economic data during the government shutdown. It will take time for the fog to lift, which will still be lingering on [Dec. 10] when the FOMC has to make its rate-cutting decision. But the latest comments by Fed officials and labor-market data favor further adjustment next month with a 25bps cut. That may not be sufficient for a year-end rally, but more importantly it supports our constructive outlook for risk assets over the next year,” Draho said.
“While stocks may continue to march higher in the coming weeks, we believe that most of 2025’s gains are already in and that there is limited upside ahead,” Rich Mullen, chief executive of Pallas Capital Advisors, told MarketWatch. “The market performance so far in 2025 has been stronger than expected as the bull market charges on.”
“Tuesday’s PPI was in-line with expectations and helps to justify the argument for another Federal Reserve rate cut in December, since it’s clear that inflation is under control, giving the Fed the opportunity to focus more on the labor market, which has been cooling in recent months,” said Clark Bellin, president and chief investment officer of Bellwether Wealth in Lincoln, Neb., which has roughly $800 million in assets. “While this data is old and from September, it’s the only inflation data the Fed has to base its current decisions off of.”
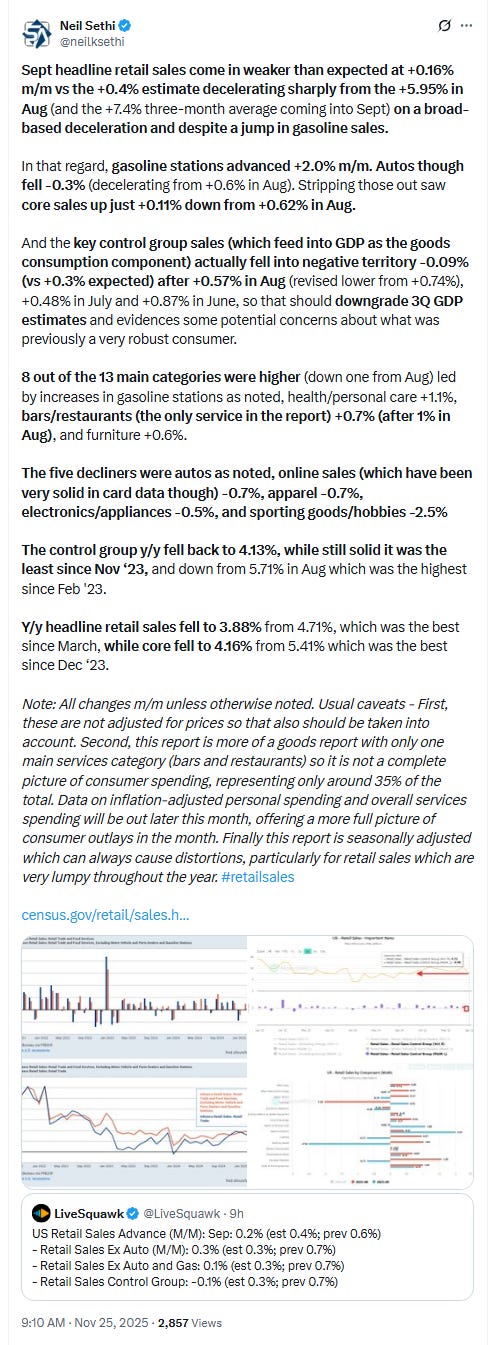
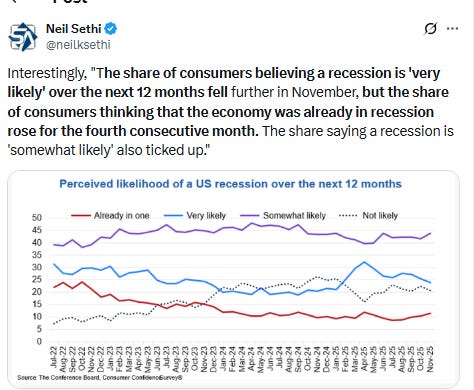
“These confidence indices are very low, well below levels seen just before the Covid lockdowns,” Carl Weinberg, chief economist at High Frequency Economics, said in a note. “Consumers are rattled.”
Link to posts - Neil Sethi (@neilksethi) / X for more details/access to charts.
In individual stock action:
Tech stocks like Apple Inc., Meta Platforms Inc. and Amazon.com Inc. rose. Gains in the health-care sector also buoyed the S&P 500.
Companies making the biggest moves after-hours from CNBC.
Mid-day movers from CNBC:
In US economic data:
Link to posts for more details/access to charts (all free) - Neil Sethi (@neilksethi) / X
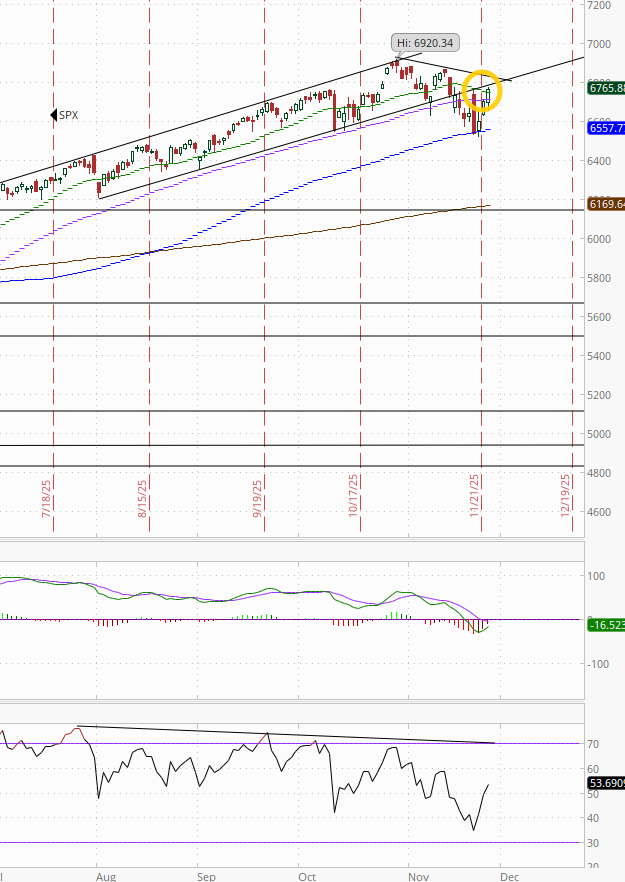
The SPX now through its 50-DMA with just the downtrend line between it and new highs. The daily MACD remains in “sell longs” positioning, but both are rapidly improving.
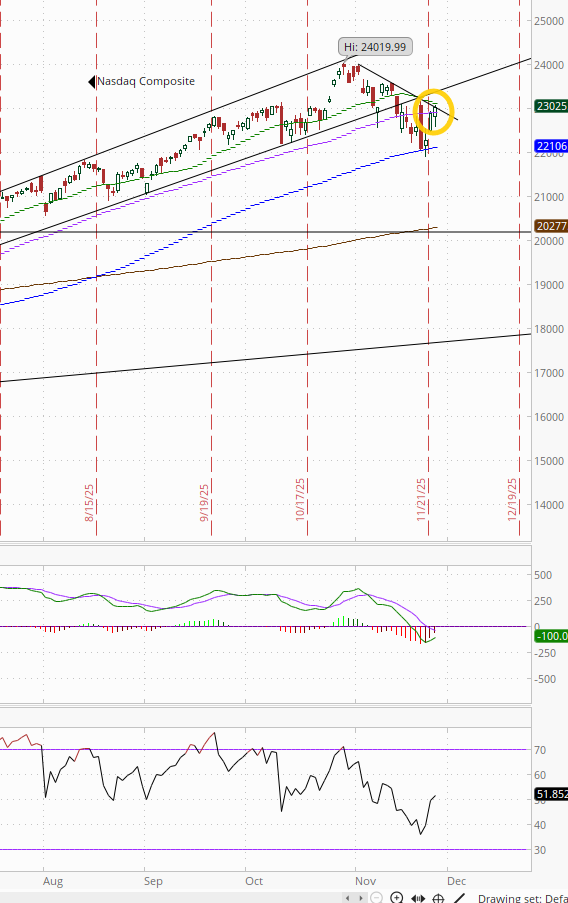
The Nasdaq Composite a similar story.
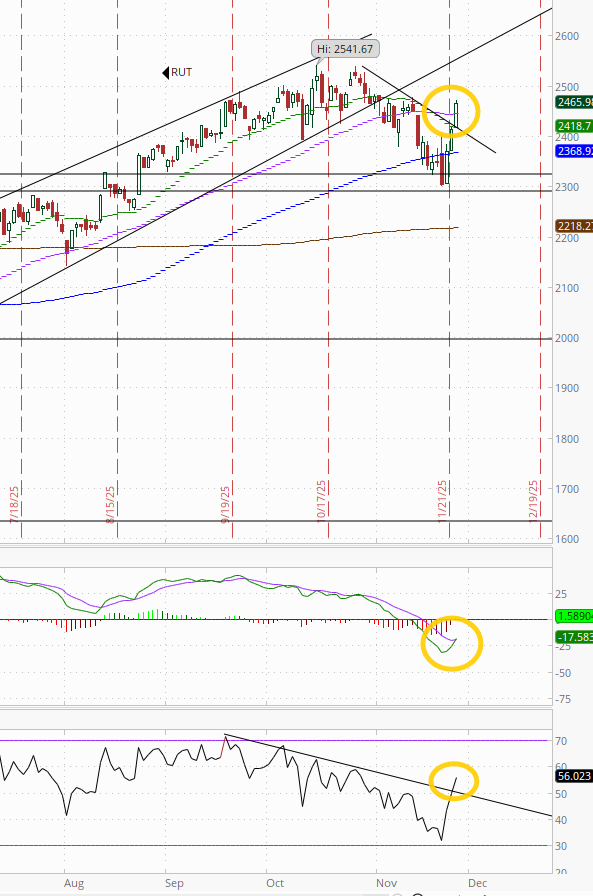
RUT (Russell 2000) jumped through both its 50-DMA and downtrend line. It also has seen its daily MACD cross to “cover shorts” and RSI is breaking out over 50.
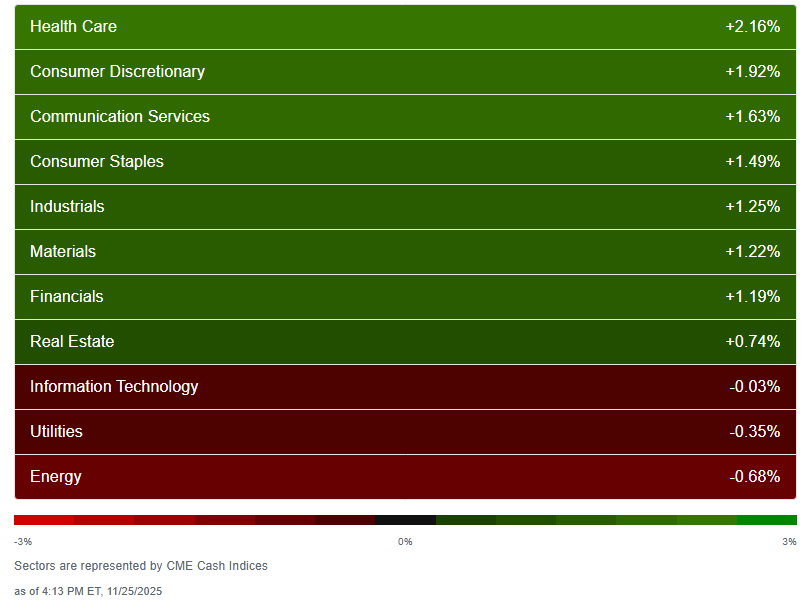
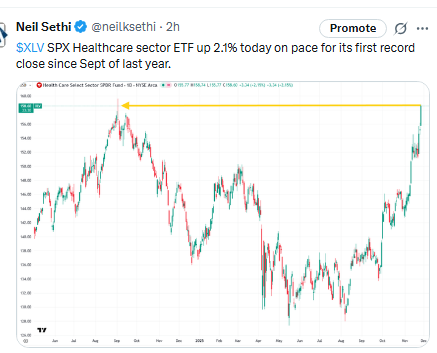
Sector breadth from CME Cash Indices edged back again Tues to 8 of 11 sectors higher (after 9 Mon, 11 Fri) although no sector down more than -0.7% (Energy). In contrast every green sector was up that much, with seven up at least 1%, led by Health Care +2.2% (which made an all-time closing high for the first time in over a year on the SPX).
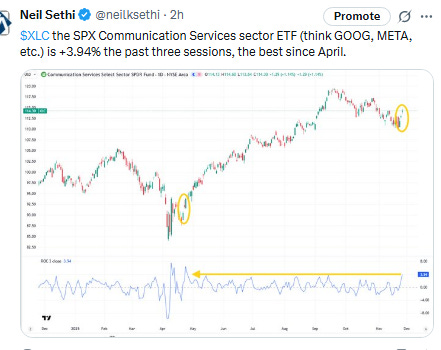
That was followed by two of the megacap growth sectors in Comm Services up +1.6% (now up nearly +8% the past three sessions (note though CME Cash Indices is a broader universe, and the SPX sector is up “just” +3.9% the past three sessions) and Cons Discr +1.9% (for a second day). Staples rebounded to fourth place +1.5% after leading to the downside losing nearly that much Monday.
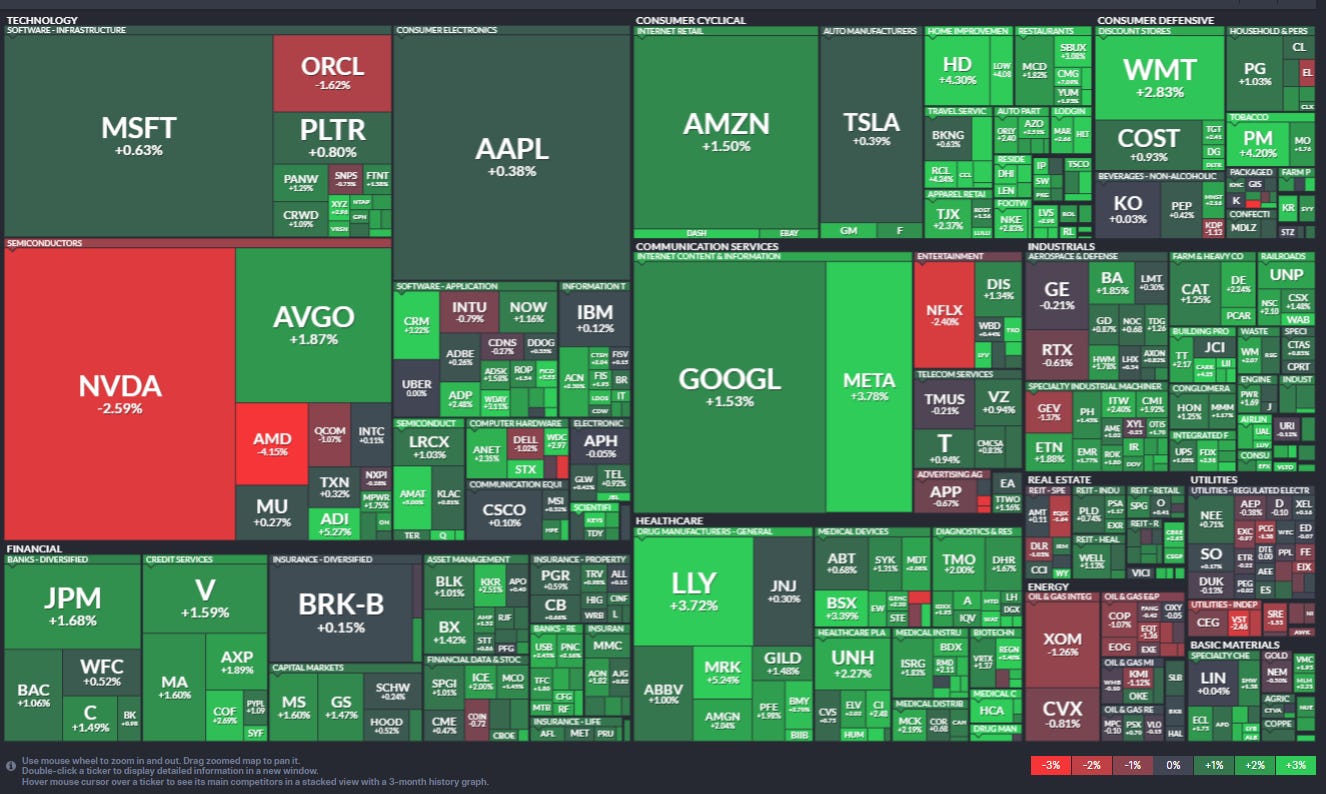
SPX stock-by-stock flag from @finviz.com consistent with a little more green and more of it “bright” (>3% gains) outside of Energy and Utilities and certain other pockets here and there. NVDA, AMD, and NFLX some clear underperformers.
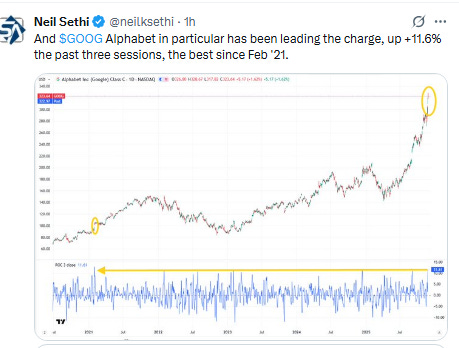
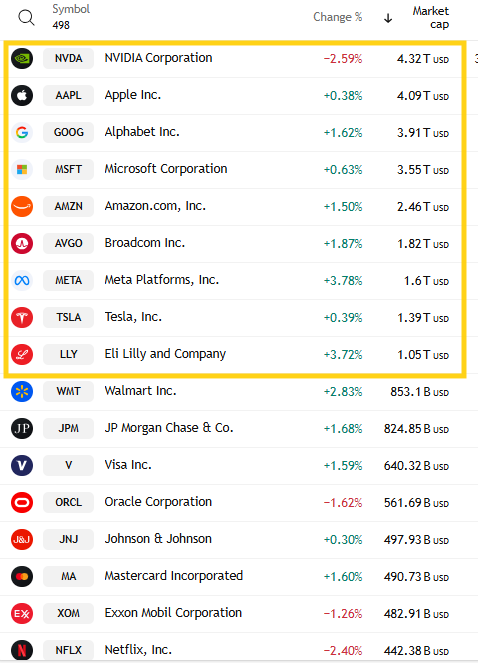
But outside of NVDA (-3.6%) all of the top 9 (trillion-dollar club) were higher (after all were higher Mon) led to the upside by META +3.8% with LLY +3.7% right behind. AVGO added +1.9% after Mon’s huge +11.1% day and GOOG was up another +1.6% taking its three-day gains to +11.6% the best since Feb ‘21. Mag-7 was +0.7% taking its gains this week to +4.2% easily on track to break its three-week losing streak.
~70 SPX components were up 3% or more, up from 40 Mon but down from 130 Fri (but also up from just 3 Thurs), led by Keysight KEYS +10% after earnings. Despite the larger number up over 3%, fewer overall >$100bn in market cap were up that much in ADI (for a third session), MRK, AMAT (again), HD, PM, LOW, META, LLY BSX, CRM vs 18 Mon (in descending order of percentage gains).
Just 2 SPX components down -3% or more down from 10 Mon, 9 Fri, and 68 Thurs led by AMD -4.2%, also the only >$100bn in market cap down at least 3%.
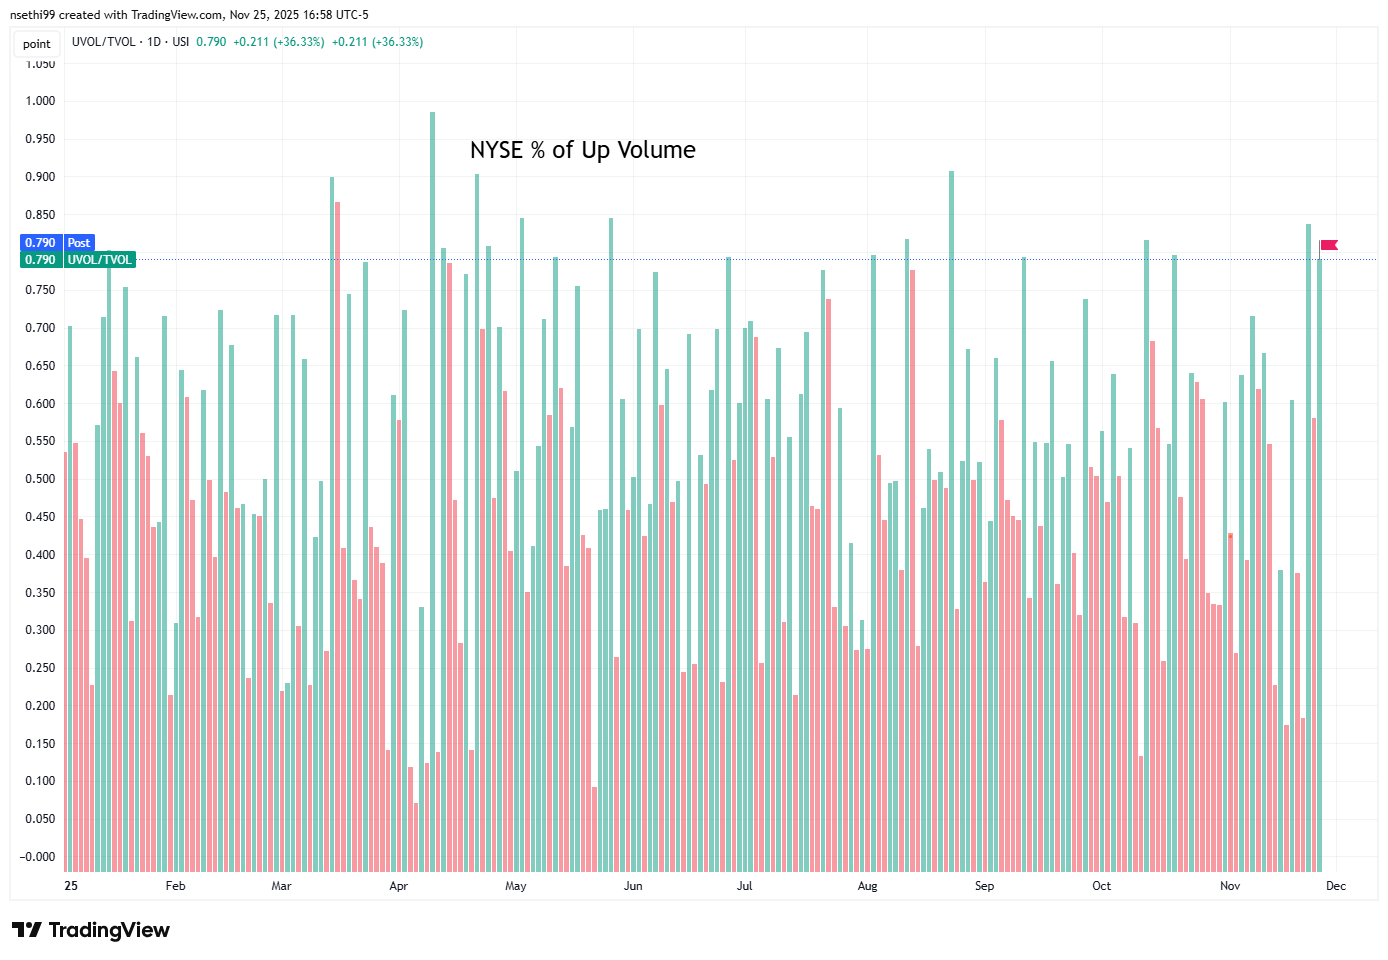
NYSE positive volume (percent of total volume that was in advancing stocks) improved to 79.0% just below the 83.8% Fri (which was the 2nd best since May), although that was despite a slightly larger index gain Tues of +1.32% vs +1.26% Fri.
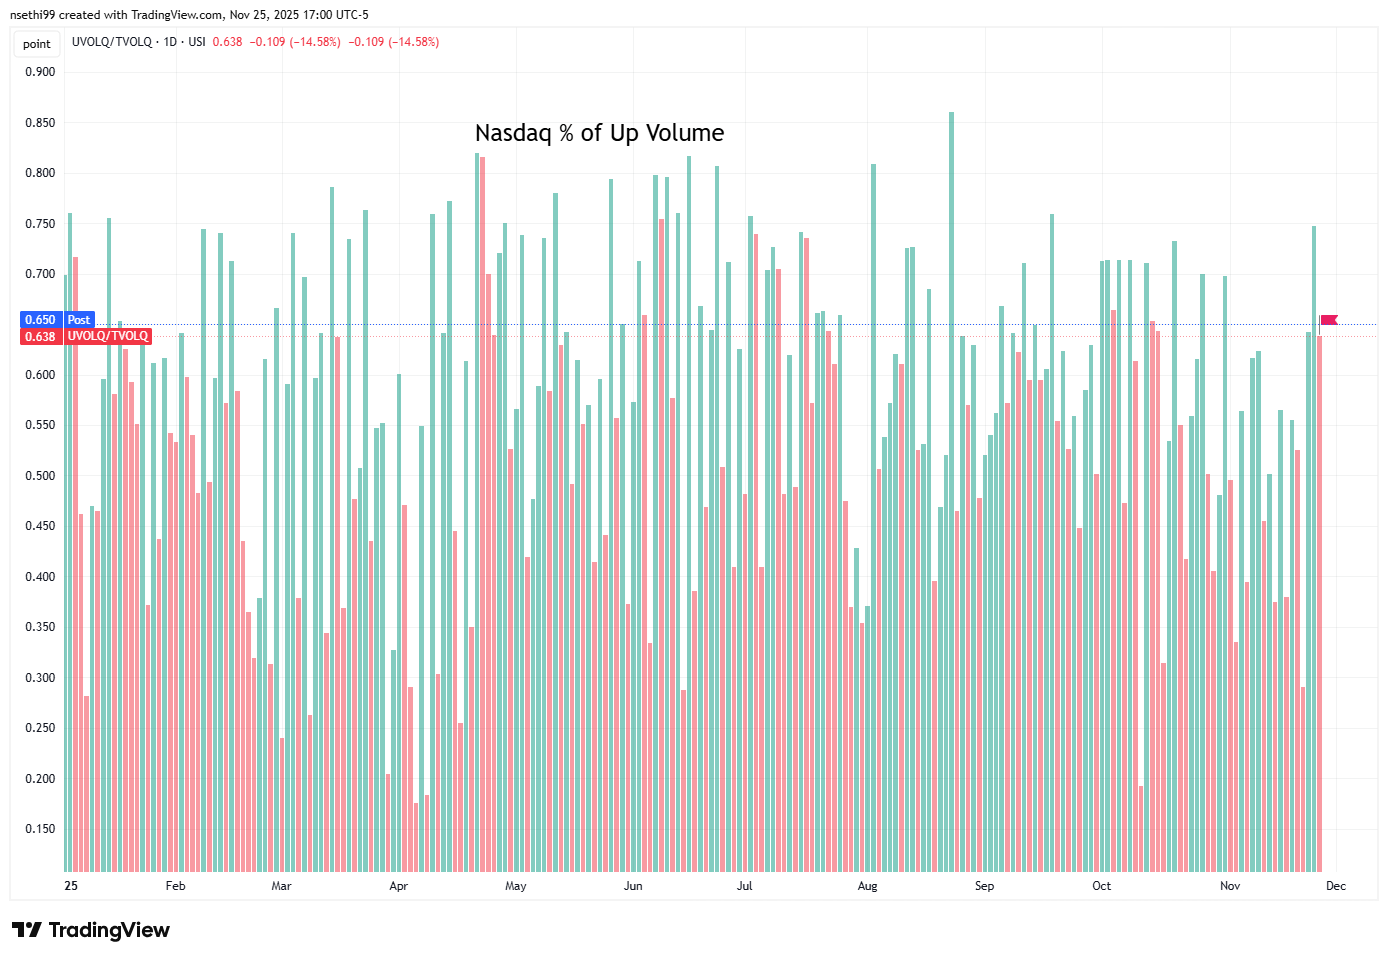
Nasdaq positive volume (% of total volume that was in advancing stocks) fell back to 63.8% from the best since Aug 22nd, but it was in line with the index gain of +0.67%
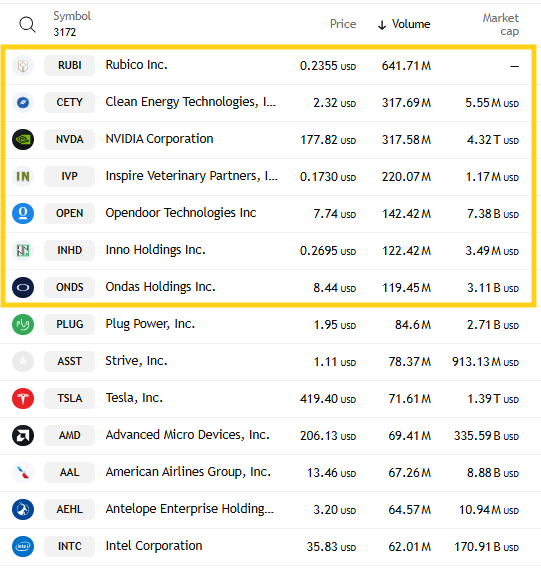
Speculation was mixed with the top stock by volume in the Nasdaq (penny stock RUBI) seeing 641mn shares traded, almost double Mon’s top stock INHD at 331mn, and there were two other stocks over 300mn (vs two total Mon). That though remains less than half what we saw two weeks ago when the top stock by volume over 1.4bn.
But just 7 stocks in total traded over 100mn shares down from 8 Mon, 10 Fri and 12 early last week.
Positive issues (percent of stocks trading higher for the day) which are not as inflated by penny/meme stocks saw a rare day higher than volume on the Nasdaq at 70% while the NYSE was at 79%.
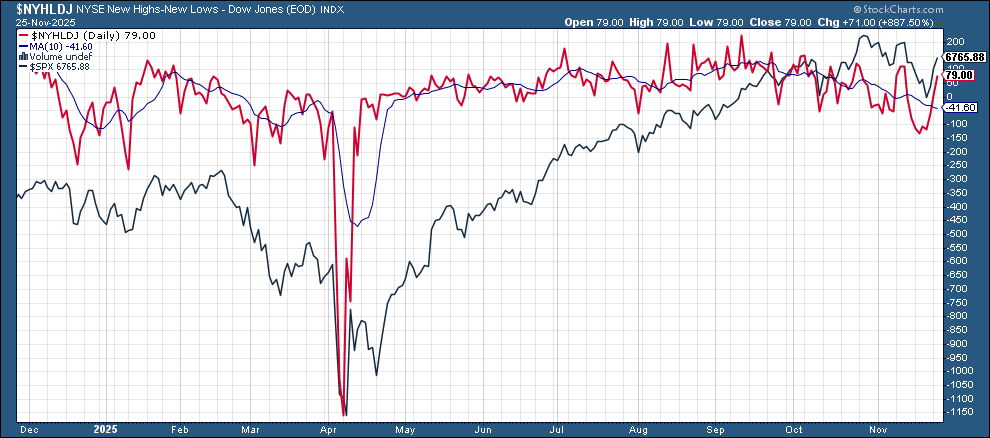
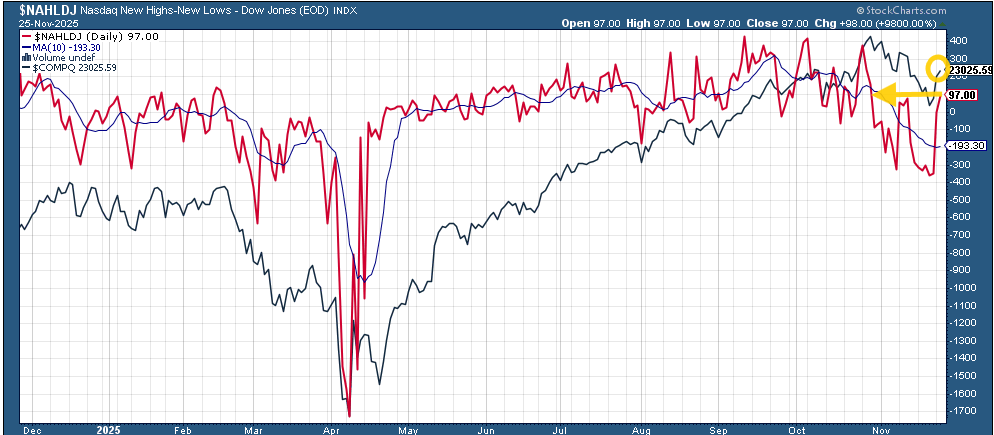
New 52-wk highs minus new 52-wk lows (red lines) continued their improvement to 79 from 8 Monday and -115 Thursday on the NYSE and 97 from -1 Monday and -357 Thursday on the Nasdaq, which was the least since April. The Nasdaq new highs are also outperforming the price action in the index.
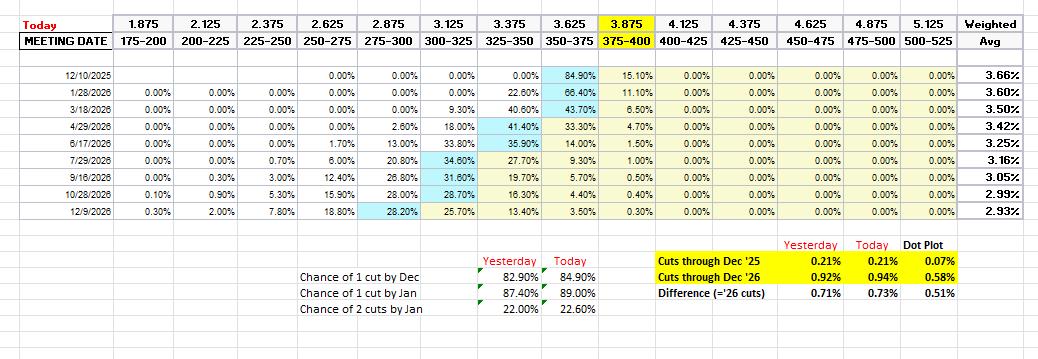
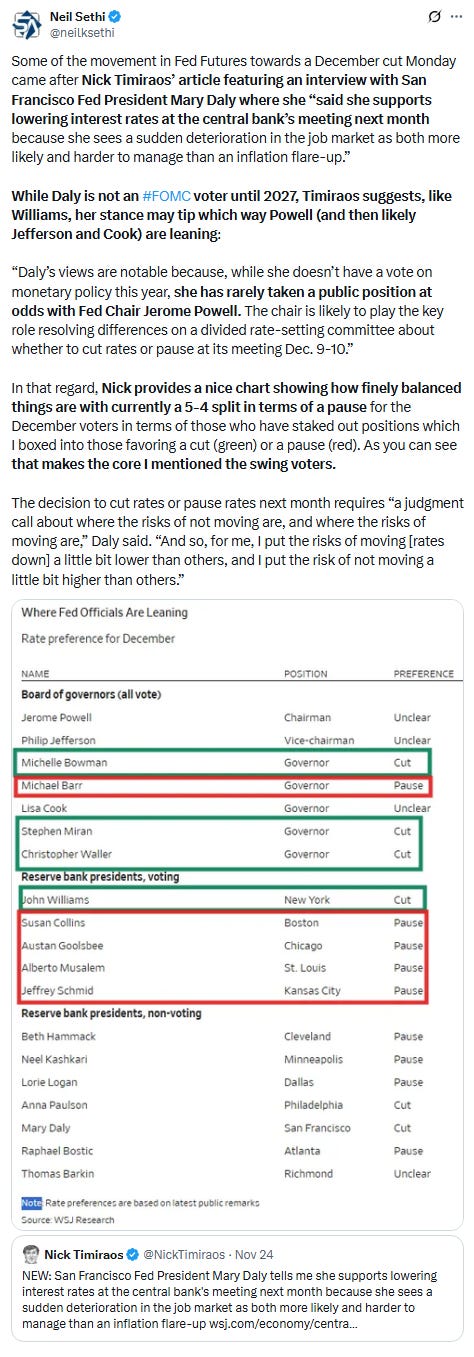
Odds on a Dec #FOMC rate cut continued to firm with pricing for December now at 85%, the highest since the Oct FOMC, up from 72% Friday and 33% Wed, although still down from 100% Oct 16th.
As I have been noting prior to Friday the market had been mostly shifting the December cut to 2026, and it has continued to move cuts back to December, as while a cut by January improved to 89% (also the best since Oct 16th (96%)), cuts at both the Dec & Jan meetings remained at 23% barely up from 20% Wed.
But pricing for 2026 firmed for the first time in a week +2bps after -9bps the prior two days to 73bps (down from 80bps Thurs which was highest we’ve been for 2026 cuts), and in some evidence that not all of the cuts have been pulled back total cuts through Dec ‘26 are up since Wed at 94bps (but still down though from 103bps pre-Oct FOMC which was the highs of the year (for cuts from December on)).
As a reminder the average dot on the dot plot has ~60bps of total rate cuts through Dec ‘26 from this point, so over a cut off.
I said after the big pricing out of cuts in January (and again in February) that the market had pivoted too aggressively away from cuts, and that I continued to think cuts were more likely than no cuts, and as I said when they hit 60 bps “I think we’re getting back to fairly priced (and at 80 “maybe actually going a little too far” which is definitely where we were Apr 20th (a little too far) at 102bps). I said the day before July NFP “now it seems like we’re perhaps getting back to too few cuts”. I thought at 76bps heading into the Sept FOMC we were perhaps a bit overdoing it, but continued to expect at least 50bps this year (which we’ve now gotten) but probably not a lot more than that (which has been my call since last December). I said I thought we got back to overdoing it when over 50bps of rate cuts were priced for the rest of the year Oct 16th. I had said “while 50bps is my base case it’s less than 100% I think.” I then said we were pushing a bit to far when we got into the low 40% and under range, but now we’re back up over 80% which I think may be a touch high, but it certainly feels like Powell sent out the doves to talk it back up which means it’s almost certainly more likely than not.
Also remember that these are the construct of probabilities. While some are bets on exactly one, two, etc., cuts some of it is bets on a lot of cuts (3+) or none (and may include a hike at some point)
The 10yr #UST yield made it down under the 4% level before closing right on it, the lowest close since Oct 29th.
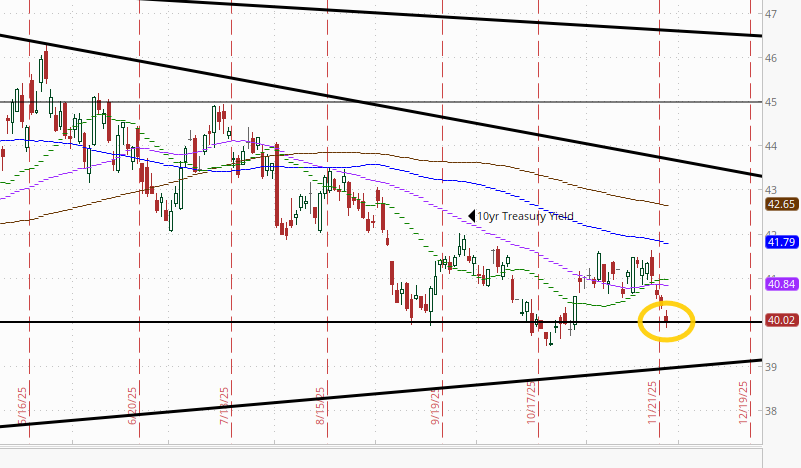
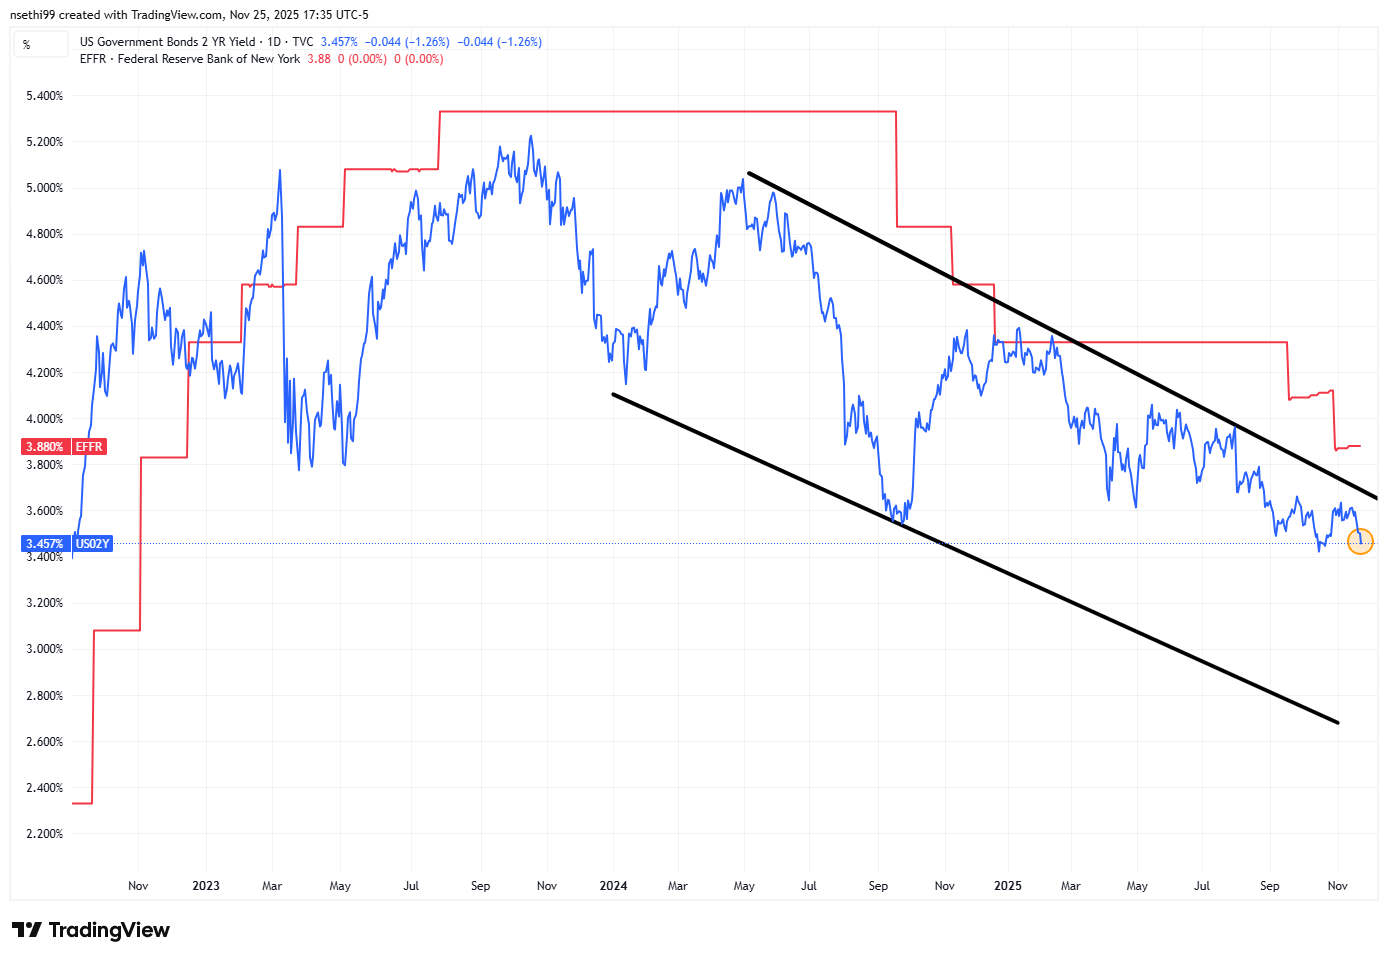
The 2yr yield, more sensitive to FOMC rate cut pricing, fell -4bps to 3.46% the lowest this month and now just 4bps from the bottom of the range since late August. It is 42bps below the Fed Funds midpoint.
The Effective Fed Funds Rate (red line) remained at 3.88% a tenth above the Fed Funds midpoint and up 5bps since Sept, evidence of continued growing stresses in funding markets that will likely see the Fed adding assets to its balance sheet soon.
I had said when the 2yr yield it was around 4.35% (in Jan & again early Feb) that I found the 2-yr trading rich as it was reflecting as much or more chance of rate hikes as cuts while I thought it was too early to take rate cuts off the table (and too early to put hikes in the next two years on), but then the 2yr fell to 3.65% past where I thought we’d see it, so I took some exposure off there. We got back there but I never added back what I sold, so I stuck tight. Ian Lygan of BMO said on his weekly podcast he now sees it at 3.3% by year’s end (but sees risk to the downside), but I still took some off Sept 5th at 3.5%. I have been waiting for ~3.90% to add back but it seems now that ship might have also sailed.
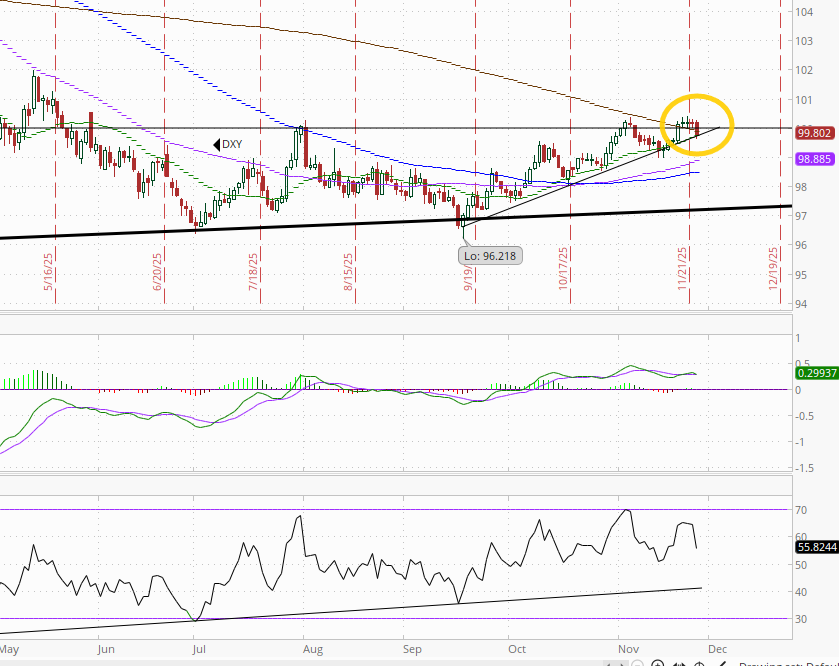
The $DXY dollar index (which as a reminder is very euro heavy (57%) and not trade weighted) fell back from near the highest since May, now under the 100 level as well as the 200-DMA after not able to “break out”. It didn’t yet break its uptrend line from Sept.
The daily MACD and RSI have softened back to neutral.
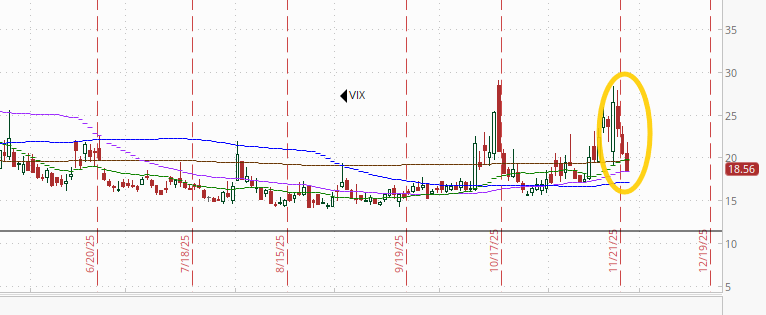
VIX fell back for a third session to 18.5 after hitting the highest since April on Thurs. The current level is consistent w/~1.15% average daily moves in the SPX over the next 30 days.
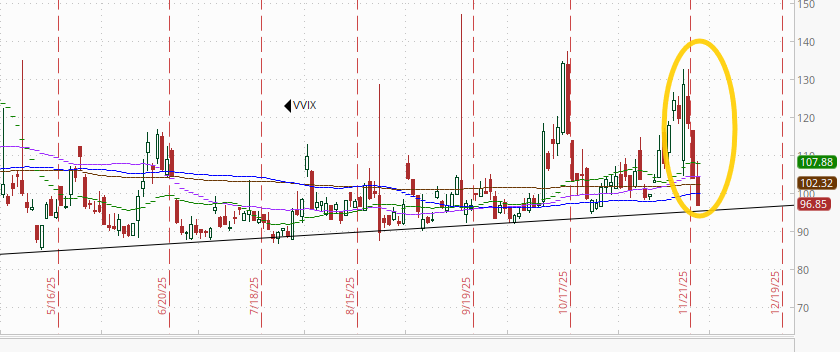
The VVIX (VIX of the VIX) has seen an even larger pullback now down to 96.9 below Nomura’s Charlie McElligott’s breakeven “stress level” of 100 (consistent with “moderate” daily moves in the VIX over the next 30 days (normal is 80-100)). It is coming up on that trendline again running back to March.
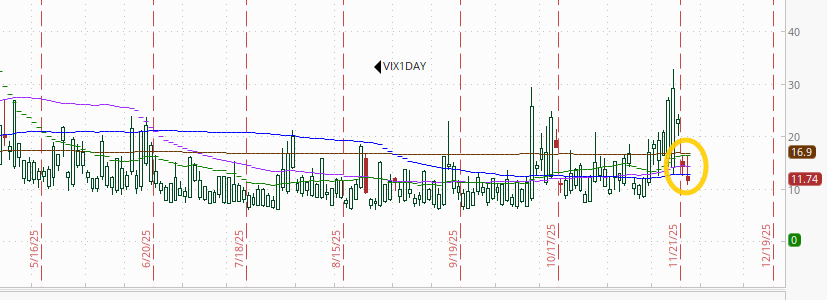
1-Day VIX like the VIX and VVIX fell back, in its case to 11.7, the lowest close since Nov 11th. That level implies a ~0.71 move in the SPX next session down from the ~1.45% implied for Monday.
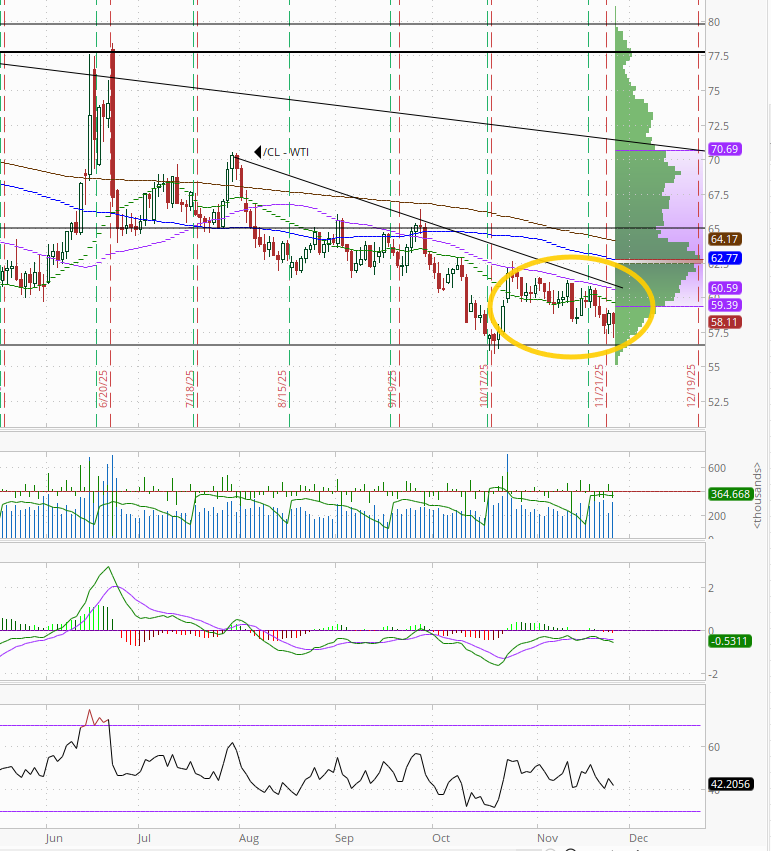
#WTI futures gave back most of Mon’s +1.6% bounce from the lowest close since Oct 21st. The MACD and RSI have softened to more negative reads as noted Friday.
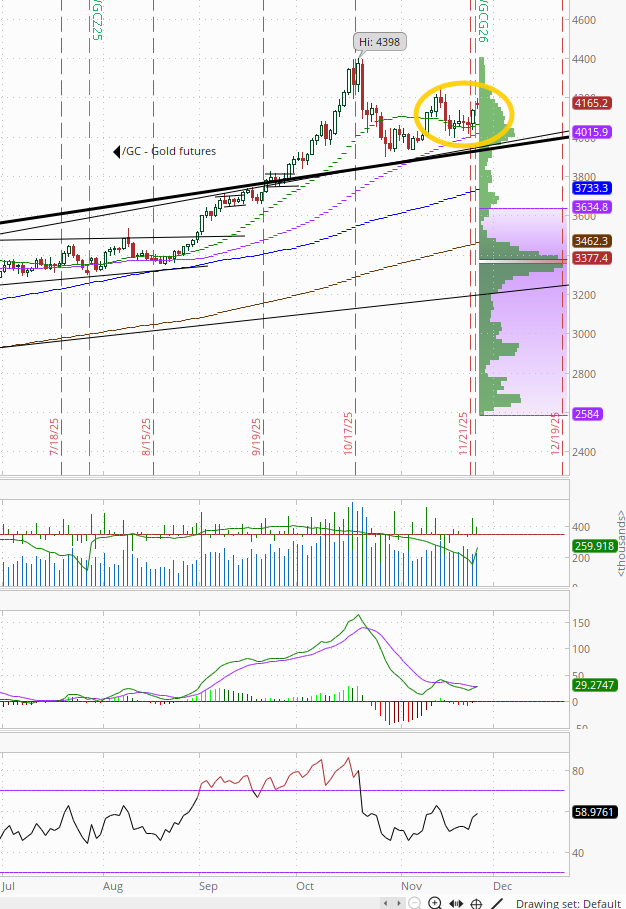
Gold futures (/GC) moved higher again Tues +0.8% after +1.7% Mon as they look to break out of their consolidation since peaking a month ago. Daily MACD and RSI remain with relatively neutral readings but close to flipping more positive.
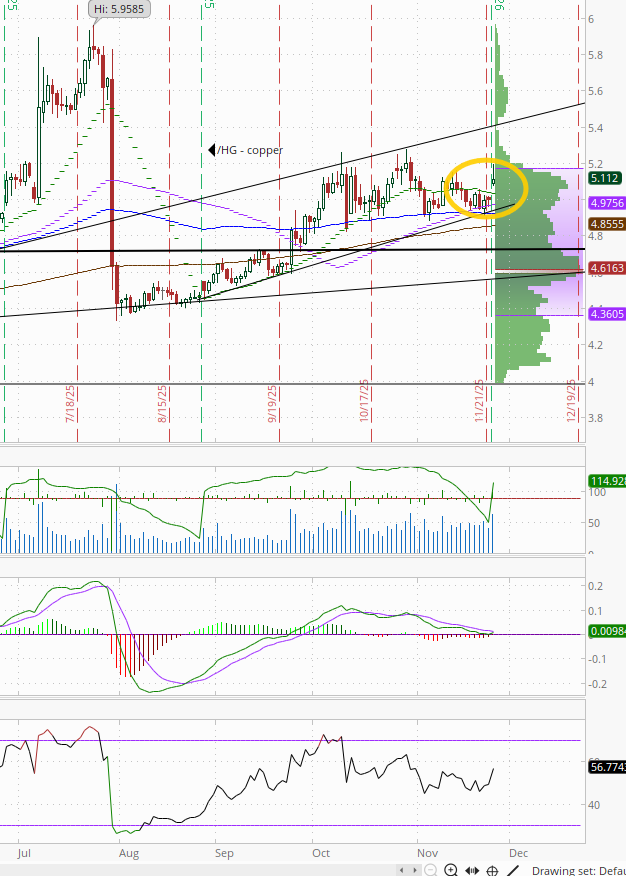
US copper futures (/HG) able to separate from their 50-DMA (purple line) and uptrend line since August moving towards the top of their range since the end of September. Longer term, they remain in the grinding uptrend since August (and longer than that in the uptrend started in March 2020). Daily MACD and RSI are starting to turn more positive.
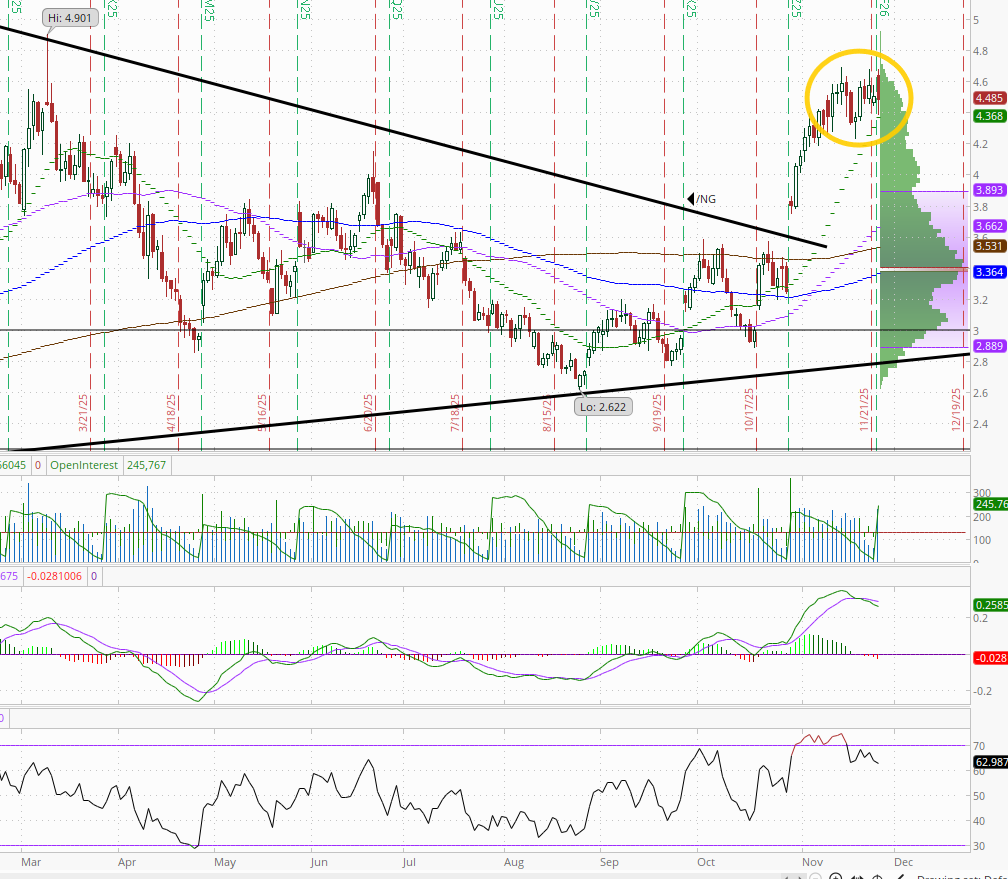
Natgas futures (/NG) took a shot at new highs before falling back to close mildly lower, remaining in the range over the past week+ near the highest since Dec ‘22. As noted Wed, “daily MACD has softened to ‘sell longs’ positioning, and the RSI has fallen from above to under 70, often a sign of a consolidation/pullback, so we’ll see where it goes from here. Importantly, though, those metrics haven’t deteriorated much further.”
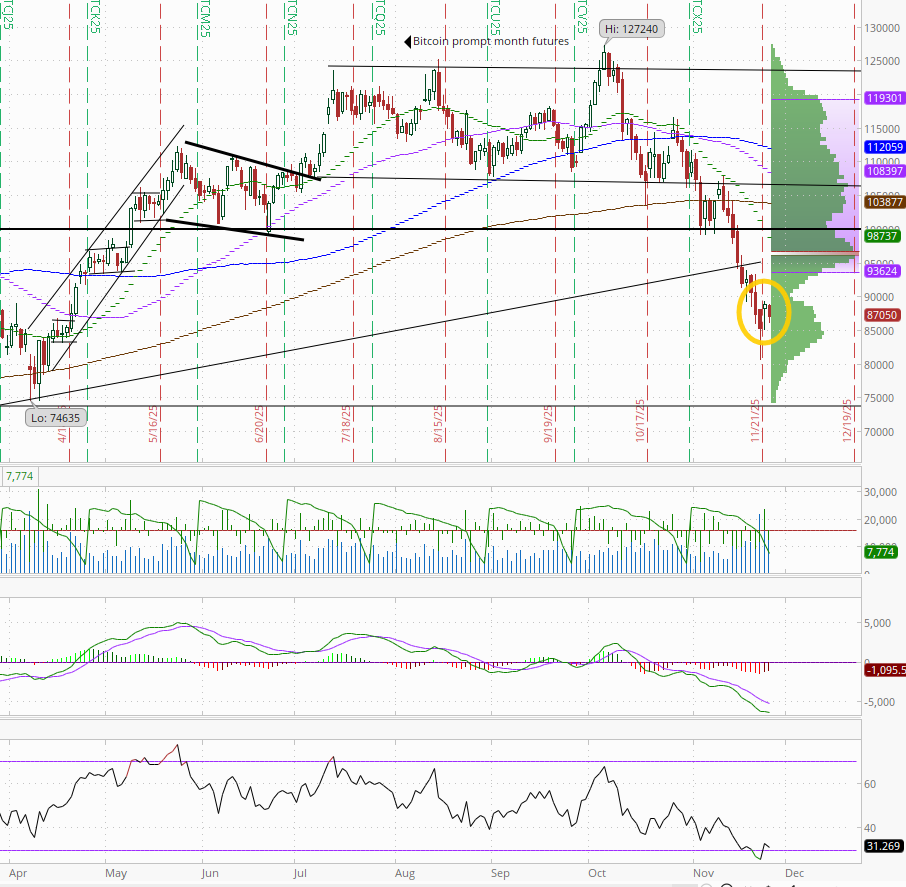
Bitcoin futures not able to build on Mon’s +4.2% bounce from the lowest since April although only gave back about half of that. They are still down around -35% from the highs. The daily MACD remains in “go short” positioning, and the RSI has bounced back over 30 from the weakest since June ‘22, which can be the sign of a bottom although it’s falling back. As I noted Friday “seems the selloff is getting long in the tooth,” but that doesn’t have to be followed by a rally either.
The Day Ahead
US economic data Wednesday lighter than Tues (and that’s basically it for the week) with another delayed report in Sept durable goods. We’ll also get weekly jobless claims, mortgage applications, and EIA petroleum inventories. Remember it’s a full trading session Wed (for some reason) even if it will be very light volumes.
Still no Fed speakers on the calendar, but we’ve gotten a few media interviews, although we’re running up against Thanksgiving now, so we’ll see if we get any more. But regardless we’ll get the Fed’s Beige Book prepared for the December meeting. Given the lack of other economic data, this carries more weight than it normally would.
We’ll get the third of this week’s Treasury auctions with 7-yr notes.
We’ll get one more SPX earnings report Wednesday, and it’s a >$100bn in market cap, in Deere DE.
Ex-US DM highlight is definitely the Autumn budget in the UK, but we’ll also get a policy decision from RBNZ (New Zealand), the EU financial stability review, Australia CPI, and more speakers.
In EM highlights are a policy decision in Guatemala, Banxico’s inflation outlook for Mexico, Brazil inflation and social financing,
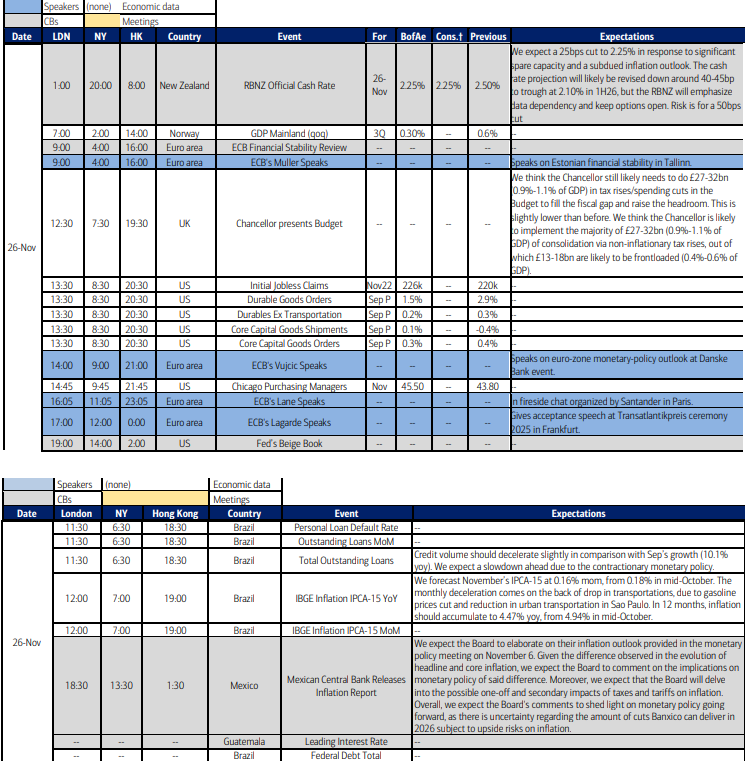

Wednesday, November 26
08:30 AM Initial jobless claims, week ended November 22 (GS 230k, consensus 230k, 220k)
Continuing jobless claims, week ended November 15 (last 1,936k)
08:30 AM Durable goods orders, September preliminary (GS +1.5%, consensus +0.5%, last +2.9%)
Durable goods orders ex-transportation, September preliminary (GS +0.2%, consensus +0.2%, last +0.4%)
Core capital goods orders, September preliminary (GS +0.1%, consensus +0.3%, last +0.6%)
Core capital goods shipments, September preliminary (GS +0.2%, last -0.3%)
We estimate that durable goods orders increased 1.5% in the preliminary September report (month-over-month, seasonally adjusted), reflecting an increase in commercial aircraft orders. We forecast a 0.1% increase in core capital goods orders—reflecting an improvement in the new orders components of manufacturing surveys but potential payback for the outsized increase in the prior month—and a 0.2% increase in core capital goods shipments—reflecting the increase in orders in the prior month.
02:00 PM Fed Releases Beige Book, December meeting period
The Fed’s Beige Book is a summary of regional economic anecdotes from the 12 Federal Reserve districts. The Beige Book for the September FOMC meeting period noted that three districts had reported modest activity growth, while five districts had reported no change and four districts noted a slight softening, and that uncertainty remained elevated, weighing down activity. In this month’s Beige Book, we look for anecdotes related to the evolution of labor demand and firms’ expectations of activity growth for the remainder of the year.
Link to X posts - Neil Sethi (@nelksethi) / X
To subscribe to these summaries, click below (it’s free!).
To invite others to check it out,