
Markets Update - 11/26/25
Update on US equity and bond markets, US economic reports, the Fed, and select commodities with charts!

To subscribe to these summaries, click below (it’s free!).
To invite others to check it out (sharing is caring!),
Link to posts - Neil Sethi (@neilksethi) / X
Note: links are to outside sources like Bloomberg, CNBC, etc., unless it specifically says they’re to the blog. Also please note that I do often add to or tweak items after first publishing, so it’s always safest to read it from the website where it will have any updates.
Finally, if you see an error (a chart or text wasn’t updated, etc.), PLEASE put a note in the comments section so I can fix it.
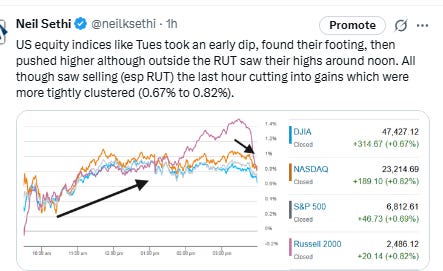
US equity indices were trading higher in the first 30 minutes continuing to be boosted by expectations for a December rate cut along with the lowest initial jobless claims print since April, gains in tech heavyweights, and a solid durable goods report from September. Similar to Monday and Tuesday, though, the indices saw a decline in the first hour, but also like those days quickly found a bottom and from there pushed higher.
Unlike the last two days though the rally stalled out around noon for all but the the small cap Russell 2000 (RUT) which saw an unusual push higher which was then reversed in the last hour as all of the indices softened. The result was a more tightly clustered finish than we’d seen the past two days all finishing with gains between +0.67% and +0.82%.
Elsewhere, Treasury yields fell back again, and the dollar did as well. Gold though was again higher, and again joined by copper. Natgas, bitcoin, and crude were all also up today.
The market-cap weighted S&P 500 (SPX) was +0.7%, the equal weighted S&P 500 index (SPXEW) +0.6%, Nasdaq Composite +0.8% (and the top 100 Nasdaq stocks (NDX) +0.9%), the SOXX semiconductor index +2.8%, and the Russell 2000 (RUT) +0.8%.
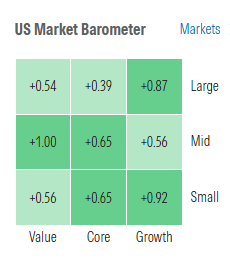
Morningstar style box shows widespread gains for a fourth session again fairly evenly distributed.
Market commentary:
“Overall it was a stronger-than-expected round of 8:30am data that has reinforced the notion that there are crosscurrents and mixed performance in the real economy,” according to Ian Lyngen at BMO Capital Markets. “That being said, there is nothing within the reports that will derail the FOMC from cutting by 25 basis points on Dec. 10.”
“The latest Beige Book depicts an economy essentially treading water. For markets, the takeaway is straightforward — nothing here challenges expectations for a December rate cut. With the shutdown having robbed policymakers of hard data, this edition carries extra weight: officials insisted they could stay plugged in through district anecdotes, and this report offers the clearest window into that data-void economy. The apparent fragility across districts simply reinforces the recent bond bid.” — Brendan Fagan, Macro Strategist, Markets Live.
“While the economic data is still sparse, the data published so far is showing that the inflation picture and the job market, while far from perfect, are not as troublesome as feared,” said Paul Stanley, chief investment officer at Granite Bay Wealth Management. He added that this optimism has been helping stocks recover from the earlier November lows. Stanley told MarketWatch that his team expects “mild volatility” in stocks between now and the end of the year, as investors try to price in what the earnings and economic picture will look like in 2026. But “we believe the worst of the stock-market volatility for this year is behind us, as investors start to look ahead to 2026 and start to price in continued earnings growth and productivity from AI,” he added.
“The fact we’ve seen such a quick rally after that pullback just tells you that there’s still quite a lot of underlying demand,” said Daniel Murray, deputy chief investment officer at EFG Asset Management.
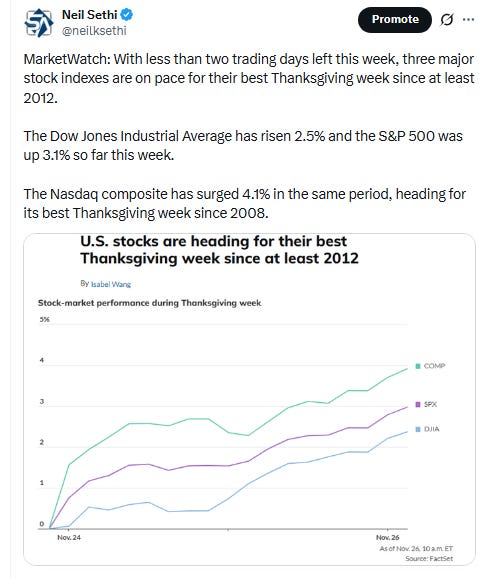
Eric Diton, president and managing director at The Wealth Alliance: “Thanksgiving week is generally a strong week in the markets. Everyone’s feeling good.” “We’re also coming to the best stretch of the year for stocks – November to April,” he continued. “It’s hard to not stay bullish here.” “If the Fed disappoints, you could have a sell-off,” Diton added. “I don’t think they will.”
“There’s still a good case to be made for a year-end rally based in part on the fact that we had an adjustment centered on fear and not fundamentals,” said Thomas Martin, senior portfolio manager at Globalt Investments in Atlanta, citing the S&P 500’s roughly 5% drop from Oct. 28 through last Thursday. “It just took dip buyers a little longer to come back.” Martin added that “the adjustment itself was more psychological, I think. The market had gone to all-time highs and, by the end of October, people were like, ‘Valuations are high’ and ‘We’ve made all this money.’” Meanwhile, there were also concerns about the circular nature of AI deals. “We got a little bit of an adjustment, but it lasted longer than some of the dips we had earlier this year,” he noted.
For Valerie Charriere, head of European equities at BNP Paribas Asset Management, the shorter-term outlook remains clouded after the recent volatility. “I don’t expect the typical Christmas rally to occur,” she said. “There are some cracks in AI valuations, uncertainties on the Fed. So taking into account the strong performance so far this year, I would expect rather a rotation to more underperforming defensive sectors.
“Stocks are trying to stage a comeback from the past few weeks of declines, suggesting that dip buyers are still out in full force,” said Clark Bellin, president and chief investment officer of Bellwether Wealth. “The depth of the market’s pullback in November was only about 4% from the late October high, which is well below the typical 10% correction threshold.”
“While we expect the stock market to revisit these highs, there isn’t an obvious upside catalyst to propel the market between now and the end of the year,” Bellin added.
“Rallying shares of Alphabet, powered by the company’s sharpened focus on AI, has added to the positivity. But valuation concerns remain, while weakness in the economy is not a good sign for company sales and profits,” Fawad Razaqzada, a market analyst at StoneX said. “Then, there is the ongoing concerns over debt levels in countries like Japan. So, the risks are still fairly balanced in so far as the Nasdaq 100 forecast is concerned. After a sharp recovery, don’t be shocked if that momentum stalls now — though no signs of a reversal just yet.”
Link to posts - Neil Sethi (@neilksethi) / X for more details/access to charts.
In individual stock action:
The broader market’s gains were bolstered by artificial intelligence player Oracle, which jumped around 4% after Deutsche Bank reaffirmed its bullish stance on the name. Nvidia shares moved up more than 1%, recovering from a recent pullback, while fellow “Magnificent Seven” member Microsoft traded almost 2% higher.
Corporate Highlights from BBG:
New York City Comptroller Brad Lander is urging three of the city’s pension funds to drop BlackRock Inc. because of “inadequate” climate plans, the latest move to penalize investment firms for failing to tackle global warming.
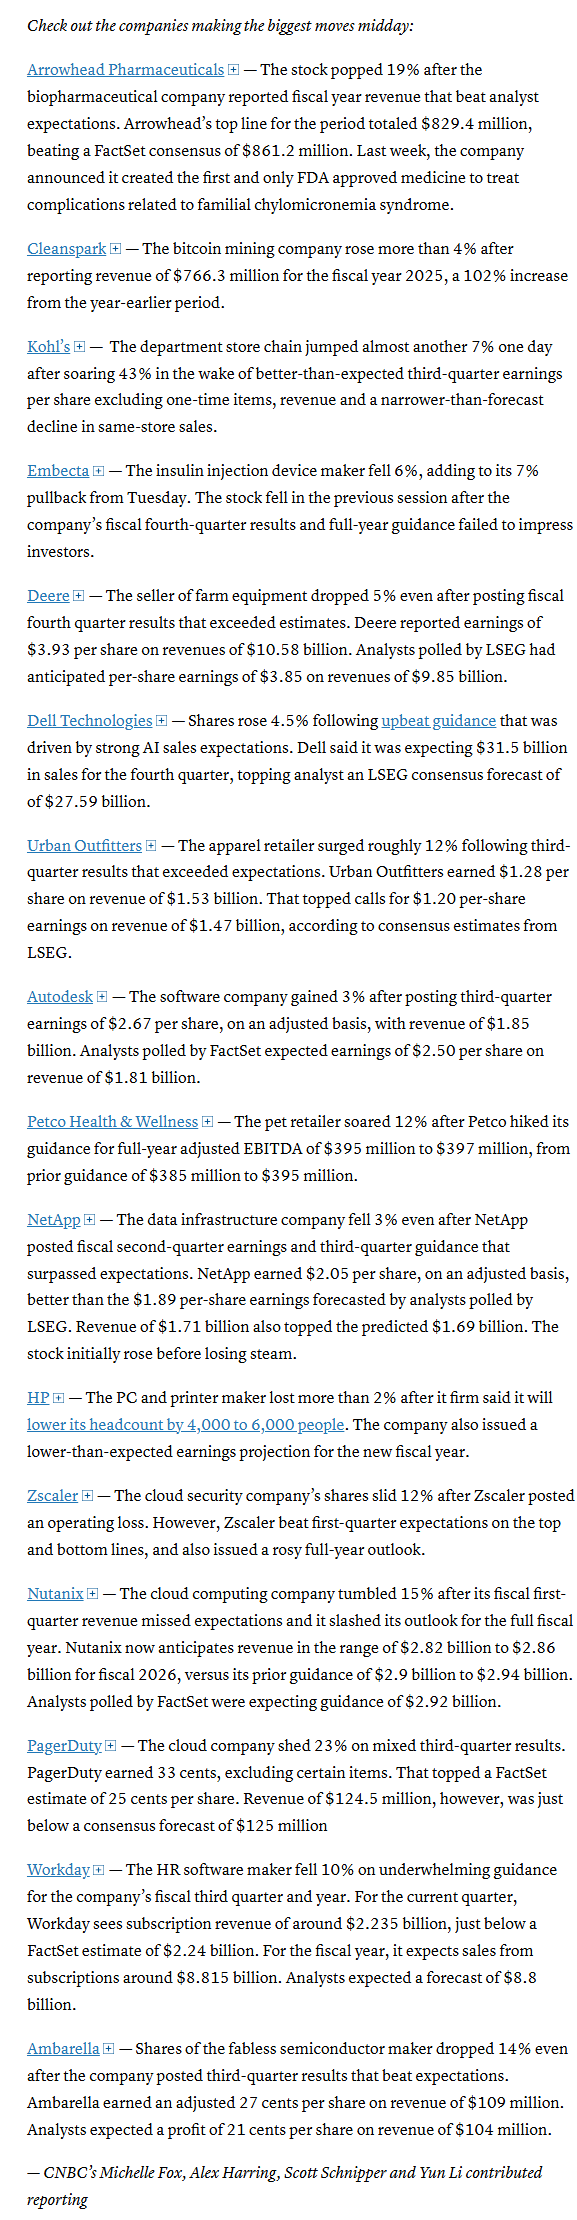
Dell Technologies Inc.’s shares gained 5.8% as the firm raised its annual projections for the key artificial intelligence server market.
Deere & Co.’s first outlook for the year ahead fell short of expectations as uncertainly continues to surround the timing for a recovery in the US farm economy.
Robinhood Markets Inc. and Susquehanna International Group are taking over a regulated exchange that was tied to the now-defunct crypto business FTX.
The US government said Tuesday it negotiated a 71% discount off of the list price of Novo Nordisk A/S’s blockbuster drugs Ozempic and Wegovy for patients in Medicare.
Mid-day movers from CNBC:
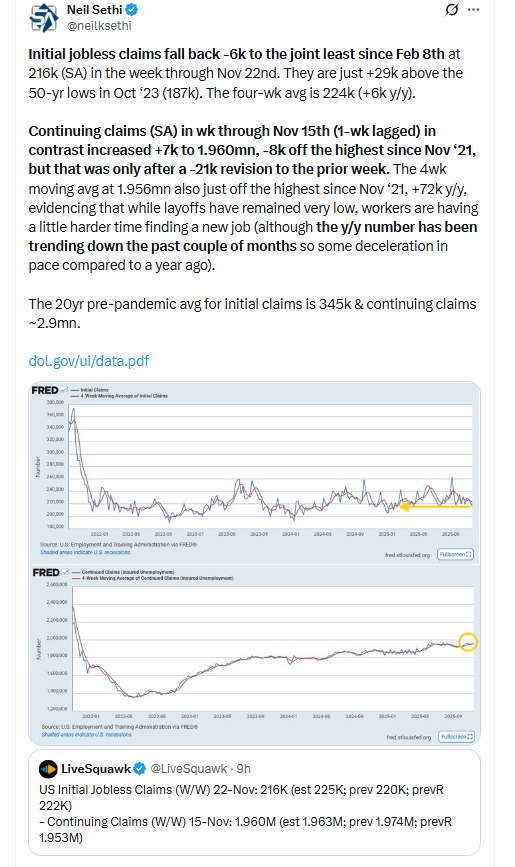
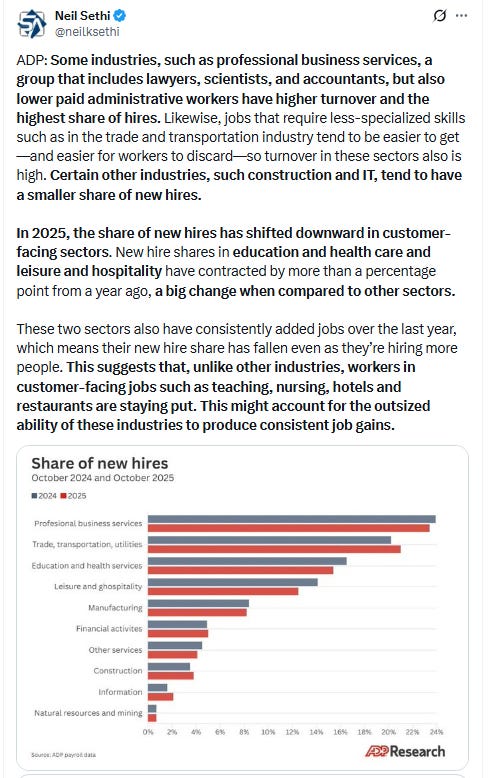
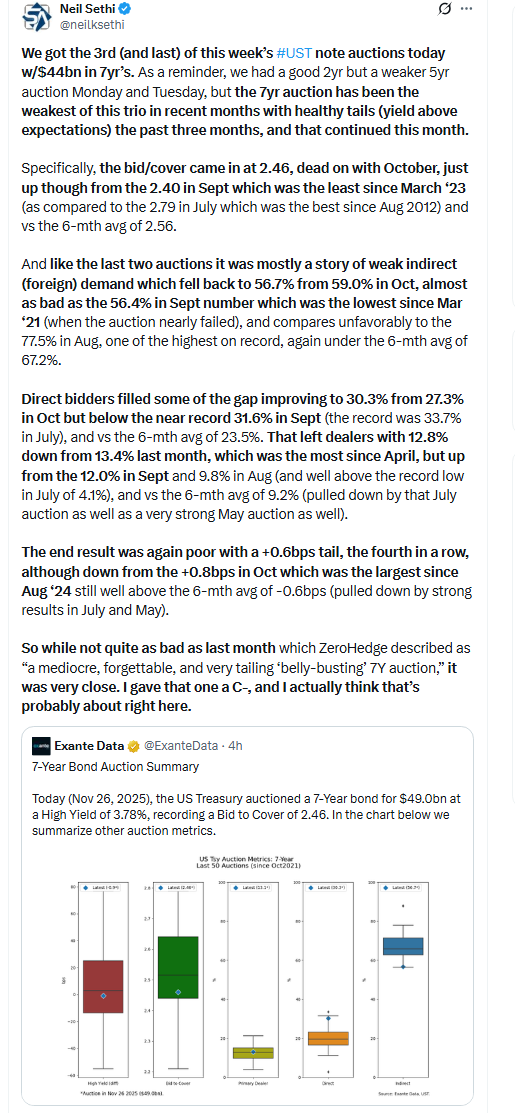
In US economic data:
Link to posts for more details/access to charts (all free) - Neil Sethi (@neilksethi) / X
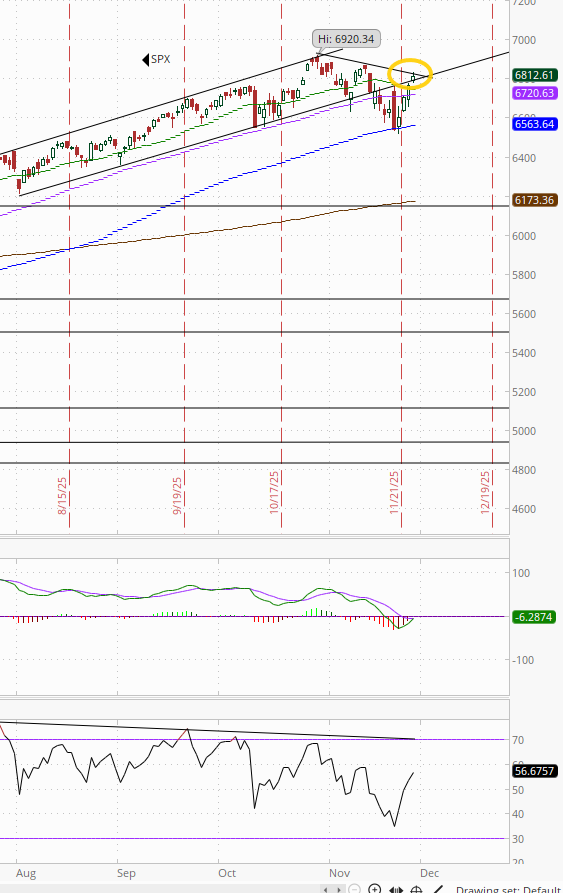
The SPX now up against its downtrend line from the highs. The daily MACD remains in “sell longs” positioning, but it is close to turning more positive, and the RSI is back above 50.
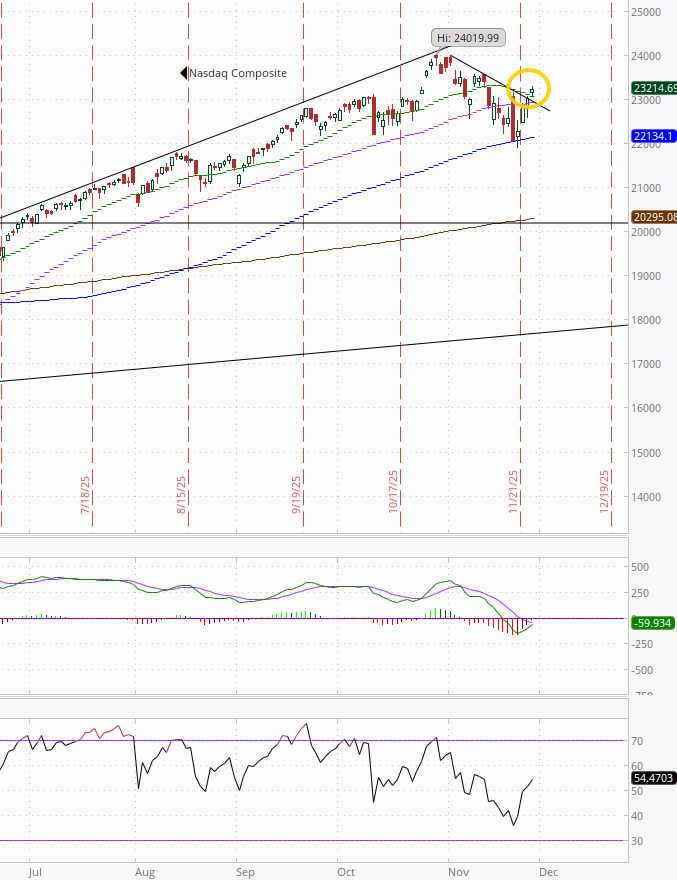
The Nasdaq Composite though is through its downtrend line with just the old highs as resistance.
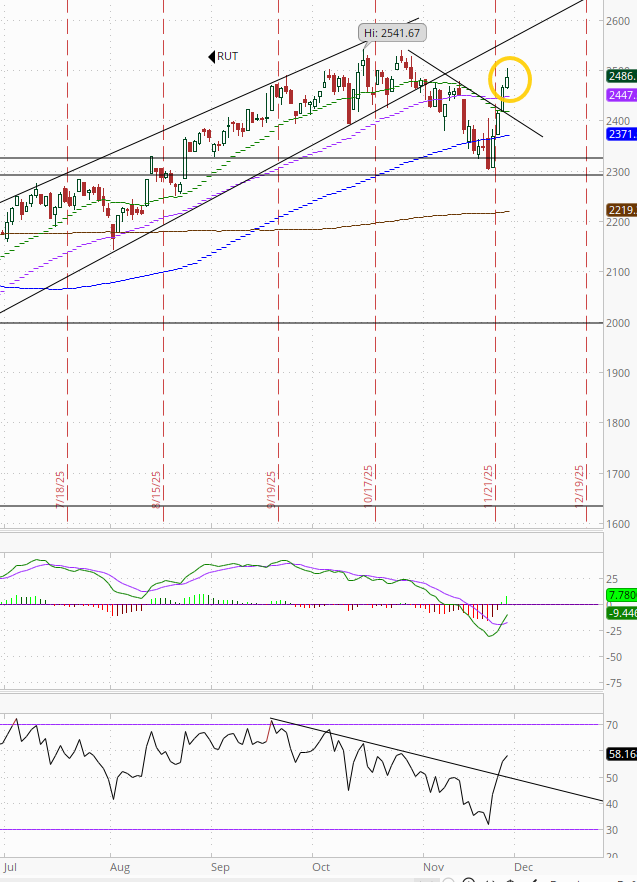
RUT (Russell 2000) similar to the Nasdaq but has seen its daily MACD cross to “cover shorts” and RSI is breaking out over 50 as noted Tues.
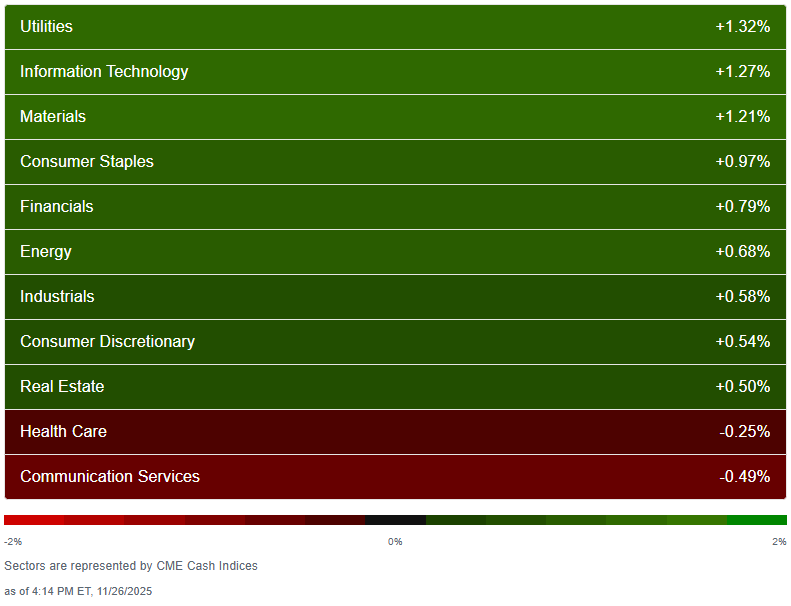
Sector breadth from CME Cash Indices improved to 9 of 11 sectors higher (so we’ve seen at least 8 higher every day since Friday) and no sector down more than -0.5% (Comm Services (note that was slightly higher on the SPX)). Health care saw a rare down day -0.25%.
In contrast every green sector was up that much or more, with four up around 1% or more (down from seven though Tues), led by Utilities and Tech +1.3%.
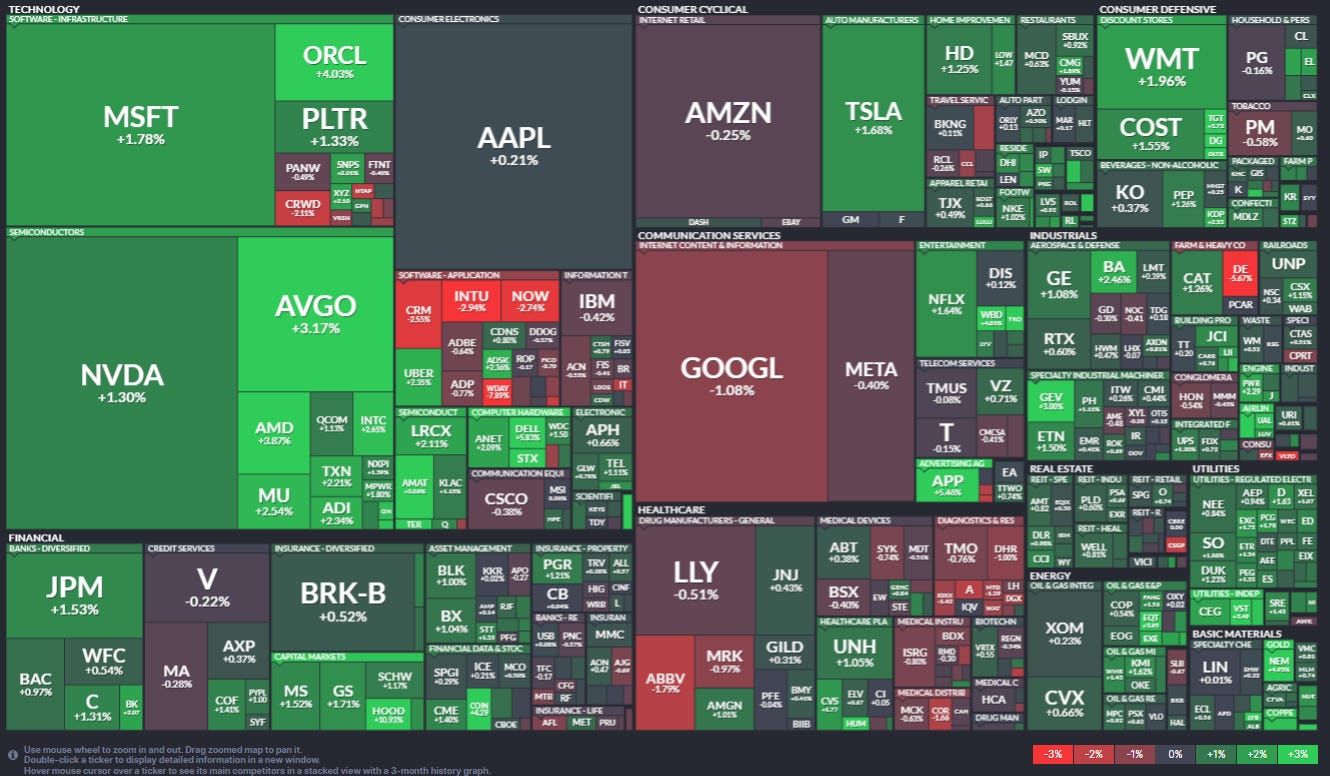
SPX stock-by-stock flag from @finviz.com consistent with a little less green overall and a lot less “bright” green (>3% gains) outside of Tech. Not much bright red either though. Notable reversals in Energy and Utilities (red to green) and Health Care (the opposite).
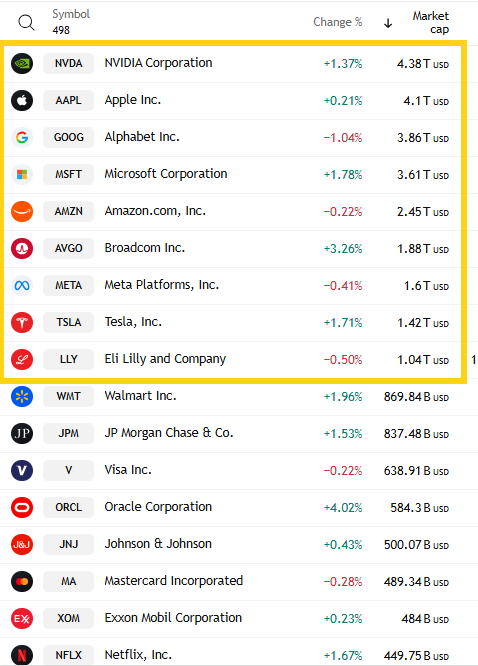
The top of the SPX a little more mixed with four of the top 9 (trillion-dollar club) lower (after one Tues, none Mon) but the worst was GOOG at just -1%. Leading to the upside was AVGO +3.3% now up +16.3% this week. NVDA, MSFT, TSLA were also up over 1%. Mag-7 was +0.4% taking its gains this week to +4.6% easily on track to break its three-week losing streak.
~24 SPX components were up 3% or more, down from ~70 Tues, 40 Mon and 130 Fri (but also up from just 3 Thurs), led by Robinhood HOOD +10.1%. Six >$100bn in market cap were up that much in HOOD, APP, ORCL, AMD, AMAT (for a third session), GEV (in descending order of percentage gains), after 10 Tues, 18 Mon.
Again just 2 SPX components down -3% or more down from 10 Mon, 9 Fri, and 68 Thurs led by Workday WDAY -7.9%. Deere DE was the other (-5.7%) both >$100bn in market cap.
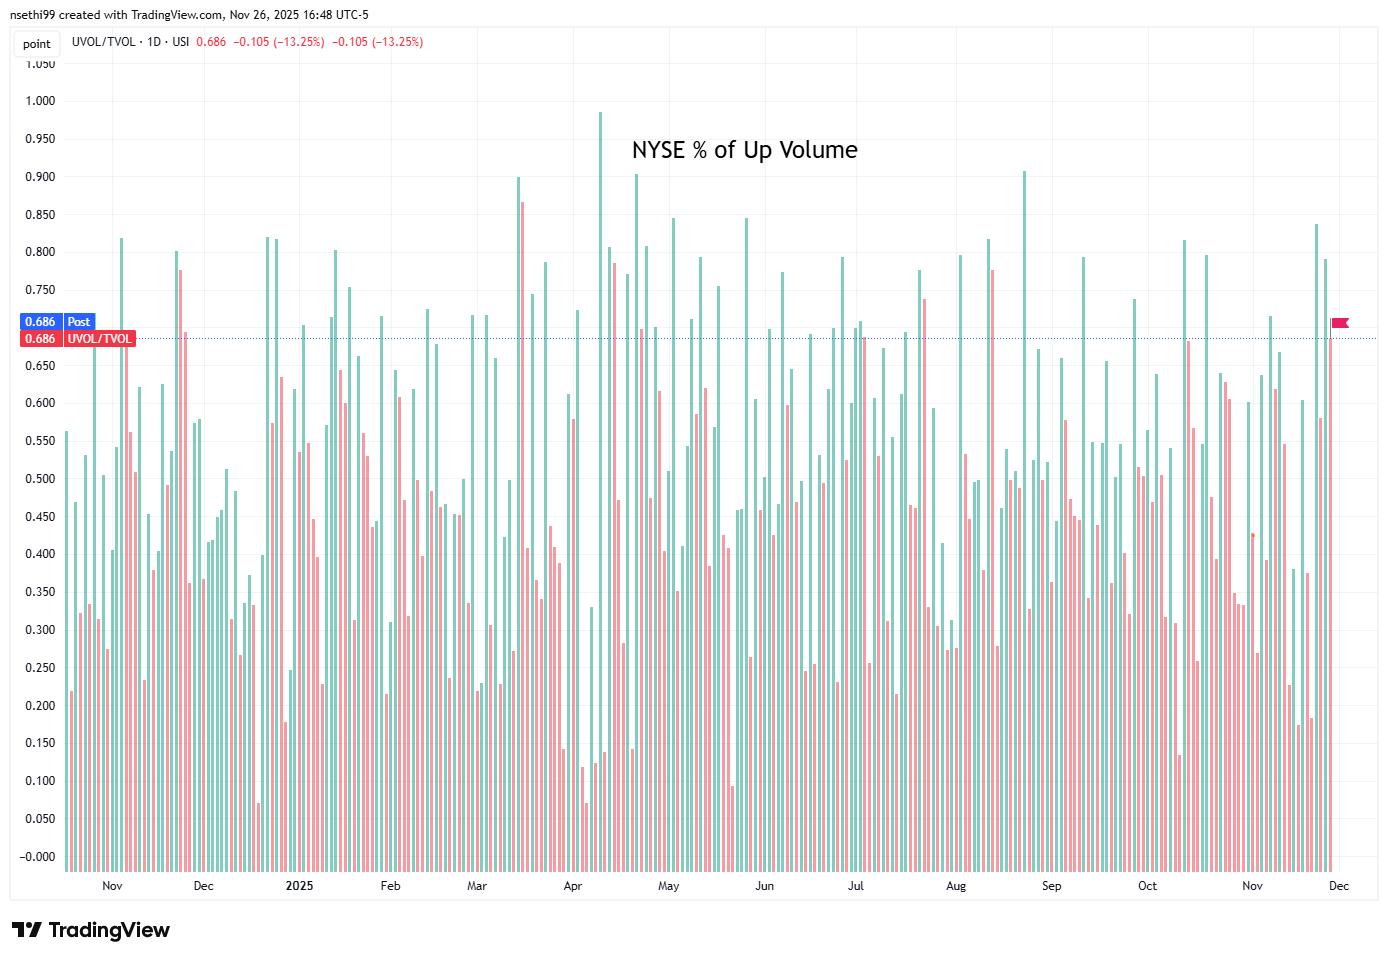
NYSE positive volume (percent of total volume that was in advancing stocks) fell back to 68.6% in line with the lower equity gain of +0.75%.
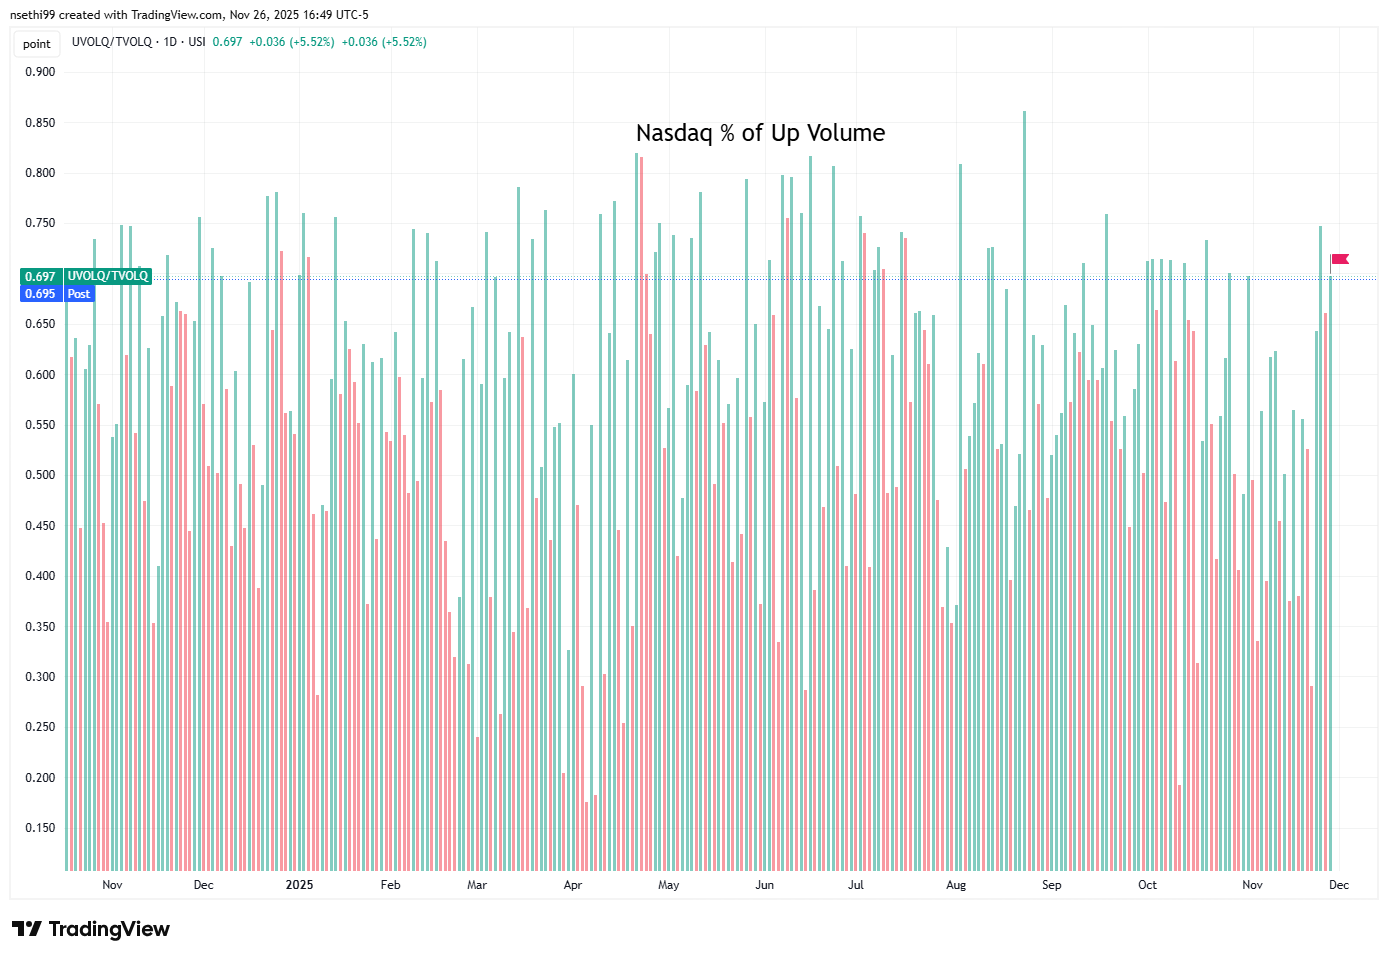
Nasdaq positive volume (% of total volume that was in advancing stocks) improved to 69.7% slightly outperforming the index gain of +0.82%
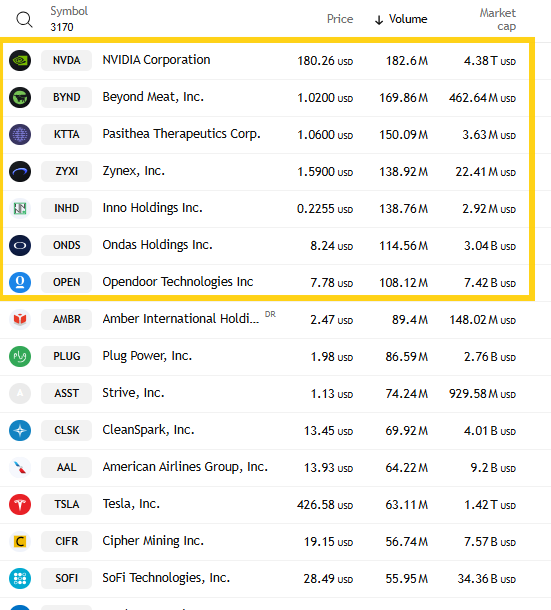
Speculative volumes were low as apparently retail traders were busy with other things, with the top stock by volume in the Nasdaq (in a rarity not a penny stock but NVDA) saw “just” 182mn shares traded down from 641mn shares for the top stock Tues and just a fraction of the 1.4bn we saw early last week.
7 stocks in total traded over 100mn shares the same as Tues, down from 8 Mon, 10 Fri and 12 early last week.
Positive issues (percent of stocks trading higher for the day) which are not as inflated by penny/meme stocks remained close to volumes at 66% on the Nasdaq while the NYSE was at 69%.
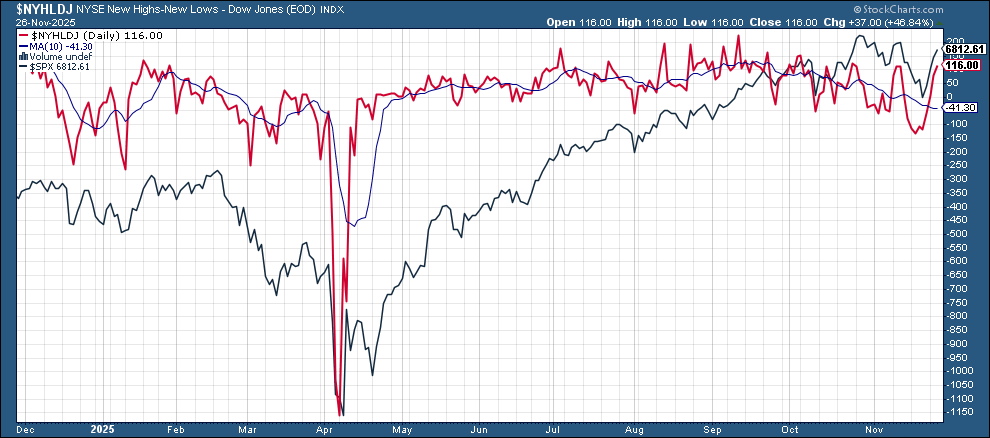
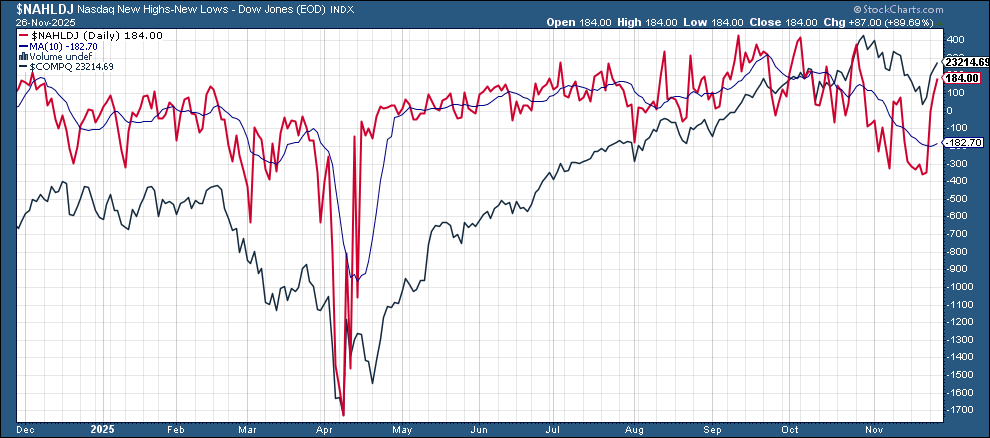
New 52-wk highs minus new 52-wk lows (red lines) continued their improvement to 115 from 79 Tues, 8 Mon, and -115 last Thurs on the NYSE and 179 from 97, -1, and -357 on the Nasdaq, the last of which was the least since April.
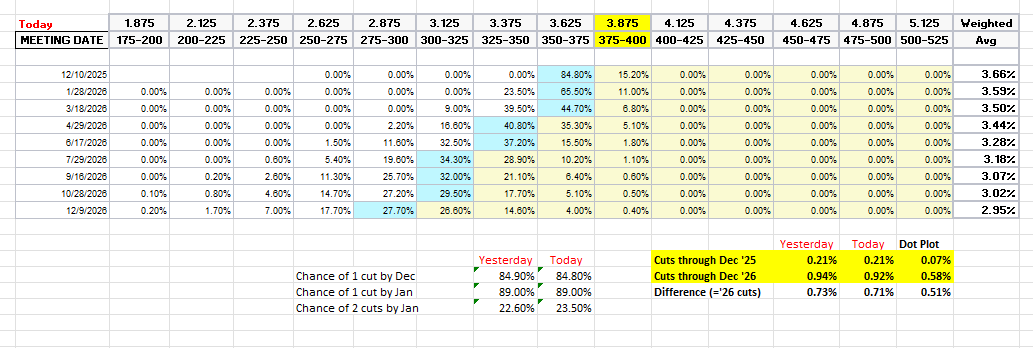
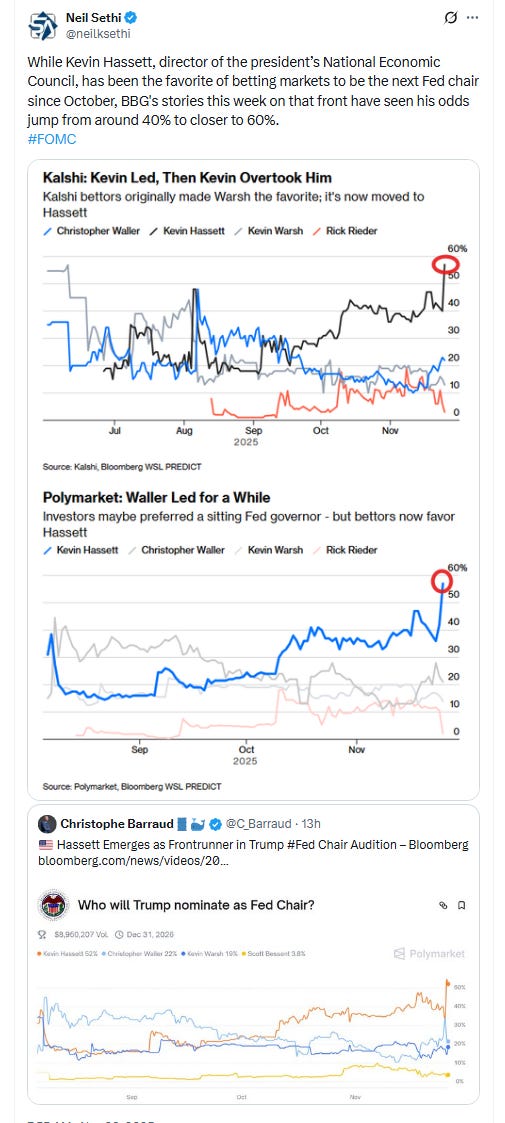
Odds on a Dec #FOMC rate cut saw almost no change with pricing for December at 85%, the highest since the Oct FOMC, up from 72% Friday and 33% a week ago, although still down from 100% Oct 16th.
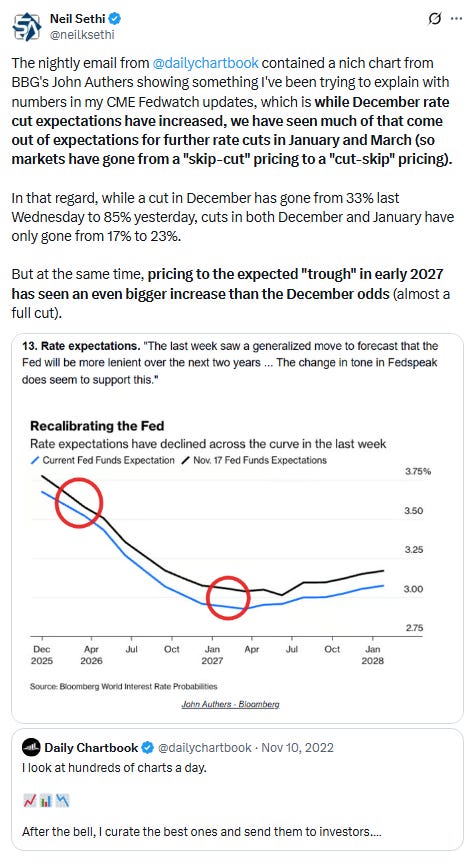
A cut by Jan remained at 89% (also the best since Oct 16th (96%)), but cuts at both the Dec & Jan meetings remained at 23% barely up from 20% Wed.
But pricing for 2026 eased back -2bps to 71bps (down from 80bps Thurs which was highest we’ve been for 2026 cuts), and total cuts through Dec ‘26 eased to 92bps (down from 103bps pre-Oct FOMC which was the highs of the year (for cuts from December on)).
As a reminder the average dot on the dot plot has ~60bps of total rate cuts through Dec ‘26 from this point, so over a cut off.
I said after the big pricing out of cuts in January (and again in February) that the market had pivoted too aggressively away from cuts, and that I continued to think cuts were more likely than no cuts, and as I said when they hit 60 bps “I think we’re getting back to fairly priced (and at 80 “maybe actually going a little too far” which is definitely where we were Apr 20th (a little too far) at 102bps). I said the day before July NFP “now it seems like we’re perhaps getting back to too few cuts”. I thought at 76bps heading into the Sept FOMC we were perhaps a bit overdoing it, but continued to expect at least 50bps this year (which we’ve now gotten) but probably not a lot more than that (which has been my call since last December). I said I thought we got back to overdoing it when over 50bps of rate cuts were priced for the rest of the year Oct 16th. I had said “while 50bps is my base case it’s less than 100% I think.” I then said we were pushing a bit to far when we got into the low 40% and under range, but now we’re back up over 80% which I think may be a touch high, but it certainly feels like Powell sent out the doves to talk it back up which means it’s almost certainly more likely than not.
Also remember that these are the construct of probabilities. While some are bets on exactly one, two, etc., cuts some of it is bets on a lot of cuts (3+) or none (and may include a hike at some point)
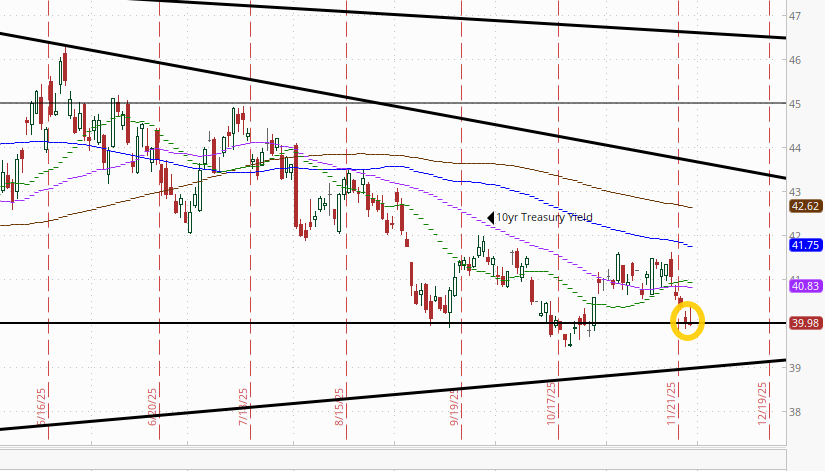
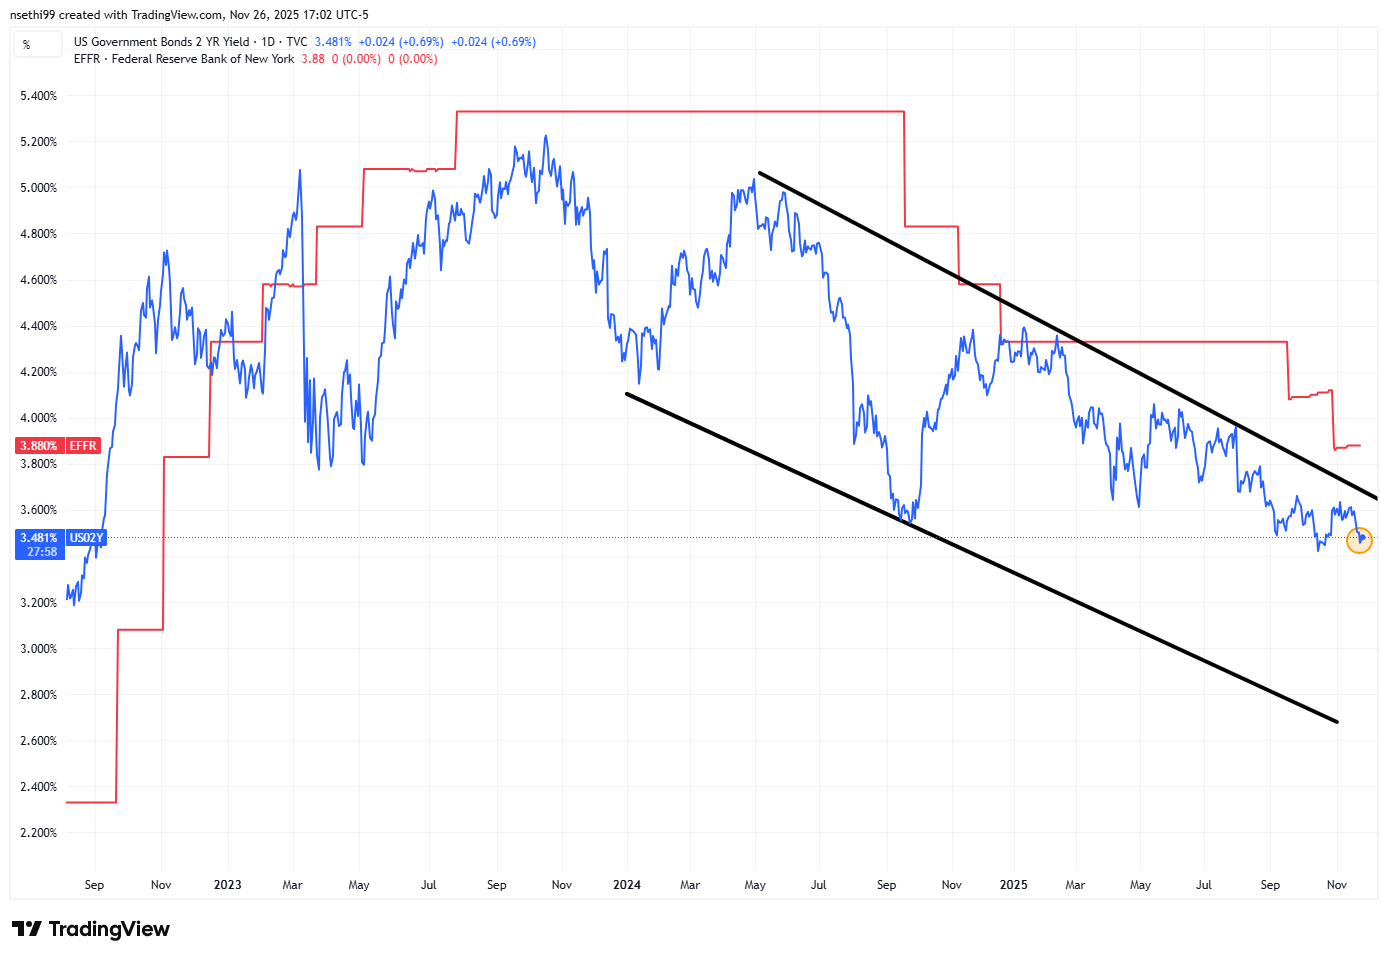
The 10yr #UST yield closed juuust under 4% at 3.998%, the lowest close since Oct 29th.
The 2yr yield, more sensitive to FOMC rate cut pricing, was +2bps to 3.48% from the lowest this month and still just 6bps from the bottom of the range since late August. It is 40bps below the Fed Funds midpoint.
The Effective Fed Funds Rate (red line) remained at 3.88% slightly above the Fed Funds midpoint and up 5bps since Sept, evidence of continued growing stresses in funding markets that will likely see the Fed adding assets to its balance sheet soon.
I had said when the 2yr yield it was around 4.35% (in Jan & again early Feb) that I found the 2-yr trading rich as it was reflecting as much or more chance of rate hikes as cuts while I thought it was too early to take rate cuts off the table (and too early to put hikes in the next two years on), but then the 2yr fell to 3.65% past where I thought we’d see it, so I took some exposure off there. We got back there but I never added back what I sold, so I stuck tight. Ian Lygan of BMO said on his weekly podcast he now sees it at 3.3% by year’s end (but sees risk to the downside), but I still took some off Sept 5th at 3.5%. I have been waiting for ~3.90% to add back but it seems now that ship might have also sailed.
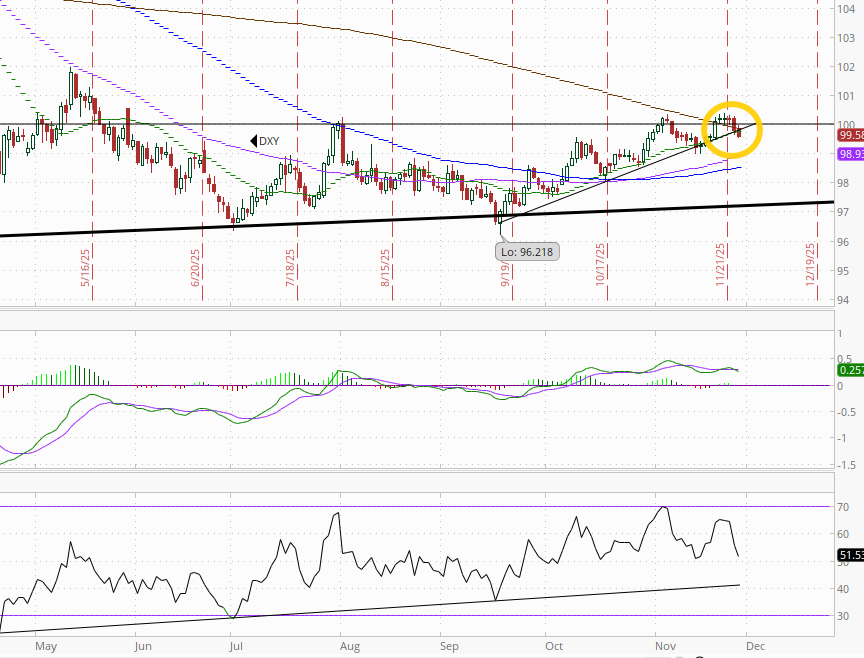
The $DXY dollar index (which as a reminder is very euro heavy (57%) and not trade weighted) fell for a third session from the highest since May, now starting to break its uptrend line from Sept. The daily MACD and RSI have softened back to neutral.
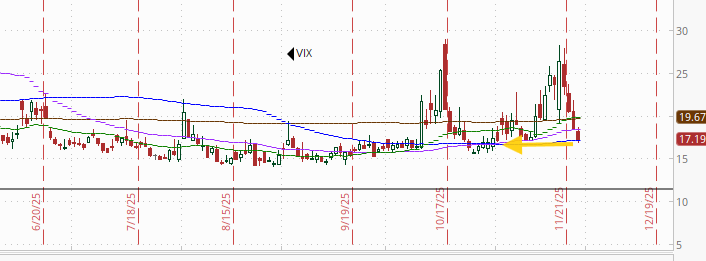
VIX fell back for a fourth session to 17.2, the lowest close since October after the highest since April last Thurs. The current level is consistent w/~1.08% average daily moves in the SPX over the next 30 days.
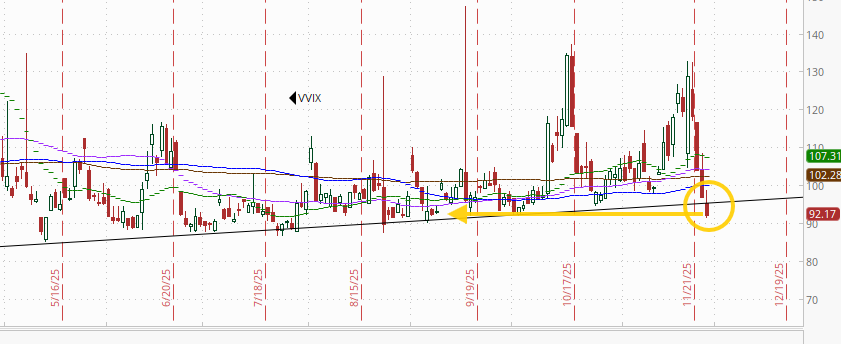
The VVIX (VIX of the VIX) has seen an even larger pullback now down to 92.2, the lowest close since late Aug and well below Nomura’s Charlie McElligott’s breakeven “stress level” of 100 (consistent with “moderate” daily moves in the VIX over the next 30 days (normal is 80-100)). More notably, it is the furthest it’s been under that trendline running back to March that it has bounced from numerous times since then.
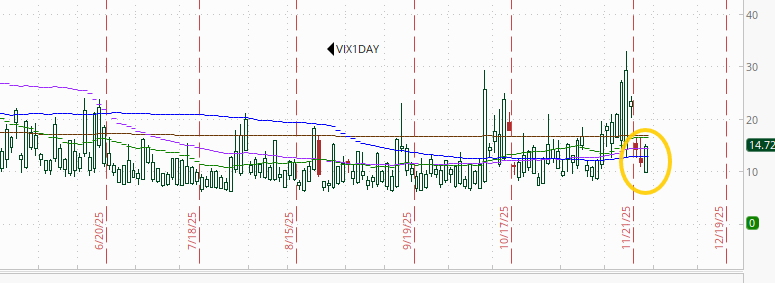
1-Day VIX unlike the VIX and VVIX popped higher, I assume due to the day off Thursday, in its case to 14.7. That level implies a ~0.91 move in the SPX next session.
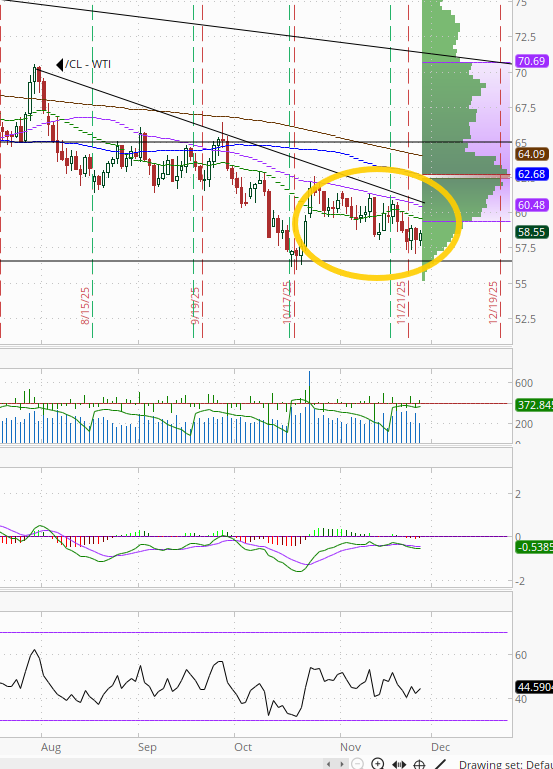
#WTI futures saw a small gain but overall continue to set mostly lower highs the past month as they slowly deteriorate. The MACD and RSI have softened to more negative reads as noted Friday.
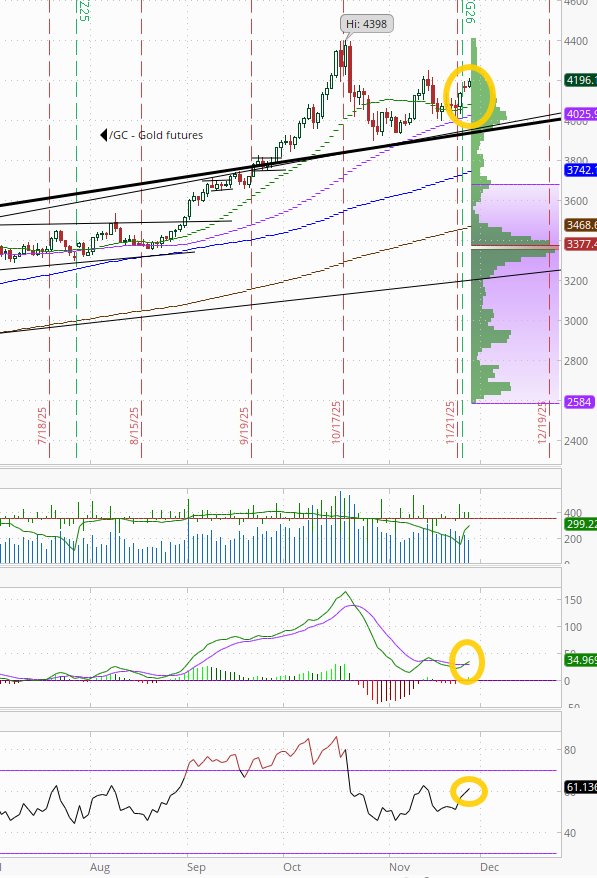
Gold futures (/GC) up for a third session (+3.2% over that time) as they continue to look to break out of their consolidation since peaking a month ago. Daily MACD has now flipped to “go long” positioning, and the RSI is over 60.
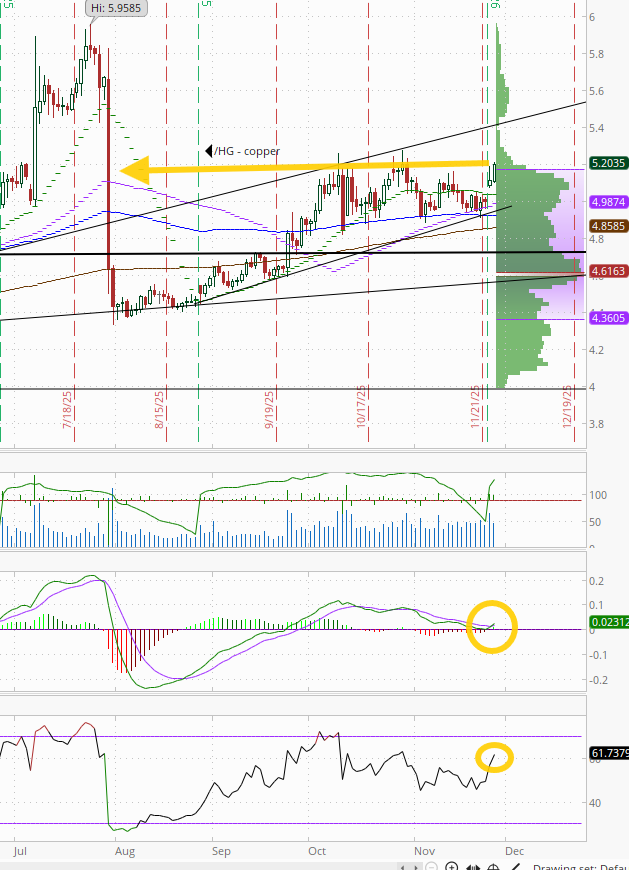
US copper futures (/HG) were up +1.8% Wed to what was actually the highest close since the July meltdown.
In addition, the daily MACD has crossed to “go long” positioning, and RSI has pushed over 60. Longer term, they remain in the grinding uptrend since August (and longer than that in the uptrend started in March 2020).
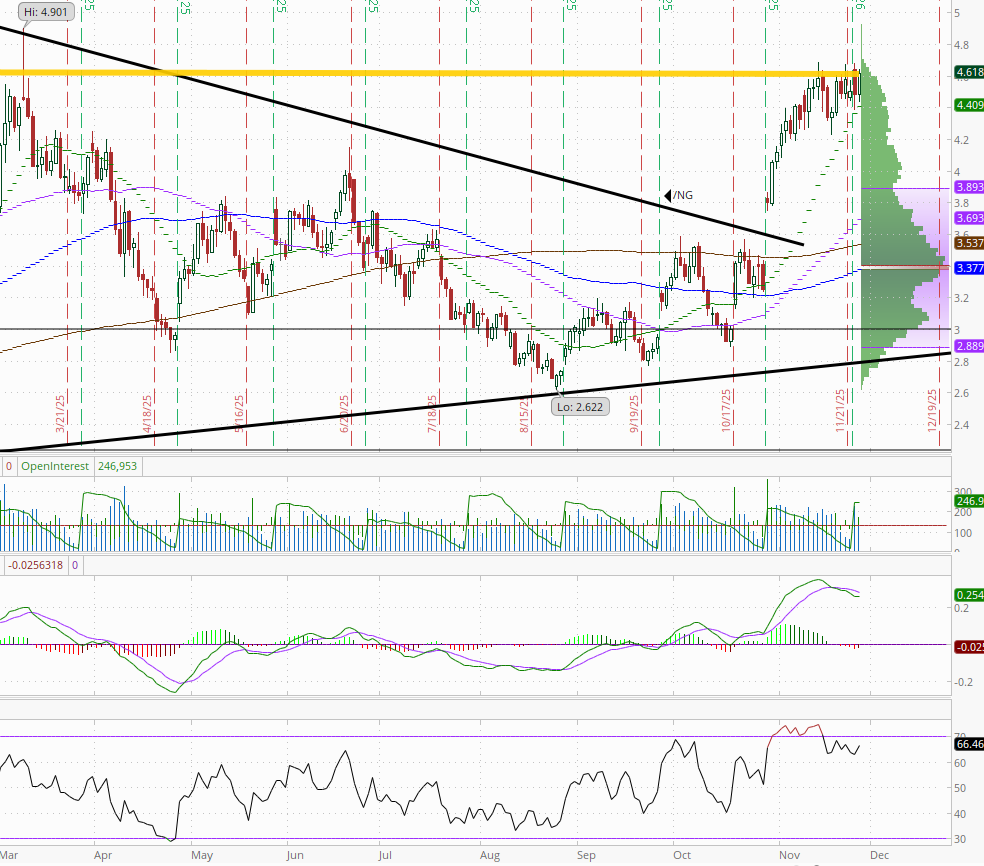
Natgas futures (/NG) similarly were +3% Wed to the highest close since Dec ‘22. Their technicals aren’t as strong through with daily MACD remaining in ‘sell longs’ positioning, and the RSI having fallen from above to under 70. But as I mentioned Monday “those metrics haven’t deteriorated much further.”
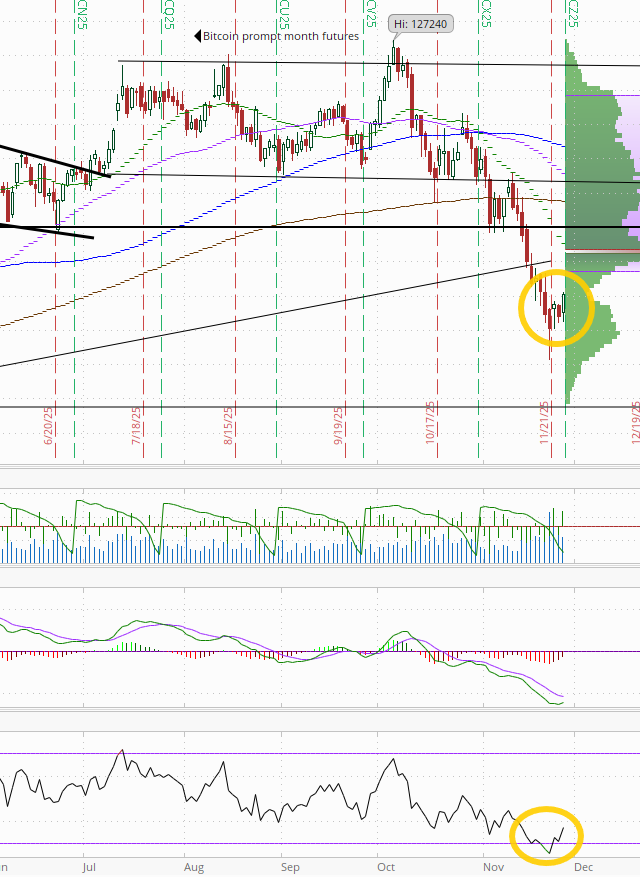
Bitcoin futures up +3.6% Wed to a 1-week high as they look to rebound from a nearly -40% drop from the highs.
The daily MACD remains in “go short” positioning but is improving, and the RSI has bounced back over 30 from the weakest since June ‘22, which can be the sign of a bottom as noted Monday. As I said Friday “seems the selloff is getting long in the tooth.”
The Days Ahead
US markets will be closed Thursday before reopening for a half-session on Friday.
No major economic data though scheduled for Friday, and no Treasury auctions, Fed speakers, or SPX earnings releases scheduled either.
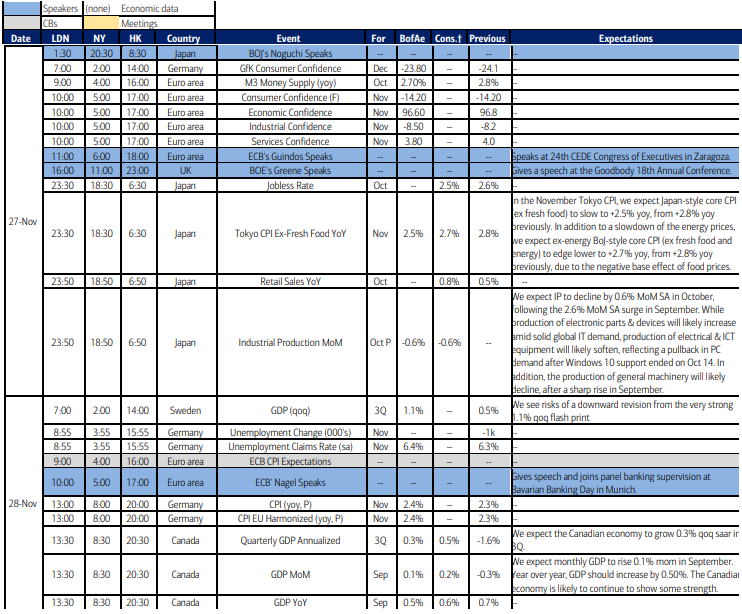
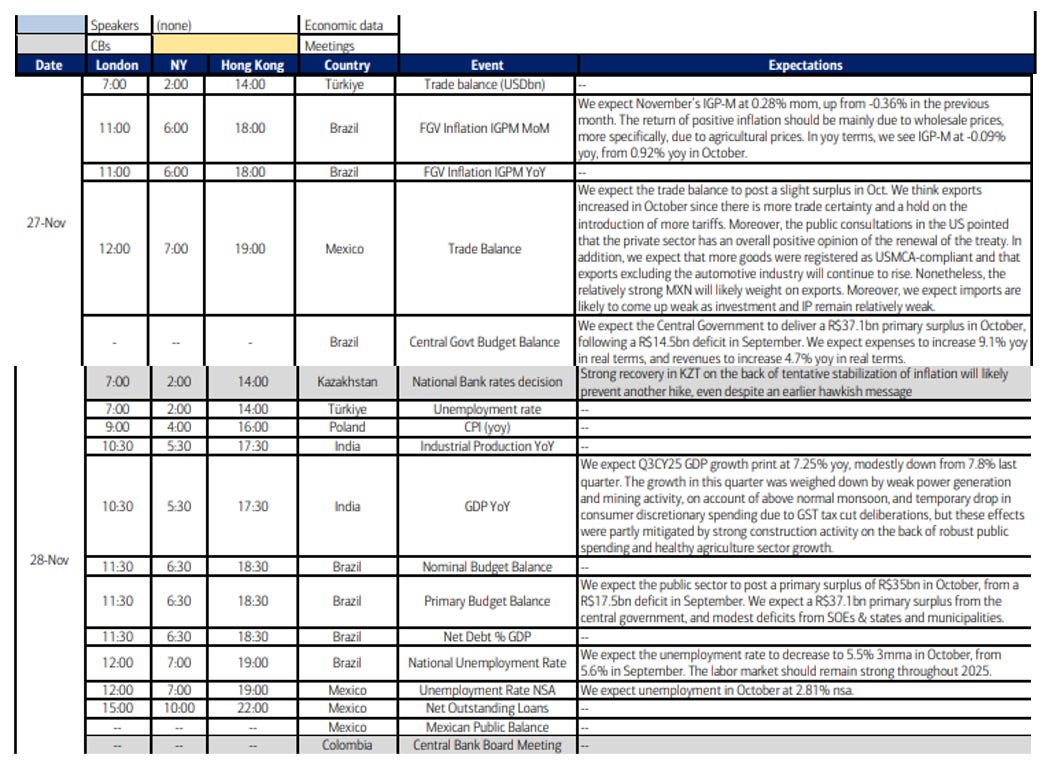
Ex-US DM highlights the next two days include EU economic/biz confidence, CPI from Germany, France, Italy, and Spain, German consumer confidence and unemployment, Japan unemployment, retail sales, industrial production and Tokyo CPI, and Canada and Sweden GDP.
In EM highlights are policy decisions in S Korea, Kazakhstan and Columbia, Poland CPI, India GDP, S Korea industrial production and retail sales, Brazil inflation, budget balance, and employment and Mexico also has the latter two plus trade balance.

Link to X posts - Neil Sethi (@nelksethi) / X
To subscribe to these summaries, click below (it’s free!).
To invite others to check it out,