
Markets Update - 11/28/25
Update on US equity and bond markets, US economic reports, the Fed, and select commodities with charts!

To subscribe to these summaries, click below (it’s free!).
To invite others to check it out (sharing is caring!),
Link to posts - Neil Sethi (@neilksethi) / X
Note: links are to outside sources like Bloomberg, CNBC, etc., unless it specifically says they’re to the blog. Also please note that I do often add to or tweak items after first publishing, so it’s always safest to read it from the website where it will have any updates.
Finally, if you see an error (a chart or text wasn’t updated, etc.), PLEASE put a note in the comments section so I can fix it.
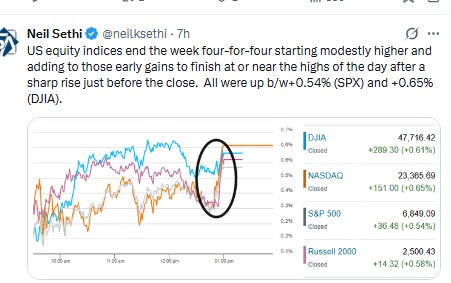
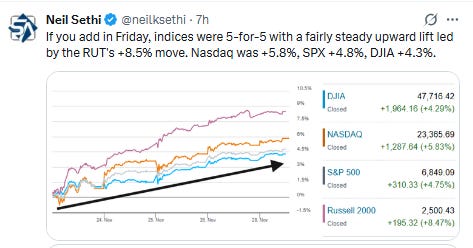
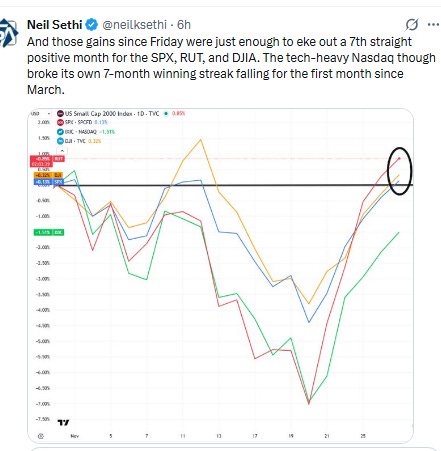
US equity indices opened trading on Black Friday modestly higher but only after an extended outage in futures following a “cooling issue” at a Chicago Mercantile Exchange data center as Wall Street as treaders returned from the Thanksgiving holiday for a shortened trading session that was as usual one of the lightest volumes of the year. As with the previous three sessions this week, equities saw some initial chop before heading higher, but unlike Wednesday saw a notable last-minute jump to finish at or near the highs of the day. It capped one of the best Thanksgiving weeks in years with equities advancing each of the four sessions. Adding in Friday, indices were five-for-five led by the RUT’s substantial +8.5% move. Nasdaq was +5.8%, SPX +4.8%, DJIA +4.3%, and those gains were juuust enough to eke out a 7th straight positive month for the SPX, RUT, and DJIA. The tech-heavy Nasdaq though broke its own 7-month winning streak falling for the first month since March.
Elsewhere, Treasury yields edged higher, the dollar lower. Gold though was again higher, and again joined by copper, natgas, bitcoin, and crude.
The market-cap weighted S&P 500 (SPX) was +0.5%, the equal weighted S&P 500 index (SPXEW) +0.5%, Nasdaq Composite +0.7% (and the top 100 Nasdaq stocks (NDX) +0.8%), the SOXX semiconductor index +1.8%, and the Russell 2000 (RUT) +0.6%.
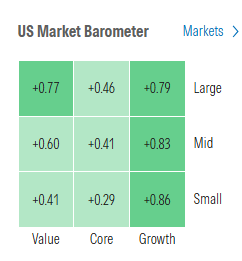
Morningstar style box shows widespread gains for a fifth session Friday with a growth tilt.
Market commentary:
“We’re building up for a classic year-end rally,” said Daniel Murray, chief executive officer of EFG Asset Management Switzerland. “Our main scenario is one where actually the macro environment continues to hold up well into 2026, the corporate earnings outlook looks pretty decent and you get the added tailwind of the lagged effect of rate cuts.”
“The spillover from the Thanksgiving holiday and the fact there is no US data may on the face of it lessen the impact,” said Daniel Noorian, head of execution and quantitative services at Liquidnet.
“For now we are in somewhat of a holding pattern ahead of the limited return of the US to market. Traders will be hoping that the outage is resolved before certain US cash markets come online later.”
— Adam Linton, macro strategist.
“For now, the data supports the soft landing, and that contributed to the continued equity rally ahead of Thanksgiving,” wrote Tom Essaye of the Sevens Report. “However, there remain a lot of economic unknowns right now and there are simmering risks that the economy is not as strong as investors believe given the lack of government data in recent months.”
“The mood is back to a bit more of a risk-on sentiment in that the market is now 80% to 85% certain we’re going to get a [Federal Reserve] rate cut in just a couple of short weeks,” Brian Mulberry, client portfolio manager at Zacks Investment Management, told CNBC.
Link to posts - Neil Sethi (@neilksethi) / X for more details/access to charts.
In individual stock action:
The Nasdaq 100 rose 0.8% with Intel Corp. among its biggest gainers. Amazon.com Inc. shares gained 1.8% and Walmart Inc. hit a record on what’s traditionally one of the biggest US shopping days of the year.
Corporate Highlights from BBG:
None today.
Mid-day movers from CNBC:
None today.
In US economic data:
Link to posts for more details/access to charts (all free) - Neil Sethi (@neilksethi) / X
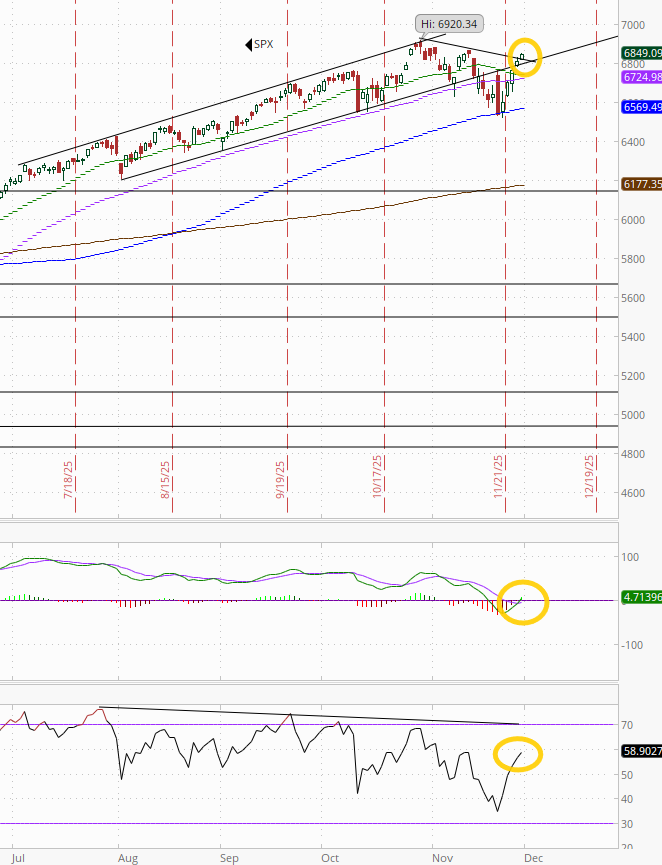
The SPX now through its downtrend line from the highs giving it clear sailing to test them. In addition, the daily MACD has flipped to “go long” positioning, and the RSI is back above 50.
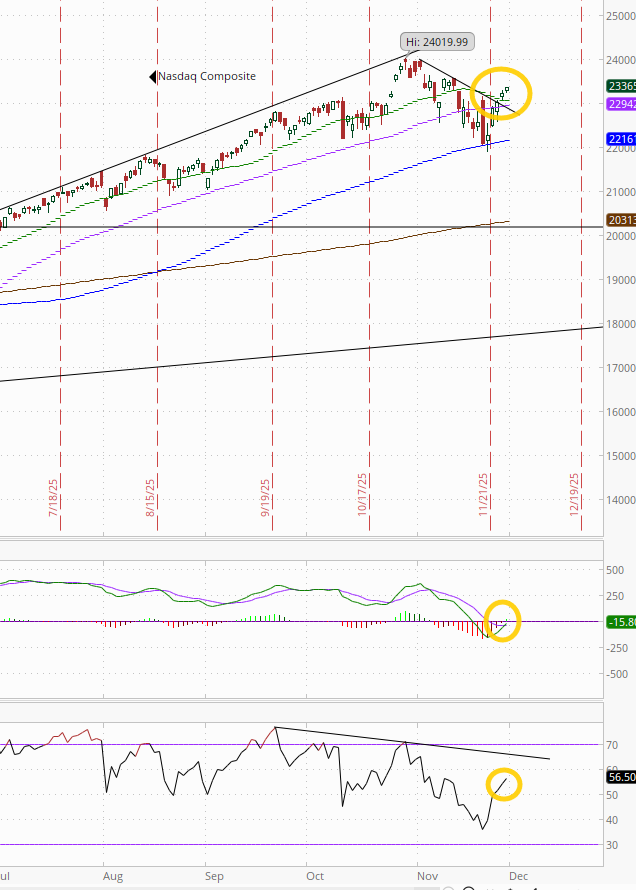
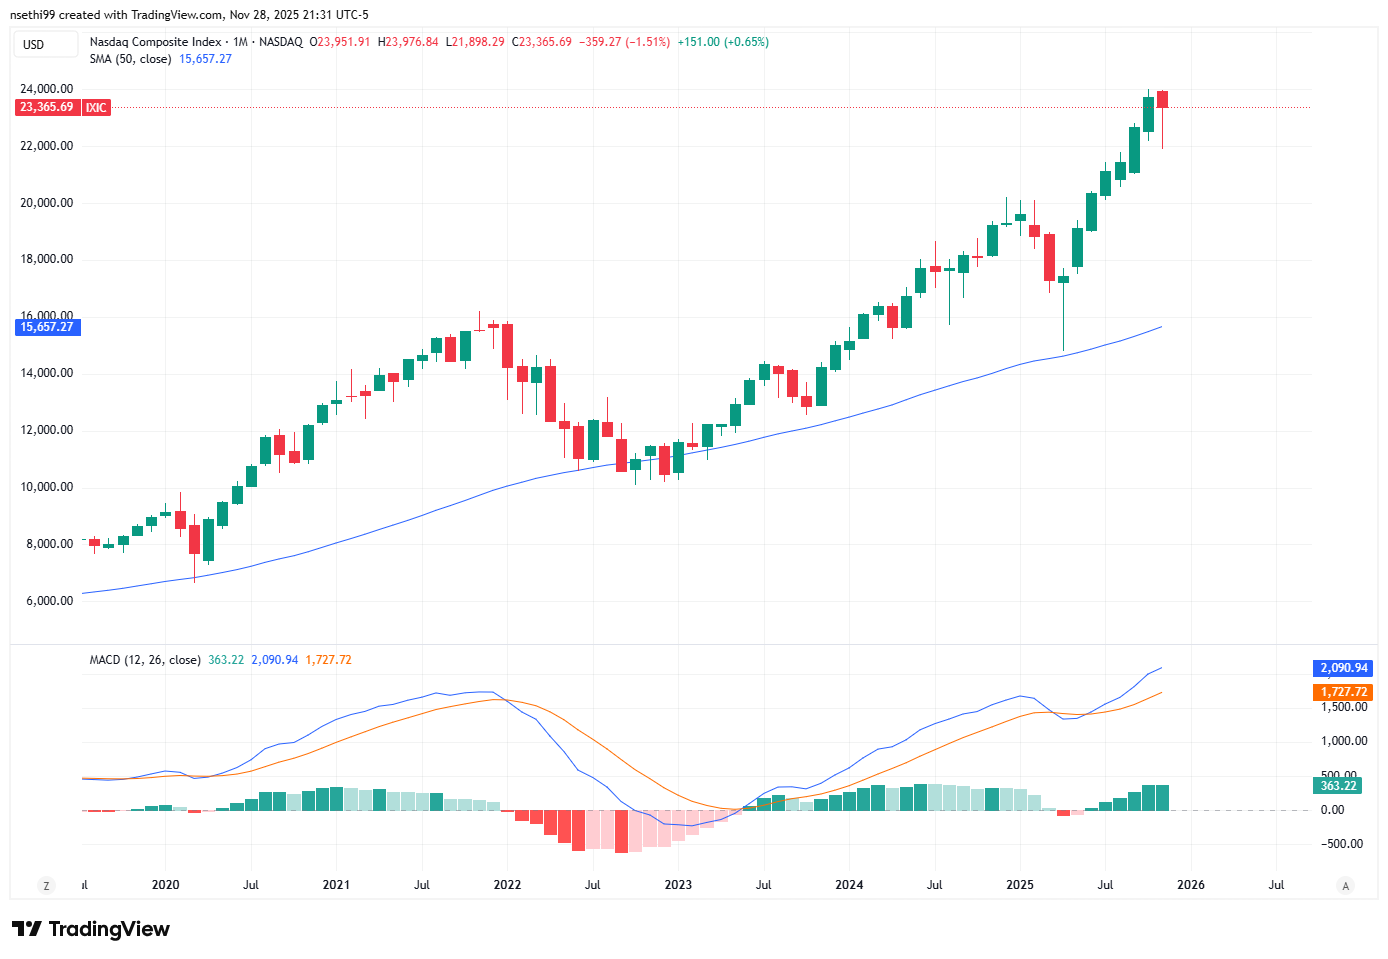
The Nasdaq Composite a similar story (although technically its MACD is “cover shorts”).
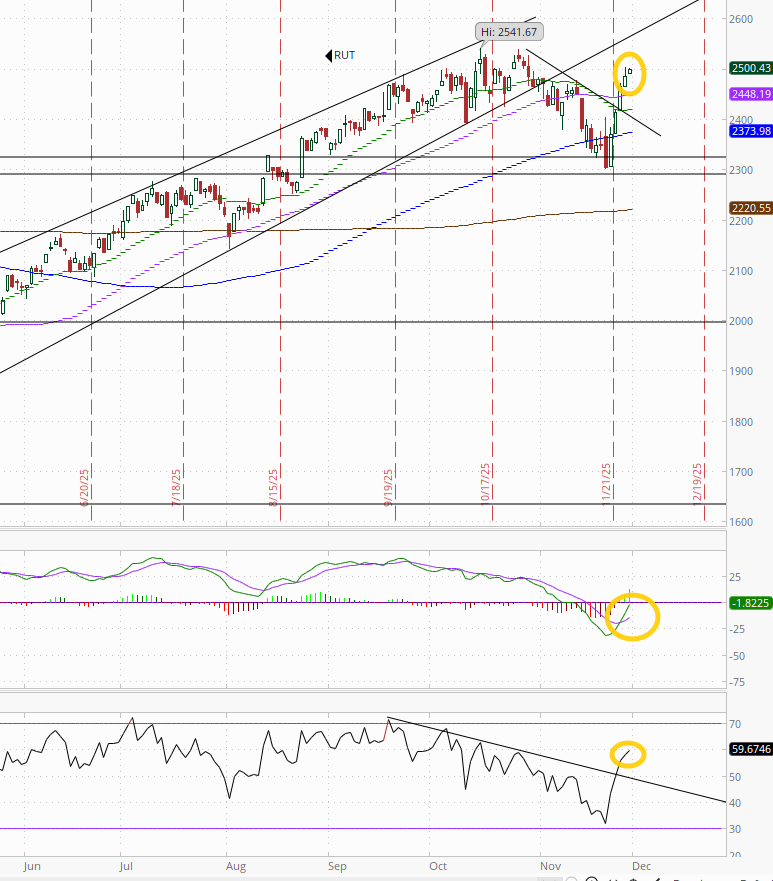
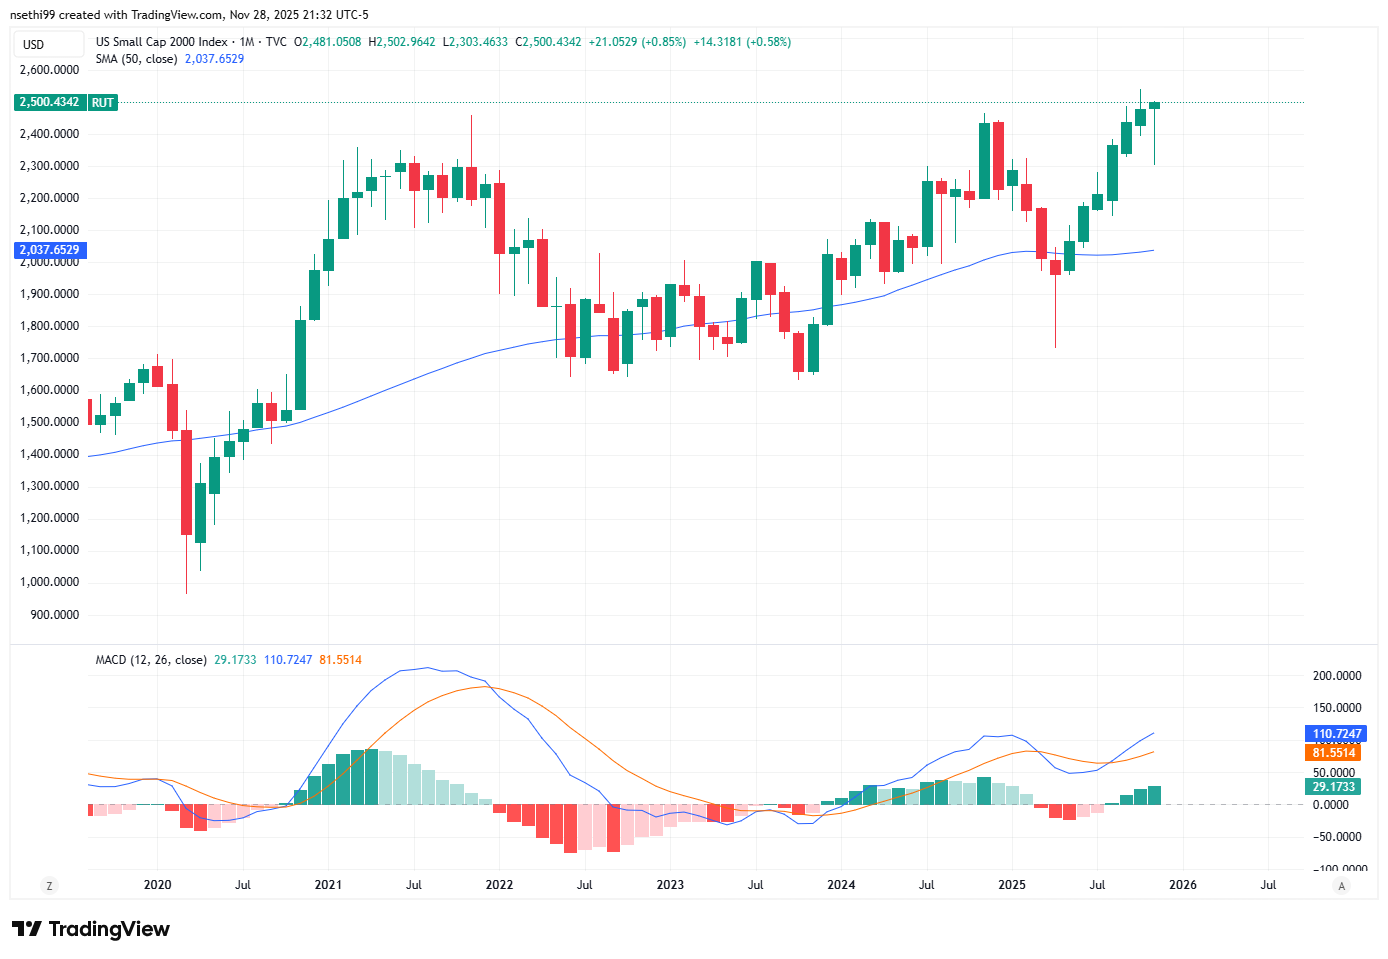
RUT (Russell 2000) similar to the Nasdaq.
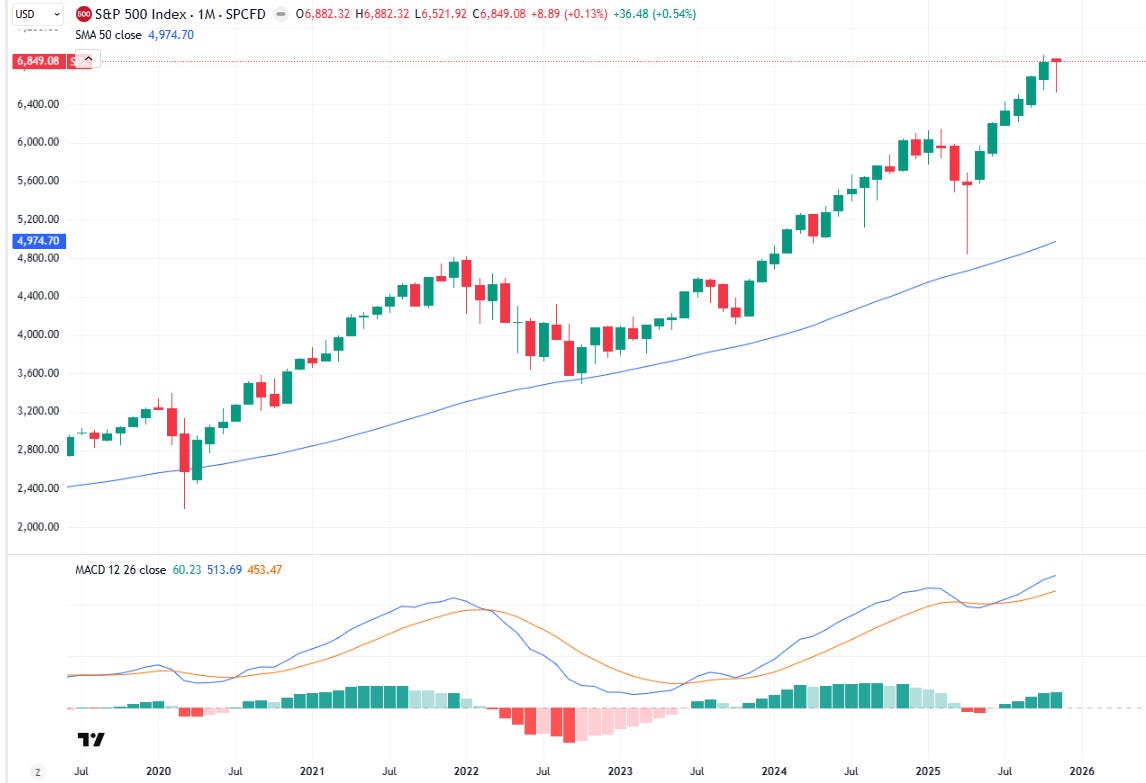
Monthly charts continue to look very healthy.
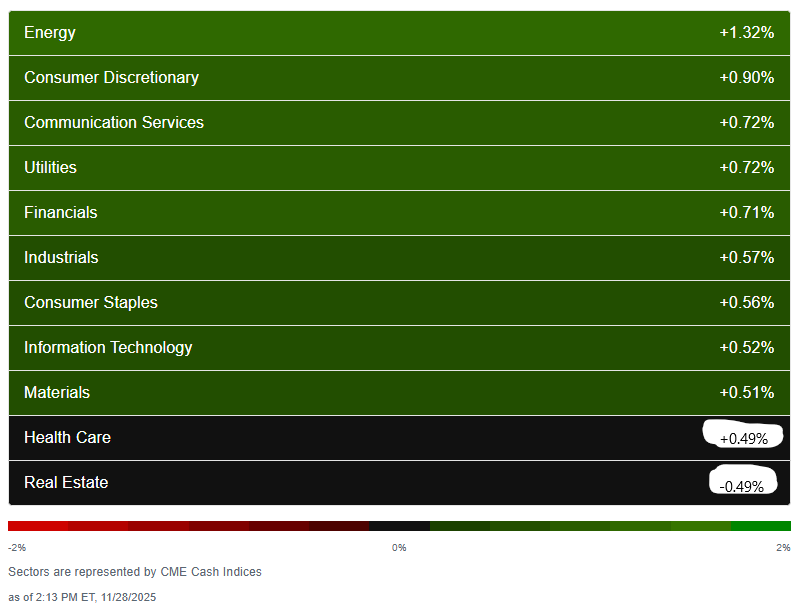
Sector breadth from CME Cash Indices improved to 10 of 11 sectors higher (extending the streak of at least 8 higher to a fifth session), and again no sector down more than -0.5% (note there seems to be a data issue with the CME feed (no surprise), but in terms of the SPX sector ETFs, RE was +0.49% and Health Care was -0.49% (its second down day even as it had its best month since Oct ‘22)).
For a second day every green sector was up +0.5% or more, although just one was 1% or more (down from four Wed, seven Tues), led by Energy +1.3%.
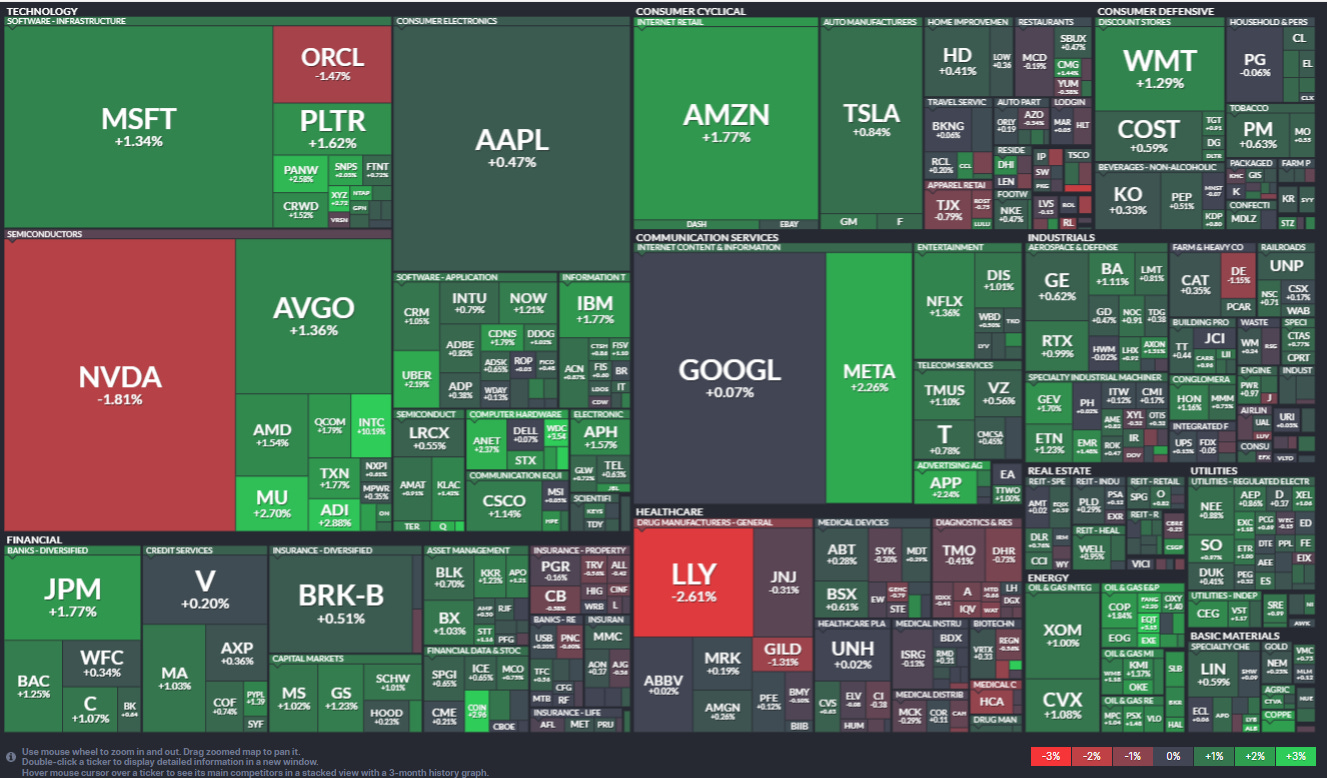
SPX stock-by-stock flag from @finviz_com consistent with a very similar look to Wed with a lot of green overall on the board (although less bright green than Wed which in turn had less than Tues).
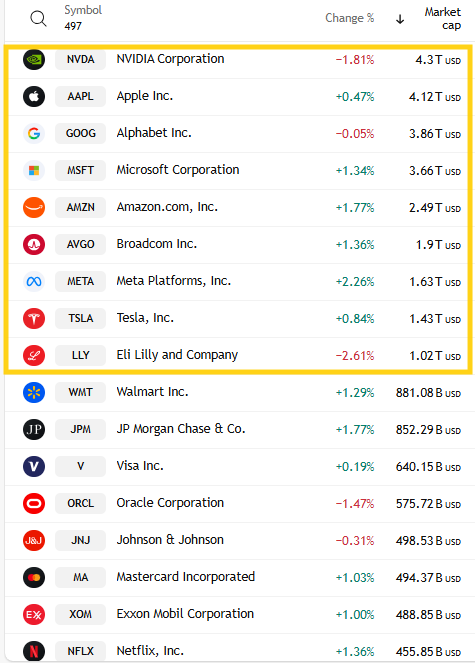
Six of the top 9 (trillion-dollar club) were higher (after five Wed, eight Tues, nine Mon) led by META +2.3%. AVGO added another +1.4% to end the week +18.5%. Leading to the downside Friday was LLY -2.6%. Only NVDA -1.1% though was down over the past week. Mag-7 was +0.6% Friday and +5.1% for the week.
Just 6 SPX components were up 3% or more, down from ~24 Wed, 70 Tues, 40 Mon and 130 Fri, led by Intel INTC +10.2% on a report that it might start building chips for Apple MacBooks. That was also the only >$100bn in market cap up more than 3% after 6 Wed, 10 Tues, 18 Mon.
But no SPX components down -3% or more, only the second time we’ve seen that since mid-summer (Sept 26th) down from 2 Tues, 10 Mon, 9 Fri, and 68 Thurs. The largest SPX decliner was LLY -2.6%.
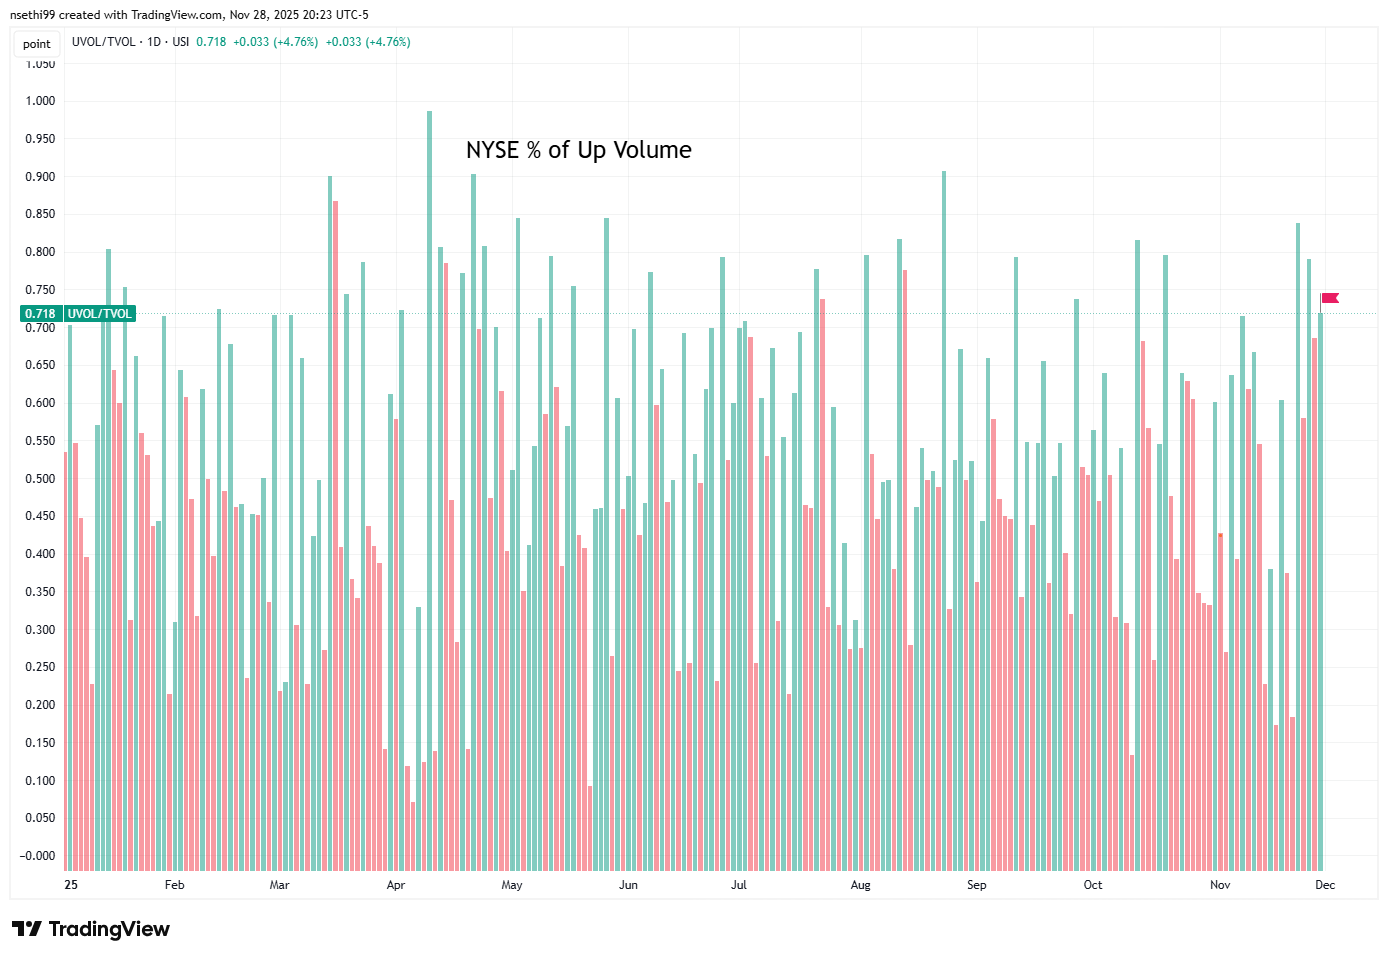
NYSE positive volume (percent of total volume that was in advancing stocks) improved to 71.8% up from 68.6% even as the index gain moderated to +0.51% from +0.75%, so a strong reading.
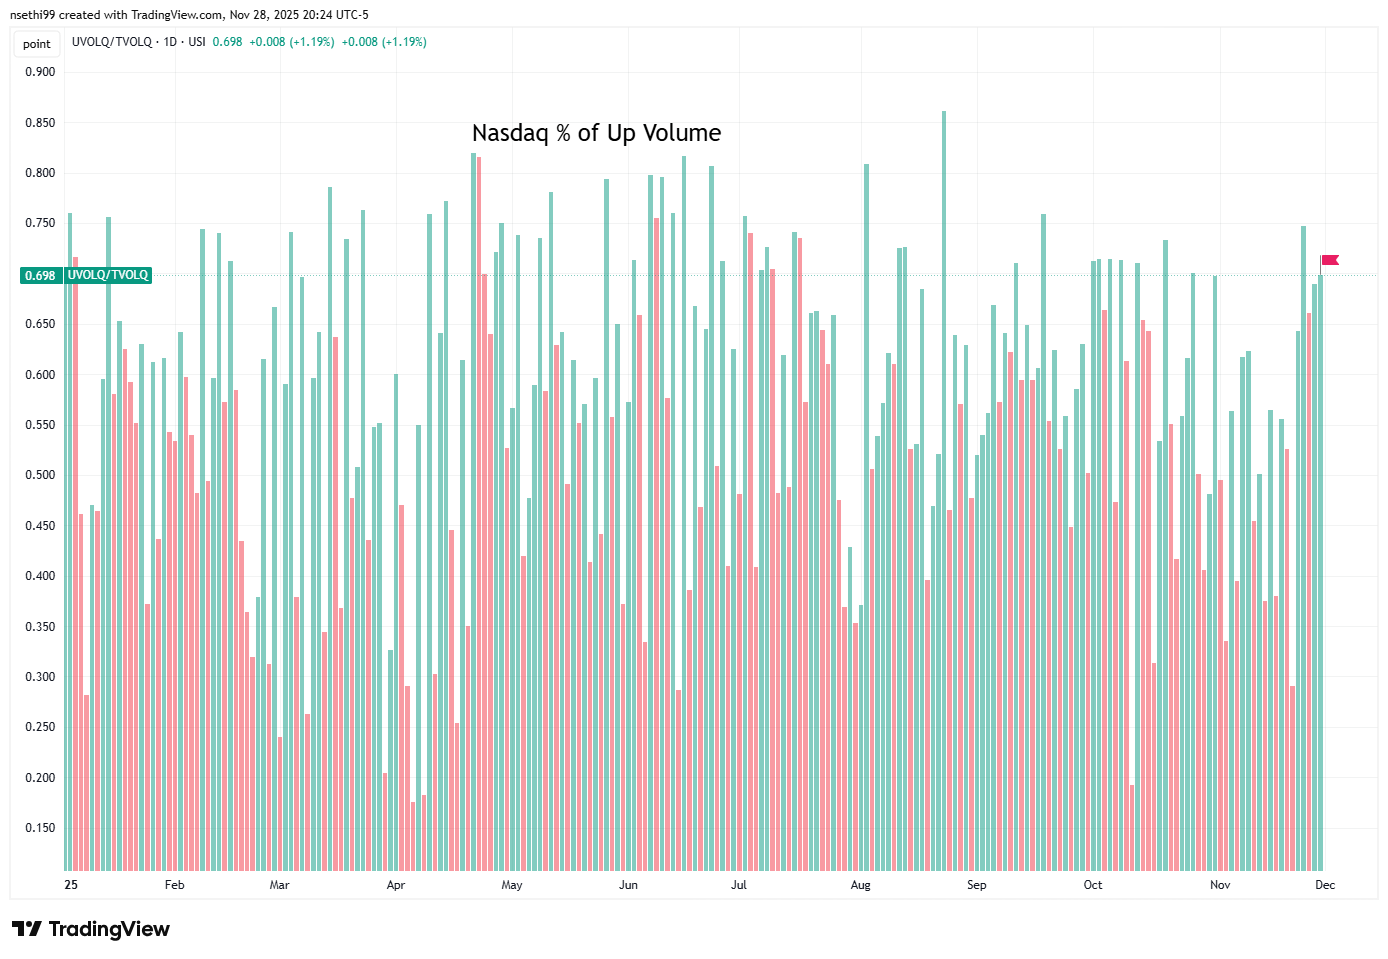
Nasdaq positive volume (% of total volume that was in advancing stocks) similarly moved to 69.8% from 69.7% even as the index gain moderated to +0.65% from +0.82%.
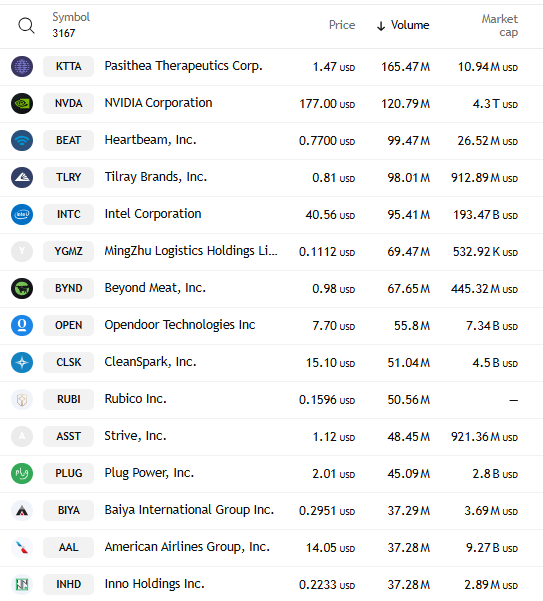
Speculative volumes were very low, but given the overall low volumes no point in going through it (I did though post the top stocks by volume in the Nasdaq if you’re interested).
Just 2 stocks in total traded over 100mn shares down from 7 Thurs, 8 Mon, 10 Fri and 12 early last week.
Positive issues (percent of stocks trading higher for the day) which are not as inflated by penny/meme stocks remained close to volumes at 66% on the Nasdaq while the NYSE was at 69%.
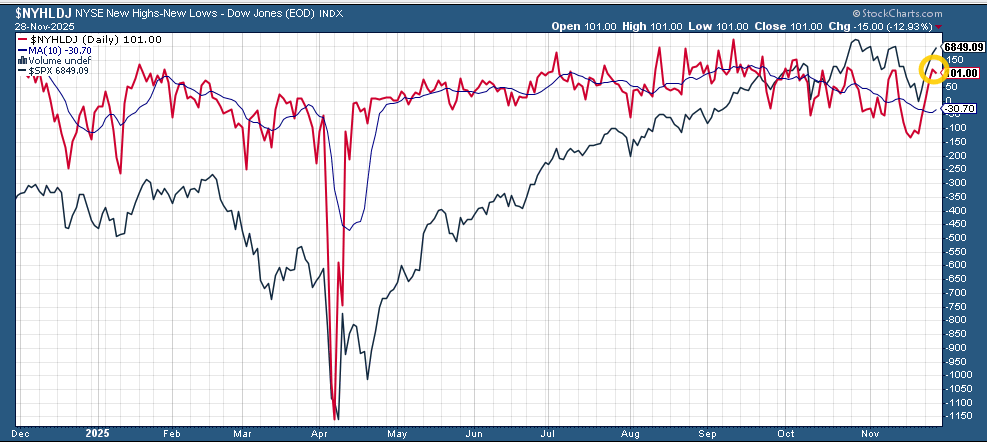
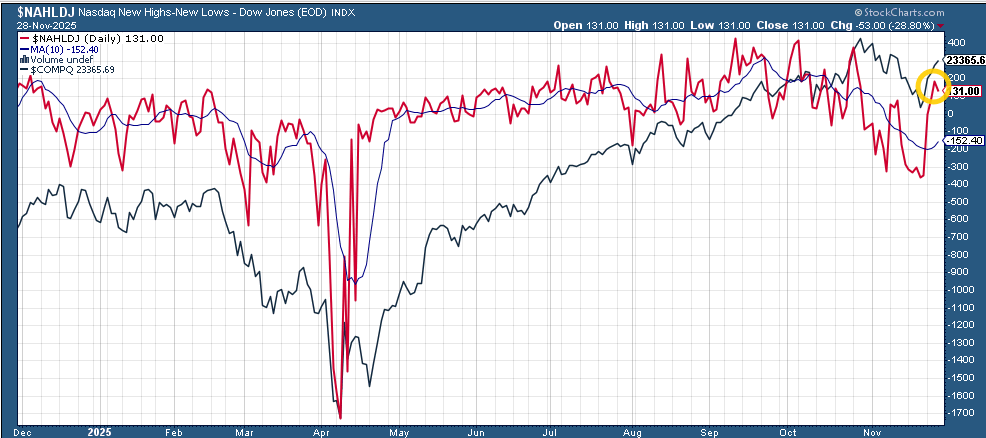
New 52-wk highs minus new 52-wk lows (red lines) were disappointing falling back to 101 from 115 on the NYSE (although still a big improvement from the -115 Nov 20th and 131 from 179 on the Nasdaq, but up from -357 (the least since April).
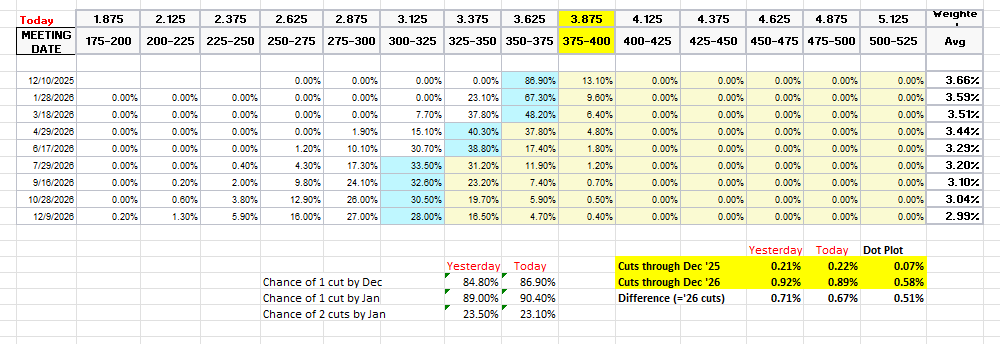
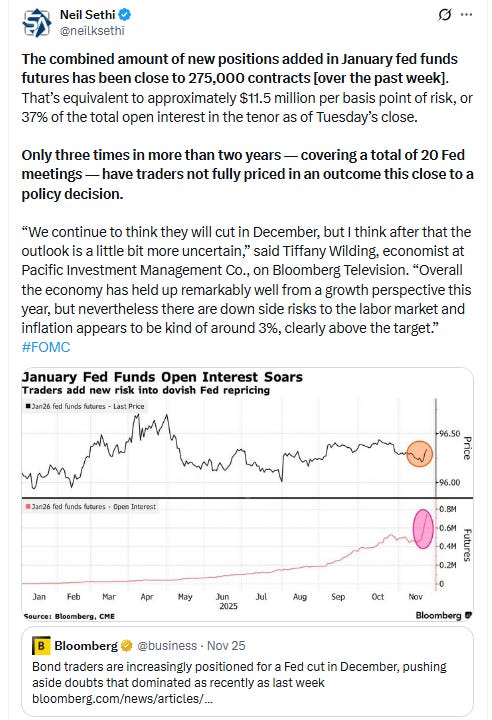
Odds on a Dec #FOMC rate cut edged higher to 87%, the highest since the Oct FOMC, up from 72% a week ago and 33% the week before that, although still down from 100% Oct 16th.
A cut by Jan edged to 90% (also the best since Oct 16th (96%)), but cuts at both the Dec & Jan meetings remained at 23% barely up from 20% last week.
And pricing for 2026 eased back another -4bps to 67bps (down from 80bps last week which was highest we’ve been for 2026 cuts), and total cuts through Dec ‘26 eased to 89bps (down from 103bps pre-Oct FOMC which was the highs of the year (for cuts from December on)).
As a reminder the average dot on the dot plot has ~60bps of total rate cuts through Dec ‘26 from this point, so over a cut off.
I said after the big pricing out of cuts in January (and again in February) that the market had pivoted too aggressively away from cuts, and that I continued to think cuts were more likely than no cuts, and as I said when they hit 60 bps “I think we’re getting back to fairly priced (and at 80 “maybe actually going a little too far” which is definitely where we were Apr 20th (a little too far) at 102bps). I said the day before July NFP “now it seems like we’re perhaps getting back to too few cuts”. I thought at 76bps heading into the Sept FOMC we were perhaps a bit overdoing it, but continued to expect at least 50bps this year (which we’ve now gotten) but probably not a lot more than that (which has been my call since last December). I said I thought we got back to overdoing it when over 50bps of rate cuts were priced for the rest of the year Oct 16th. I had said “while 50bps is my base case it’s less than 100% I think.” I then said we were pushing a bit to far when we got into the low 40% and under range, but now we’re back up over 80% which I think may be a touch high, but it certainly feels like Powell sent out the doves to talk it back up which means it’s almost certainly more likely than not.
Also remember that these are the construct of probabilities. While some are bets on exactly one, two, etc., cuts some of it is bets on a lot of cuts (3+) or none (and may include a hike at some point)
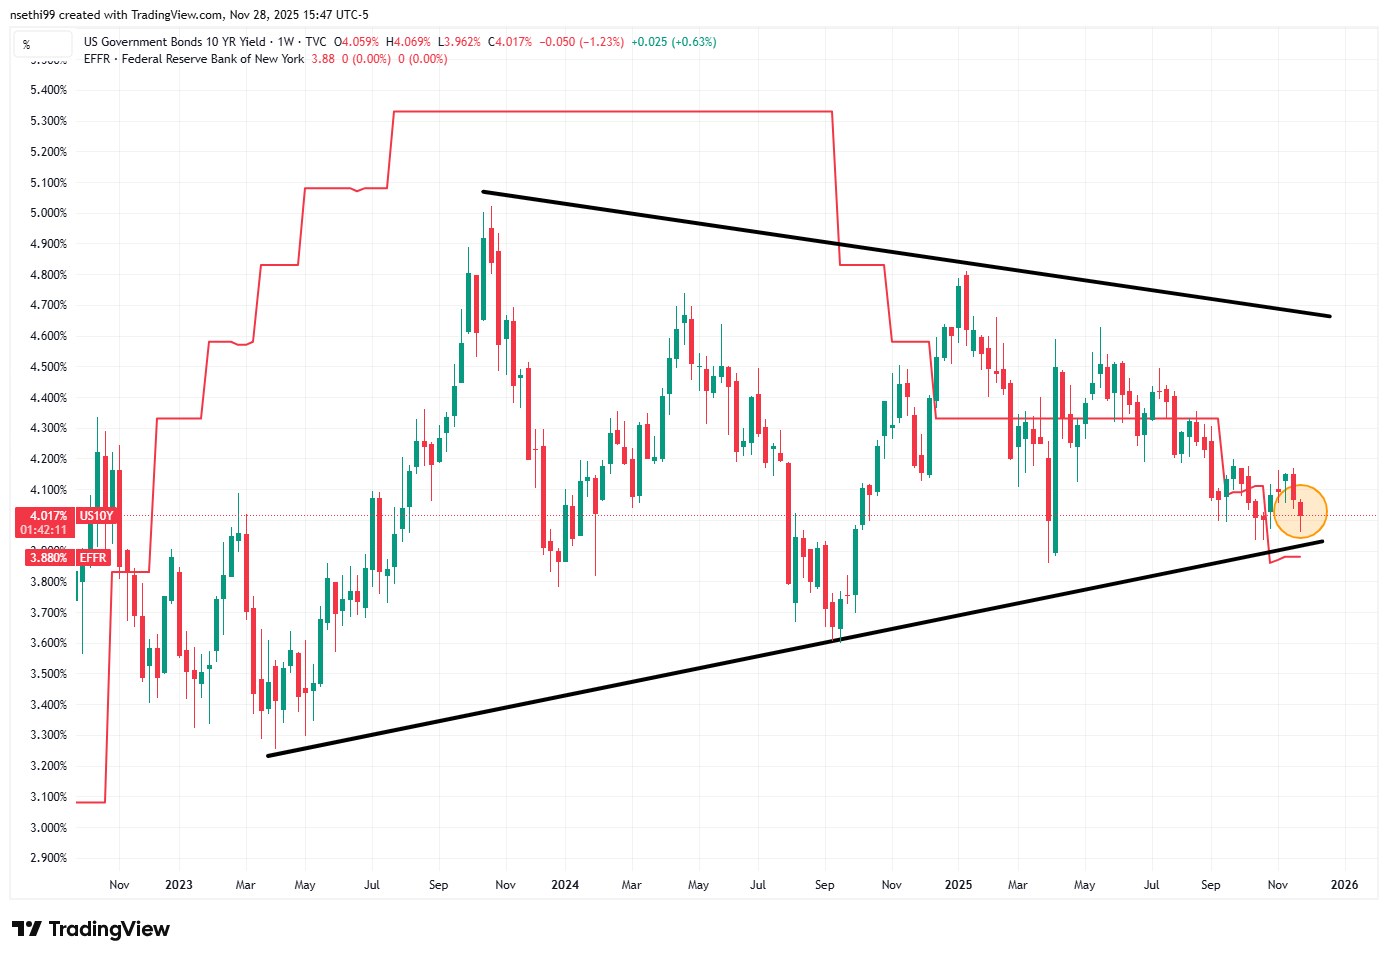
The 10yr #UST yield closed back over 4% at 4.02% from the lowest close since Oct 29th.
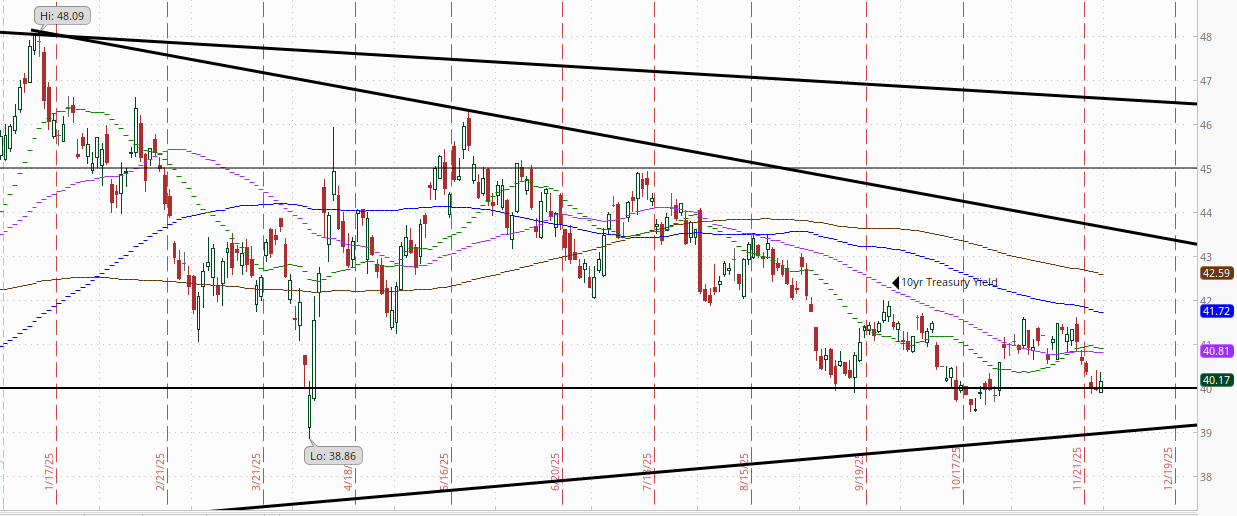
Weekly chart
Monthly chart.
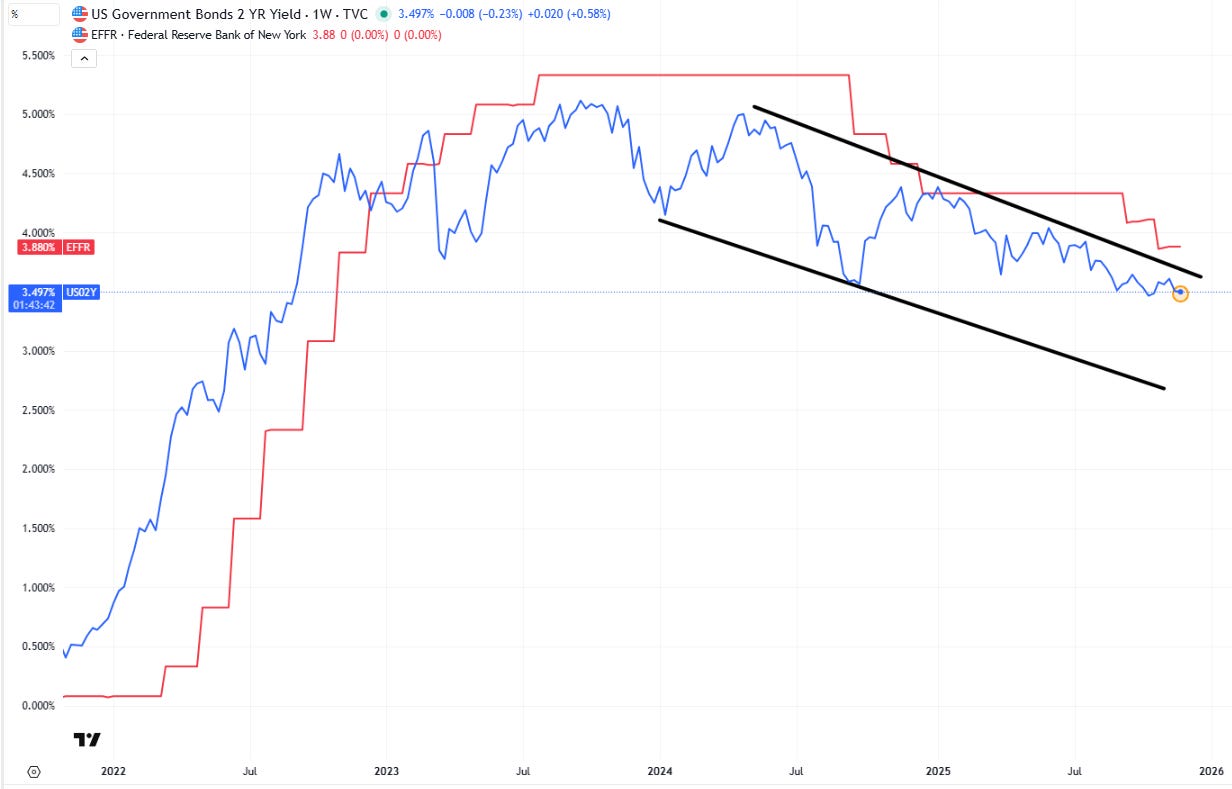
The 2yr yield, more sensitive to FOMC rate cut pricing, was +2bps to 3.50% still just 8bps from the bottom of the range since late August. It is 38bps below the Fed Funds midpoint.
The Effective Fed Funds Rate (red line) remained at 3.88% slightly above the Fed Funds midpoint and up 5bps since Sept, evidence of continued growing stresses in funding markets that will likely see the Fed adding assets to its balance sheet soon.
I had said when the 2yr yield it was around 4.35% (in Jan & again early Feb) that I found the 2-yr trading rich as it was reflecting as much or more chance of rate hikes as cuts while I thought it was too early to take rate cuts off the table (and too early to put hikes in the next two years on), but then the 2yr fell to 3.65% past where I thought we’d see it, so I took some exposure off there. We got back there but I never added back what I sold, so I stuck tight. Ian Lygan of BMO said on his weekly podcast he now sees it at 3.3% by year’s end (but sees risk to the downside), but I still took some off Sept 5th at 3.5%. I have been waiting for ~3.90% to add back but it seems now that ship might have also sailed.
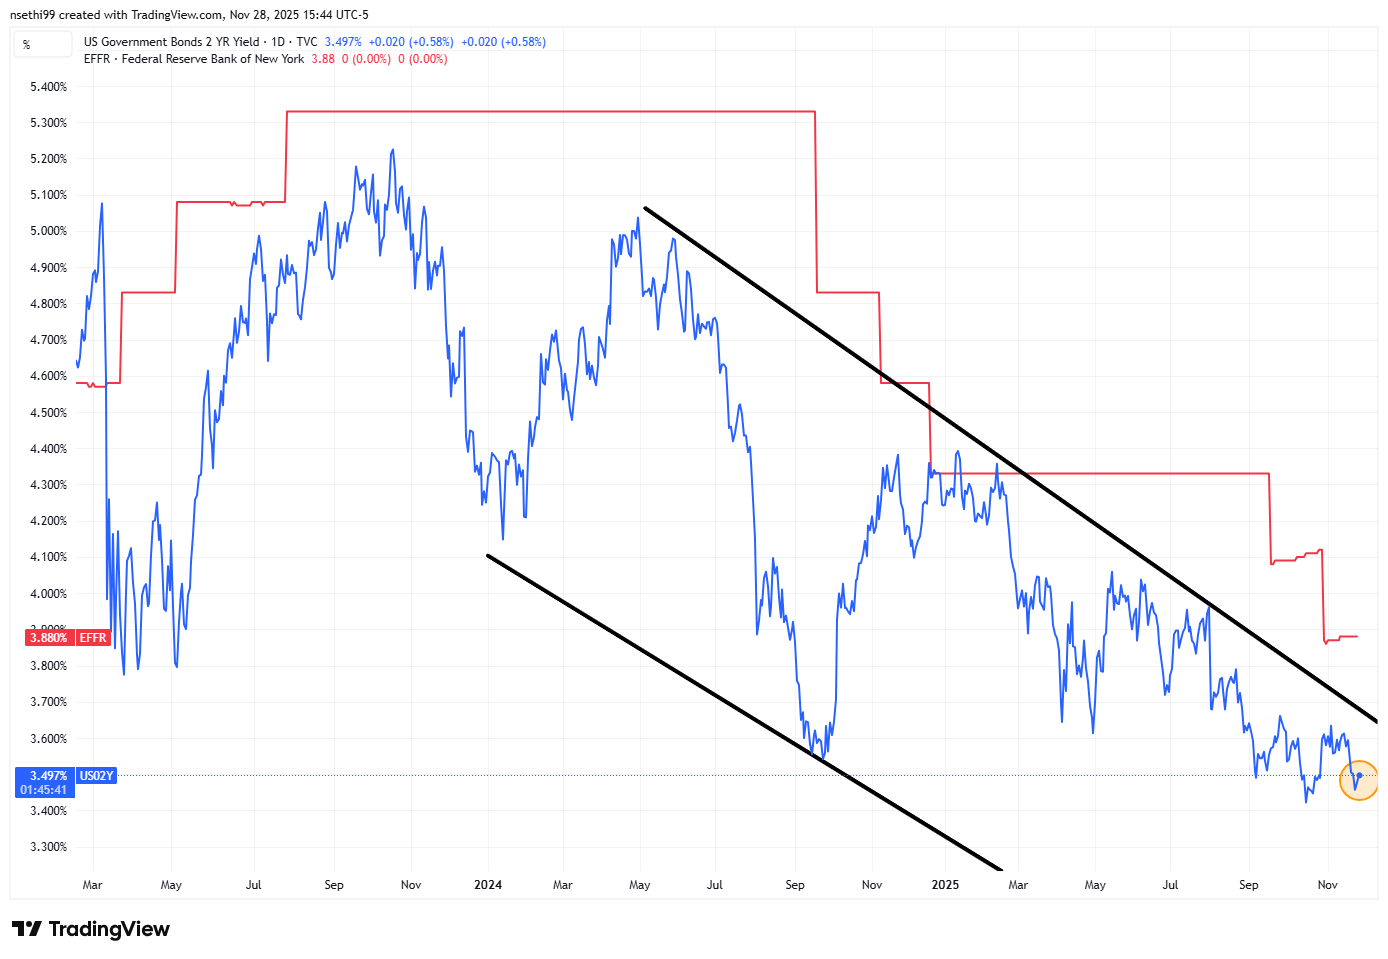
Weekly chart.
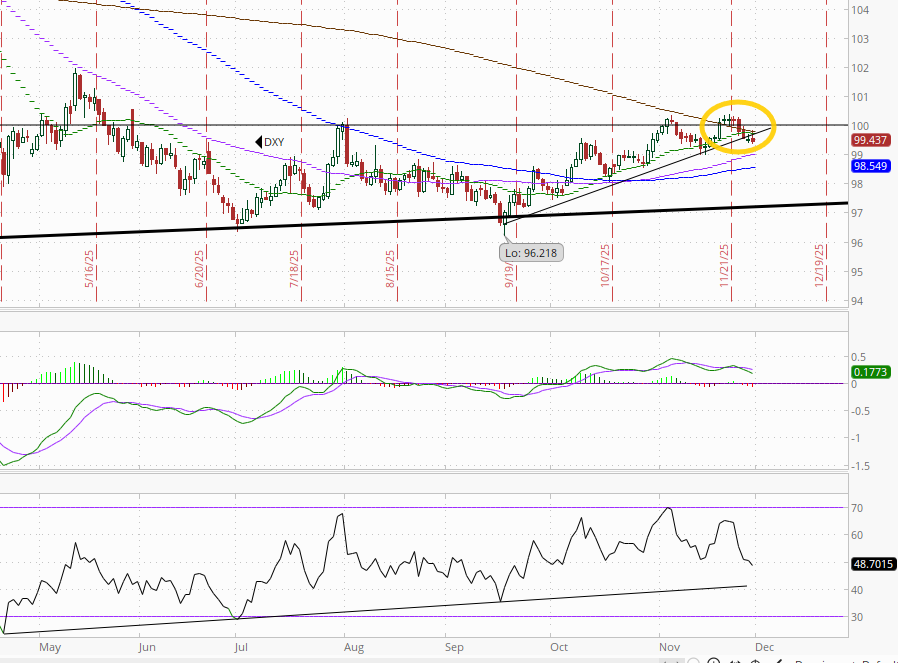
The $DXY dollar index (which as a reminder is very euro heavy (57%) and not trade weighted) lower for a fourth session from the highest since May, now breaking its uptrend line from Sept but also not really . The daily MACD and RSI have softened back to neutral.
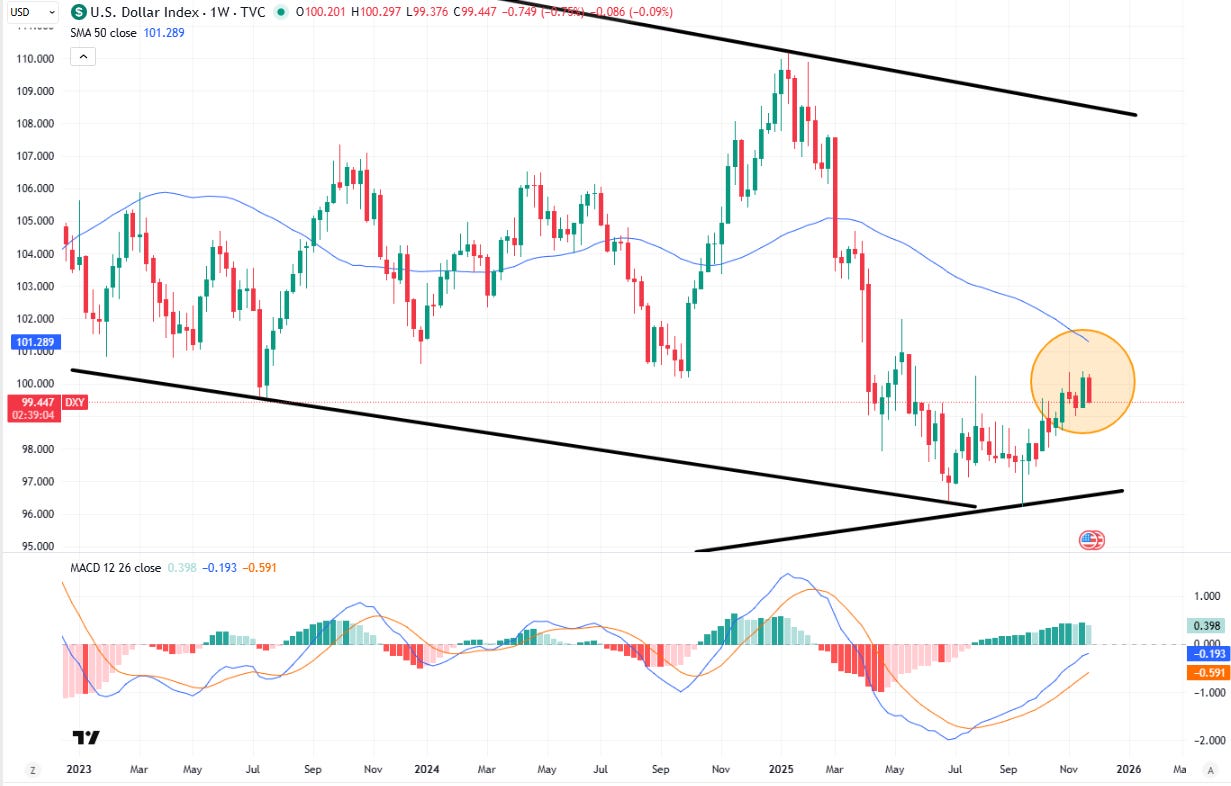
Weekly chart mixed with a falling 50-week moving average but a “cover longs” weekly MACD.
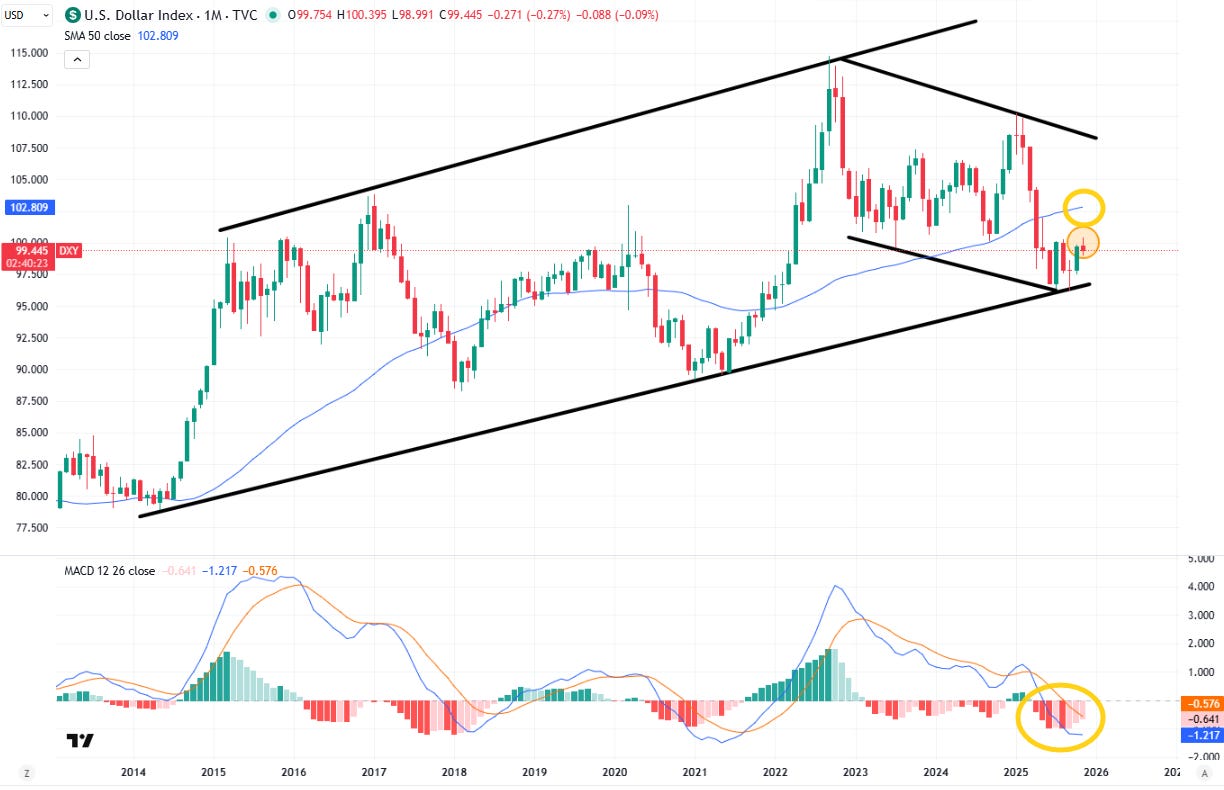
Monthly chart still favors downtrend as the monthly MACD remains in go short positioning although the 50-month moving average is still moving higher.
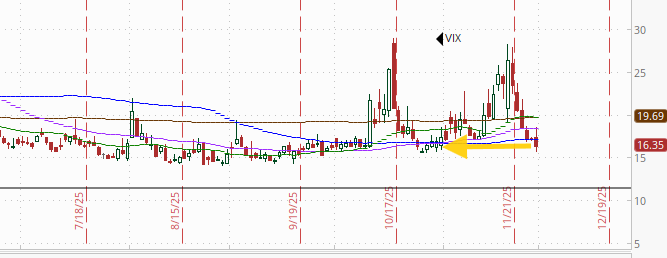
VIX fell back for a fifth session to 16.4, the lowest close since October after the highest since April a week ago. The current level is consistent w/~1.02% average daily moves in the SPX over the next 30 days.
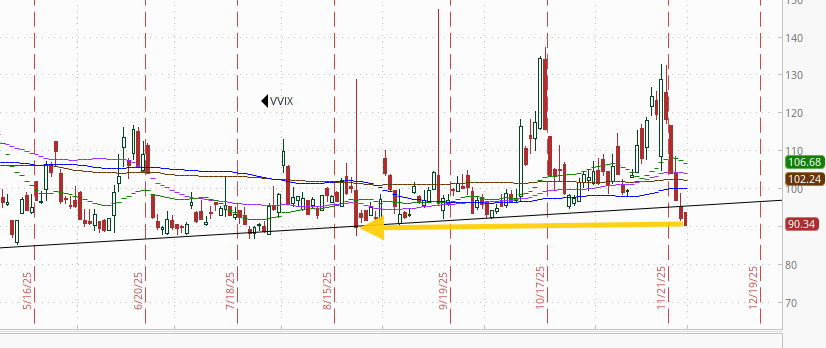
The VVIX (VIX of the VIX) has seen an even larger pullback now down to 90.3, the lowest close since late Aug and well below Nomura’s Charlie McElligott’s breakeven “stress level” of 100 (consistent with “moderate” daily moves in the VIX over the next 30 days (normal is 80-100)). More notably, it is the furthest it’s been under that trendline running back to March that it has bounced from numerous times since then, and it’s never closed two consecutive closes under.
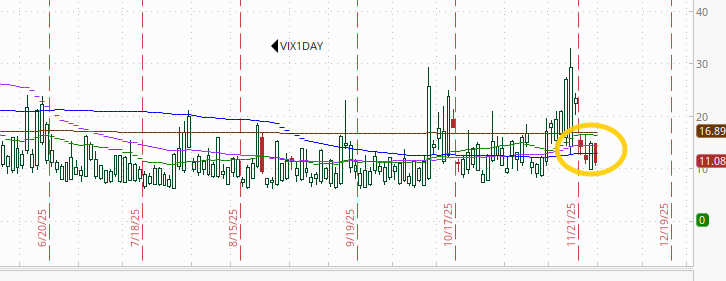
1-Day VIX like the VIX and VVIX fell Friday, in its case to 11.1. Also notably we saw the 1-Day VIX fall during three of the past four sessions which is unusual as you can see from the chart, as it means that expected volatility is dropping despite the addition of an entire extra session by the close. The current level implies a ~0.71% move in the SPX next session.
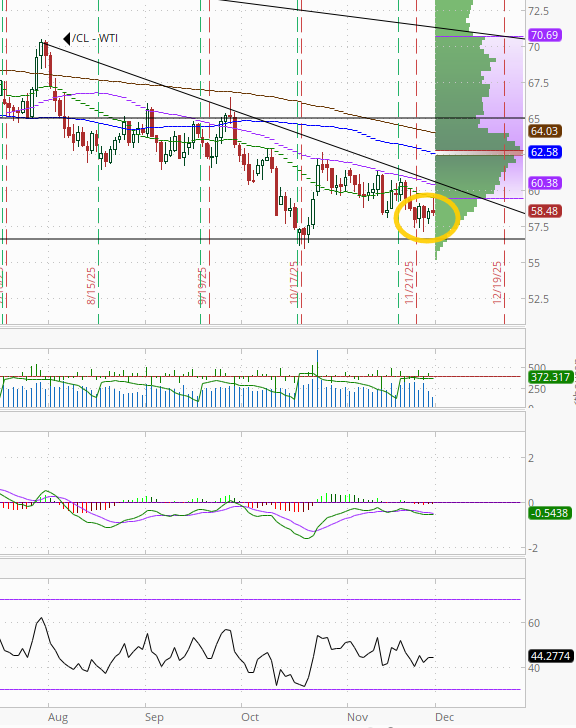
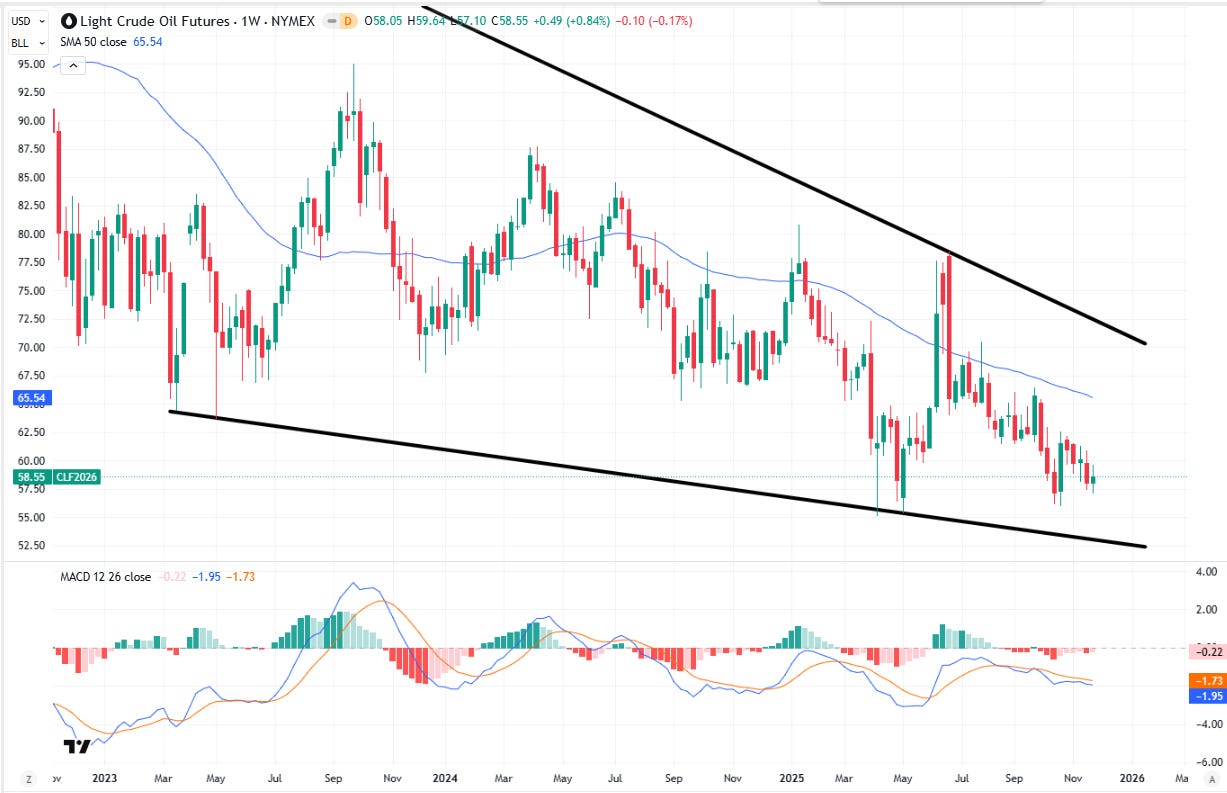
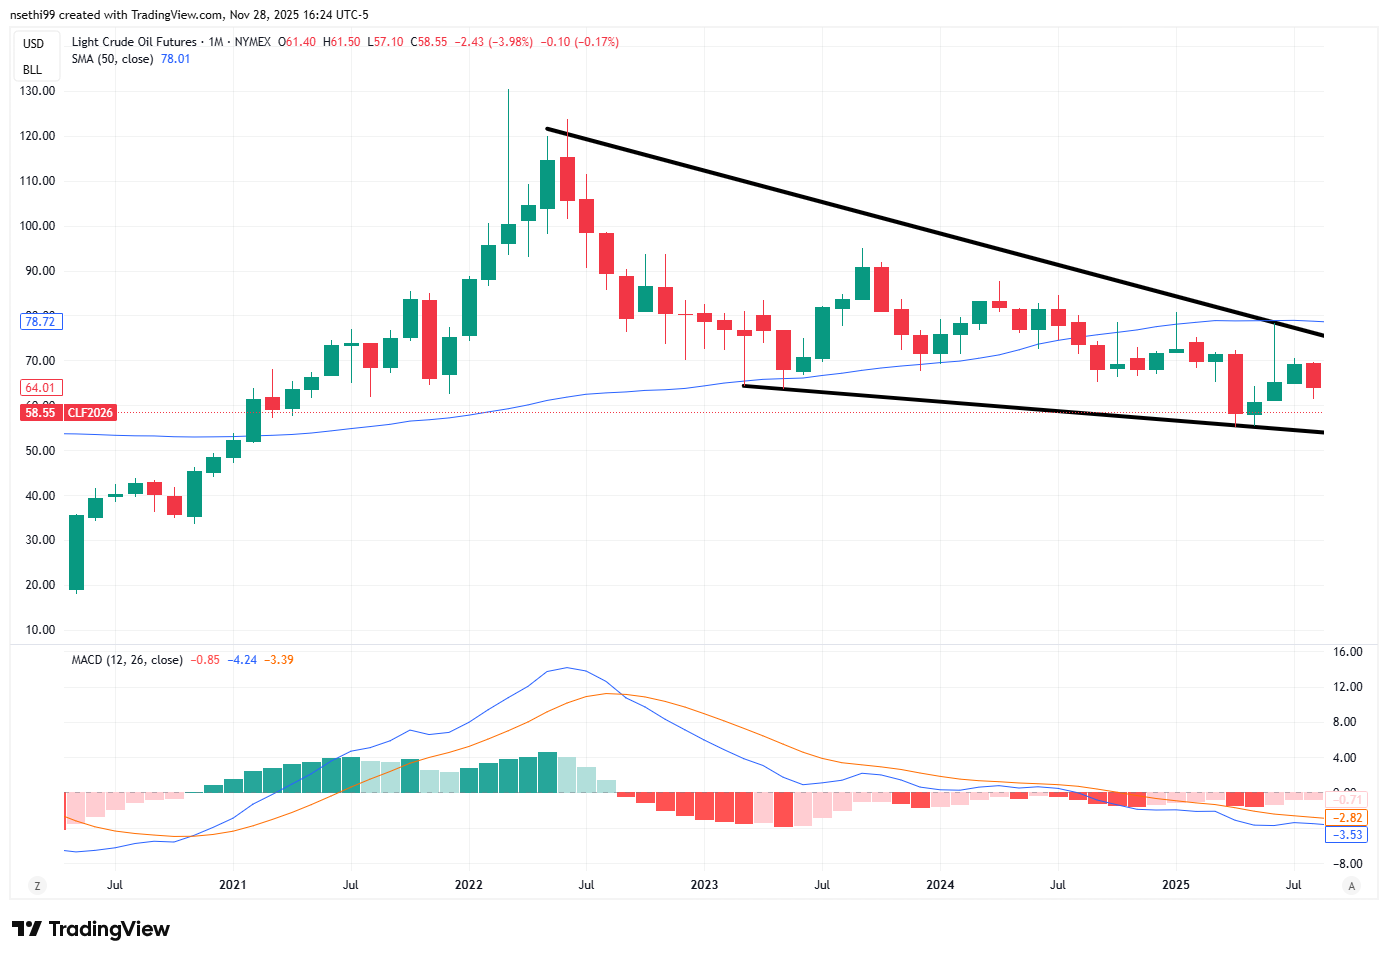
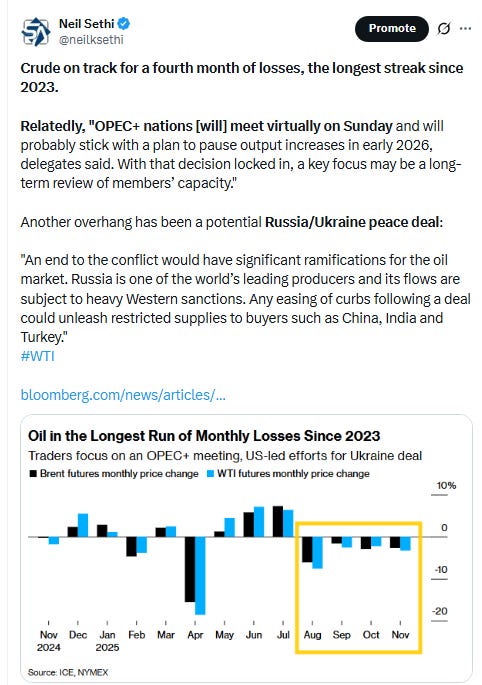
#WTI futures edged lower as they continue to set mostly lower highs the past month. For the month they closed down The MACD and RSI have softened to more negative reads as noted Friday.
Weekly chart remains negative.
Monthly chart as well.
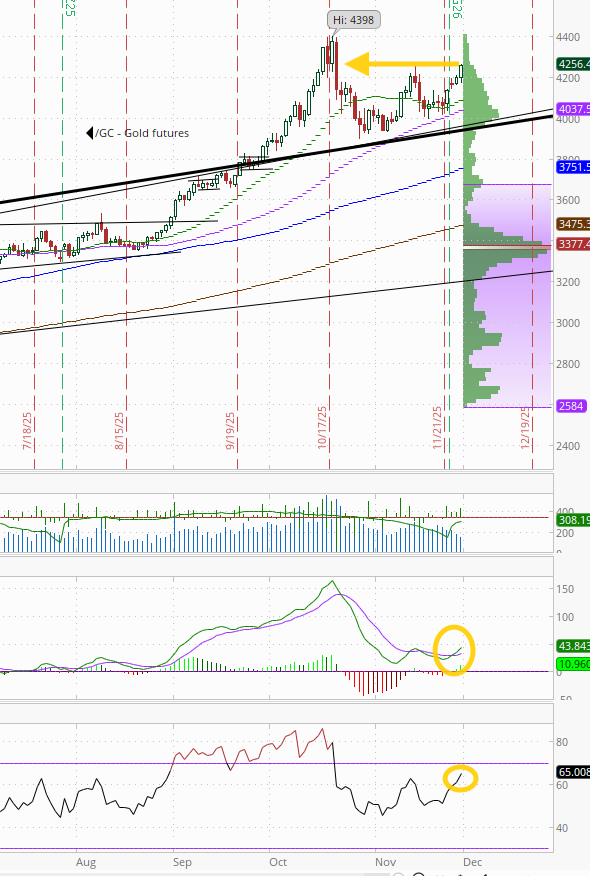
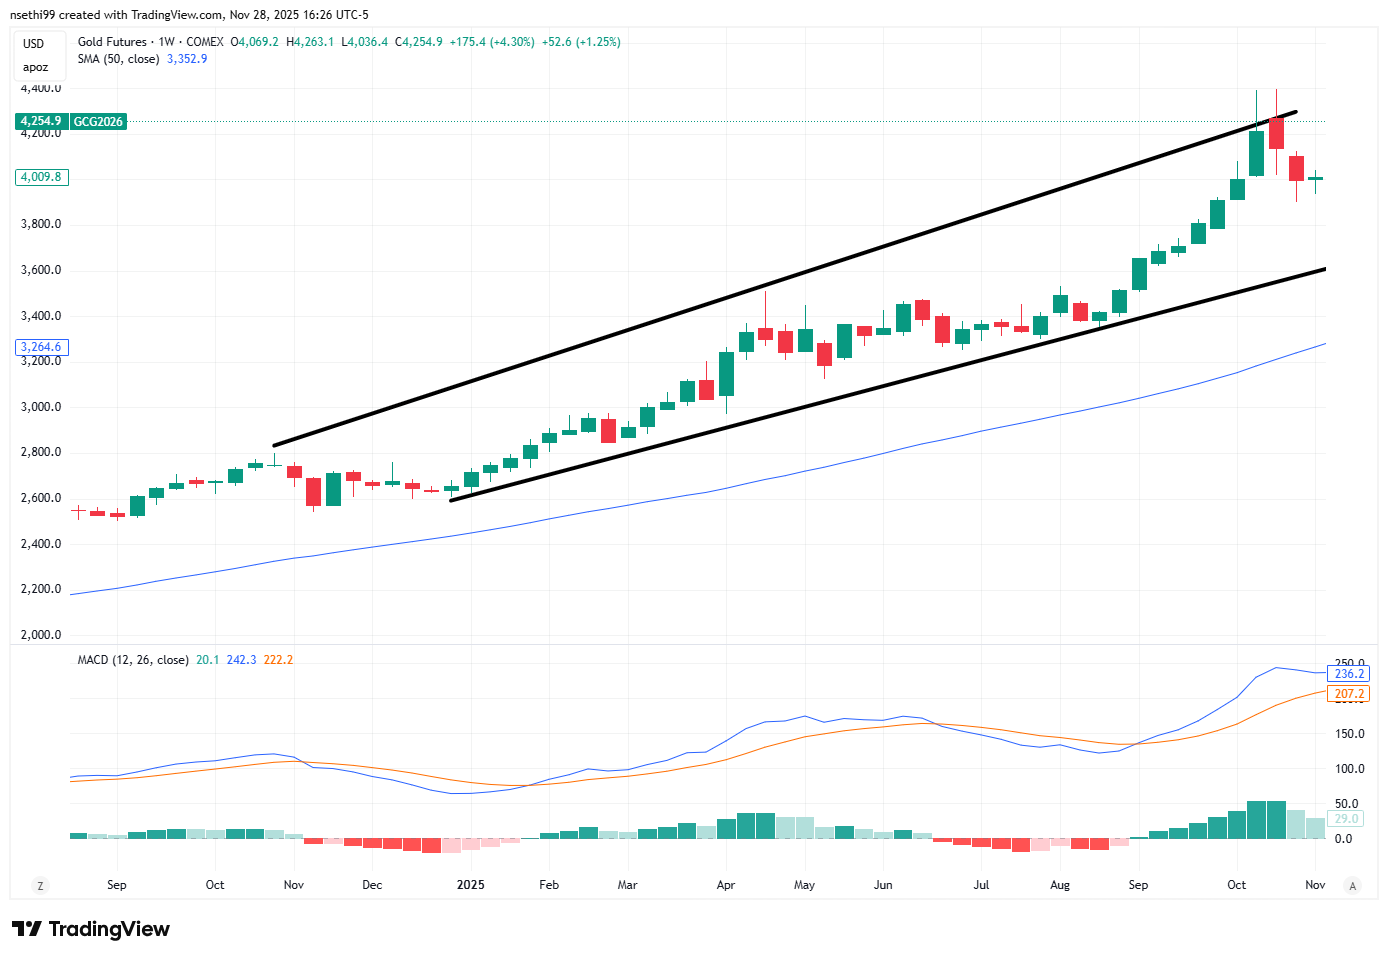
Gold futures (/GC) up for a fourth session (+4.6% over that time) as they continue to look to break out of their consolidation since peaking a month ago, now the highest close since the all-time high a month ago. Daily MACD as noted Wed has now flipped to “go long” positioning, and the RSI is nearing 70.
Weekly chart looks good.
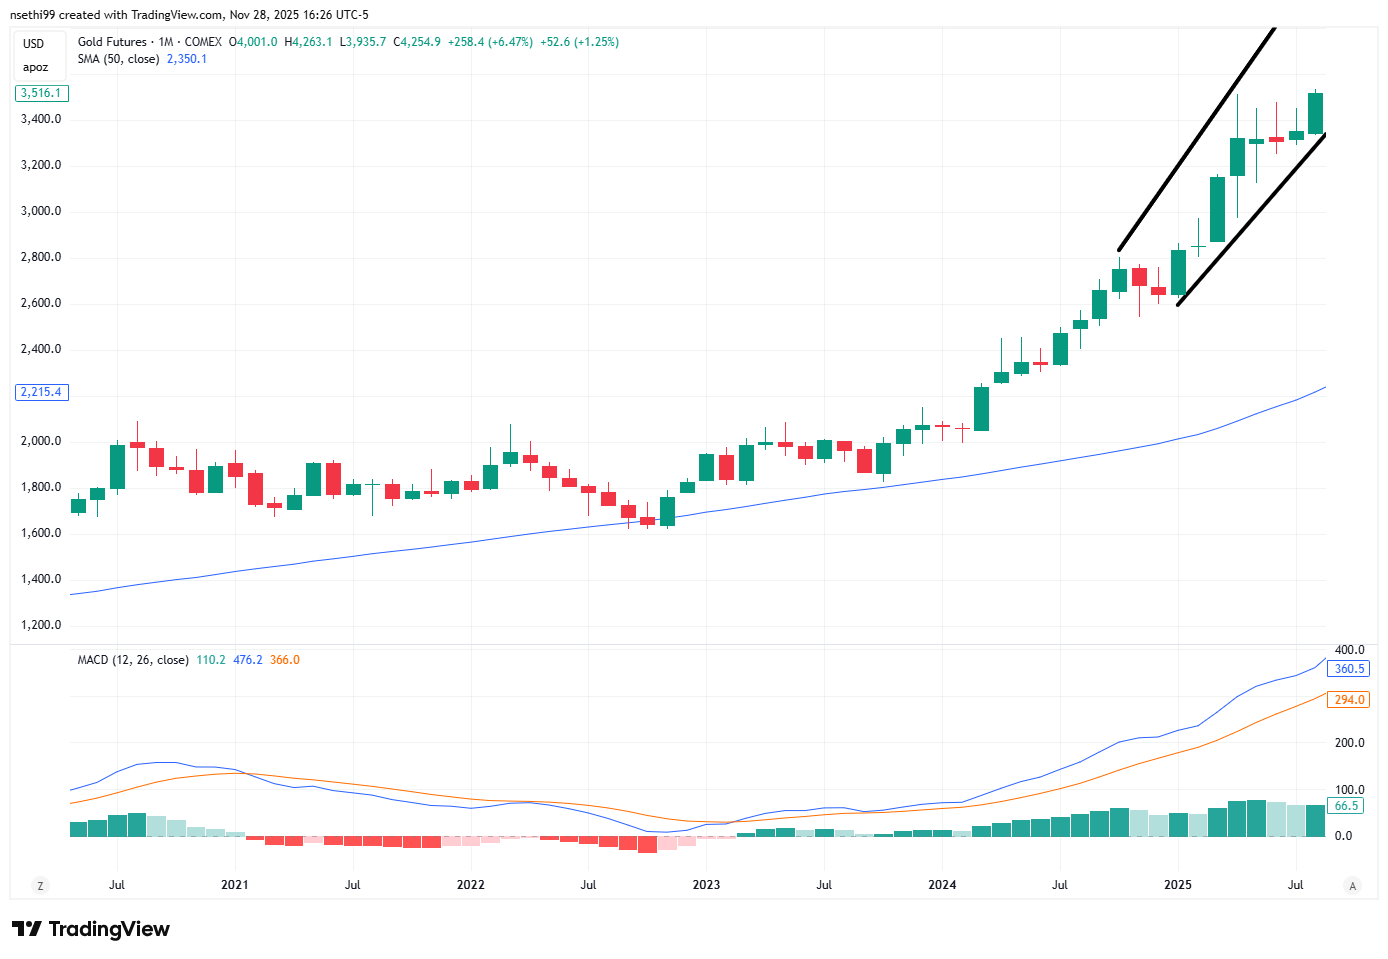
As does the monthly chart.
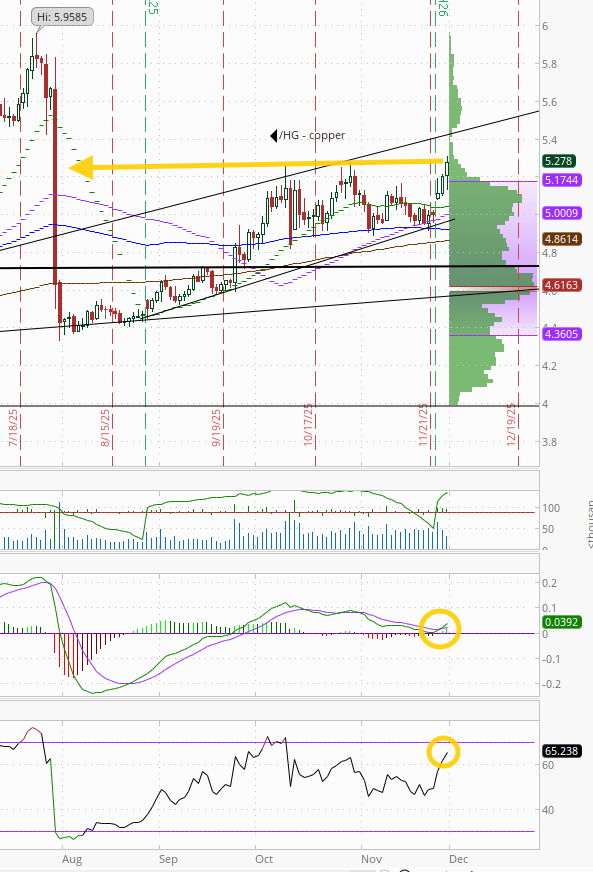
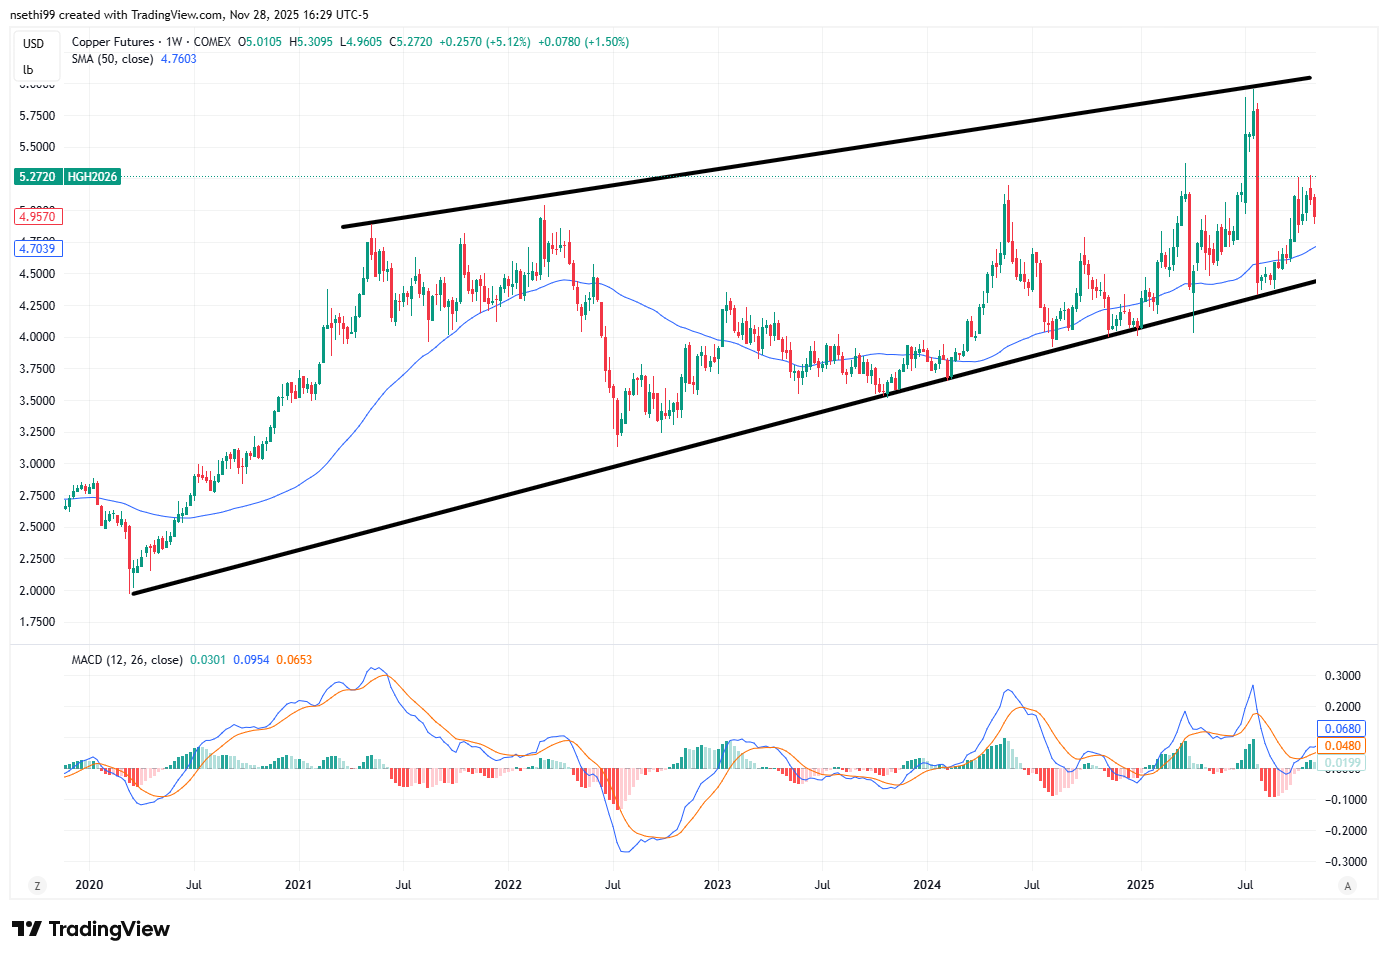
US copper futures (/HG) were up +1.4% Fri (+3.2% the past two sessions) to the highest close since the July meltdown.
In addition, as noted Wed the daily MACD has crossed to “go long” positioning, and RSI has pushed over 60. Longer term, they remain in the grinding uptrend since August (and longer than that in the uptrend started in March 2020).
Weekly chart
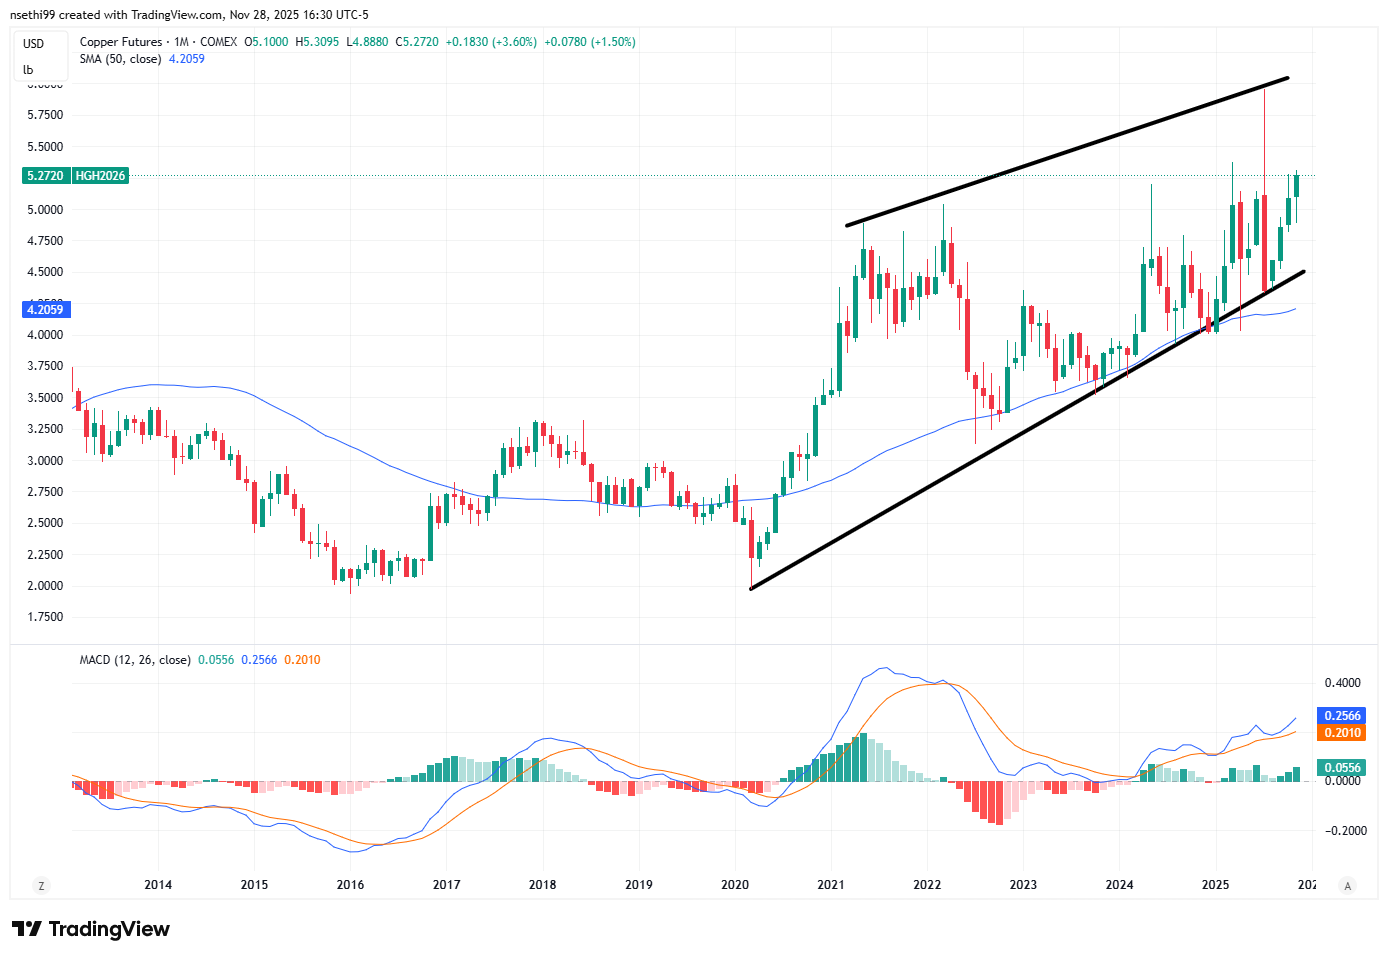
Monthly chart
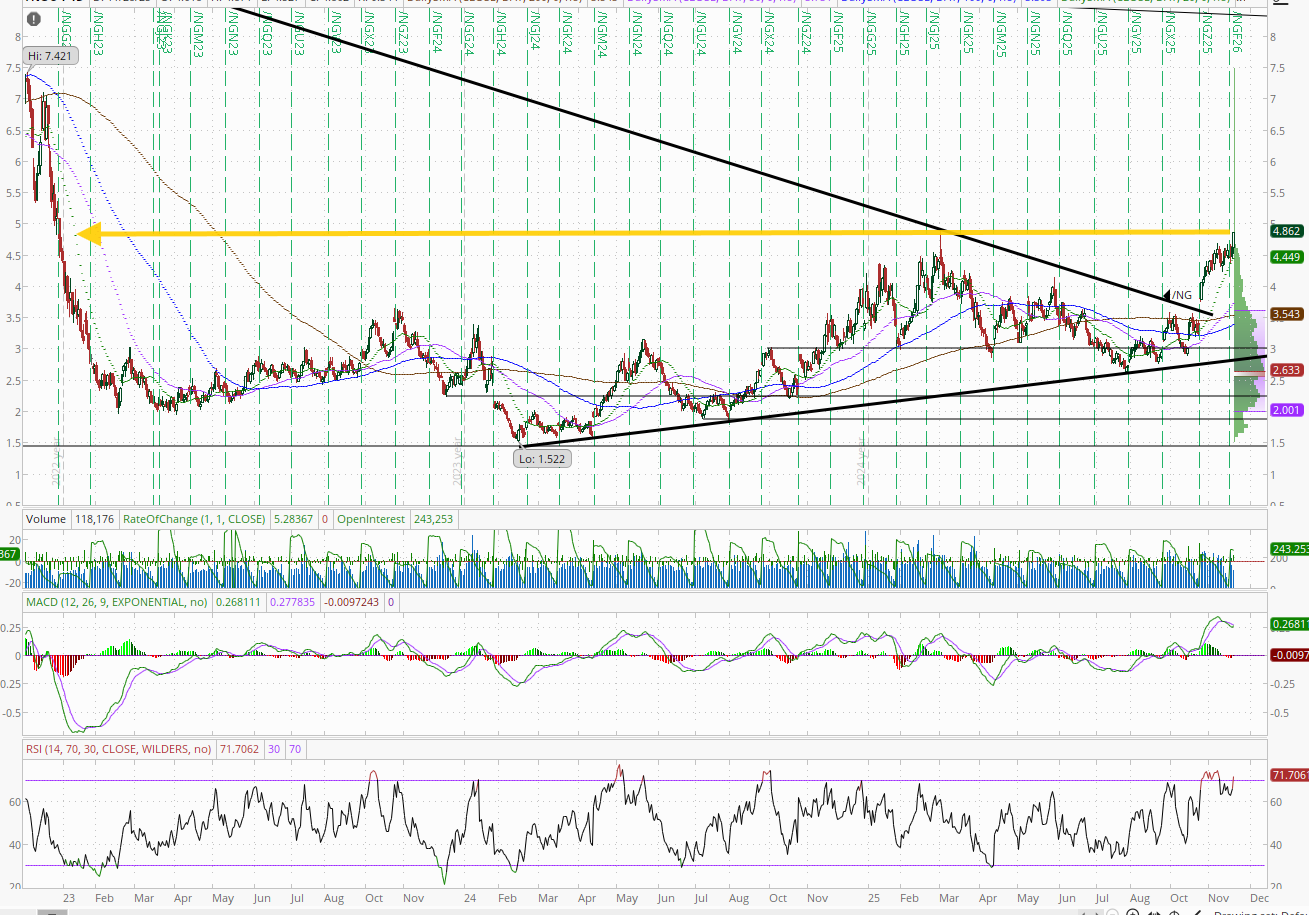
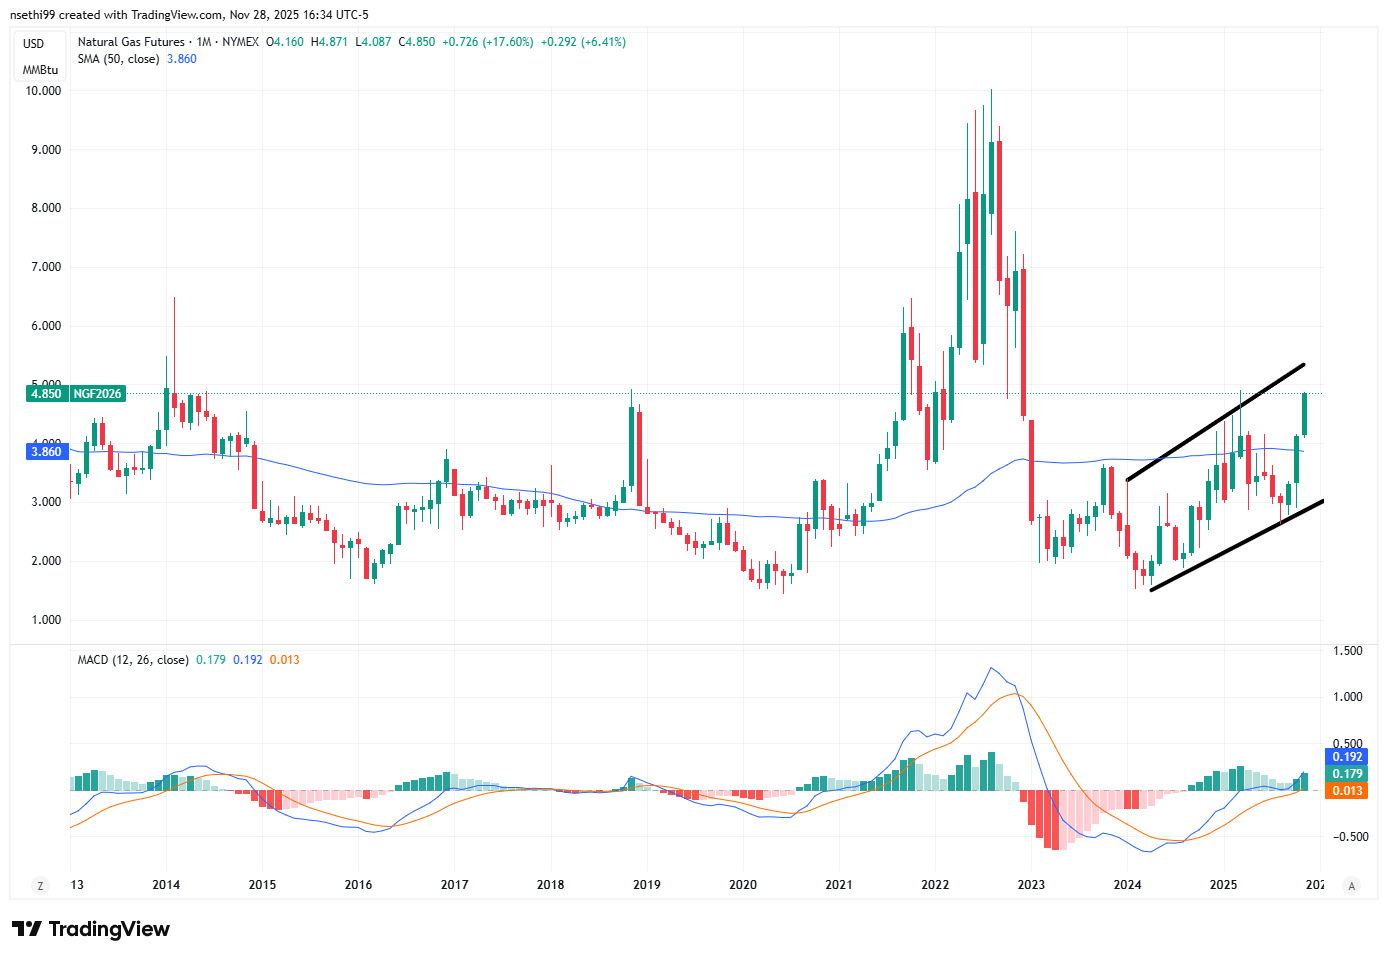
Natgas futures (/NG) jumped over 5% Friday to the highest close since Dec ‘22. The technicals though remain in a divergence with the daily MACD remaining in ‘sell longs’ positioning (but will likely cross Monday), and the RSI so far lagging the high earlier this month. Still can’t ignore the price action. ”
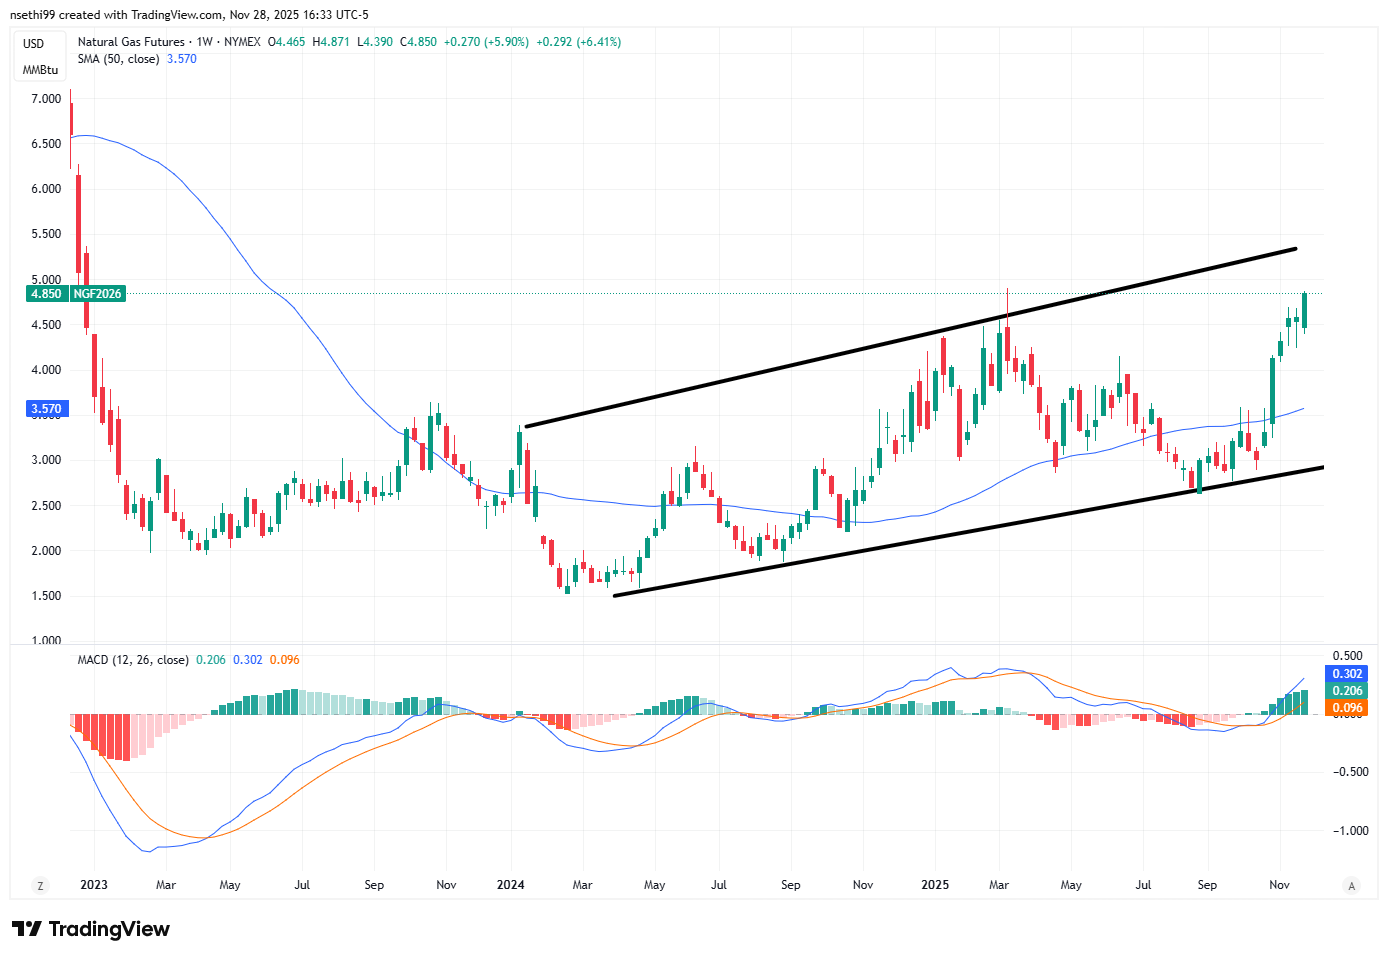
Weekly chart remains in good shape.
Monthly chart as well.
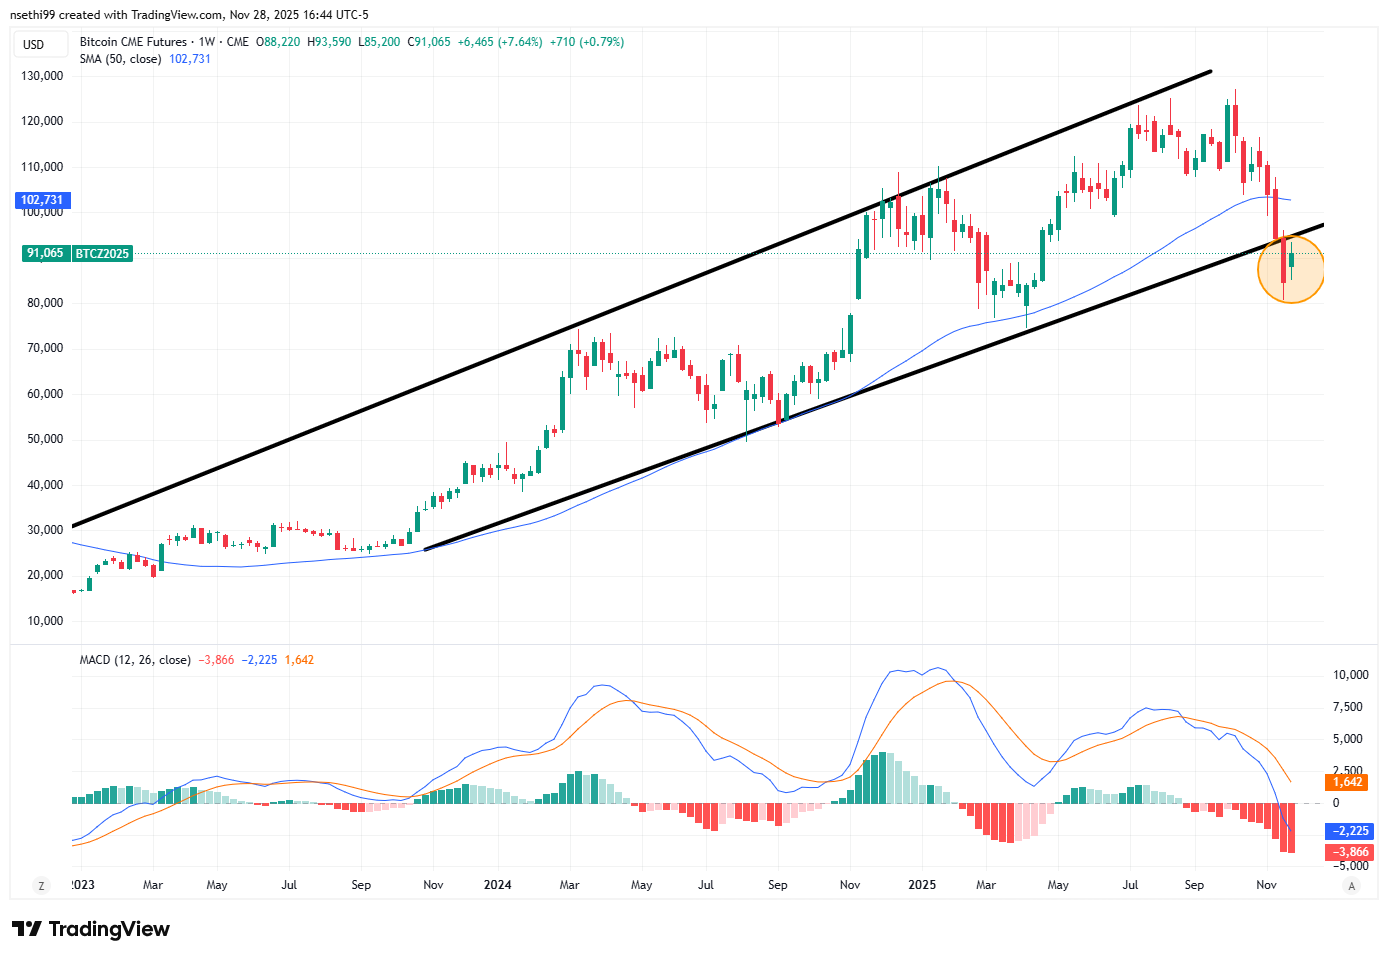
Bitcoin futures up +1.4% Fri to a 1-week high as they continue to rebound from a nearly -40% drop from the highs although they finished well off the highs of the session.
The daily MACD remains in “go short” positioning but is improving, and the RSI has bounced back over 30 from the weakest since June ‘22, which can be the sign of a bottom as noted Monday. As I said a week ago “seems the selloff is getting long in the tooth.” Now we’ll see if this bounce has staying power (I would assume we’ll retest those lows though).
Weekly chart. It seems maybe it’s having some trouble with the old support line (now resistance).
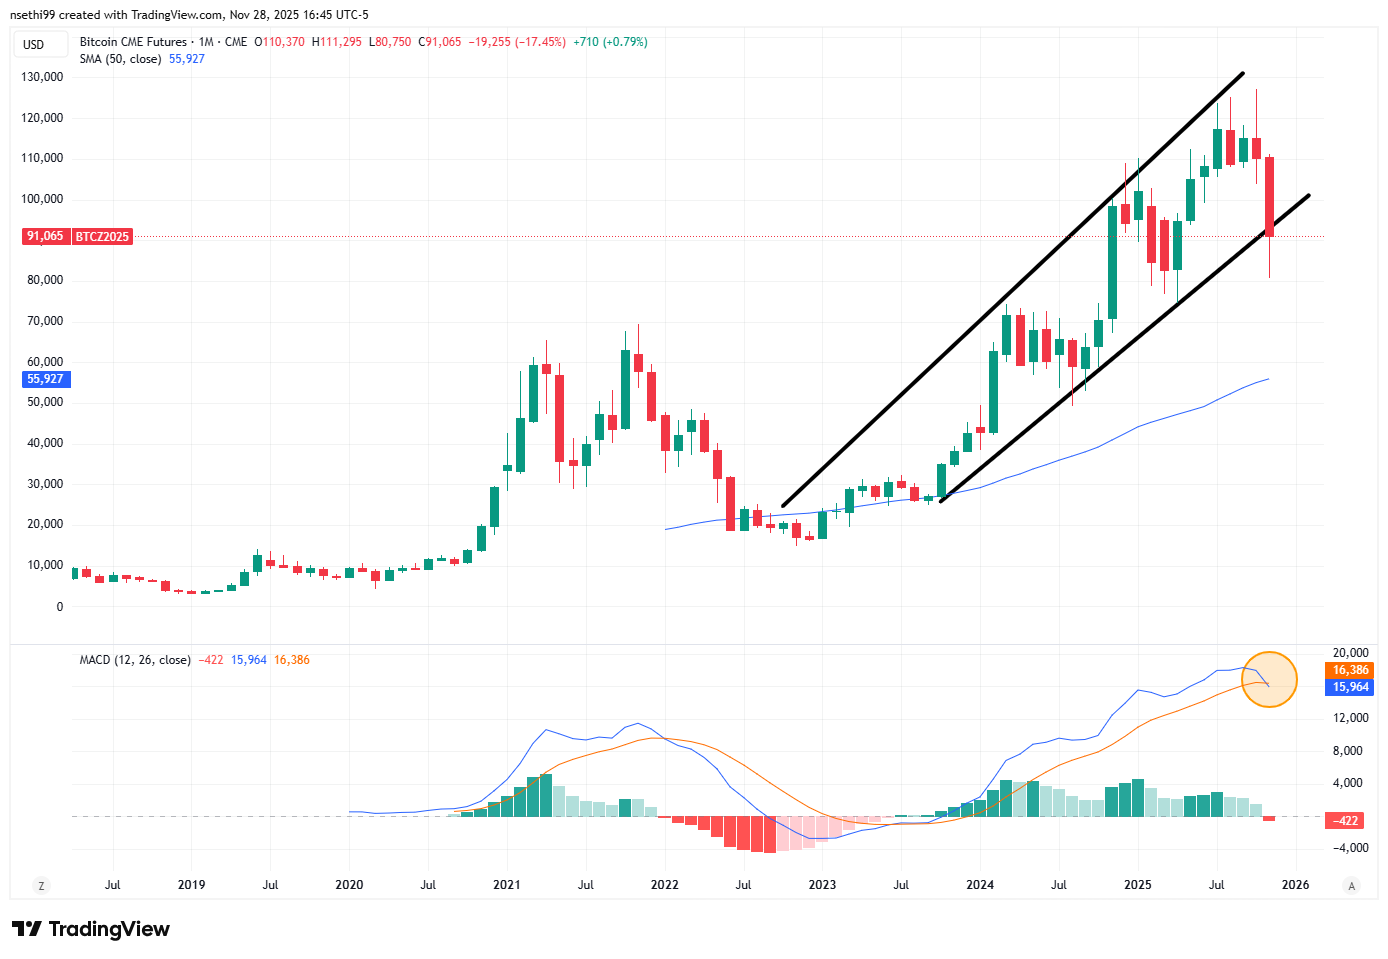
Monthly chart has MACD crossover to (sell longs).
The Week Ahead
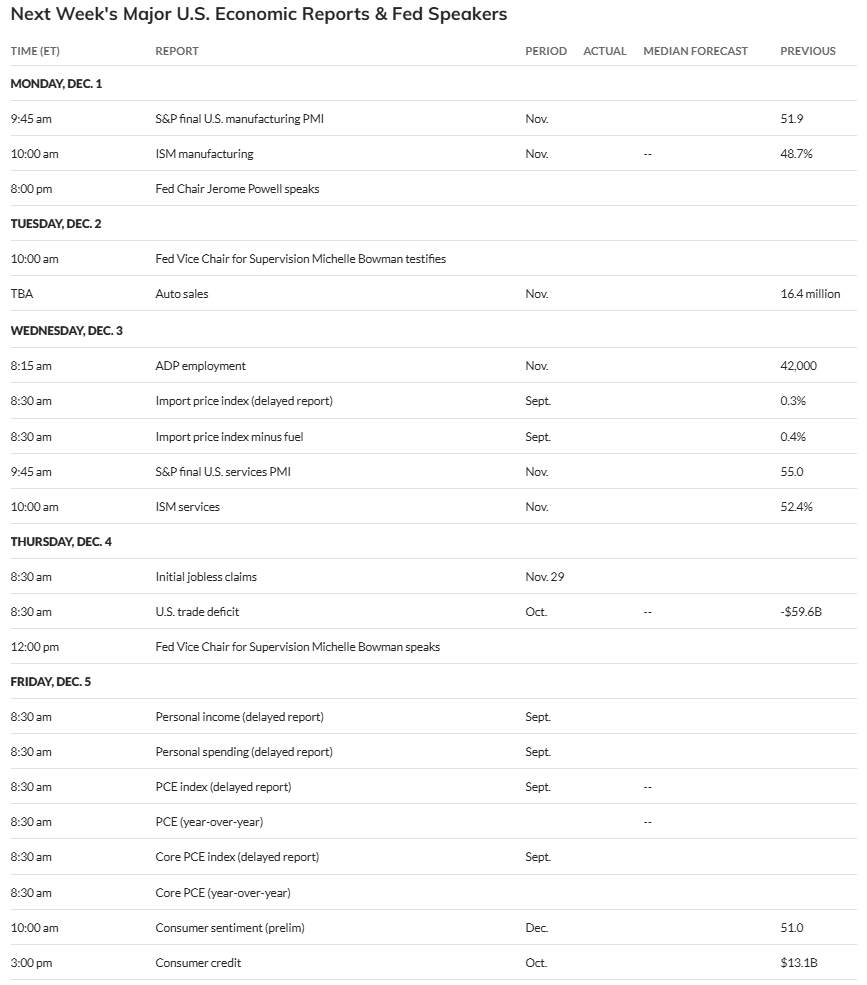
Next week is normally a packed week which culminates in NFP, and it will be a busy week, but it will have a somewhat different cast of characters as replacing JOLTS and NFP we’ll get delayed reads on Sept personal income and spending with PCE prices as well as import prices. Doesn’t have the same joie de vivre, but c’est la vie as they say. In addition, we’ll get ADP (regular monthly report which will inform the Fed discussions), Nov final PMIs and auto sales, Dec preliminary UMich consumer sentiment, and a finally on-time Census Bureau report in Oct trade deficit along with Oct consumer credit.
The Fed will be in its speaking blackout (which it should be emphasized does allow for “communications on historical, educational, and informational subjects,” and we’ll still hear from Chair Powell on Monday night. The Fed calendar lists it as “Brief Remarks and Panel Discussion with Michael Boskin and Condoleezza Rice on George Shultz and his Economic Policy Contributions at the Hoover Institution’s George P. Shultz Memorial Lecture.” Given the Fed regulations, I would be shocked if he goes beyond that. Similarly Gov Bowman both testifies on Tuesday in her role as VC for Supervision as well as gives remarks at the Florida Bankers Association Leadership Luncheon which I think will almost certainly avoid monetary policy.
No non-Bill Treasury auctions in the upcoming week.
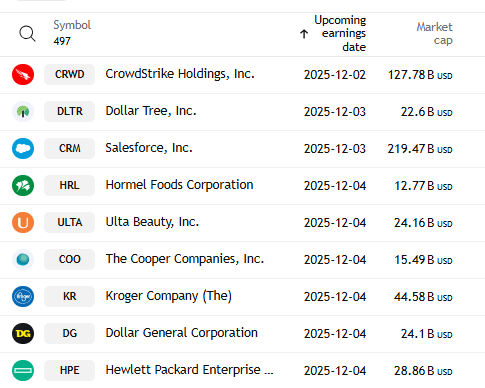
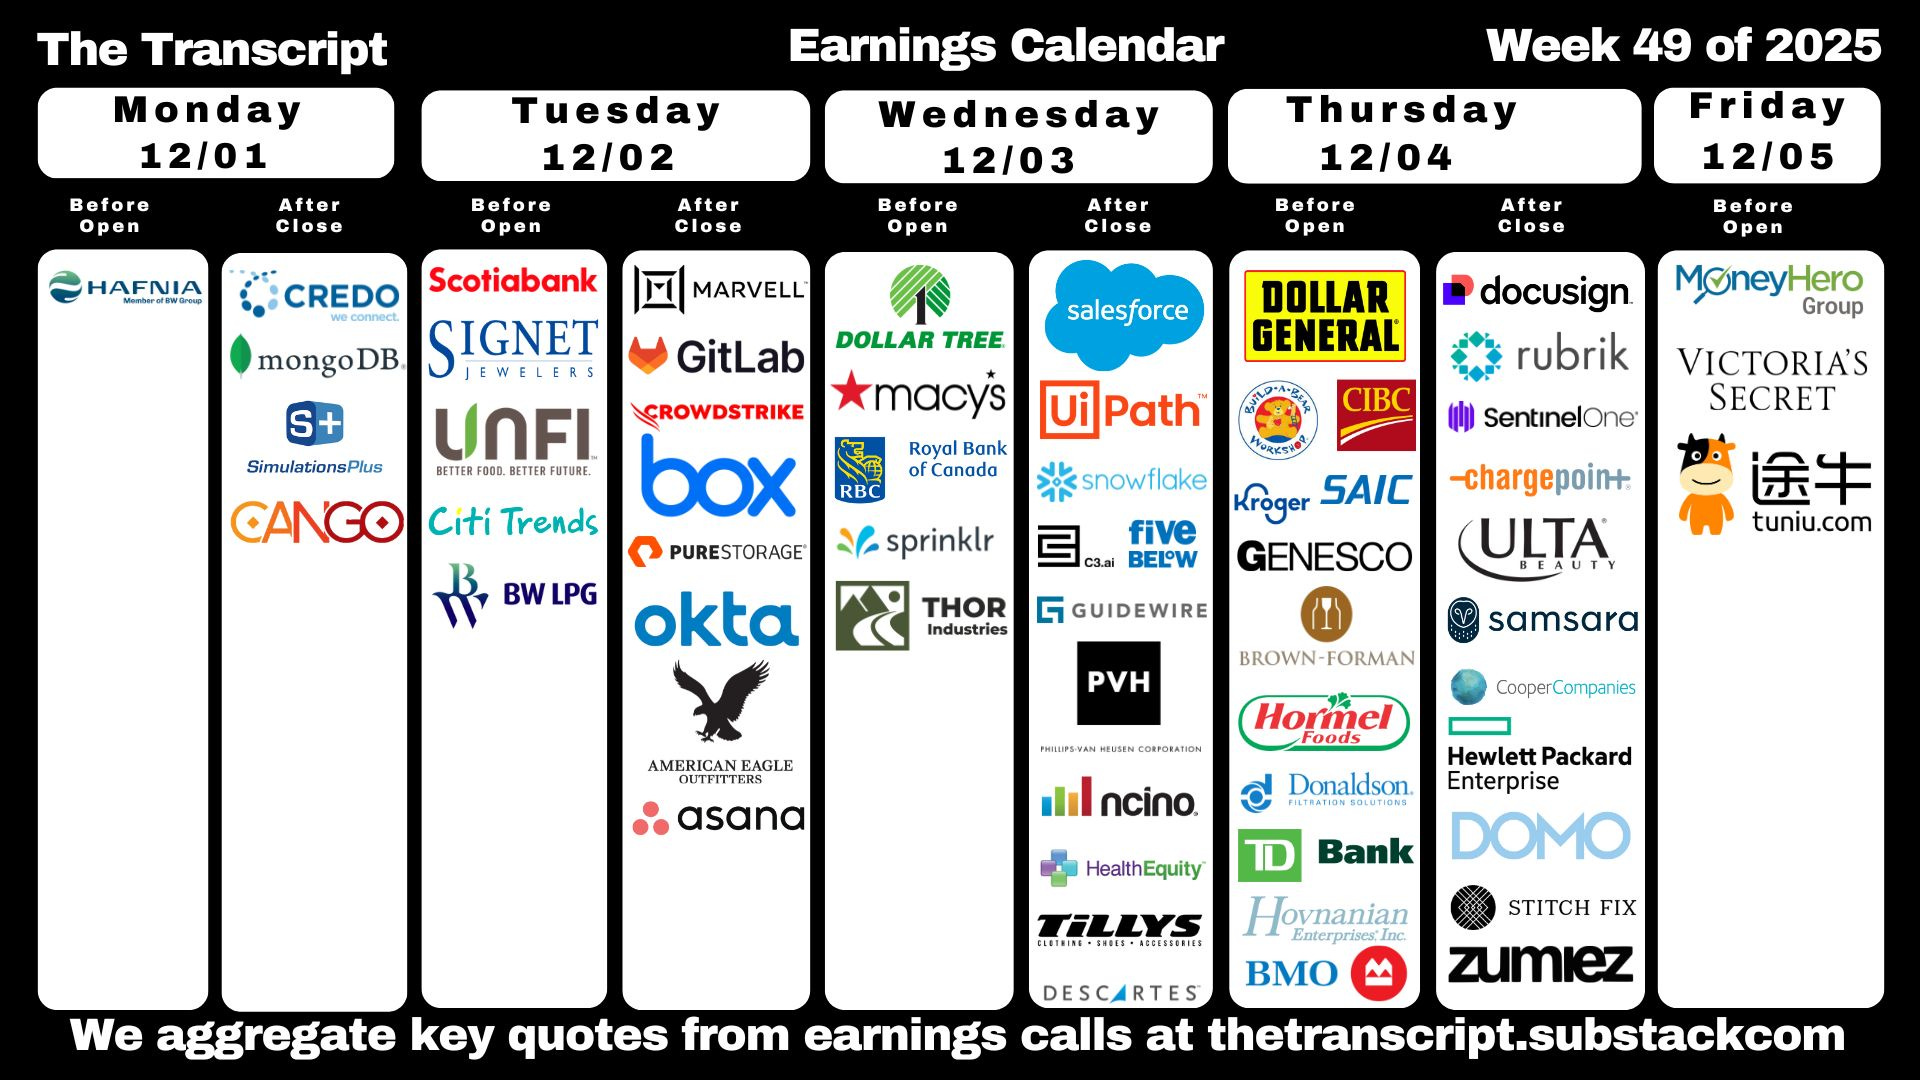
The wrap-up of Q3 earnings will continue, and we’ll get 9 SPX components (per TradingView) of which two are >$100bn in market cap in CRWD and CRM.
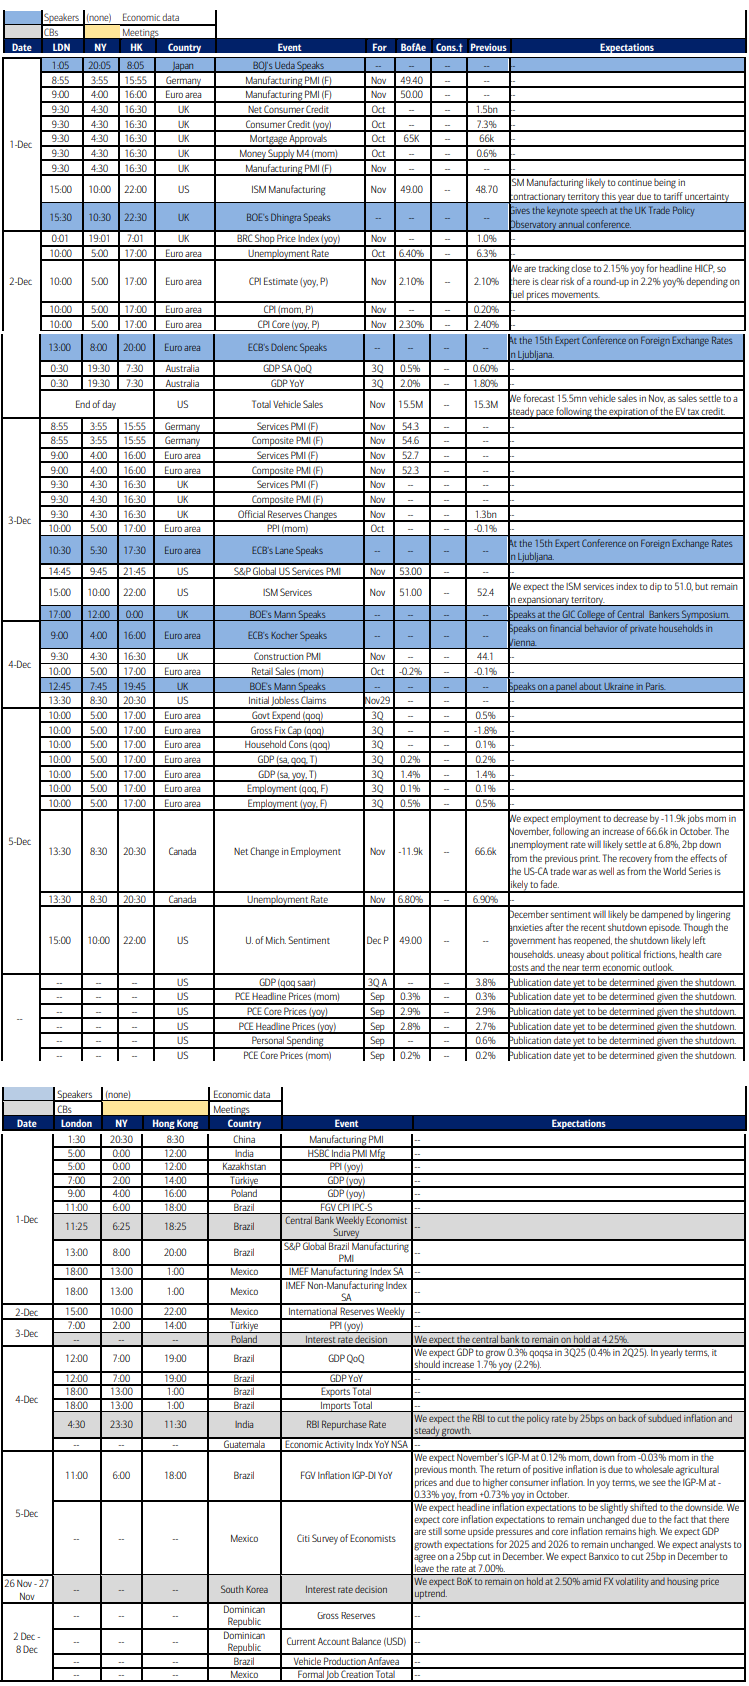
Ex-US it looks like highlights are global PMIs, EU CPI and GDP, Canada employment, UK credit data, and policy rate decisions in India and Poland among others.
Link to X posts - Neil Sethi (@nelksethi) / X
To subscribe to these summaries, click below (it’s free!).
To invite others to check it out,