
Markets Update - 1/14/26
Update on US equity and bond markets, US economic data, the Fed, and select commodities with charts!

To subscribe to these summaries, click below (it’s free!).
To invite others to check it out (sharing is caring!),
Link to posts - Neil Sethi (@neilksethi) / X
Note: links are to outside sources like Bloomberg, CNBC, etc., unless it specifically says they’re to the blog. Also please note that I do often add to or tweak items after first publishing, so it’s always safest to read it from the website where it will have any updates.
Finally, if you see an error (a chart or text wasn’t updated, etc.), PLEASE put a note in the comments section so I can fix it.
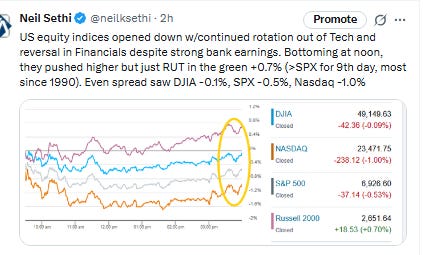
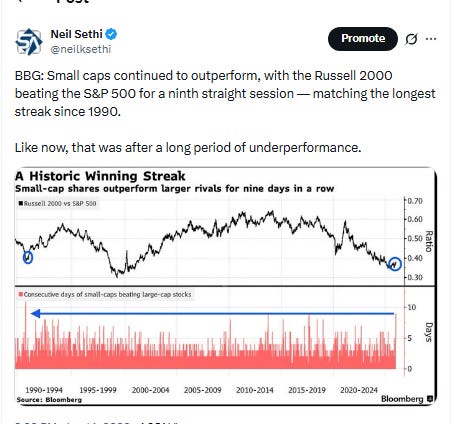
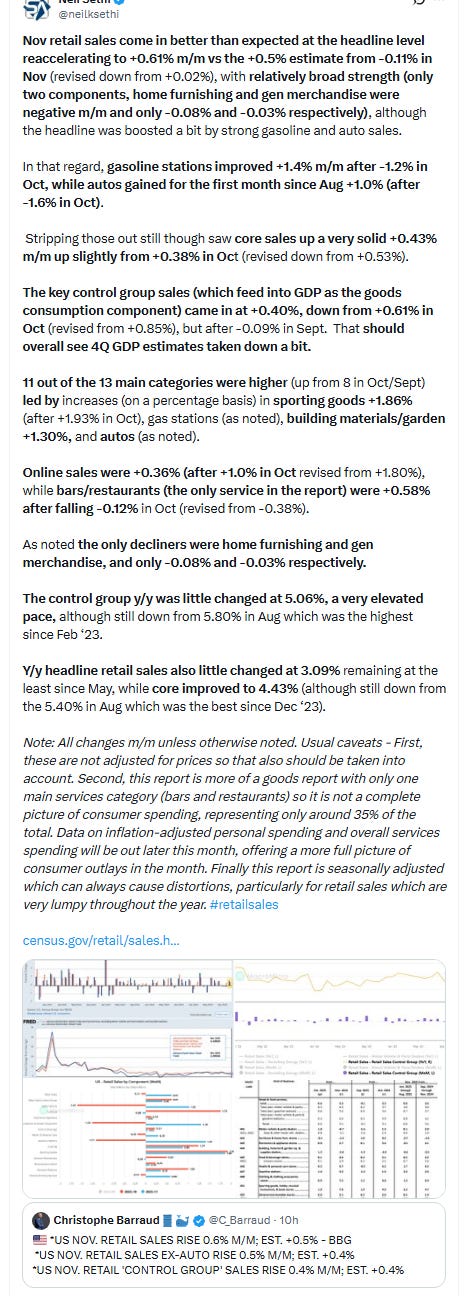
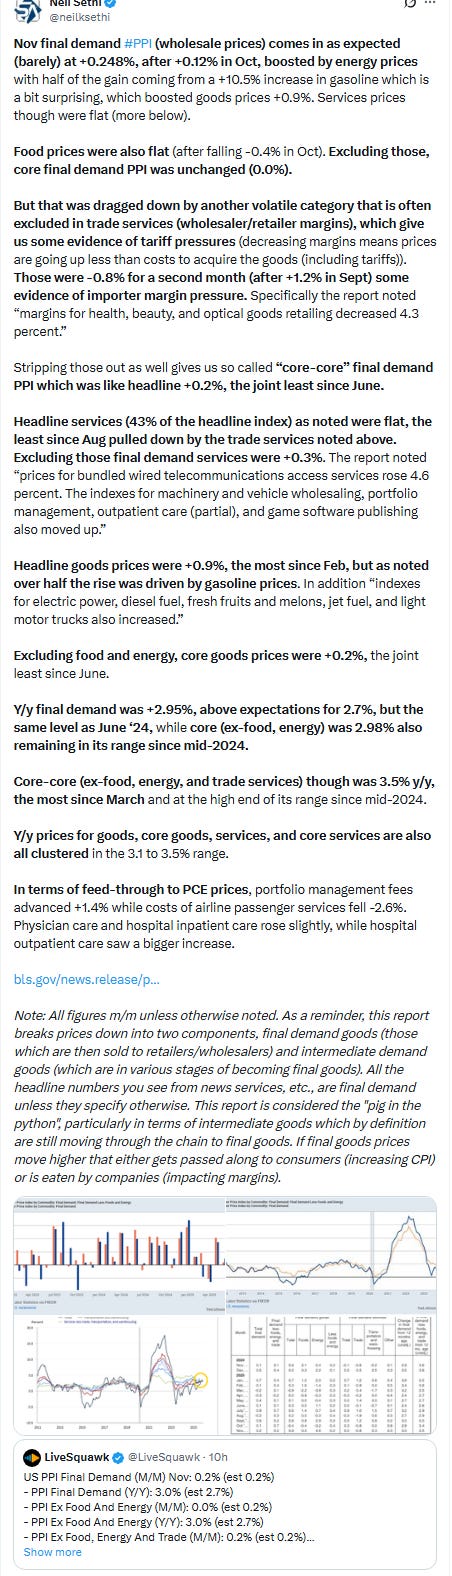
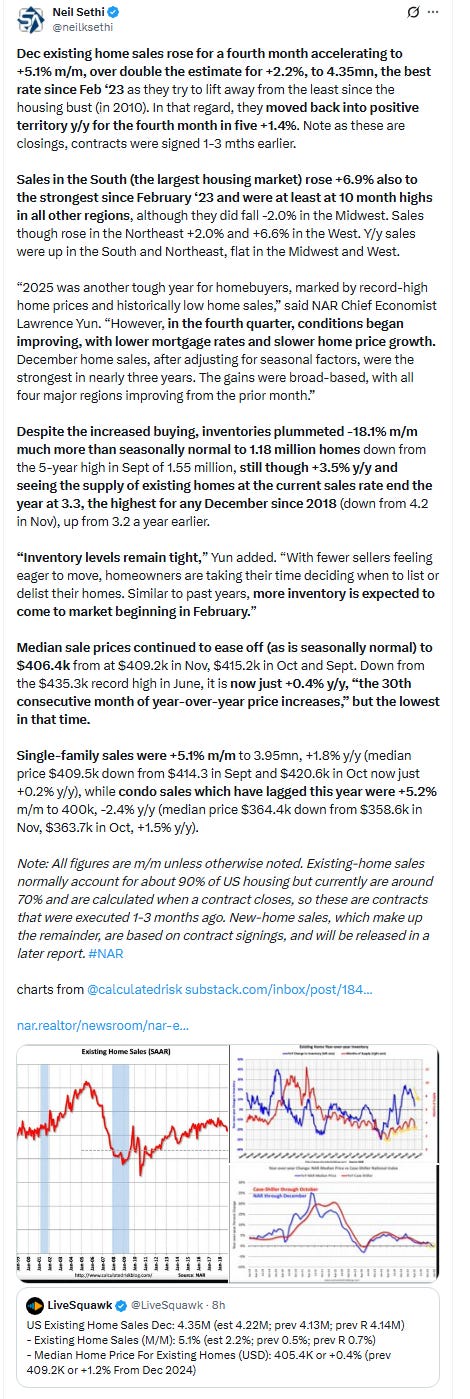
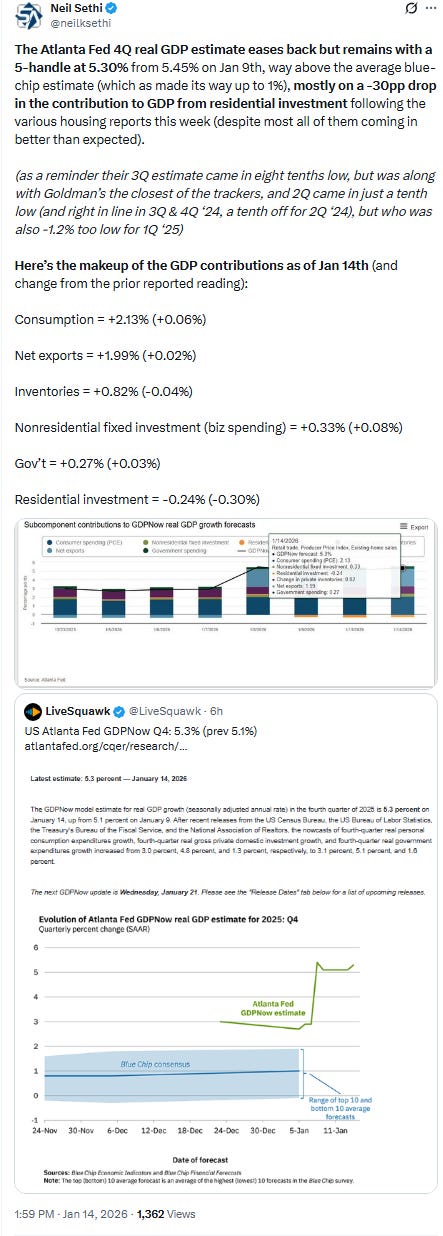
US equity indices opened lower after a better than expected retail sales report which showed consumer spending remained solid in November as well as a slightly hotter than expected producer price report on higher energy costs (although Fed rate cut expectations were unchanged following the releases), pressured by a continued rotation out of Tech and weakness in Financials despite strong big bank earnings. Indices bottomed at noon, and pushed higher, but just Russell 2000 made it in the green +0.7% (outperforming the SPX for 9th day, the most since 1990). An even spread across the indices saw the DJIA -0.1%, SPX -0.5%, and Nasdaq -1.0%.
Elsewhere, bond yields edged lower, while the dollar was little changed. Commodities ex-nat gas were higher with crude, bitcoin, gold and copper all gaining the latter two to all-time highs (and the former two breaking out of 1-month plus ranges).
The market-cap weighted S&P 500 (SPX) was -0.5%, the equal weighted S&P 500 index (SPXEW) +0.4%, Nasdaq Composite -1.0% (and the top 100 Nasdaq stocks (NDX) -1.1%), the SOXX semiconductor index -0.6%, and the Russell 2000 (RUT) +0.7%.
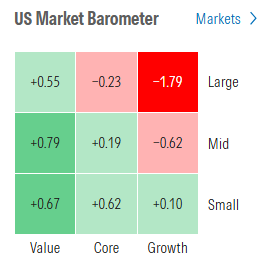
Morningstar style box clearly showed the weakness in the larger growth stocks.
Market commentary:
In a note titled “Not as Bad as It Looks,” Steve Sosnick at Interactive Brokers says a deeper look shows a more mixed market than the declines in major indices might indicate. “This is a demonstration of what occurs when rotation affects the stocks that dominate key indexes,” he added.
“The expectations for this earnings season are very high,” said Matt Maley at Miller Tabak. “If those expectations are not met in today’s stock market — which is priced for perfection — it’s going to create some headwinds.”
Regardless of what happens with tech stocks in 2026, Clark Bellin at Bellwether Wealth says he expects the “broadening story” to play an even bigger role this year as the bull market grinds along.
“Ultimately, we see a bit more downside for the S&P 500, but there are plenty of opportunities on the long-side as this ‘rotation nation’ continues,” said Jonathan Krinsky at BTIG.
A “rotational” bull market is likely after three strong years of returns, currently rewarding investors willing to rotate “down-cap” into value leaders showing relative strength, noted Craig Johnson at Piper Sandler.
“I actually believe strongly that the broadening out with smaller-cap names will be a trend to watch this year,” Dickson said in a phone interview. “Small-cap stocks have not seen the same performance as large-cap stocks in past years, and investors are looking for profit-taking opportunities and rotating into the smaller-cap areas of the market that haven’t appreciated as much.”
Stronger small-cap earnings, an overall lower level of interest rates and a solid economic backdrop “make the category as a whole look more attractive,” he added.
A market stall would not be unexpected given the rally, as a pause is becoming commonplace during earnings season in recent quarters due to a combination of a rally coming into earnings, skepticism over the durability of the consumer and the AI trade, and the blackout period for share repurchases, according to Mark Hackett at Nationwide. “That said, the balance of power remains squarely in the bulls’ favor given the economic strength, earnings acceleration, fiscal and monetary stimulus, and technical tailwinds,” he noted.
“The thing on most people’s minds is whether this a blip on the radar or something more serious,” said Ross Mayfield, a Kentucky-based investment strategist at Baird Private Wealth Management. “I’m of the opinion that it’s not all that serious. Anytime you have even the strongest of bull markets, you are going to have pauses or periods of weakness. But certainly, it’s always going to be difficult for broader indexes to continue higher if Big Tech is underperforming — and we are seeing that to start the year.” Mayfield added: “We are actually seeing a pretty healthy market under the surface,” despite the weakness in shares of large-cap technology companies. But he said one thing to keep in mind is that “if trade and military tensions with China ramp back up, that would be enough to drive risk-off sentiment.”
“[Wednesday’s] data likely doesn’t change anything for the Federal Reserve, which ended up cutting rates back in December even without knowing this data,” said Clark Bellin at Bellwether Wealth. “We expect the Federal Reserve to remain on hold for the next six months and then cut rates by one or two times in the second half of 2026.”
“If you translate this PPI number into what core PCE will look like, I think it’s going to come in a little hot,” said Tom Graff, chief investment officer at Facet. “If that’s true, then that’s a pretty big problem for the Fed. This exacerbates the worry about Fed independence.”
“What happens if we get to, let’s say, the second half of this year, there’s a new Fed chair and maybe the Fed should be hiking, or maybe they definitely shouldn’t be cutting, because the economy had kind of leveled out and inflation has picked back up,” Graff said. “Traders are gonna get worried about that.”Stock prices may be starting to reflect the potential impact of Trump’s demands, according to Paul Meeks, head of technology research at Freedom Capital Markets. “This is a hangover from the threat to Fed Chair Powell and bank earnings, which are being hit by companies talking about capping credit rates at 10% ... It’s just unnecessary anxiety,” he said. Meeks, a veteran tech analyst, added that Tuesday’s drawdown will likely bring in “some good buying opportunities” ahead of upcoming announcements from hyperscalers about their 2026 guidance and artificial intelligence capital expenditure plans.
The Supreme Court did not announce its ruling on tariffs Wednesday, adding “another layer of uncertainty over when is it going to happen and what’s going to happen, and there is some anxiety about this,” Ryan Detrick, chief market strategist at Omaha, Neb.-based Carson Group said in a phone interview. As for the potential credit-card cap, “there’s a lot of confusion over what that will mean.” “Investors are trying to bide their time and that’s led to a little bit of weakness after a very solid start to the year,” the strategist said. Meanwhile, the potential for a U.S.-Iran military conflict has led to “near-term jitters,” but “as we’ve seen over the past few years, the market has the ability to look past any potential drama in the Middle East as long as overall U.S. economic fundamentals remain solid, like they are now.”
On Wednesday, the Wall Street Journal reported that the U.S. military is evacuating some personnel from an air base in Qatar as President Donald Trump weighs whether to order military action in Iran. As a result, investors are “pricing in potentially higher oil prices if this expands into a conflict that starts to disrupt the supply and movement of oil,” which is resulting in a risk premium that’s dragging down the U.S. stock market, according to Tom Hainlin, a Minneapolis-based national investment strategist at U.S. Bank Asset Management Group. Meanwhile, the Supreme Court has not yet announced its ruling on Trump’s tariffs, which “leaves businesses and consumers wondering what the ultimate effective tariff rate is going to be, and leaves investors to respond to the information that is in front of them, which is that the economy continues to perform well and large businesses continue to generate profits,” Hainlin said in a phone interview.
While Tuesday’s CPI report may have looked promising, the impact of certain core goods components on the Federal Reserve’s preferred PCE Price Index shows that data are primed for a stronger reading -- potentially stoking concerns among the central bank’s policymakers about a reacceleration of inflation. 22V’s macro research team expects stocks to continue climbing this year, but investors should brace themselves from some bumps along the way as the evolving economic picture could challenge investors’ expectations. They recommended buying VIX calls. A call option on the VIX would most likely deliver a payoff if the S&P 500 suddenly jerks lower.
“The modal macro outcome is still one where real GDP growth is [about] 2.5% and core inflation [about] 2.5%, but the RISK that 2.5% real GDP growth will be inflationary has increased after the [unemployment rate] declined, wages firmed, and core inflation firmed in December. That means the risk that [financial conditions index] needs to tighten has also increased,” the team said.
Link to X posts - Neil Sethi (@neilksethi) / X for full posts/access to charts (all free).
In individual stock action:
Tech bogged down the broader market. Chip stocks in particular suffered losses, as Broadcom fell 4% and Nvidia and Micron Technology slid more than 1% each. On Wednesday, Reuters, citing people briefed on the matter, reported that Chinese customs authorities have advised customs agents that Nvidia’s H200 chips are not permitted to enter the country.
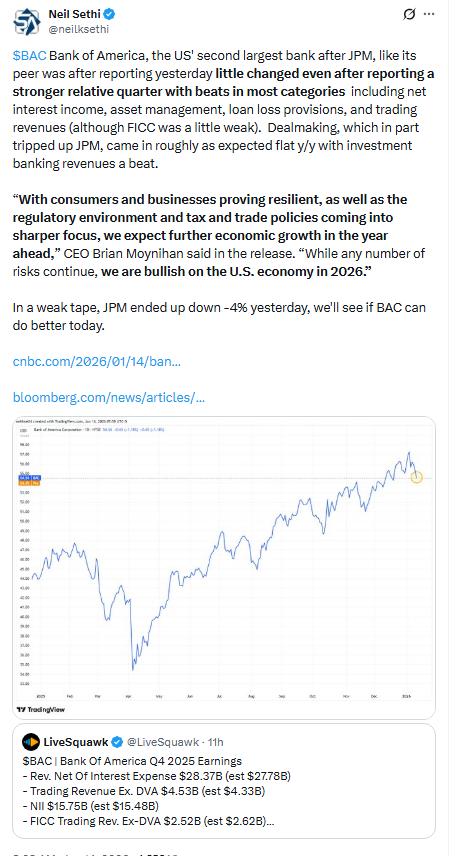
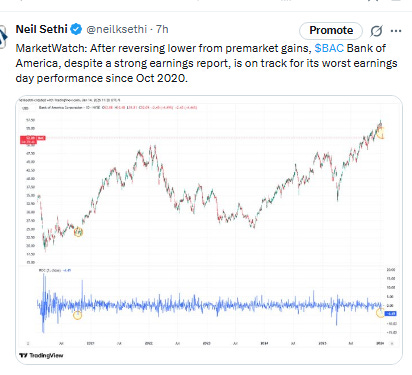
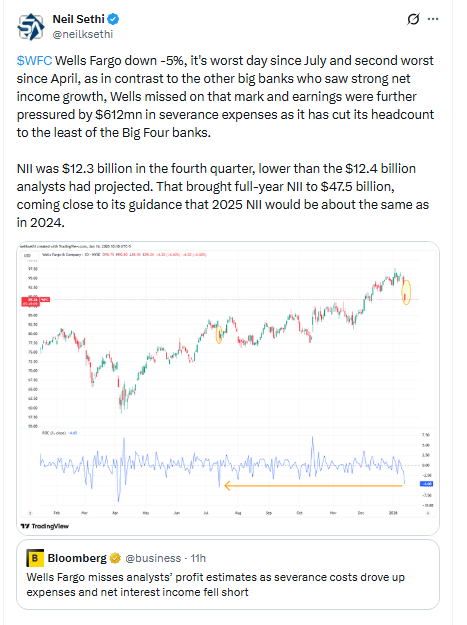
Wells Fargo was also among the laggards in the session, falling more than 4% after the company posted weaker-than-expected revenue for the fourth quarter. Bank of America and Citigroup were lower despite their results beating consensus estimates, as traders didn’t view them as strong enough to continue supporting a market trading near record highs. That adds to their losses for the week in the wake of President Donald Trump’s call for credit card interest rate reform that he made on Friday. Citigroup has fallen more than 7% week to date, while Bank of America is off roughly 6%. Wells Fargo is down almost 7% through Wednesday’s close.
Corporate Highlights from BBG:
OpenAI signed a multiyear deal to use hardware from Cerebras Systems Inc. for 750 megawatts’ worth of computing power, an alliance that will support the company’s rapid build-out of AI infrastructure.
Alphabet Inc.’s Google said its Gemini artificial intelligence assistant can now proactively tap into users’ data across Gmail, Search, Photos and YouTube, an attempt to make its consumer-facing AI product more personalized.
Infosys Ltd. raised its annual sales forecast, signaling that a protracted slump in corporate information technology spending is starting to ease helped by adoption of newer technologies such as artificial intelligence and cloud services.
Honda Motor Co. plans to increase production of cheaper gasoline-fueled vehicles this year, a reflection of lower US emissions standards and a new-car affordability crisis.
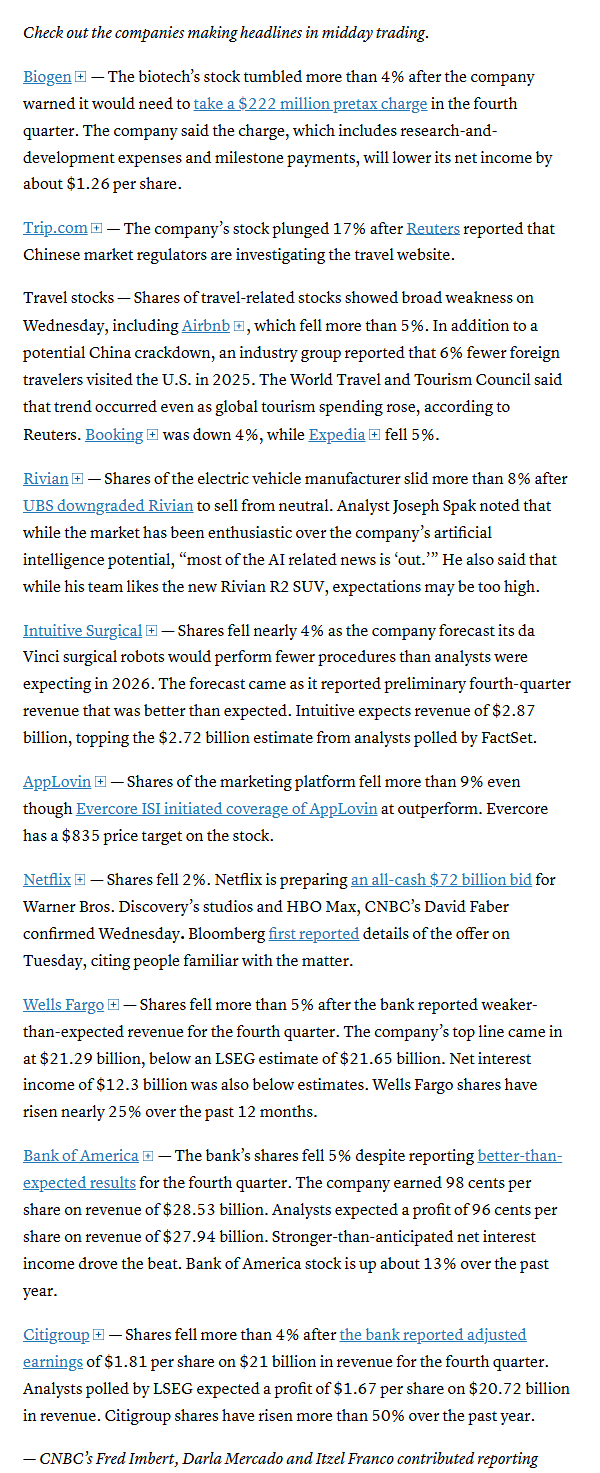
Mid-day movers from CNBC:
In US economic data:

Link to posts for more details/access to charts (all free) - Neil Sethi (@neilksethi) / X
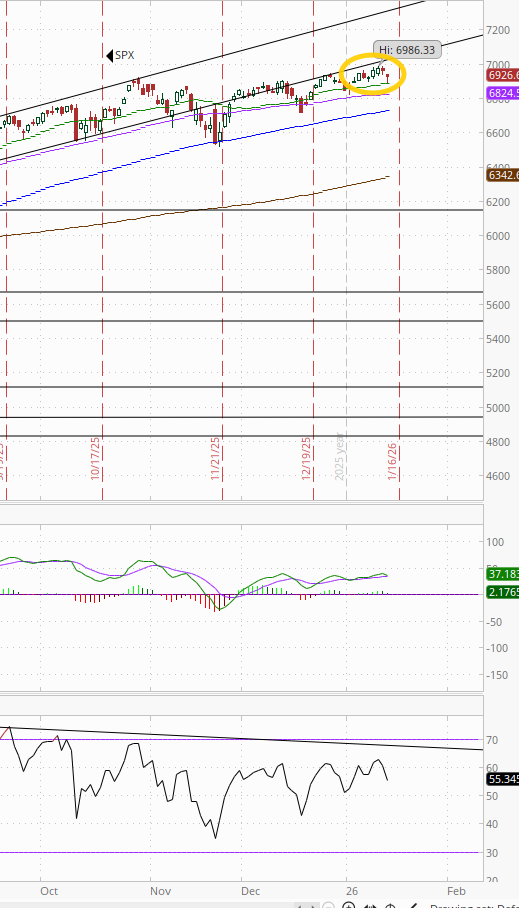
The SPX edged back further from its ATH finding some support at its 20-DMA. The daily MACD and RSI are both neutral with a negative divergence but at least had made new local highs.
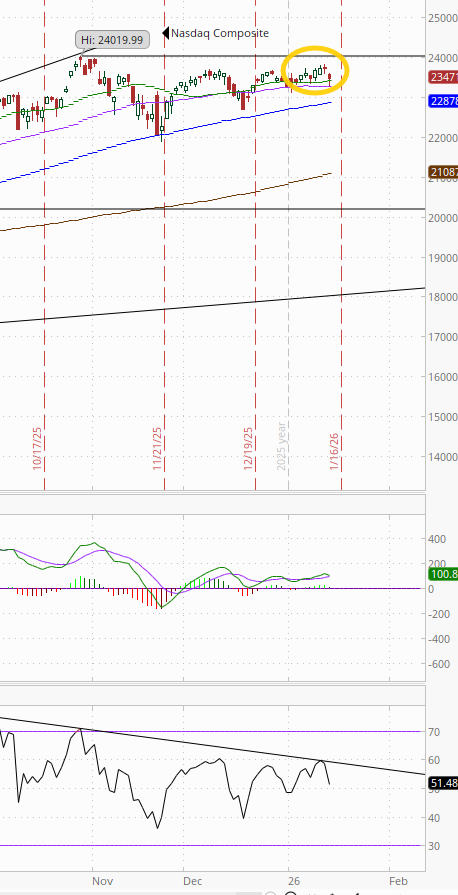
The Nasdaq Composite made it to the 50-DMA.
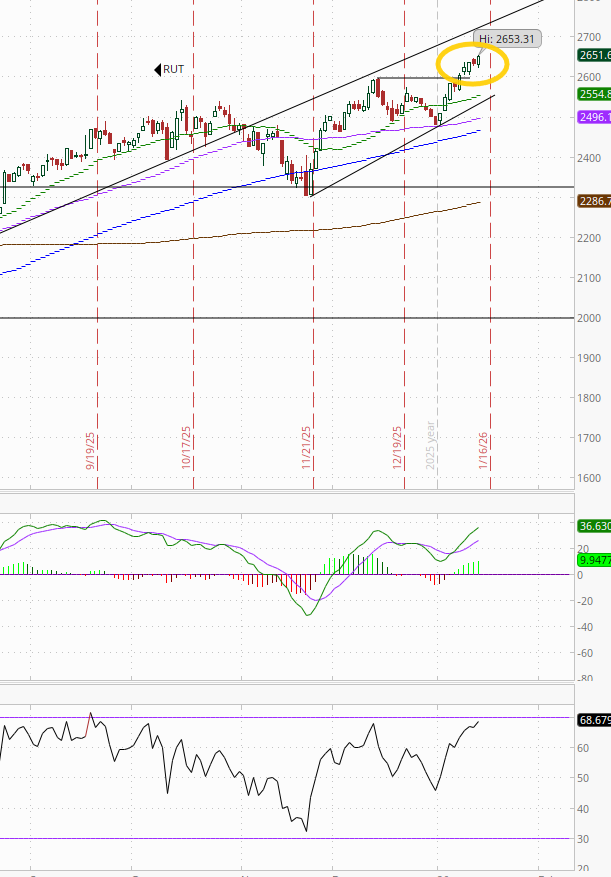
RUT (Russell 2000) remains the best chart of the bunch continuing on its rebound from its 50-DMA hit two weeks ago with another ATH. Its MACD as noted Wed did cross to a “go long signal” and the RSI is now over 60.
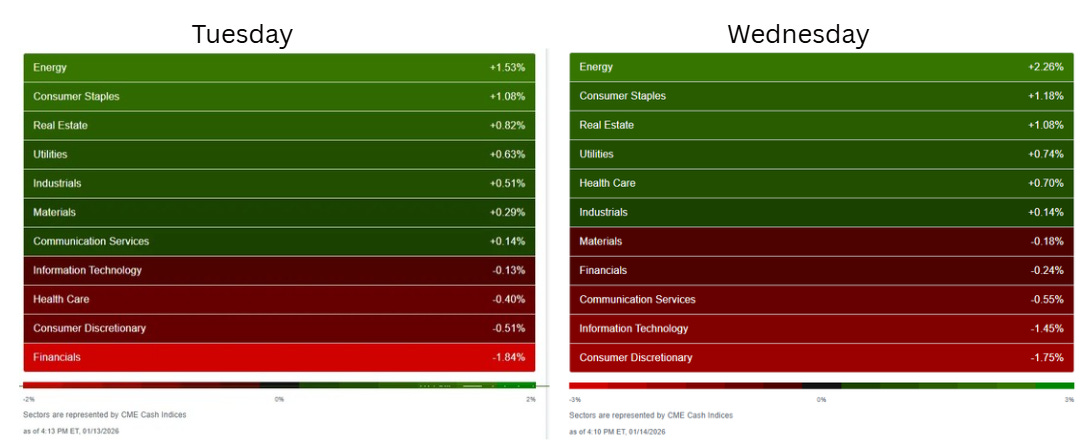
Sector breadth according to CME Cash Indices (uses futures prices) remained relatively healthy (as it’s been all year ex-Wed) but with more dispersion with the winners doing better but the losers doing worse.
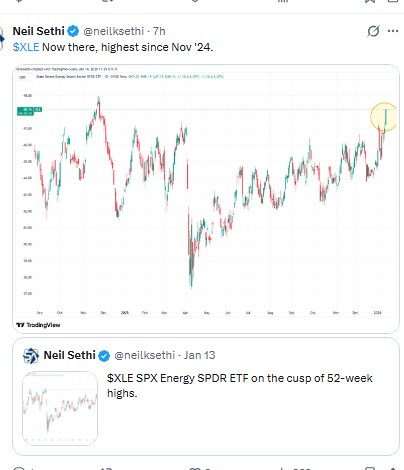
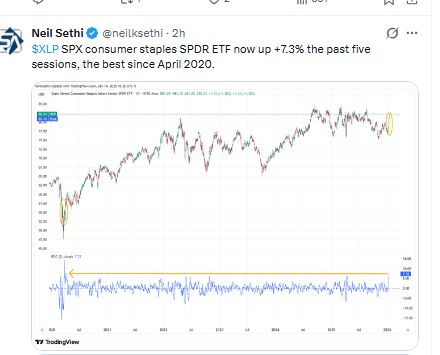
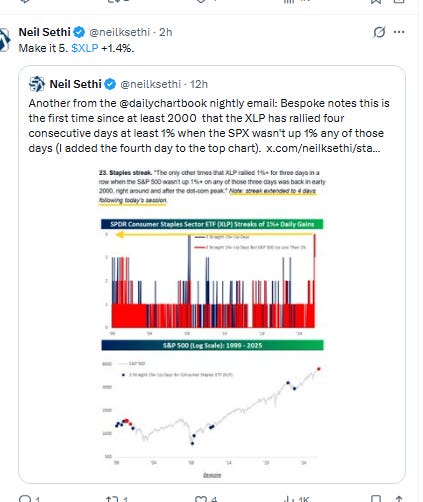
6 of 11 sectors were higher (only the second time this year there have been fewer than 7 sectors higher (the other a week ago)), but five were up over +0.7% (vs three Mon/Tues, seven Fri, six Thurs) and three at least +1% (vs two Tues, one Mon, but five Fri, four Thurs). The top four was the same (in the same order) for a second session: Energy, Staples, RE, Utilities (Staples are now up +7.3% the past five sessions, the best since April 2020).
But we also had three sectors down more than -0.5% (up from two Mon/Tues after none Fri) and two down more than -1% (after one Tues) in Cons Discr and Tech (and Comm Services completed the trifecta with the three megacap growth sectors finishing at the bottom and explaining the headline weakness).
Financials were next, down for a fourth session, now down but only one was much more than that (Financials -1.8% (down for a fourth session, now down -3.1% the past four sessions, the second most (after Nov) since Apr).
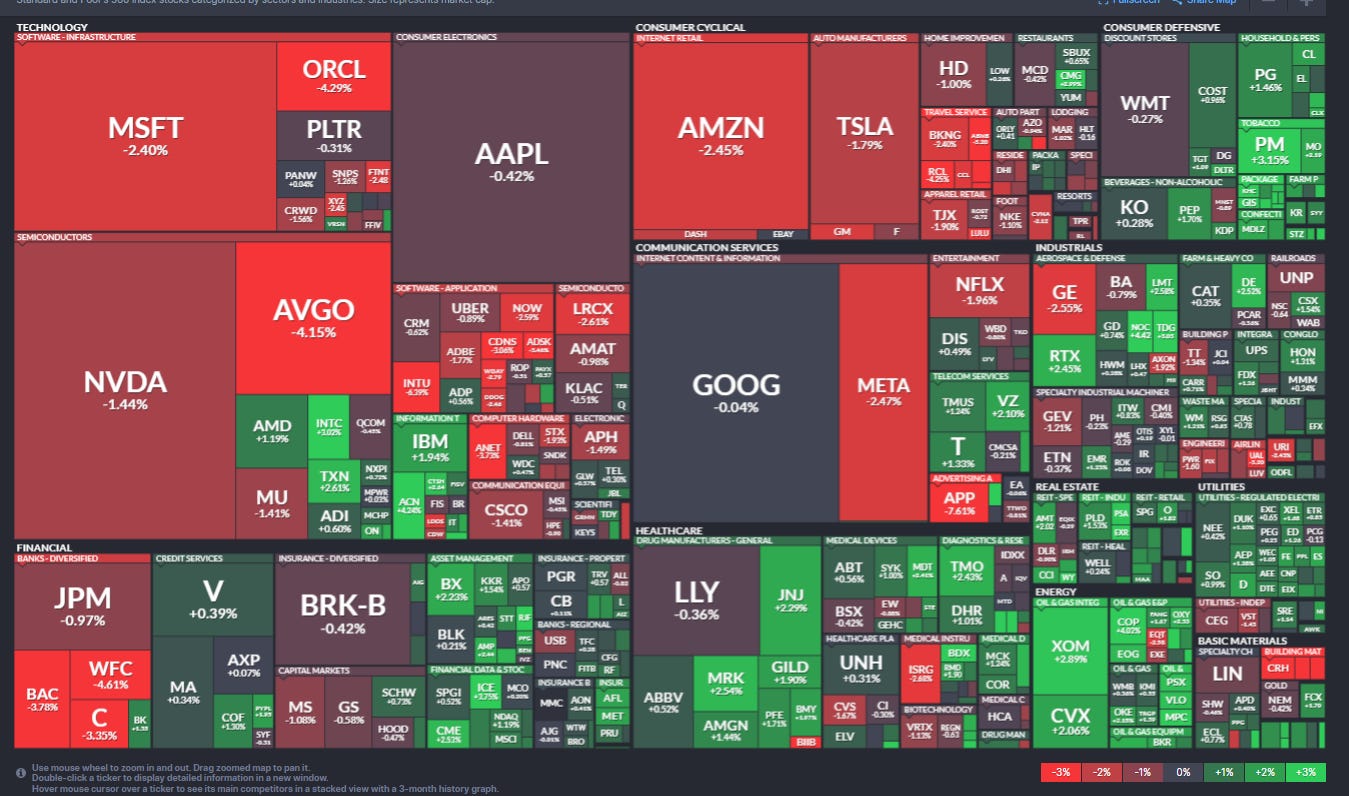
SPX stock-by-stock flag from @finviz_com for Wednesday consistent looking a lot like Tuesday just with the green and red spreading across the sectors that were strong/weak Tuesday and lot more of it bright.
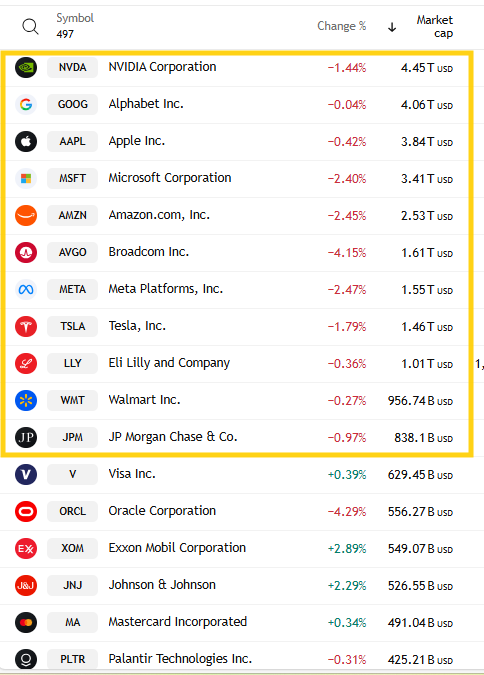
All 11 of the largest 11 SPX components were lower (which we also saw New Year’s Eve but not very often otherwise)). AVGO easily led to the downside -4.2%. META, AMZN, MSFT were all down around -2.4%. The closest to flat was GOOG which was down just -0.04%. AAPL, LLY, WMT were also all down less than -0.5%.
Mag-7 -1.6%, putting it down around -2.1% week-to-date (after gaining +0.7% last week rebounding from its worst week since April).
~25 SPX components were up 3% or more (after 17 Tues, 15 Mon, 45 Fri, 70 Thurs, 12 last week). In a second day of a pivot away from 2025 leaders LyondellBasell LYB (another one of 2025’s big losers after MRNA yesterday) led +6.8% after an upgrade (to Neutral lol). Just four of those 25 up 3% or more were >$100bn in market cap (after 3 Tues, 2 Mon, 15 Fri) in ACN, COP, PM, INTC (again) (in descending order of percentage gains).
~20 SPX components down -3% or more (down from 25 Tues, up from 12/13 Fri/Mon) led by Applovin APP -7.7%. Eight of the 20 down -3% or more were >$100bn in market cap (matching Tues, up from three Mon, one Fri, seven Thurs) in APP, INTU (again), WFC, ORCL, AVGO, BAC, ANET, C (in order of percentage losses).
NYSE positive volume (percent of total volume that was in advancing stocks (these also use futures)) improved for the first time since Thursday to 63.6%, the best since then, and a very good performance considering the index gained only +0.29%. So that means the positive volume exceeded both Friday and Thursday when the gains were more around +0.46%.

The Nasdaq positive volume (% of total volume that was in advancing stocks) even more impressive improving to 69.2% despite the index losing -1%. That is the best since Jan 5th (when the index gained +0.89%) and exceeds Mon, Fri, and Jan 6th when the index saw gains.
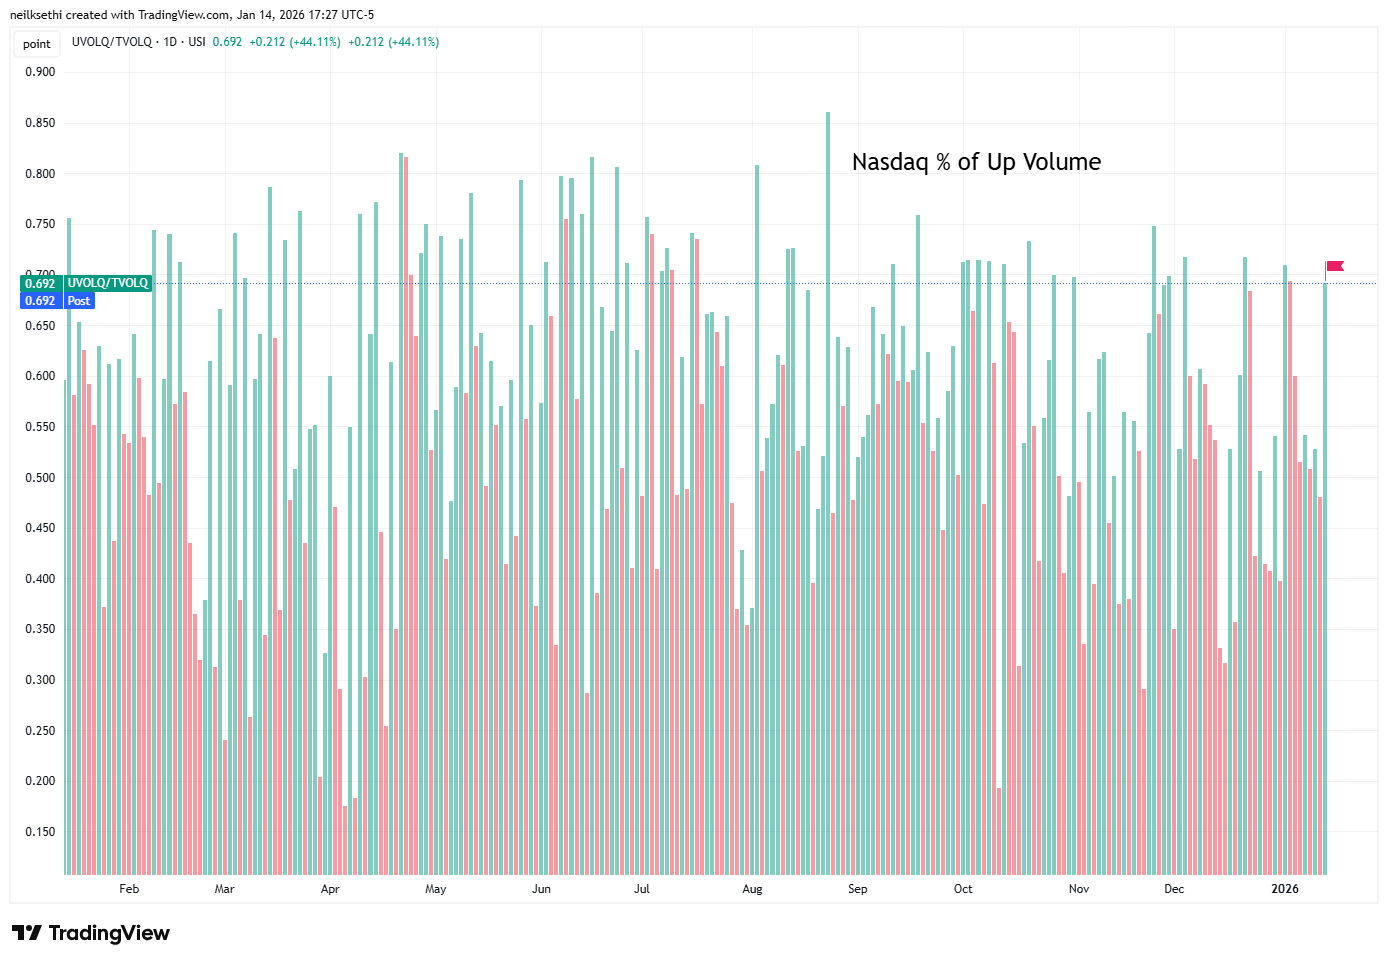
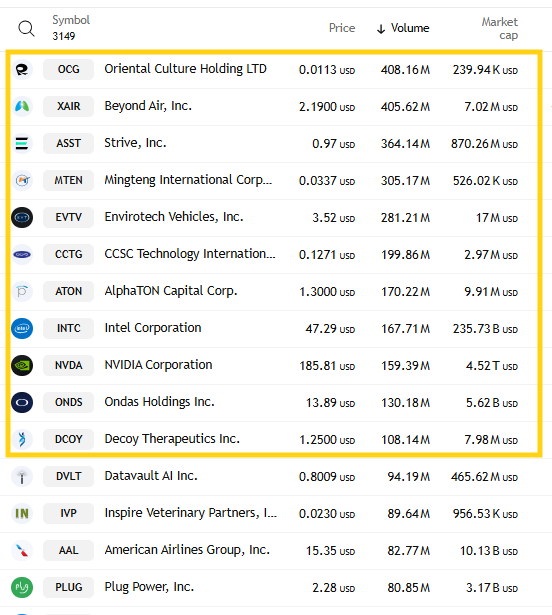
But as you probably already guessed means speculative volume is really back. The top stock by volume on the Nasdaq alone accounted for 2.6bn in shares traded (that’s more than we’ve seen for the top 15 stocks together most days since the summer, and number two was another 1bn.
The top three stocks together were nearly 4bn shares (all penny stocks as were the fourth and fifth most traded) or nearly a quarter of the total volume on the index. And there were another seven that traded over 100mn shares.
Positive issues (percent of stocks trading higher for the day), which are not inflated by high speculative volumes, as you might guess again saw divergence from positive volume on the Nasdaq but still at 55% which is quite good for a -1% day, while the NYSE was 62.7%.
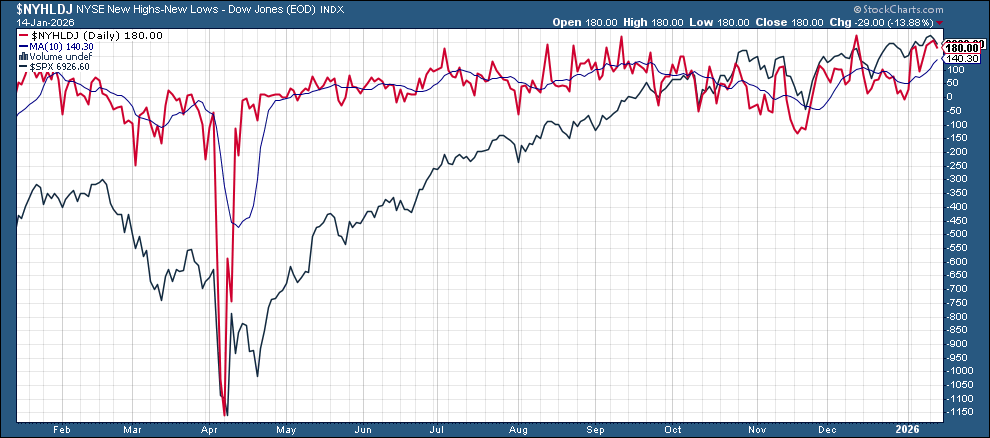
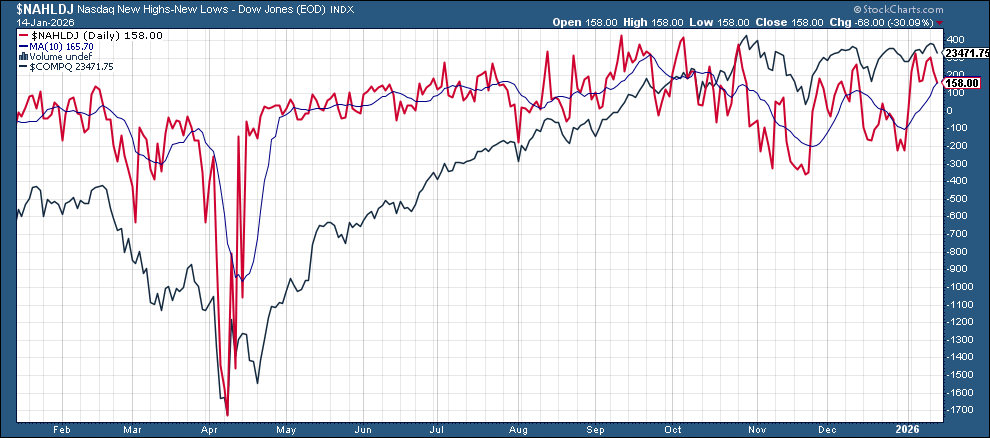
New 52-wk highs minus new 52-wk lows (red lines) though weakened to 180 on the NYSE (despite the positive day), although just down 10 from the second highest since Aug, while the Nasdaq fell to 154.
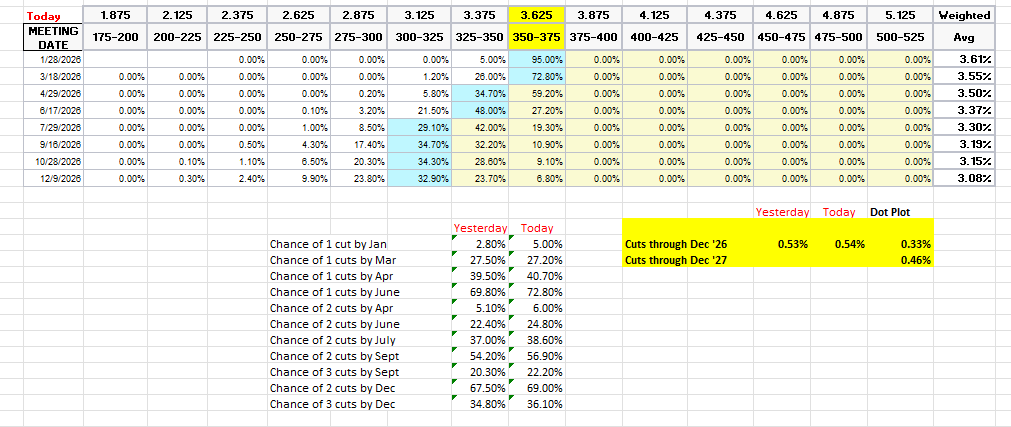
#FOMC rate cut pricing for 2026 ended up firming (more cuts) a bit after we had some relatively constructive Fed speakers but still overall near the least (fewest) cuts since the Dec FOMC according to the CME’s Fedwatch tool. January remains off the table unless the Fed chooses to revive it (unlikely) at 5%. March is just 27% (from 51% Jan 6th), April 41% (from 63%), with the first cut in June (73%). A second cut is not until Sept (57%) with chances of two cuts by July now 39% (from 55% Jan 6th).
Pricing for 2026 edged a touch higher to 54bps, with pricing for two cuts 69% and three cuts 36%, down though from 68bps Dec 3rd (and 80bps mid-Nov which was highest we’d been for 2026 cuts)).
The dot plot as a reminder has 33bps for the average dot for 2026.
Remember that these are the construct of probabilities. While some are bets on exactly one, two, etc., cuts some of it is bets on a lot of cuts (3+) or none (and may include a hike at some point).
The 10yr #UST yield edged down to 4.14%, moving towards the bottom of its range since the start of December. As noted Friday, it has traded in a 10bps range since then despite all of the headlines (including today’s).

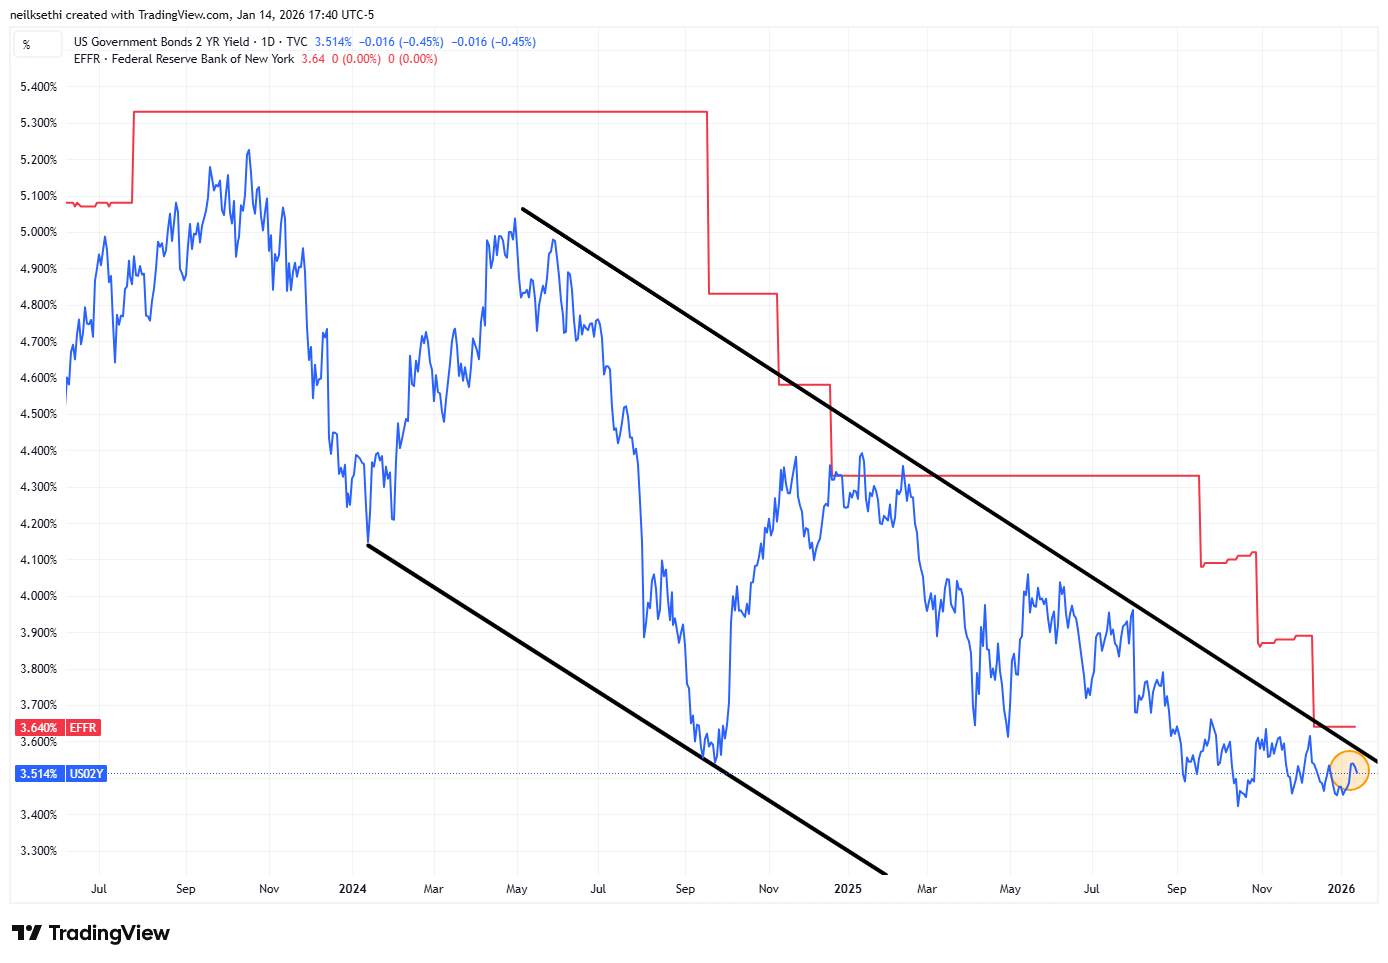
The 2yr yield, more sensitive to FOMC rate cut pricing, also edged lower from the highs of the year to 3.51%, just 8bps above the least since 2022, and again turning down from near the top of the channel it’s been in since the start of 2024, -13bps below the Fed Funds midpoint. Outside of recessions it is normally above by around +50bps on average, so still calling for at least a couple more rate cuts.
The Effective Fed Funds Rate (red line) remained at 3.64%.
This seems like a fairly rich yield at these levels unless we really aren’t going to get any more rate cuts (then it’s a bit expensive (i.e., yield should be higher)). That said I just don’t know that I want to buy 2-years at what is basically the 1-month yield.
The $DXY dollar index (which as a reminder is very euro heavy (57%) and not trade weighted) little changed for a fourth session sitting right around the 50 and 200-DMAs as just above a trendline running back to the start of last year
It has not sustained a breakout above the 200-DMA since it fell under last February. As noted Fri, the daily MACD has now crossed to “cover shorts” positioning and the RSI is near the best since Nov (but back under 60) giving some technical support to a breakout.

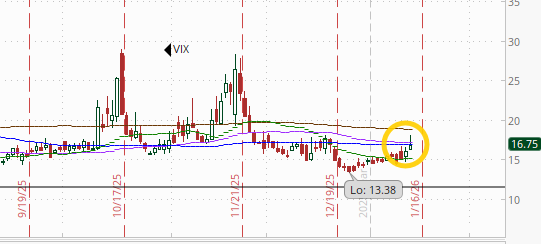
VIX moved to the highest close in nearly a month at 16.8. The current level is consistent w/~1.08% average daily moves in the SPX over the next 30 days.

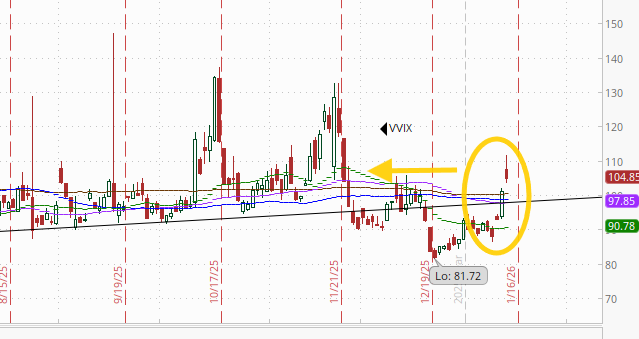
The VVIX (VIX of the VIX) jumped again after its largest move higher since Nov 20th (NVDA earnings) Tues to its highest close since around that time at 105 (up from 93.1 Mon and 81.7 Dec 24th), although it did finish near the lows of the day.
The current level is now consistent with “moderately elevated” daily moves in the VIX over the next 30 days (historically normal is 80-100, but we’ve been above 90 almost the entire time since July ‘24)). 100 is also a level flagged by Charlie McElligott as one to watch.
And like the VIX and VVIX, the 1-Day VIX continues to move higher now at 11.8. The current reading implies a ~0.74% move in the SPX next session.

I noted Friday “we finally have a tentative breakthrough, as #WTI futures closed Friday for the first time above both the 50-DMA and downtrend line from the July highs since that time,” and they built on that again Wednesday taking them all the way to the 200-DMA target (brown line) where they failed (as I expected on the first try).
Daily MACD remains supportive (cover shorts) and RSI is strongest since June, so I expect it will test that level again subject to news headlines (de-escalation with Iran, etc.).

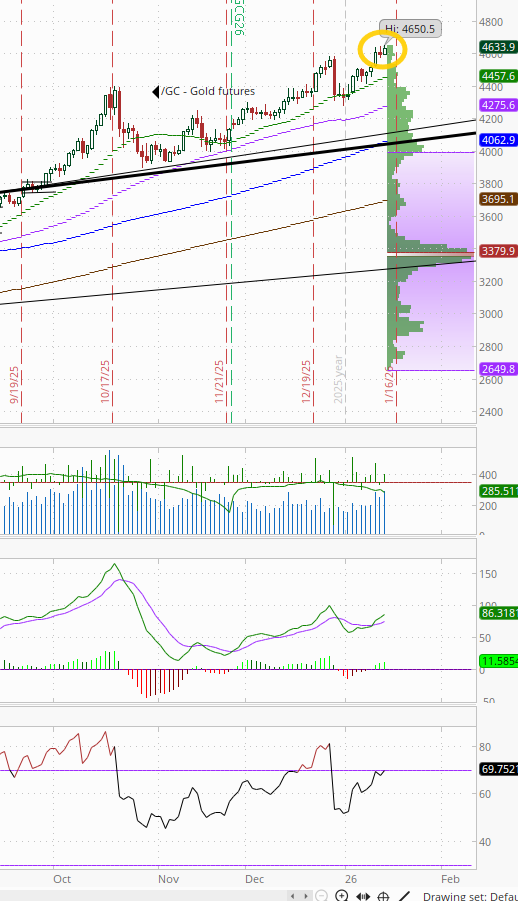
Gold futures (/GC) edged to another all-time high. Daily MACD remains in “go long” positioning, while the RSI is over 60.
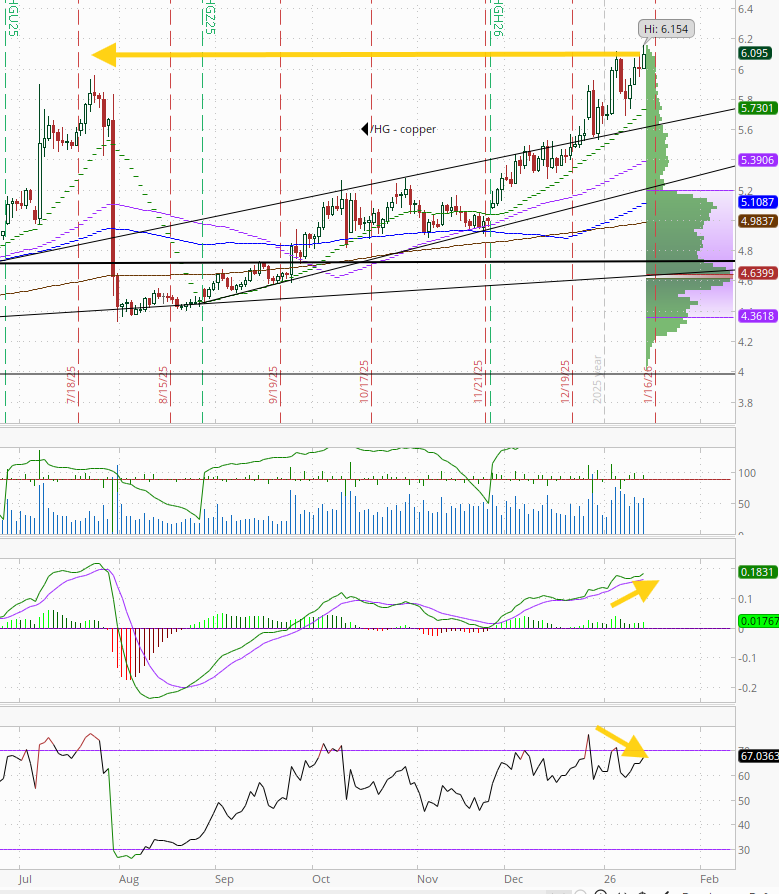
US copper futures (/HG) also made a new all-time high. Daily MACD remains in “go long” positioning while the RSI still has a negative divergence (lower high, minor).
Longer term, copper futures remain in the grinding uptrend since August (and longer than that in the uptrend started in March 2020).
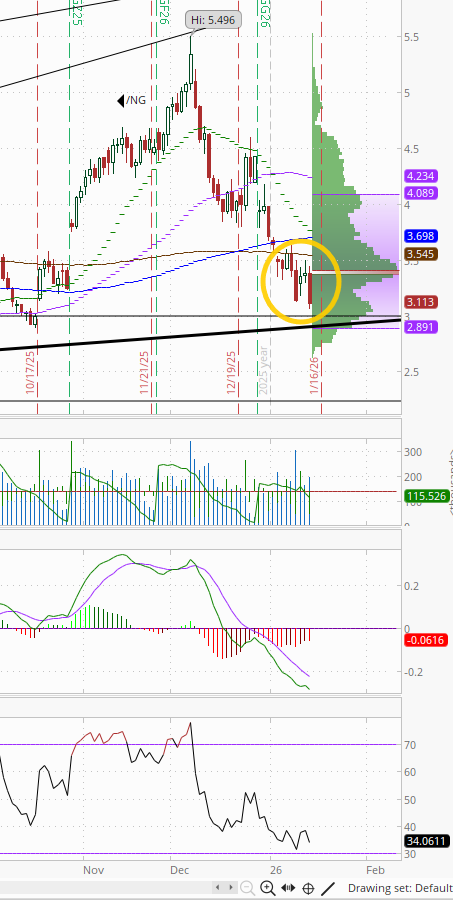
On natgas futures (/NG) I noted Mon, “we’ve seen bounces several times during this decline, so need to see more before I take the $3 target off,” and sure enough they gave back all of the prior two session gains to hit new 3-month lows (down around -46% from the peak Dec 5th).
The daily MACD remains firmly in ‘go short’ positioning, and RSI is still around the weakest since April. Not far from that $3 target now though.
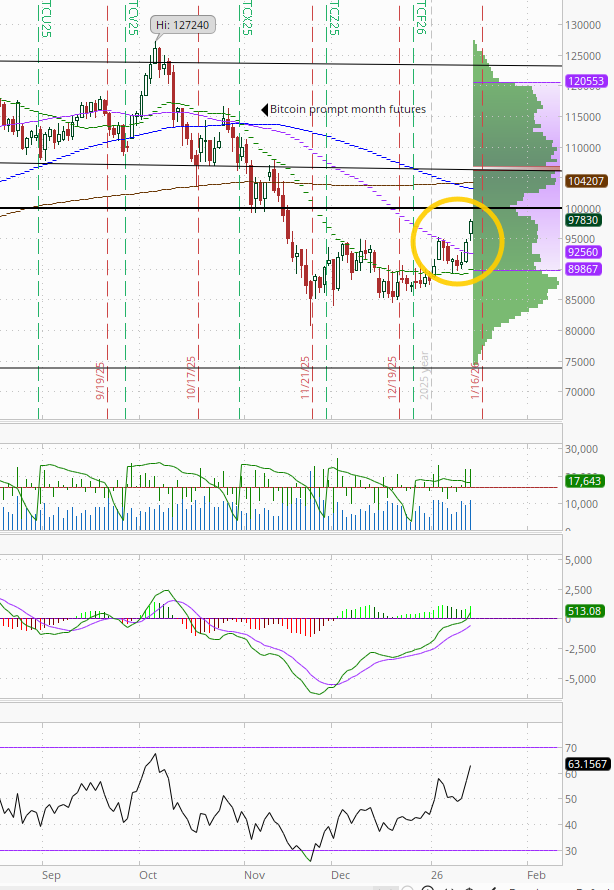
I asked Tues if Bitcoin futures were “perhaps ready for a run to $100k?” after they made it through the 50-DMA (the first close over the 50-DMA since October), and they got halfway there Wed up +3.6% and clearing the $95k level.
The daily MACD still remains in “cover shorts” positioning (positive), while the RSI is over 50, so might have enough to get through, but probably won’t be easy.
The Day Ahead
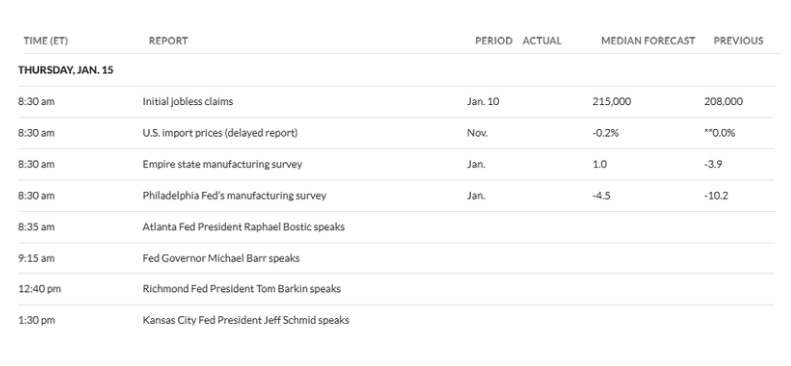
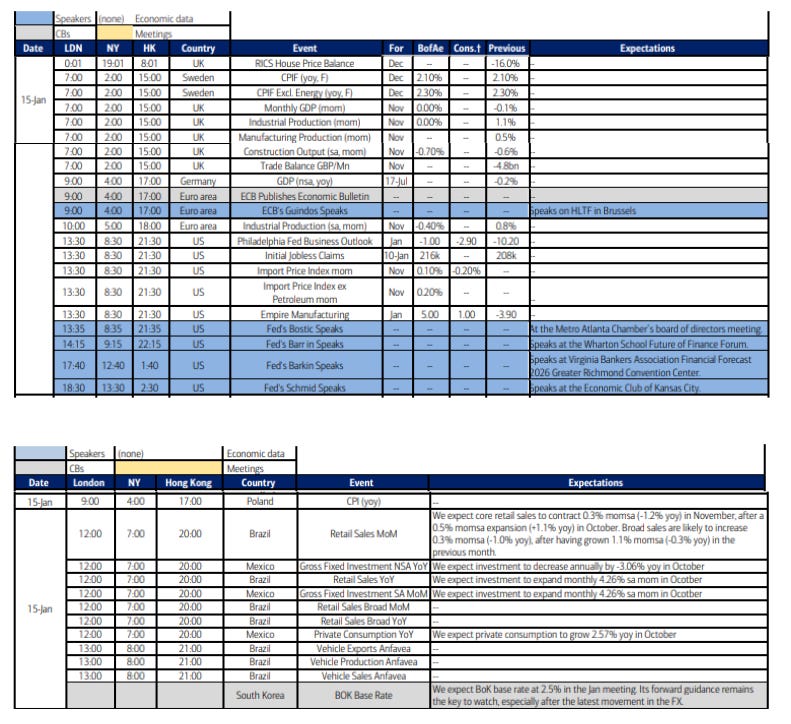
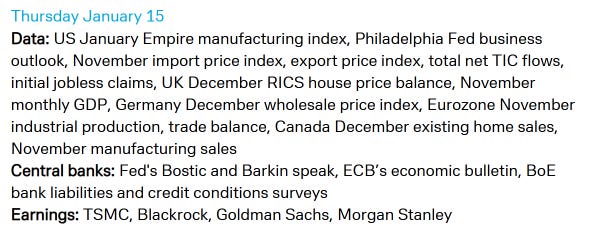
US economic data starts to ease up from Wednesday’s peak with Thursday bringing us just weekly jobless claims, the NY and Philadelphia Fed manufacturing PMIs and a delayed (Nov) import prices report.
More Fed speakers although again most of them we have heard from in the past week. The one we haven’t, though, is Gov Barr who had been aligned with the core of the Fed (Powell, Jefferson, Williams) but has split off in a more hawkish direction of late. I’d imagine that hasn’t changed. We’ll also hear for the first time of late from Kansas City Fed Pres Schmid, but he has rolled off the FOMC, as well as outgoing Atlanta Fed Pres Bostic (again) and Richmond Pres Barkin (for a fourth time this week I believe, also not a voter this year).
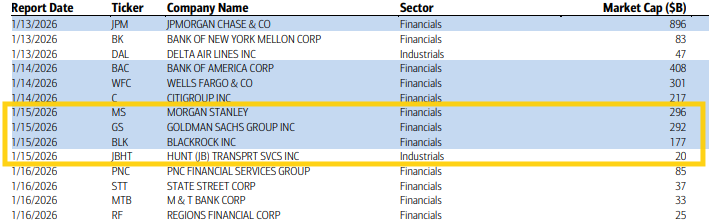
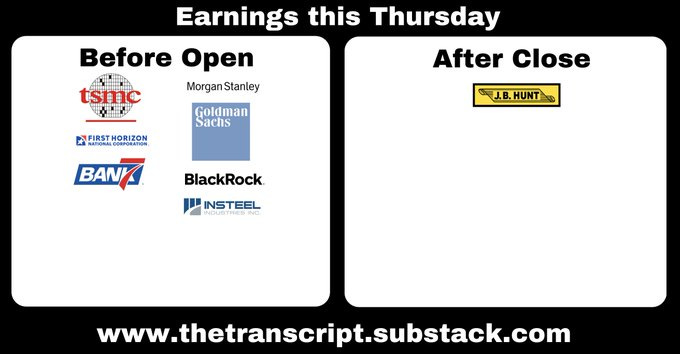
Q4 SPX earnings season continues Thurs with another 4 SPX reporters, three of which are over $100bn in market cap in more financial heavyweights MS, GS, BLK (in order of market cap). The other reporter is JB Hunt JBHT who might give us some insight on the economy.
Ex-US DM as noted Sunday is a light week, but Thursday a little heavier. Highlights are Japan PPI, UK GDP and RICS house prices, Eurozone industrial production and trade balance, German GDP, ECB economic bulletin.
In EM, highlights are a policy decision from South Korea and trade figures, India trade numbers, Brazil retail sales, and Poland CPI
From Goldman:
Thursday, January 15
08:30 AM Initial jobless claims, week ended January 10 (GS 215k, consensus 215k, last 208k)
Continuing jobless claims, week ended January 3 (consensus 1,900k, last 1,866k)
08:30 AM Import price index, November (consensus -0.1%, last flat [September])
08:30 AM Philadelphia Fed manufacturing index, January (GS 1.0, consensus -1.9, last -8.8)
08:30 AM Empire State manufacturing survey, January (consensus +1.0, last -3.9)
08:35 AM Atlanta Fed President Bostic (FOMC non-voter) speaks
Atlanta Fed President Raphael Bostic will deliver remarks at the Metro Atlanta Chamber’s board of directors meeting. Audience Q&A is expected.
09:15 AM Fed Governor Barr speaks
Fed Governor Michael Barr will participate in a panel discussion on stablecoins at the Wharton School Future of Finance Forum. Moderated Q&A is expected. On November 20th, Governor Barr said that “we need to be careful and cautious now about monetary policy, because we want to make sure we’re achieving both sides of our mandate.”
12:40 PM Richmond Fed President Barkin (FOMC non-voter) speaks
Richmond Fed President Tom Barkin will speak at the Virginia Bankers Association 2026 Financial Forecast in Richmond.
01:30 PM Kansas City Fed President Schmid (FOMC non-voter) speaks
Kansas City Fed President Jeff Schmid will speak on the economic outlook and monetary policy at the Economic Club of Kansas City. Speech text and audience Q&A are expected. On December 12th, President Schmid said that he dissented against the decision to lower the fed funds rate at the December FOMC meeting because “inflation remains too high, the economy shows continued momentum, and the labor market—though cooling—remains largely in balance.” He added that he views “the current stance of monetary policy as being only modestly, if at all, restrictive.”
Link to X posts - Neil Sethi (@nelksethi) / X
To subscribe to these summaries, click below (it’s free!).
To invite others to check it out,