
Markets Update - 1/16/26
Update on US equity and bond markets, US economic data, the Fed, and select commodities with charts!

To subscribe to these summaries, click below (it’s free!).
To invite others to check it out (sharing is caring!),
Link to posts - Neil Sethi (@neilksethi) / X
Note: links are to outside sources like Bloomberg, CNBC, etc., unless it specifically says they’re to the blog. Also please note that I do often add to or tweak items after first publishing, so it’s always safest to read it from the website where it will have any updates.
Finally, if you see an error (a chart or text wasn’t updated, etc.), PLEASE put a note in the comments section so I can fix it.
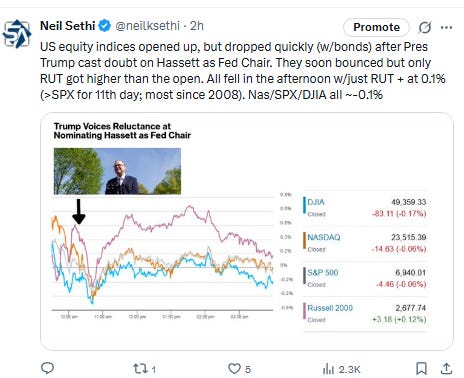
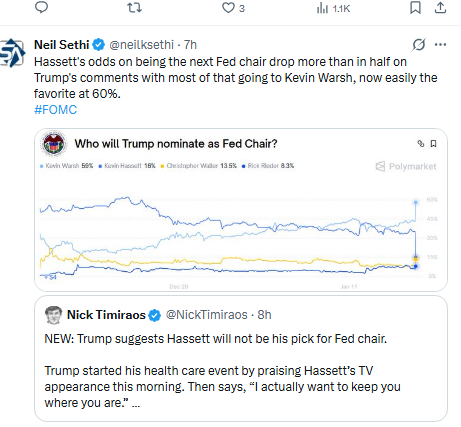
US equity indices opened modestly higher with tech stocks, like before Thursday’s open pushing the Nasdaq to an early lead. That lead though again evaporated in the first hour (outside of semiconductors) as indices (along with bonds) dropped after Pres Trump cast doubt on NEC Director Kevin Hassett as Fed Chair. “I actually want to keep you where you are, if you want to know the truth,” Trump told Hassett during a White House event. “If I move him, these Fed guys — certainly the one we have now — they don’t talk much. I would lose you. It’s a serious concern to me.”
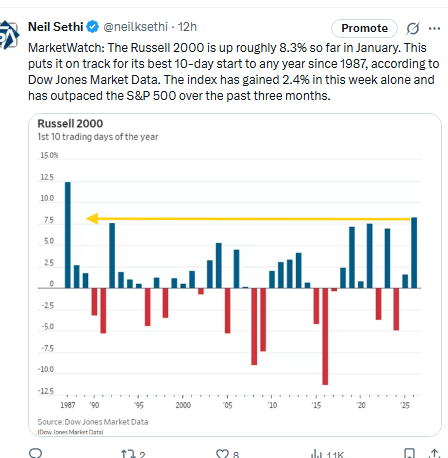
Indices soon bounced, but only the small cap Russell 2000 (RUT) got higher than where it opened. All the major indices though fell in the afternoon with just the RUT ending positive (at +0.1% but outperforming the SPX for an 11th day; the longest streak since 2008). The Nasdaq/SPX/DJIA all finished down around -0.1%.
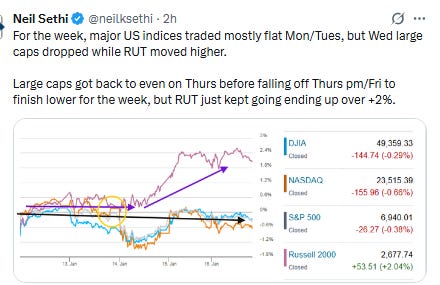
For the week, it was a bigger gap with the RUT ending up over +2% while the other indices were modestly lower. As always, more details on performance below.
Elsewhere, bond yields were higher pushing out of recent ranges, while the dollar edged higher. Crude stabilized as did natgas while gold, copper, and bitcoin were lower for a second day. Details below as well.
The market-cap weighted S&P 500 (SPX) was -0.1%, the equal weighted S&P 500 index (SPXEW) -0.3%, Nasdaq Composite -0.1% (and the top 100 Nasdaq stocks (NDX) -0.1%), the SOXX semiconductor index +1.2%, and the Russell 2000 (RUT) +0.1%.
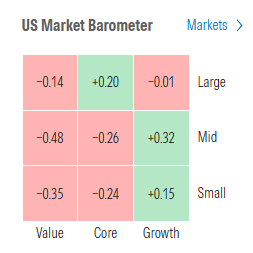
Morningstar style box showed relative weakness in most styles although changes were modest across the box.
Market commentary:
“The [earnings] results so far show, at least for the banks, that the consumer is okay, deal activity and capital markets are healthy, earnings revisions are still very positive,” said Andrea Gabellone, head of global equities at KBC Global Services. “In the meantime, you have some big tailwinds, like the weak dollar.”
“The favorable macroeconomic environment, characterized by contained inflation and accelerating growth, allows markets to withstand geopolitical tensions and continue their upward trajectory despite uncertainties,” said Florian Ielpo at Lombard Odier Asset Management.
“Incoming data continue to point momentum in consumer spending, less downside risk to labor markets and manufacturing, and limited upside risk to inflation,” said Michael Gapen at Morgan Stanley.
“There is scope for some diversification away from concentrated positioning,” said Geoff Yu, senior macro strategist at BNY. “This doesn’t need to come at the expense of the broader market. A rising tide can lift all boats as the US economy is still expanding and expectations for market returns remain favorable.”
“Investors typically like to see small caps rally because most of their money is made domestically, so gains there tend to reflect bets on a booming economy,” said Hardika Singh at Fundstrat Global Advisors. “That’s a good sign because over the past year, investors watched every single economic report with a clenched jaw for signs of a downturn that are yet to turn up.”Singh notes that there’s growing hope that this rally isn’t a “headfake” like the other ones have been since the pandemic.
“Given longstanding concerns about the market being dominated by a handful of megacap tech names, some rotation away from them is arguably a healthy longer-term development, even if it feels disconcerting in the near term. We may finally be seeing the “broadening out” that so many people have looked for,” said Daniel Skelly, head of Morgan Stanley’s Wealth Management Market Research & Strategy Team.
“There’s a new king of the hill to start 2026,” said Brian Jacobsen at Annex Wealth Management. “Instead of large‑cap growth, small‑cap value is taking the crown. After years of head‑fakes — moments when it seemed big‑cap tech’s dominance might finally give way to broader market participation — the long‑anticipated ‘Great Rotation’ may finally be taking shape.”
“The favorable macroeconomic environment, characterized by contained inflation and accelerating growth, allows markets to withstand geopolitical tensions and continue their upward trajectory despite uncertainties,” said Florian Ielpo at Lombard Odier Asset Management. This positive momentum has fueled a rotation in which value stocks outperform growth shares, he noted.
“As long as inflation does not resurface to impose higher capital costs, the outlook should remain favorable, with valuations potentially supported by earnings that could continue to positively surprise against the backdrop of technological progress,” Ielpo said.
“If you look back over the past six quarters, and probably over the past eight, you’ll see this pattern where the market rallies into quarter end, then, as earnings come out, there’s relative disappointment,” said Mark Hackett, chief market strategist at Nationwide, told MarketWatch. He chalked this up to several factors, including a classic “buy the rumor, sell the news” dynamic where investors bid up a stock ahead of an expected news event, then sell after the headlines hit. The S&P 500 has been largely moving sideways recently, but despite the pause in upward momentum, Hackett said the rally still looks very healthy as lagging corners of the market like small caps continue to pick up steam. “What’s most encouraging right now isn’t that the S&P 500 is near record highs — it’s how we’re getting there,” said Mark Hackett at Nationwide.
He noted that leadership is broadening beyond the “Magnificent Seven,” volatility and bond market stress remain muted, and many of the key bear-case arguments around inflation and labor are fading. “That combination creates a much healthier backdrop for this rally, even if markets pause in the short term,” Hackett said. He noted that earnings season has been a sluggish period for equity markets in recent quarters, as markets rallied into the reports and the share repurchase blackout limits support, potentially driving a short-term pause, but the strong macro backdrop, accelerating earnings, and the cascade of tailwinds on the way support the bullish argument.
“We maintain our conviction that the structural trend of AI will continue to power equity performance in the years ahead, and believe exposure to AI-related stocks is essential for long-term wealth preservation and appreciation,” said Ulrike Hoffmann-Burchardi at UBS Global Wealth Management.
But as in other innovation cycles in the past, she expects to see a performance handover from the enablers to the users of AI, and see room for catch-up from companies that leverage AI to improve business outcomes. “Our top picks in this regard remain financials and health care, which are also supported by favorable fundamentals,” added Hoffmann-Burchardi.
“Given longstanding concerns about the market being dominated by a handful of mega-cap tech names, some rotation away from them is arguably a healthy longer-term development, even if it feels disconcerting in the near term,” said Daniel Skelly, head of Morgan Stanley’s wealth management market research and strategy team. “We may finally be seeing the ‘broadening out’ that so many people have looked for.”
“The fundamentals are really healthy. You’re looking for above-average earnings growth, margins, sales revenue, the Fed cutting interest rates likely this year. That’s all positive,” Larry Adam, Raymond James chief investment officer, said on CNBC’s “Power Lunch.” To be sure, Adam said he’s slightly cautious coming into 2026. Risks to the market’s gains include expensive valuations, which leaves the market vulnerable to disappointments, the investment chief said. He added that retail investors also already own a record amount of equity, and that the U.S. is readying for midterm elections that could lead to an uptick in volatility.
“Bull markets don’t die of old age,” said Maria Vassalou, head of Pictet Research Institute. “So the idea that because we had a bull market for three years this year will not be a bull market that is not founded on any solid analysis. I think the current environment is greatly driven by your political and macro developments, which will determine the actual valuations of firms and profitability and so on.”
The message from the markets is that a procyclical global upswing is underway with value and small-cap stocks outperforming year-to-date and equities broadening out, according to Doug Beath at Wells Fargo Investment Institute.
“Despite the strong start to 2026, we would not be surprised if markets experience volatility in the coming weeks as fourth-quarter earnings progress and the threat of escalating geopolitical tensions remains,” he said. Beath also noted he’ll treat pullbacks as opportunities to rebalance funds toward favored sectors that benefit from the ancillary trends related to artificial intelligence with more attractive valuations: financials, utilities, and industrials.
“The AI trade has become focused on the hardware side,” with semiconductor stocks surging this year, Louis Navellier, chief investment officer of Navellier & Associates, said in emailed commentary Friday. “There are growing concerns that the software part of the AI growth will be coming in ‘27 - ‘28 after the data centers are built out.”
The outlook on U.S. inflation is unclear as Federal Reserve officials parse “delayed and incomplete data,” said economists Lindsey Piegza and Lauren Henderson at Stifel, Nicolaus & Co. “For now, neither the CPI nor the PPI report should be enough to move the needle in one direction or the other or dissuade the Fed from its current position on the sidelines.” Still, “a more benign pace of price pressures — if sustained — affords the Fed additional flexibility to provide further accommodation if warranted in the future by a more definitive deterioration in labor market conditions,” the economists wrote.
Trump’s remarks that he would like to keep White House advisor Hassett in his current seat catapult Warsh into pole position in the race to succeed Powell as Fed chair, while adding a little to Christopher Waller’s chances, according to Krishna Guha at Evercore. “It is not certain this is a definitive signal – the President has given various signals at various times and appears to enjoy the drama of this Celebrity Apprentice season – but it does look as if the former Fed governor is for the first time the clear front-runner,” he noted. What would a Warsh Fed chairmanship mean? “We think near term through end 2026 he would be more or less as dovish as Hassett would be on the basis of supply side optimism, the difference is that he would be more likely to revert to older hawkish traits if the economy turned out to overheat in 2027/2028, Guha concluded.
“If I had to pick between the two Kevin’s, I’d go with Hassett over Warsh,” said Neil Dutta at Renaissance Macro Research. “So crushing Hassett only helps Warsh. We know that Kevin Warsh has been hawkish his entire career. He hates inflation even when it is running below the Fed’s target. It would be an interesting choice given the President’s policy views.”
“Whether it’s Hassett or someone else, I think the assumption that we — at least most of us — have is that whoever it’s going to be, this person is going to certainly have a political motive and not the more traditional, trying-to-be-fully-objective mindset in regards to leading the Fed,” said David Krakauer, vice president of portfolio management at Mercer Advisors. “That threat to the independence of the Fed is certainly, you know, a concern for us and everyone.”
“For the sake of central banking independence, we’re encouraged to see that Hassett is no longer the front-runner, and in his place, Warsh is favored to get the nod,” said Ian Lyngen at BMO Capital Markets. “Our take is that Warsh would be a market-neutral choice – triggering no significant price action aside from perhaps further bearishness in the front-end of the curve as his experience and reputation imply an ability to build consensus on the FOMC.”
“Moreover, he isn’t Hassett – who is widely viewed as having the greatest loyalty to President Trump and would therefore be most likely to push for lower rates even if the data indicated otherwise,” Lyngen added. “We maintain that the evolution of the real economy will ultimately dictate the extent to which the Committee will be able to resume the path toward neutral despite the White House’s often stated preference for lower rates. In the event that there are headwinds to a March cut as well, we’ll look for an increase in Trump’s criticisms of Powell,” Lyngen said.
Some investors may be getting jittery Friday about the interest rate on the 10-year Treasury note rising toward a level perceived as a potential headwind for “risk assets such as stocks,” said David Wagner, head of equities and portfolio manager at Aptus Capital Advisors, in a phone interview. Wagner said that while he has considered a 4.5% rate on the 10-year Treasury note as starting to become challenging for stocks, he said the new “anecdotal mental threshold” for investors may now be around 4.2%.
“The rise in 10-year yields would be concerning if today wasn’t the Friday before a three-day weekend,” said Steve Sosnick at Interactive Brokers. “The 4.20% yield level has acted as resistance since September. It is difficult to imagine that a significant change in bond-market sentiment will take root on a Friday afternoon ahead of a three-day weekend.”
“The concerns are there, but I don’t see anything dramatic that would shake the market’s resolve,” said Richard Steinberg, chief market strategist at Focus Partners Wealth. “Unless something dramatic happens.” Instead, Steinberg expects investors to focus on earnings season in the week ahead in a “period where the market is broadening out but still fairly focused on tech.”

Link to X posts - Neil Sethi (@neilksethi) / X for full posts/access to charts (all free).
In individual stock action:
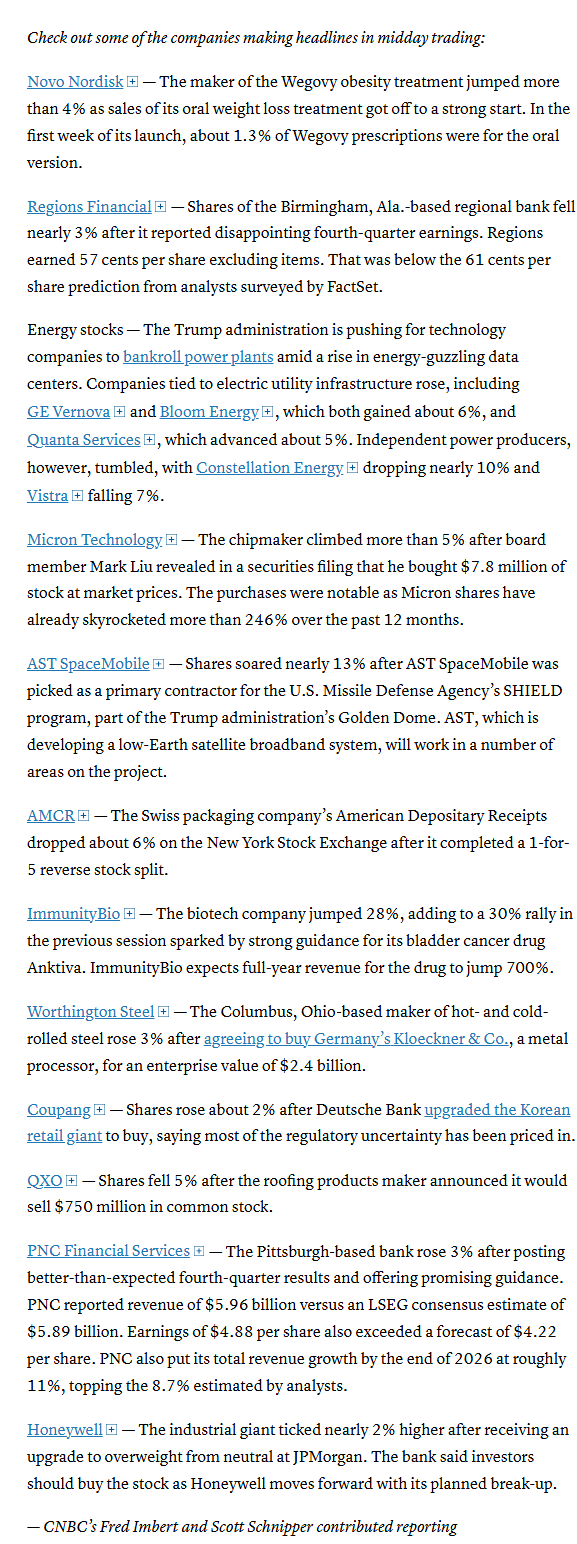
Taiwan Semi and other chip stocks like Broadcom and Advanced Micro Devices were higher Friday after the U.S. and Taiwan reached a trade agreement in which Taiwanese chip and tech companies will invest at least $250 billion in production capacity in America. Micron Technology climbed more than 7% after board member Mark Liu revealed in a securities filing that he bought $7.8 million of stock at market prices. The purchases were notable as Micron shares have already skyrocketed more than 246% over the past 12 months.
PNC Financial Services, the Pittsburgh-based mega-regional bank rose 3% after posting better-than-expected fourth-quarter results and offering promising guidance.

Corporate Highlights from BBG:
OpenAI will start testing advertisements in the ChatGPT app for certain US users, marking a major shift for the company as it seeks to bolster revenue from the popular chatbot.
Paramount Skydance Corp.’s leadership has held talks in recent days with French President Emmanuel Macron amid a European charm offensive to garner support for its $108.4 billion hostile bid for Warner Bros. Discovery Inc.
Movie theaters warned European Union merger watchdogs that a takeover of Warner Bros. Discovery Inc. by either Netflix Inc. or Paramount Skydance Corp. threatens to harm their industry.
Walmart Inc. appointed new heads for its three main divisions, completing a leadership refresh at the world’s largest retailer.
PNC Financial Services Group Inc. reported a 9% increase in fourth-quarter revenue, beating analysts’ estimates as financing and dealmaking by middle-market customers accelerated.
Regions Financial Corp. reported earnings per share and total loans for the fourth quarter that came in below the average analyst estimate. The bank also said it sees net interest income declining in the first quarter of 2026.
State Street Corp. reported higher expenses and an outlook for net interest income that came in below Wall Street’s expectations.
JB Hunt Transport Services Inc. reported quarterly revenue that missed estimates, underscoring continued weakness in freight demand.
DraftKings Inc., Flutter Entertainment Plc and other stocks linked to the sports gambling industry sank after new data suggested that they may be losing ground to competing products from prediction market startups.
DoorDash Inc. Chief Revenue Officer Lee Brown is departing the delivery app company after less than six months to pursue a new opportunity.
Fannie Mae and Freddie Mac extended days-long losing streaks amid mounting unease about the impact of President Donald Trump’s policy moves on efforts to release the mortgage-finance giants from government control.
Honeywell International Inc. rose after JPMorgan Chase & Co. raised the recommendation on the industrial company to overweight from neutral, writing it has “extended its discount” to a sum-of-the-parts valuation.
Kraft Heinz Co. fell after Morgan Stanley downgraded the shares to underweight from equal-weight.
Mosaic Co. slumped as the fertilizer company said North American demand “declined well beyond normal seasonal softness” in the fourth quarter due to a weak farmer economy and weather.
The Federal Aviation Administration is urging US airlines to “exercise caution” when flying over Mexico, and parts of Central and South America, citing “military activities” and potential interference to navigation systems in the region.
A federal judge said Dominion Energy Inc. can restart construction of a wind project off the coast of Virginia while it continues a legal fight over the Trump administration’s order to stop the $11 billion development.
The US Supreme Court agreed to hear Bayer AG’s appeal taking aim at thousands of lawsuits targeting its top-selling Roundup weedkiller for causing cancer.
Porsche AG’s deliveries fell 10% last year, the steepest drop since 2009 when the global financial crisis roiled markets, following weak demand for electric vehicles and a slump in China.
Glencore Plc has agreed to buy at least 500,000 tons a year of hot briquetted iron from a planned Oman-based plant, securing supply of the low-carbon steelmaking input from 2030.
Mitsubishi Corp. agreed to buy Aethon Energy Management LLC’s US gas and pipeline assets for $5.2 billion, the biggest purchase by a Japanese company in the American shale sector.
Reliance Industries Ltd. reported a lower-than-expected quarterly profit as sluggish growth in the petrochemical and retail businesses offset a strong showing in its refining and telecom units.
Mid-day movers from CNBC:
In US economic data:
Link to posts for more details/access to charts (all free) - Neil Sethi (@neilksethi) / X
The SPX remains just below its ATH. The daily MACD and RSI are both neutral with a negative divergence but at least had made new local highs.
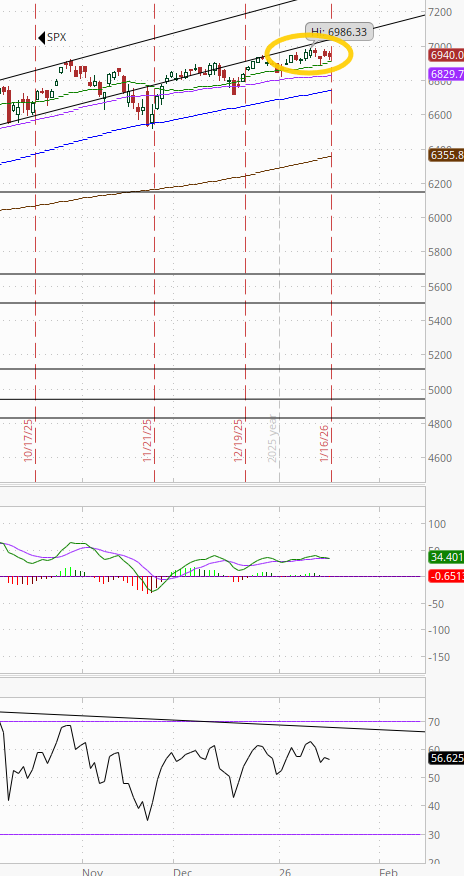
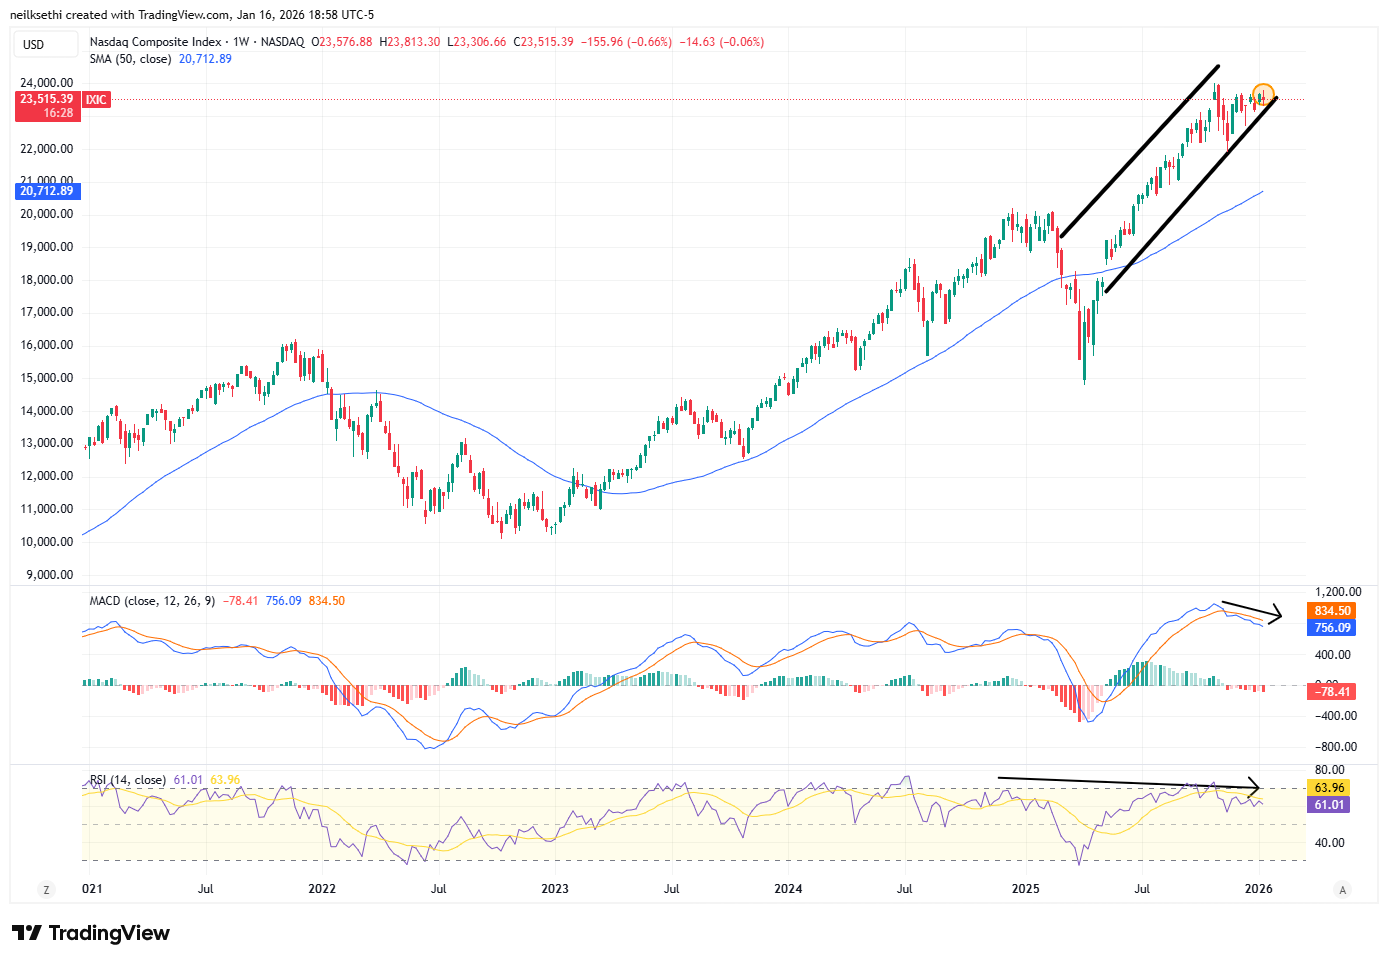
The Nasdaq Composite a similar story although hasn’t made an ATH since Oct.

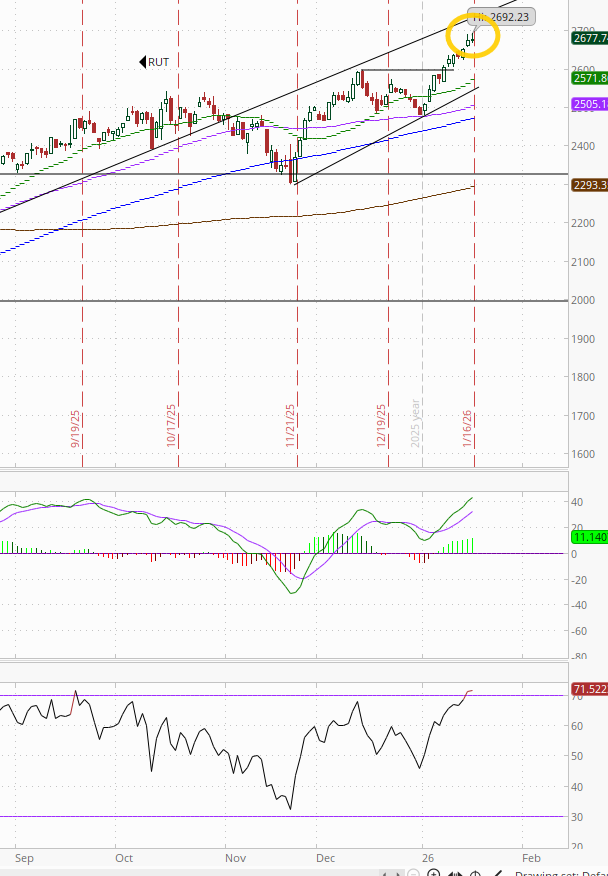
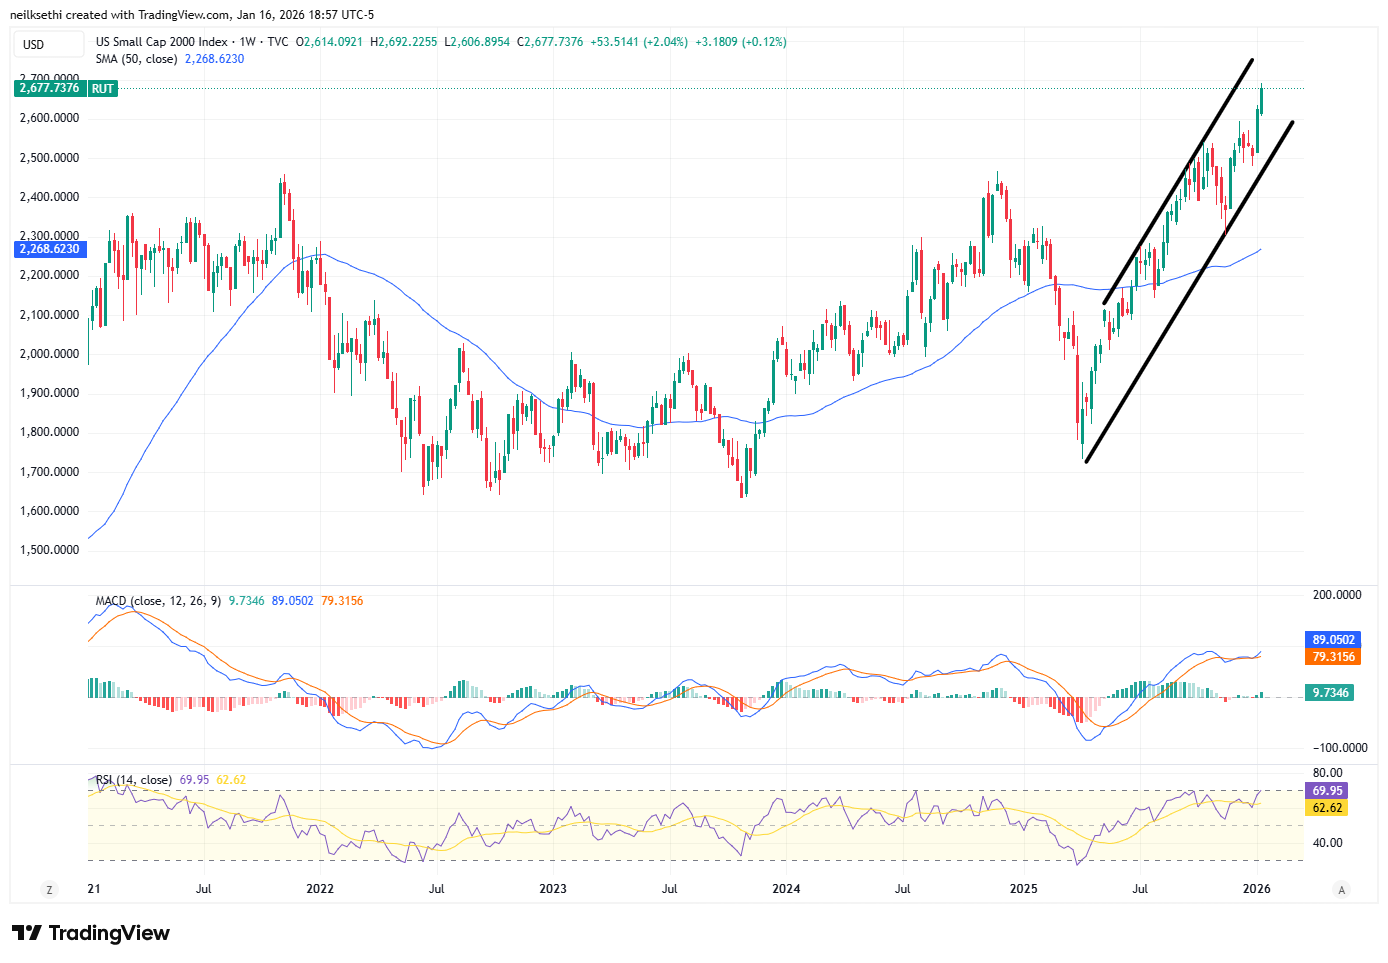
RUT (Russell 2000) remains the best chart of the bunch continuing on its rebound from its 50-DMA hit two weeks ago with another ATH. Its MACD as noted last week did cross to a “go long signal” and the RSI is now dipping a toe in overbought territory.
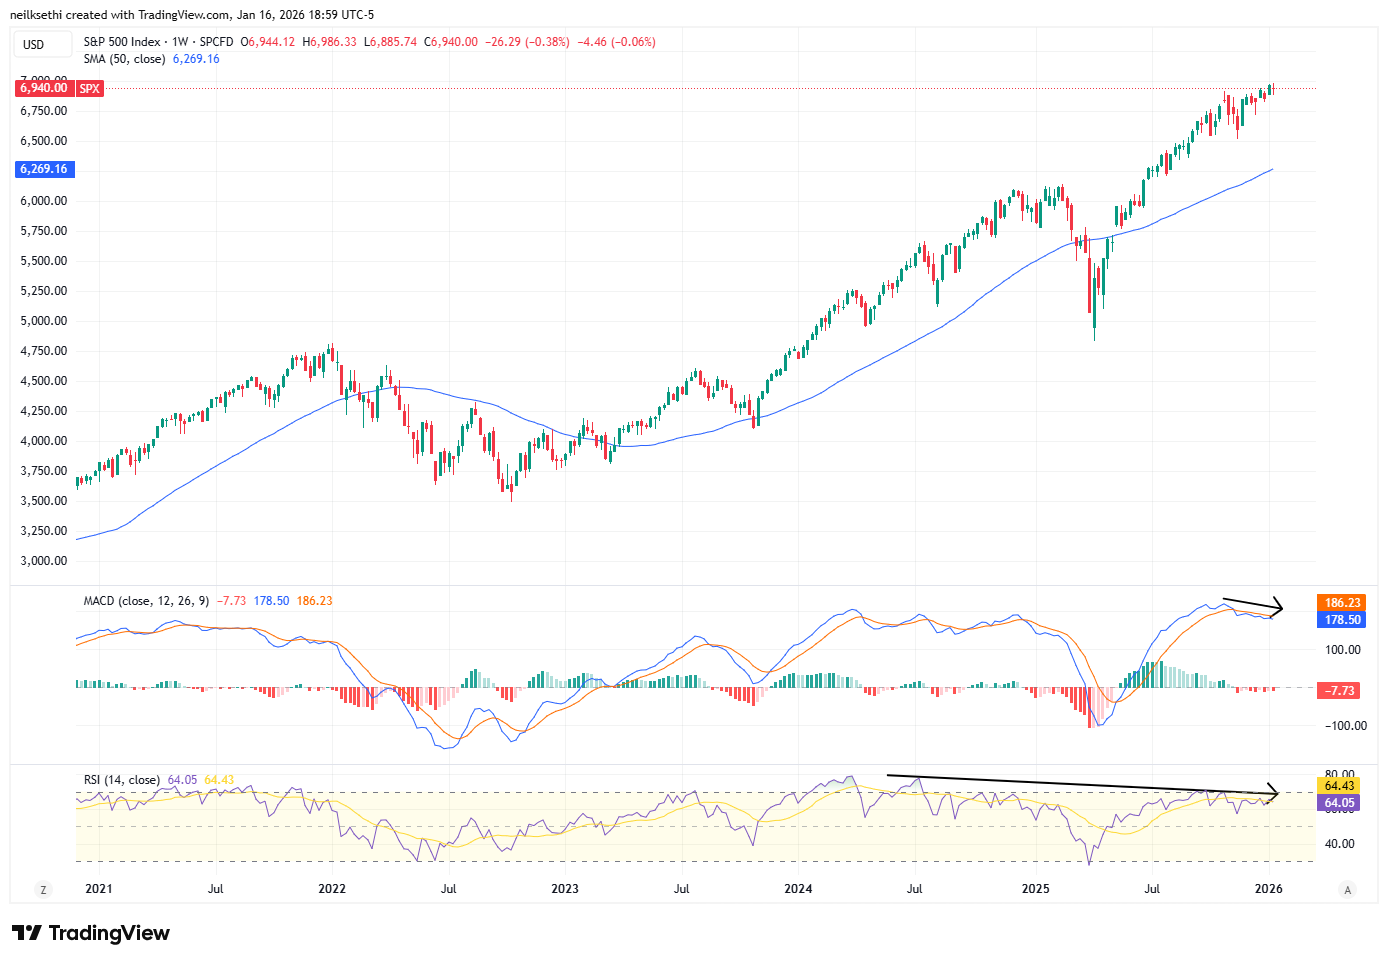
Weekly charts similar to daily with the RUT the clear while the SPX and Nasdaq are good looking charts but have negative divergences with their MACD and RUT.
Sector breadth according to CME Cash Indices (uses futures prices) remained relatively healthy (as it’s been all year ex-Jan 7th).
But we fell back to 6 of 11 sectors higher (there have been less than 7 sectors or more in the green only twice before this year -the 7th & 14th when there were 3 and 6), and again just one up over +0.7% (vs five Wed, three Mon/Tues, seven a week ago) and again that one was up at least +1% (vs three Wed, two Tues, one Mon, five a week ago).
The top four continued to be dominated by “the other 493” with a megacap growth sector only appearing twice this week in the top 4 (Mon & Thurs, both times Tech at #4). Today it was RE’s turn to lead followed by Industrials (those were 3 and 2 Thurs).
Three sectors down more than -0.5% (up from two Thurs, matching Wed, but none a week ago) with again though none down more than -1% (after two Wed, one Tues). Leading to the downside was Health Care -0.8%.

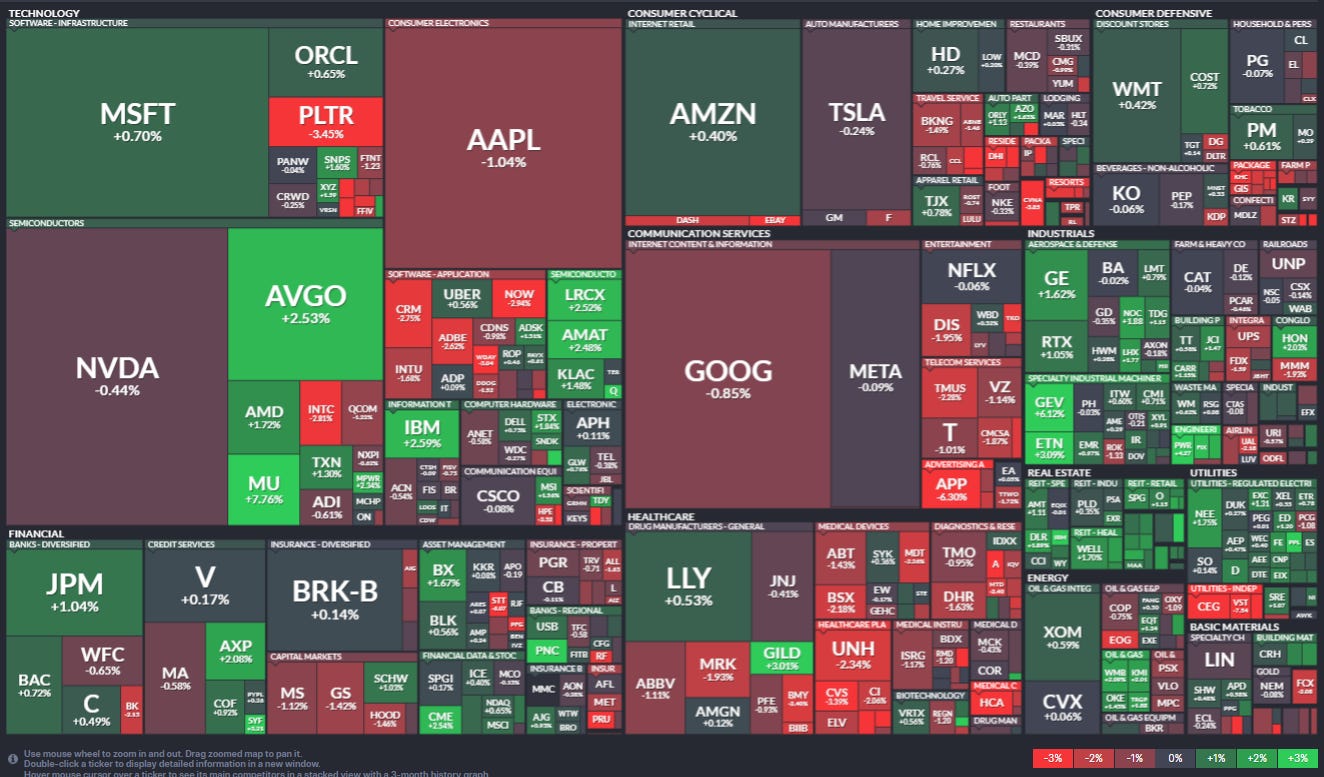
SPX stock-by-stock flag from @finviz_com for Fri a lot like Thurs’ the big difference was a spreading of the red more fully throughout Health Care and Cons Discr while some of the bright green in other sectors dulled.
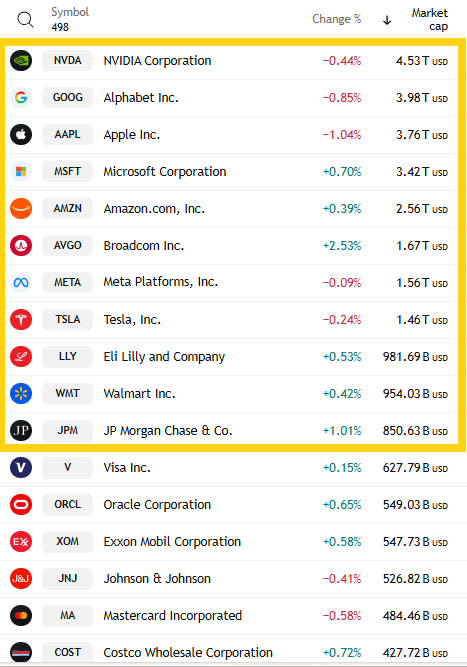
6 of the largest 11 SPX components were higher (from 5 Thurs, none Wed). Just JPM though was +1%. Similarly, AAPL at -1% led decliners.
Mag-7 -0.2%, ending the week down -2.1% and at the lowest levels since Nov 24th.
13 SPX components were up 3% or more (after 40 Thurs, 25 Wed, 17 Tues, 15 Mon, 45 a week ago). Super Micro SMCI led +10.9%. Four of those 13 up 3% or more were >$100bn in market cap (after 3 of 11 Tues, 4 of 25 Wed) in MU, GEV, ETN, GILD (in descending order of percentage gains).
~30 SPX components down -3% or more (the most in over a week up from 12 Thurs, 20 Wed, 25 Tues) led by Constellation Energy CEG -9.8%. Just three of the 30 down -3% or more were >$100bn in market cap (after 3 of 12 Thurs) in APP, PLTR, HCA (in order of percentage losses).
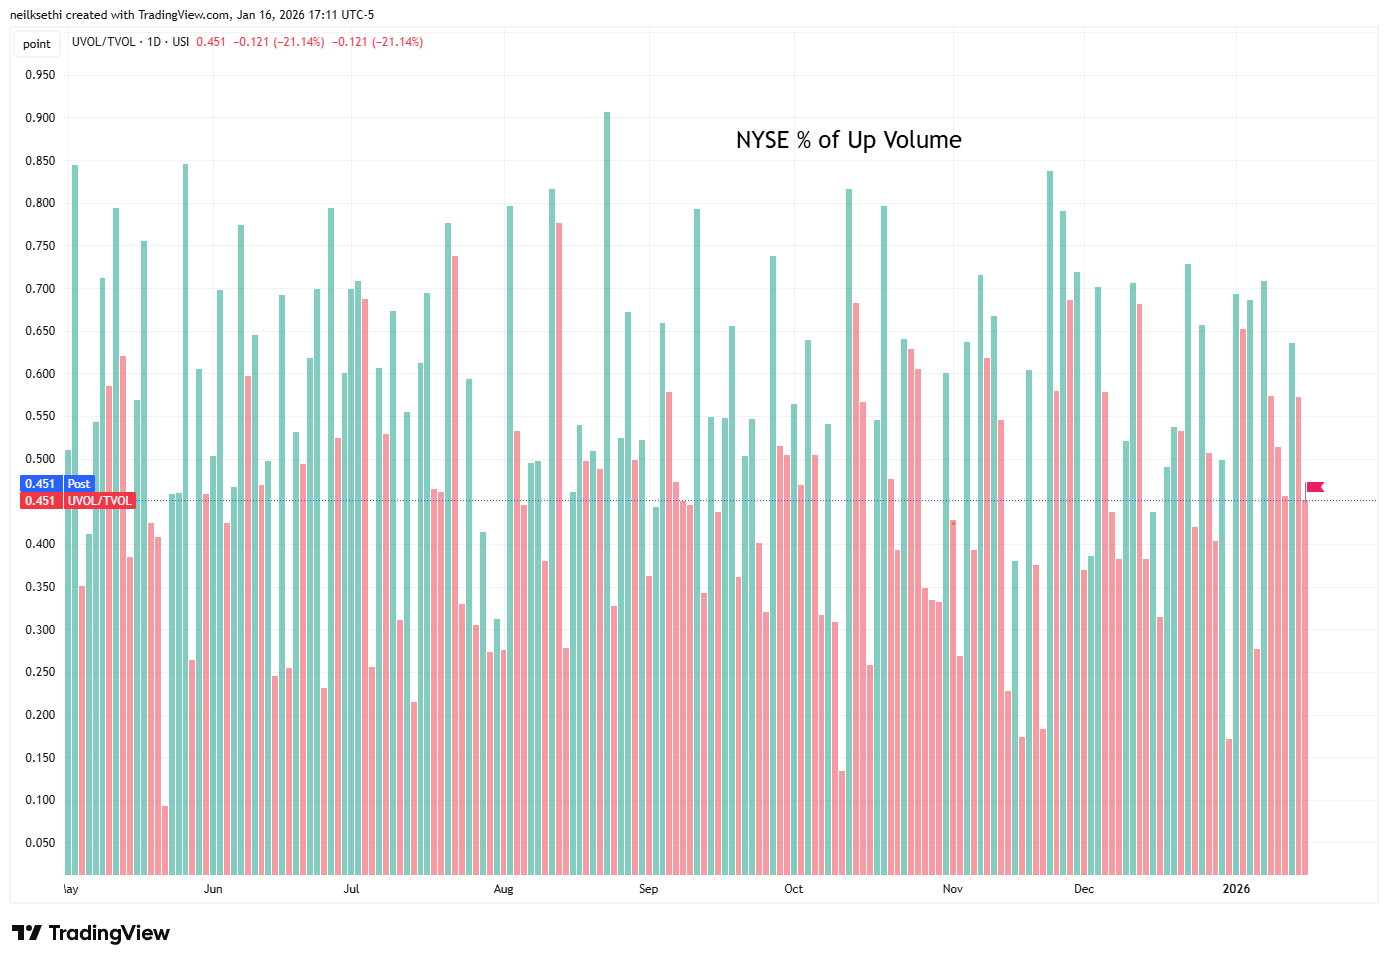
NYSE positive volume (percent of total volume that was in advancing stocks (these also use futures)) again a little disappointing falling back to 45.1% with the index just a touch below flat at -0.01%. That’s slightly below the 45.7% Tues when the loss was a bigger -0.18%.
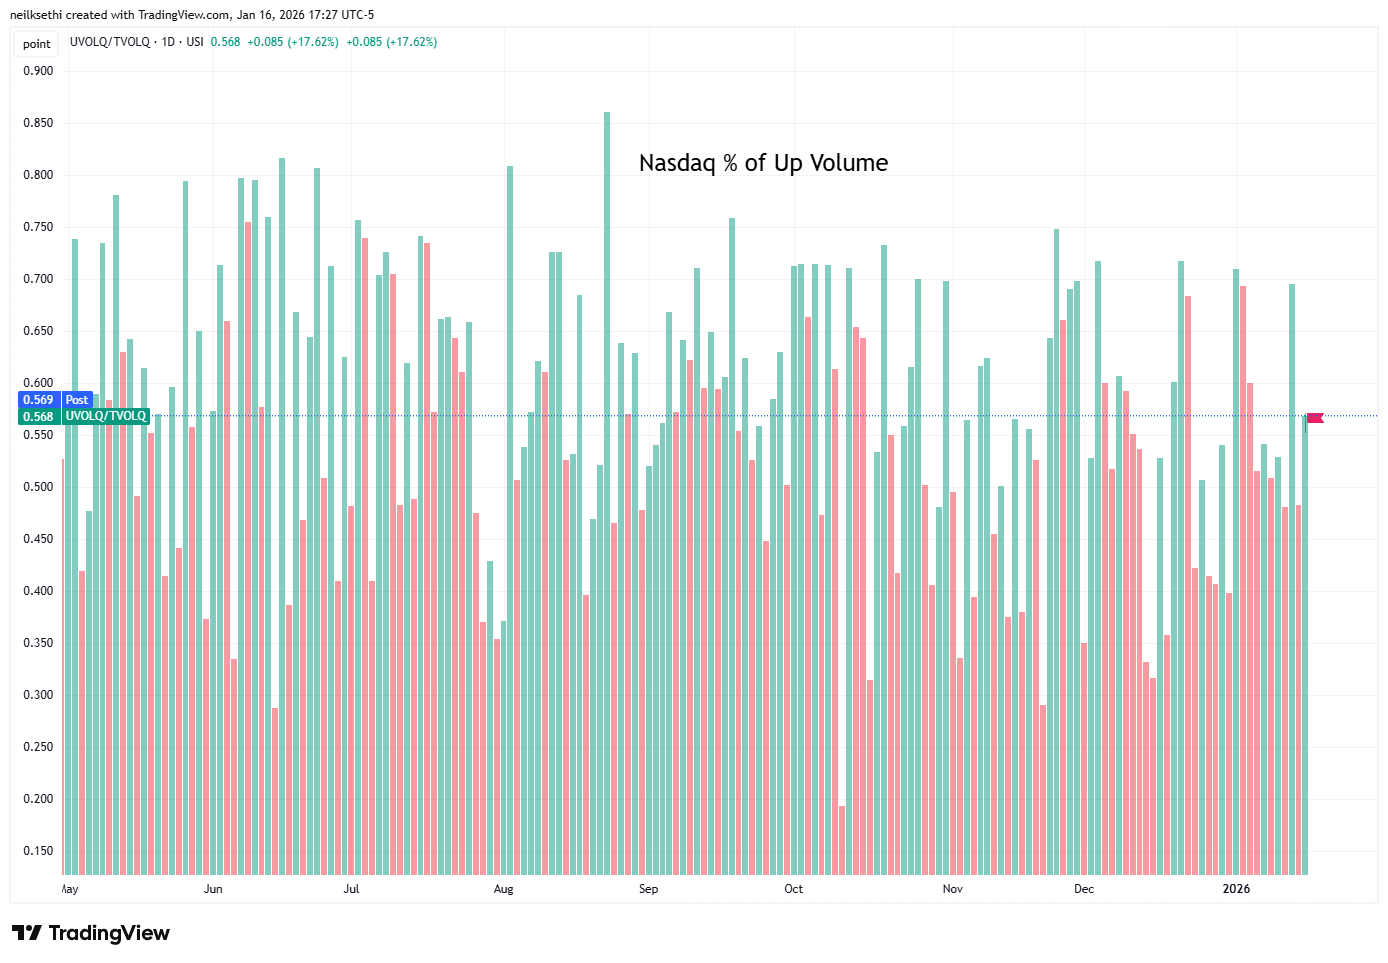
Nasdaq positive volume (% of total volume that was in advancing stocks) though improved to 56.8% from 47.3% Thurs even as the index deteriorated to -0.06% from +0.25%so a much better relative read. ,
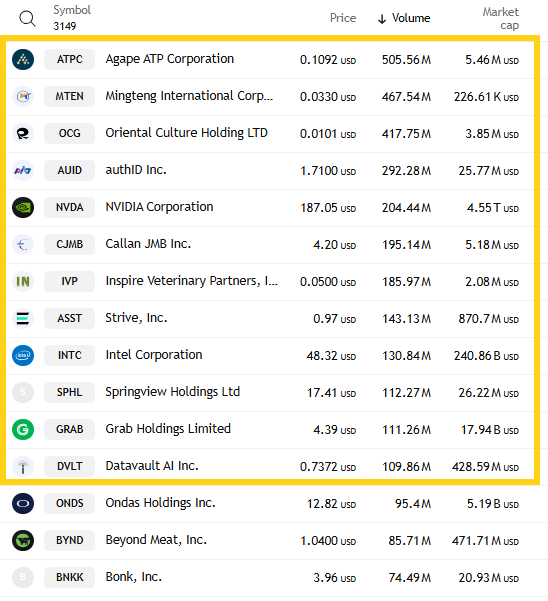
And that better relative positive volume on the Nasdaq was even as speculative volume fell back a second day from one of the highest days since the summer on Wed. The top three stocks by volume (which in a rarity included a non-penny/meme stock in Walmart (due to it moving into the NDX)) fell back to a little under 1bn shares from 1.4bn Thurs and the huge 4bn Wed.
But there were still another ten that traded over 100mn shares (up from nine Thur, seven Wed) so speculative activity remained elevated if off the extreme levels of Wed.
Positive issues (percent of stocks trading higher for the day), which are not inflated by high speculative volumes, did reflect it today with the Nasdaq lower than positive volume at 41%, while the NYSE was 42%.
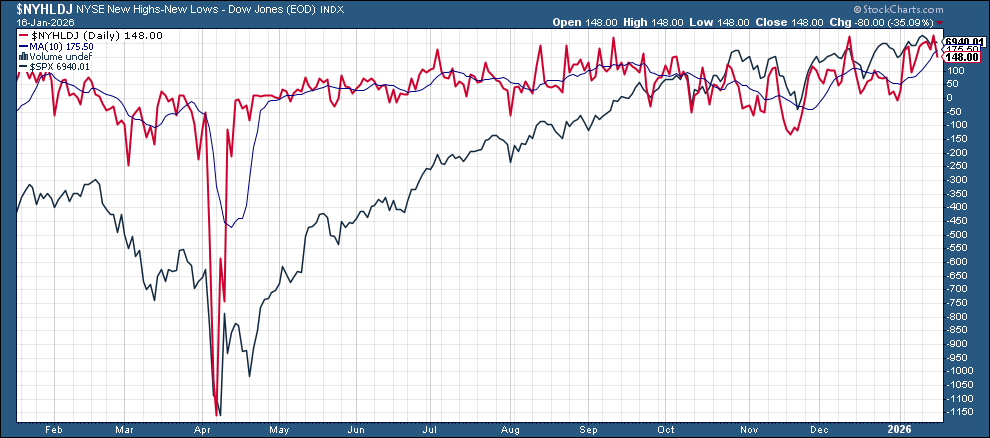
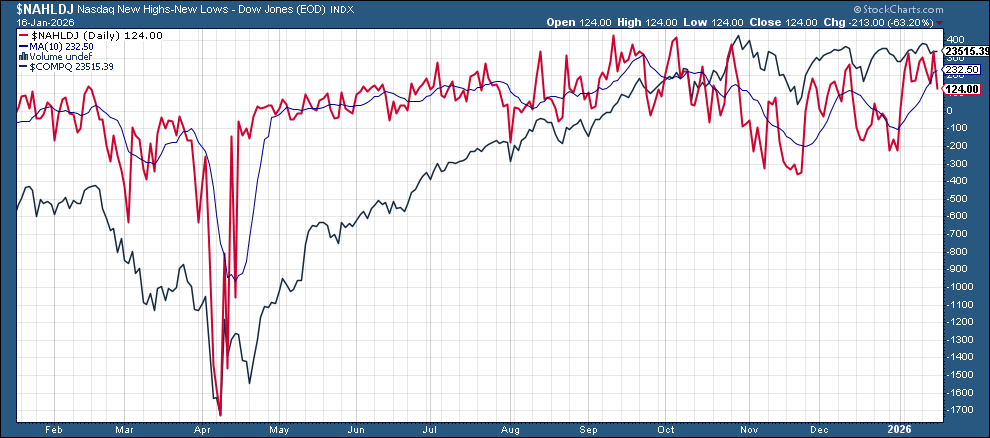
New 52-wk highs minus new 52-wk lows (red lines) fell back to 148 from 227 on the NYSE, which was the best since Nov ‘24, while the Nasdaq fell to 122 from 335, the best since Oct.
After #FOMC rate cut pricing fell Thurs to the least since pricing for the contract was initiated (or at least as far back as the CME Fedwatch tool has been tracking it), it fell a little more Fri with mixed Fedspeak (a dovish speech from Gov Bowman set against a less dovish one from VC Jefferson (which I’ll cover this weekend).
January didn’t move, but off the table unless the Fed chooses to revive it (unlikely) at 5%. March is just 22% (from 51% Jan 6th), April 35% (from 63%), with the first cut in June (63%). A second cut is now not until Oct (and barely at 51%, it was 55% chance of July Jan 6th).
Pricing for 2026 dropped to 45bps (as noted Thurs under two cuts for the first time), with pricing for two cuts 58% and three cuts 26% (down from 68bps Dec 3rd (and 80bps mid-Nov which was highest we’d been for 2026 cuts)).
The dot plot as a reminder has 33bps for the average dot for 2026.
Remember that these are the construct of probabilities. While some are bets on exactly one, two, etc., cuts some of it is bets on a lot of cuts (3+) or none (and may include a hike at some point).


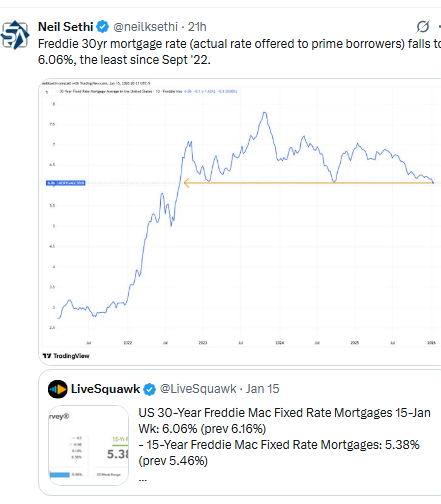
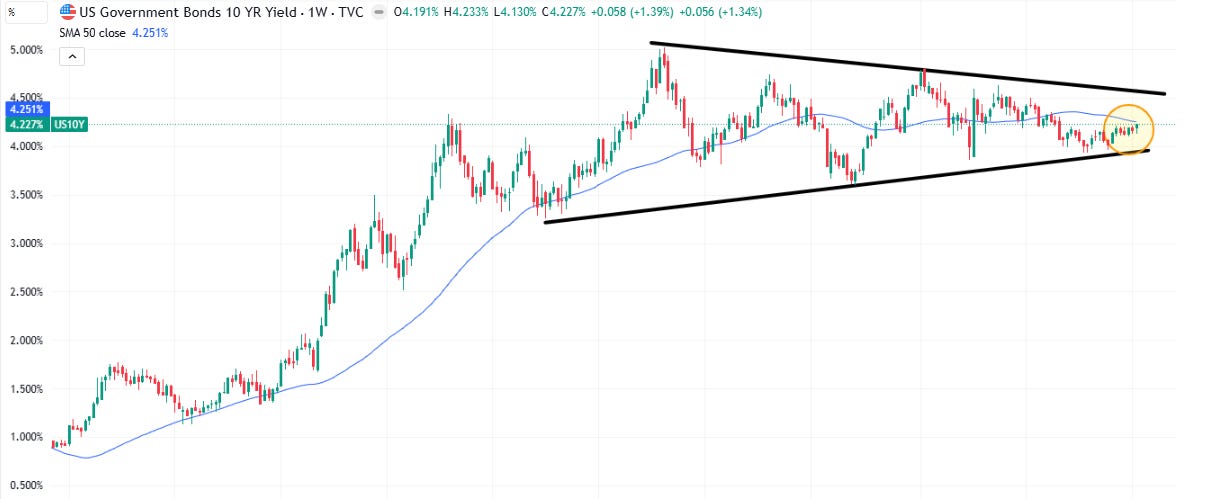
The 10yr #UST yield finally pushed out of its range since the start of December up +7bps to 4.23%, now up against the 200-DMA. A break through that likely targets that major downtrend line at 4.3%.
The reasoning for the move is a little odd, though, as Hassett was seen as the least independent of the Fed Chair candidates, and Warsh has been quite hawkish throughout most of his career (including as a Gov at the Fed) before he turned more dovish when he became a candidate for the top job.

Weekly chart shows the importance of that upper trendline.
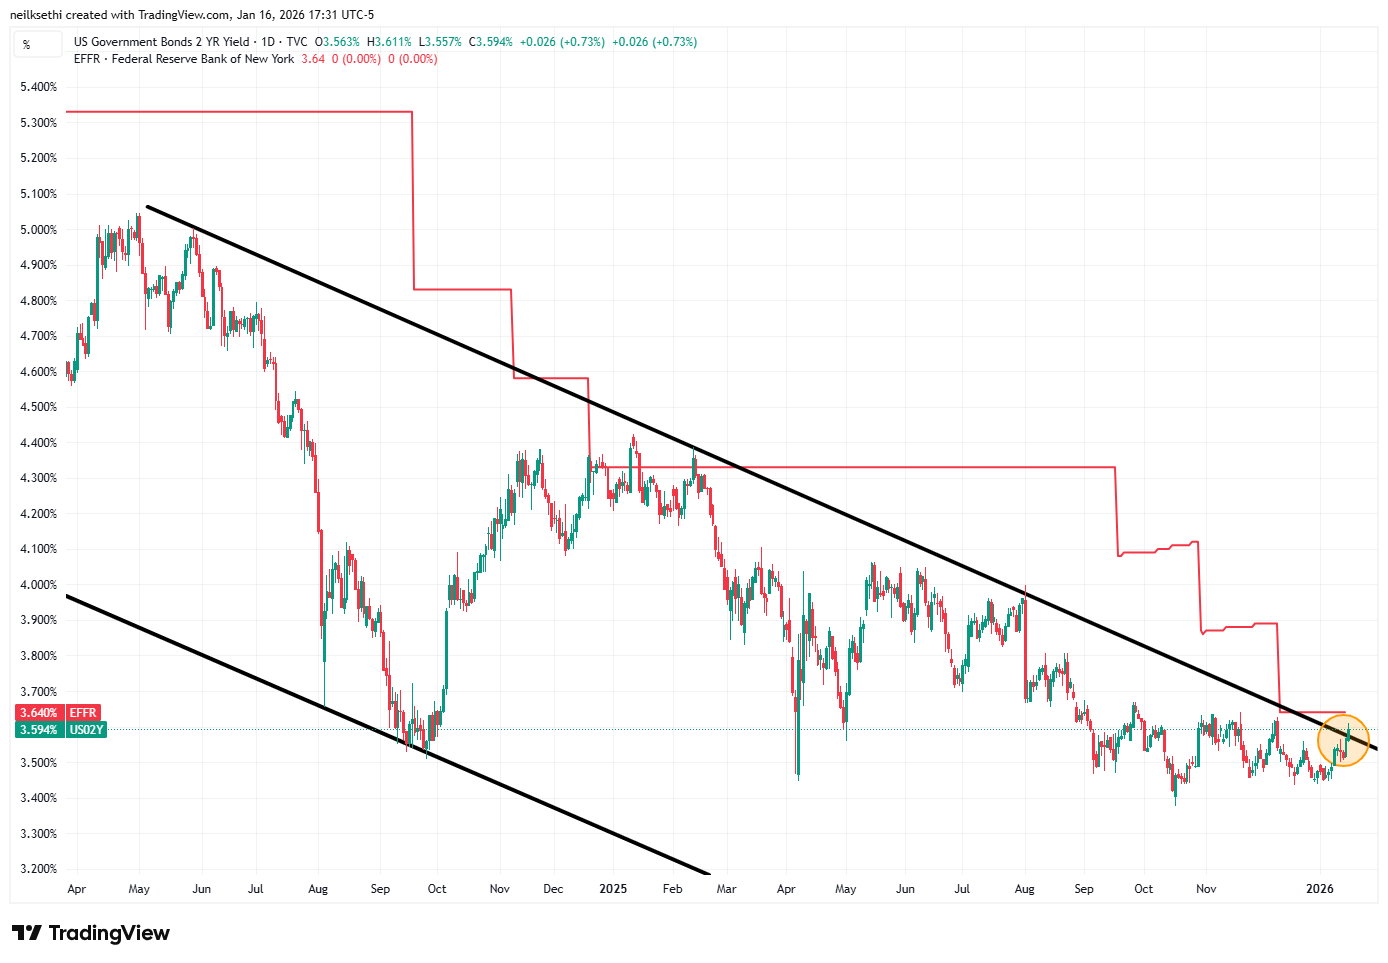
The 2yr yield, more sensitive to FOMC rate cut pricing, also moved higher, in its case +3bps to 3.59%, the highs of the year and now over the top of the channel it’s been in since the start of 2024, which it has not closed over since then. It is -5bps below the Fed Funds midpoint. Outside of recessions it is normally above by around +50bps on average, so still calling for at least a couple more rate cuts, but that call is getting weaker by the day.
The Effective Fed Funds Rate (red line) remained at 3.64%.
This seems like a fairly rich yield at these levels unless we really aren’t going to get any more rate cuts (then it’s a bit expensive (i.e., yield should be higher)). That said I just don’t know that I want to buy 2-years at what is basically the 1-month yield.
The $DXY dollar index (which as a reminder is very euro heavy (57%) and not trade weighted) after pausing for a few days, continued its move higher, little changed remaining above the 50 and 200-DMAs at the highest close since Nov.
It has not sustained a breakout above the 200-DMA since it fell under last February beyond three days (we’re at two now). The daily MACD is just about into “go long” positioning and the RSI is the best since Nov (and over 60) giving some technical support to a breakout.
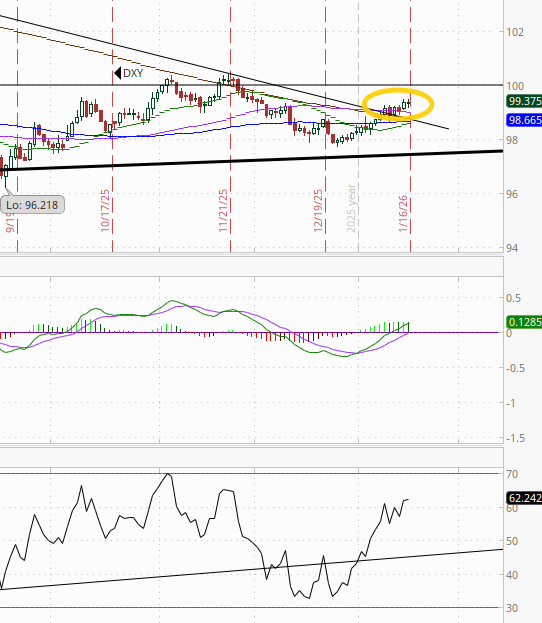
Weekly chart has also flipped more bullish. MACD remains in “cover shorts” RSI now over 50, breaking over trendline resistance, but still below the 50-week moving avg (blue line).

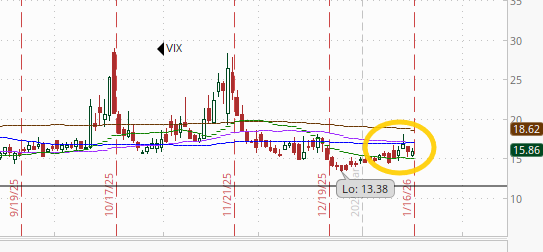
VIX little changed at 15.9. The current level is consistent w/~0.99% average daily moves in the SPX over the next 30 days.
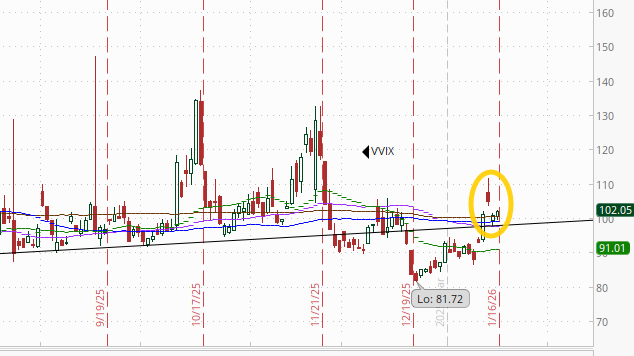
The VVIX (VIX of the VIX) edged a touch higher to 102.1.
The current level is now consistent with “moderately elevated” daily moves in the VIX over the next 30 days (historically normal is 80-100, but we’ve been above 90 almost the entire time since July ‘24)). 100 is also a level flagged by Charlie McElligott as one to watch.
With the holiday weekend and a more volatile White House of late, the 1-Day VIX pushed to the highest since pre-NFP at 12.3. The current reading implies a ~0.77% move in the SPX next session.

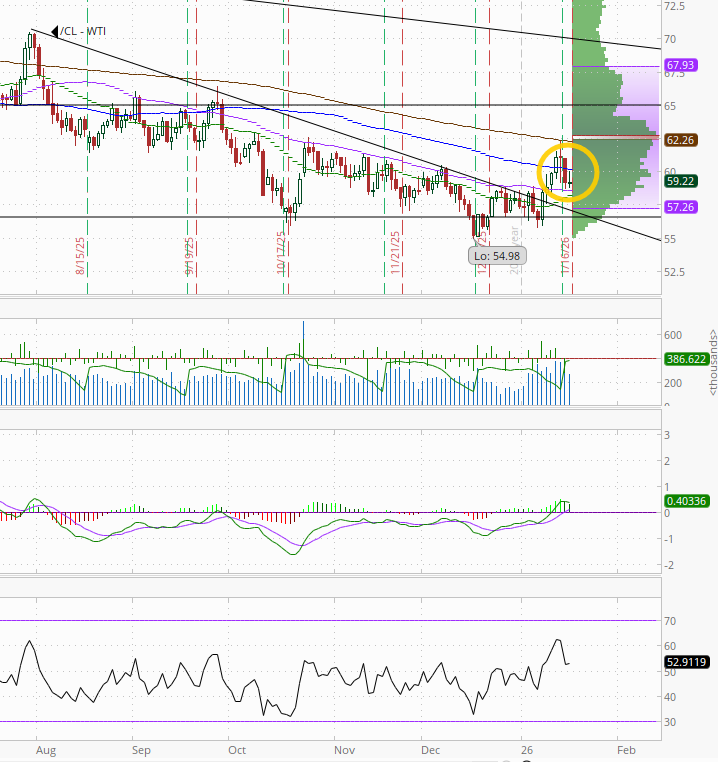
After dropping back Thurs following the de-escalation with Iran, WTI futures started higher on some more hawkish language out of the White House but gave that back by the end of the session to finish little changed just above support at the 50-DMA. We’ll see if that can continue to hold.
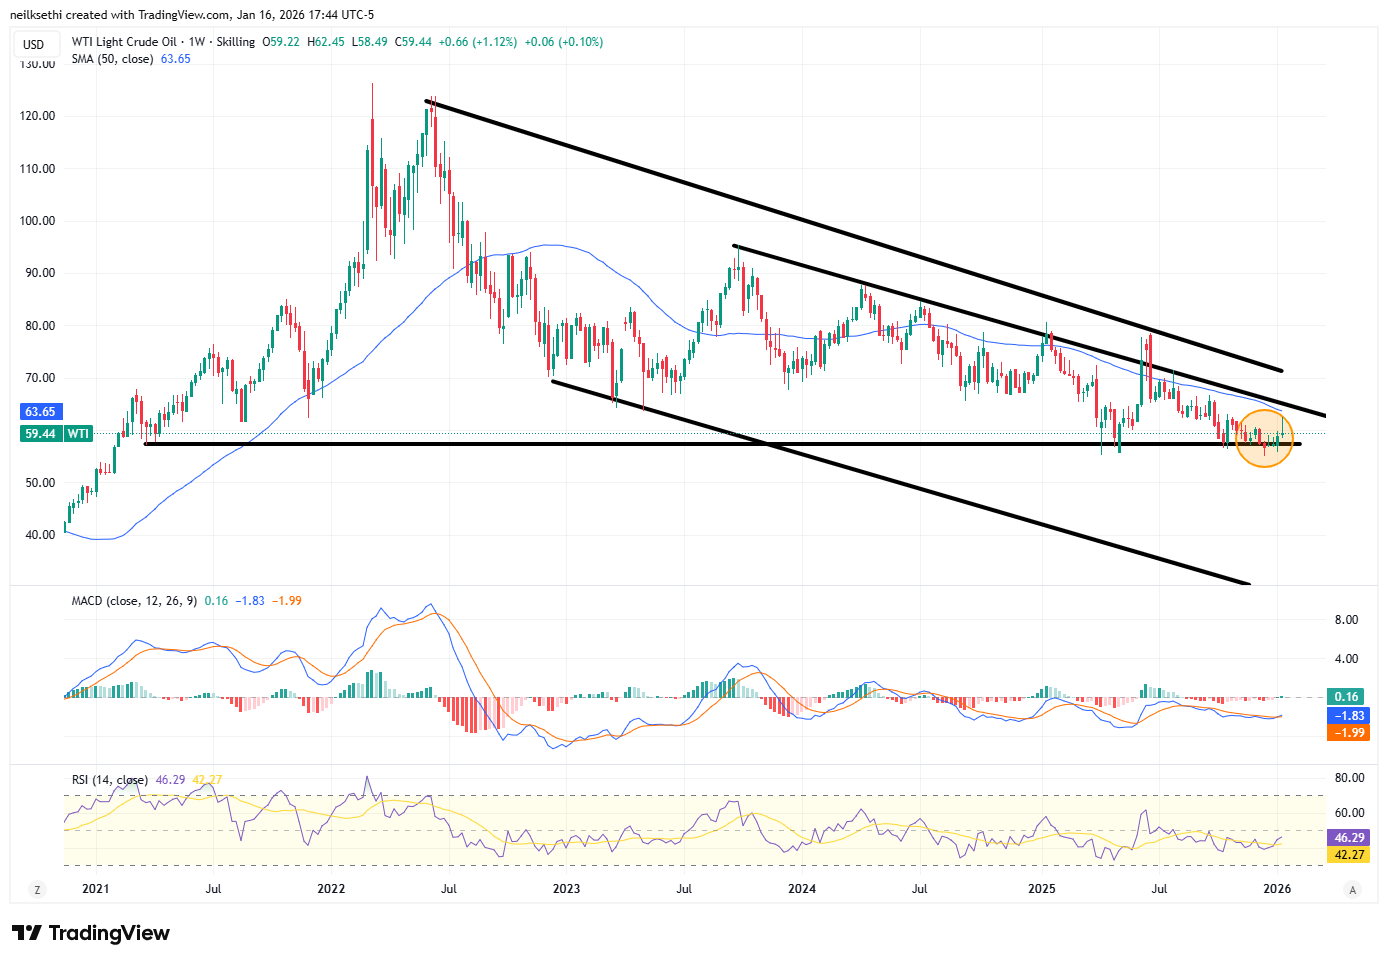
Weekly chart doesn’t give a lot to get excited about.
Gold futures (/GC) continued their pattern of a little breather after a move higher trading sideways for a fourth day just off their all-time high. Daily MACD remains in “go long” positioning, while the RSI is over 60.
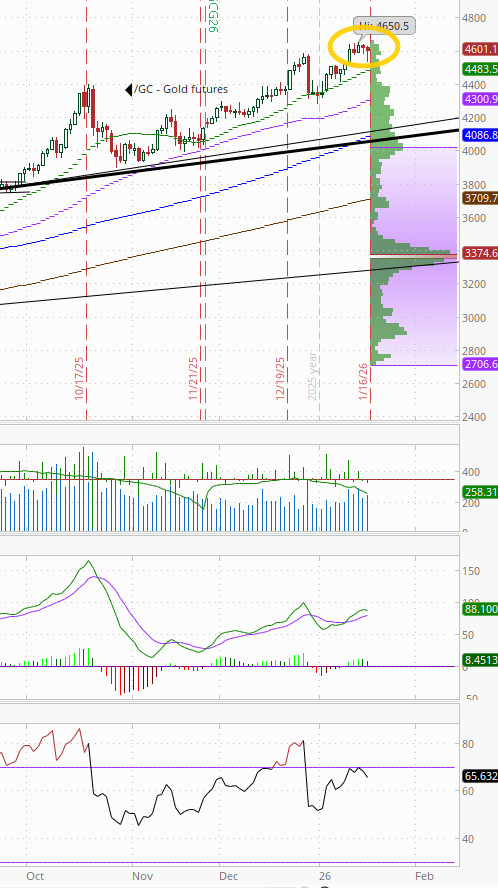
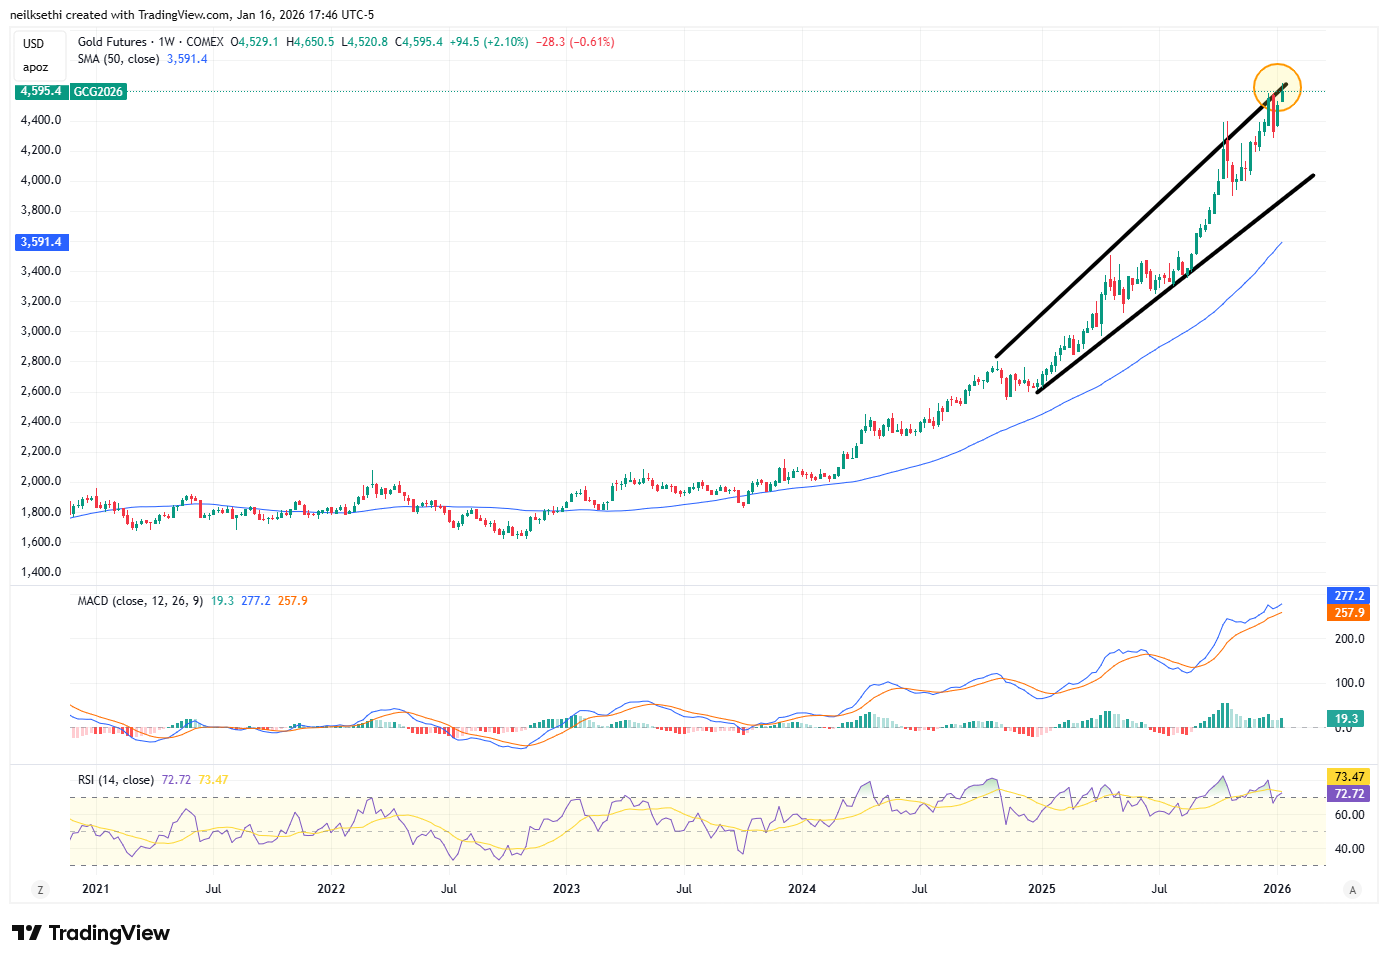
Weekly chart remains quite extended.
US copper futures (/HG) also continuing their more stairstep pattern falling back further from all-time highs. But the daily MACD has crossed to “sell longs” positioning while the RSI has fallen to the least since Nov, so we’ll see if a deeper pullback is in the cards.
Longer term, copper futures remain in the grinding uptrend since August (and longer than that in the uptrend started in March 2020).
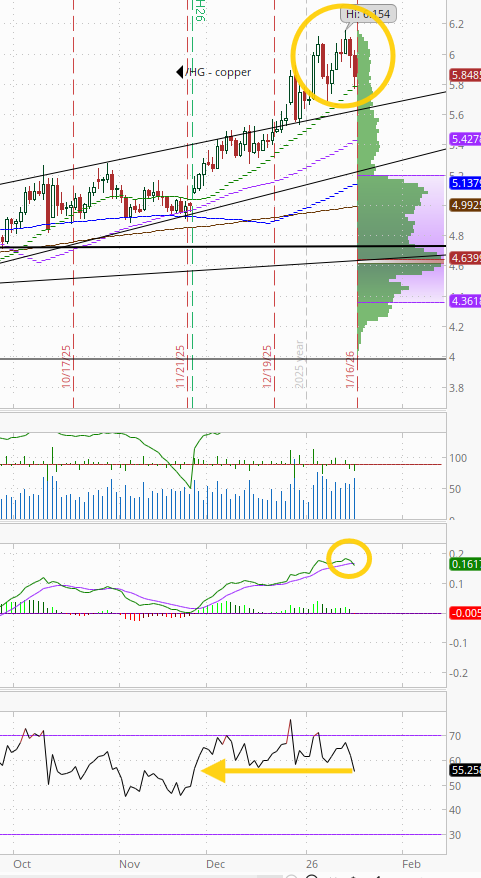
Weekly chart has better technicals but remains capped by the top of the channel.

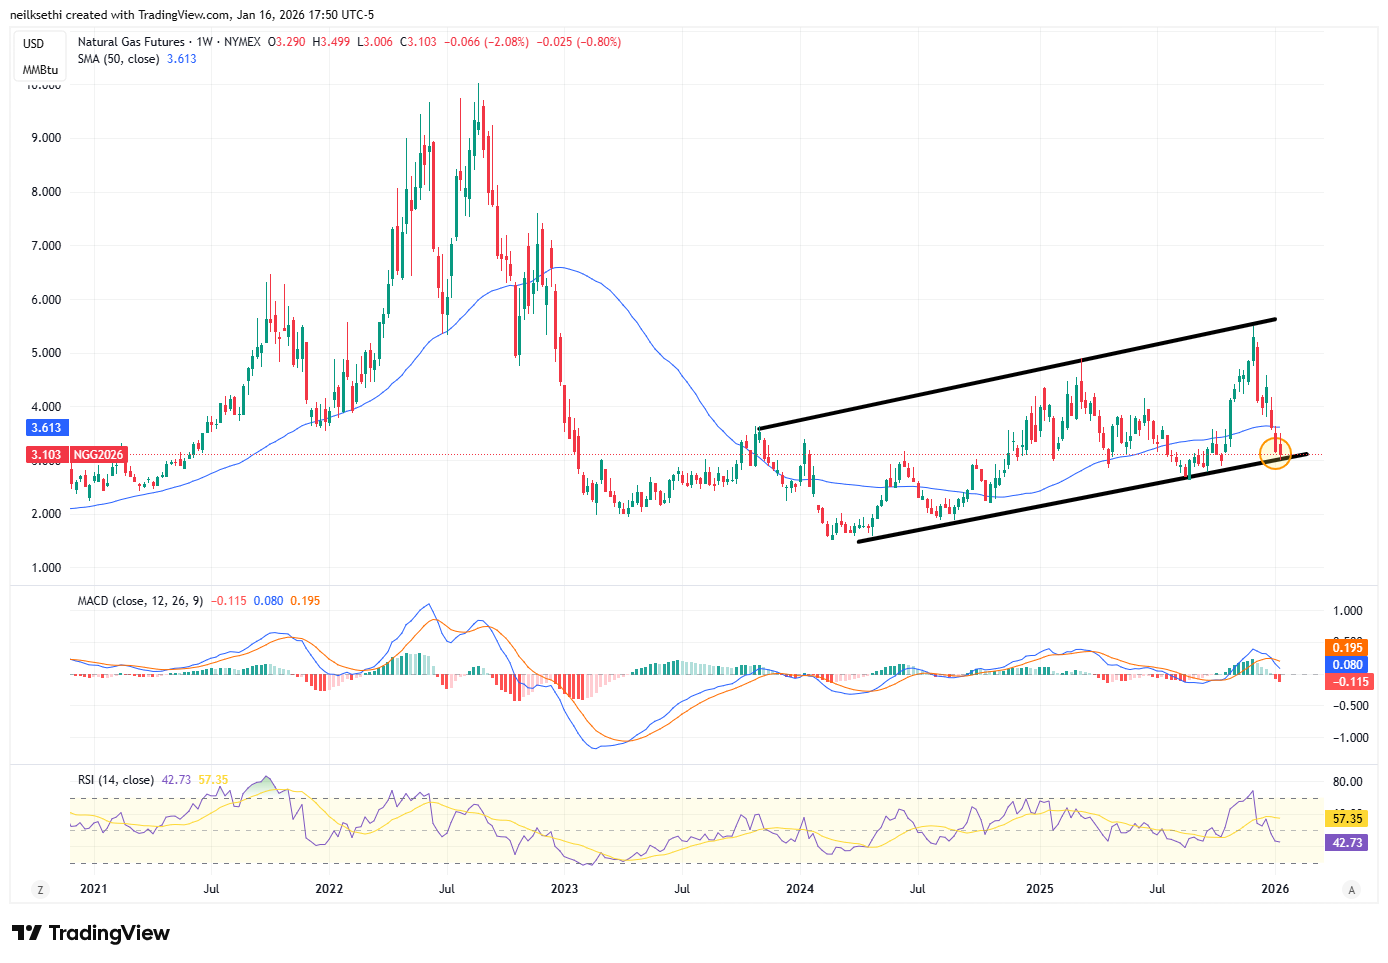
Natgas futures (/NG) again tested the $3 level which again held consistent with my note Wed that “I do expect this area will offer better support.”
The daily MACD remains firmly in ‘go short’ positioning though, and RSI is still around the weakest since April.
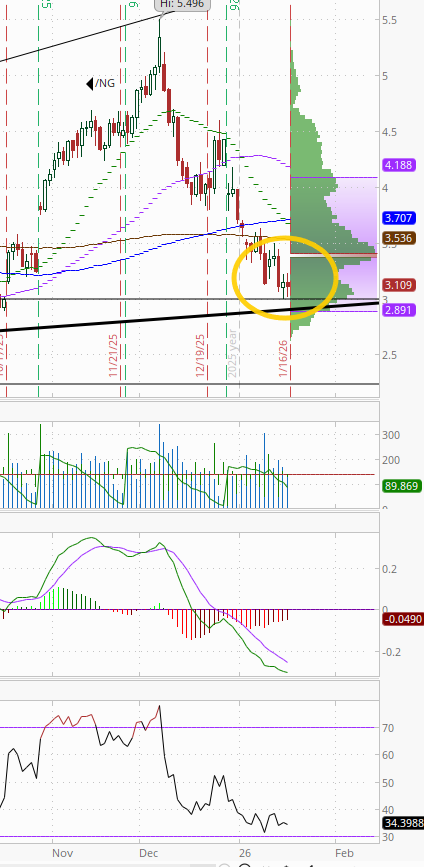
Weekly chart a similar story.
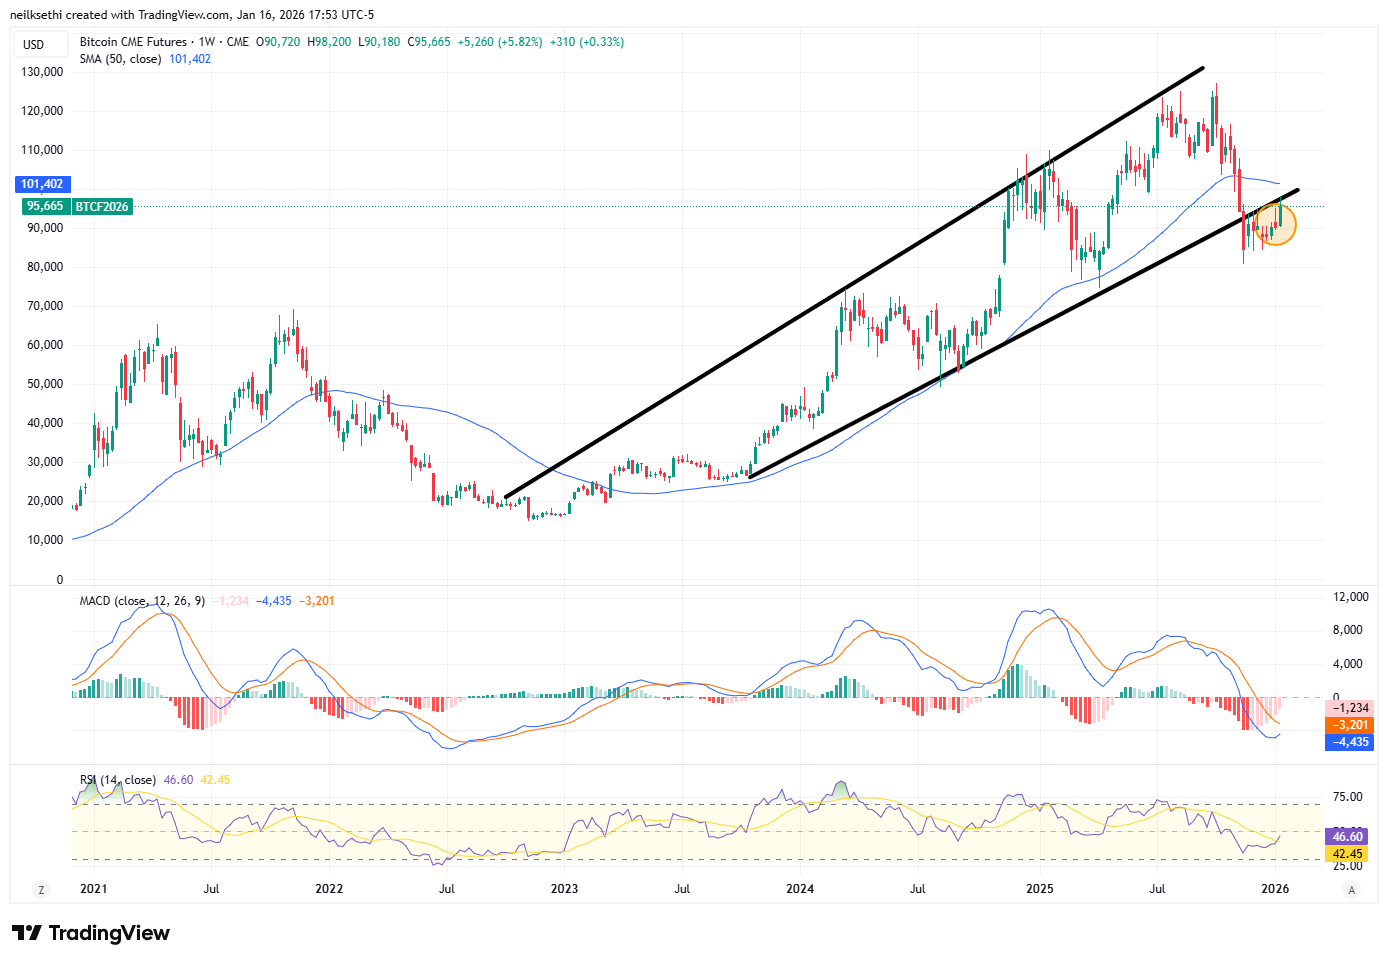
Bitcoin futures continue to disappoint not able to extend to the $100k level again.
The daily MACD still remains in “cover shorts” positioning (positive), while the RSI is over 50 so I continue to expect them to at least test that $100k level.
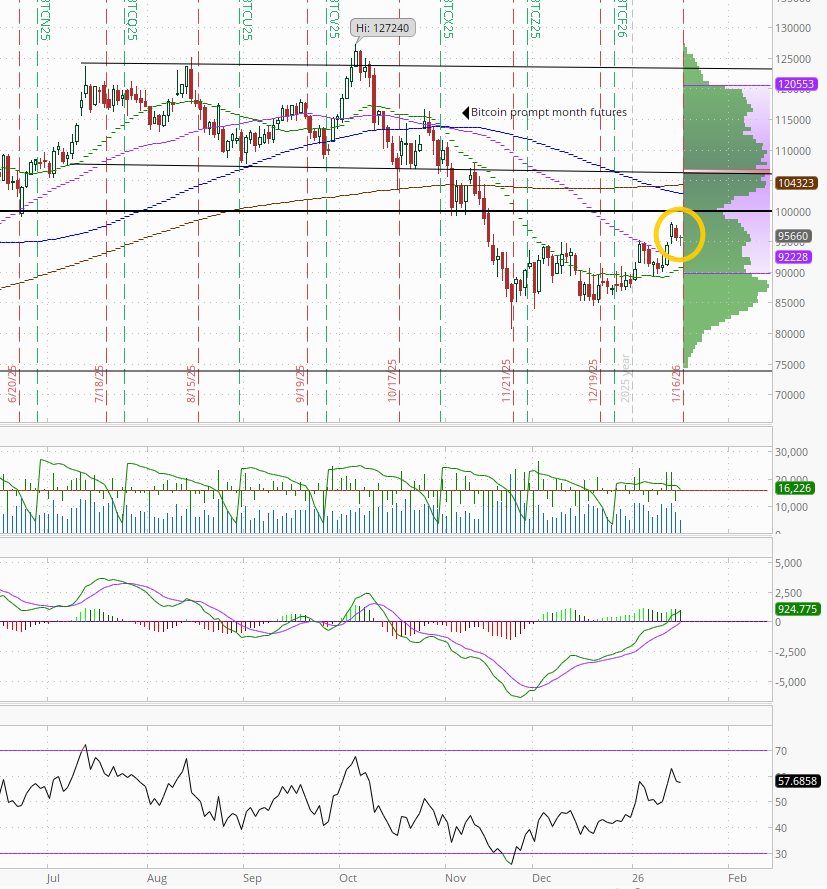
While I don’t normally find the opposite sides of old trendlines to be that useful, in the case of bitcoin it has held back its advance since it fell under in Nov. Not much technical support just yet.
The Week Ahead
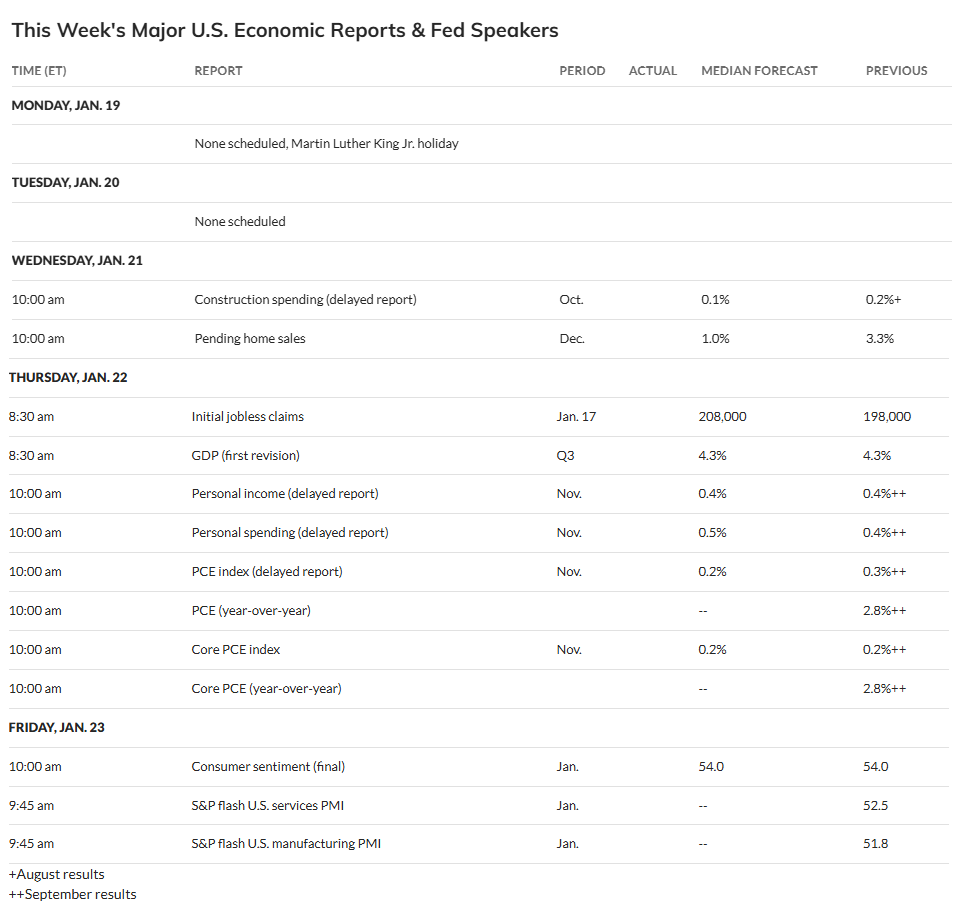
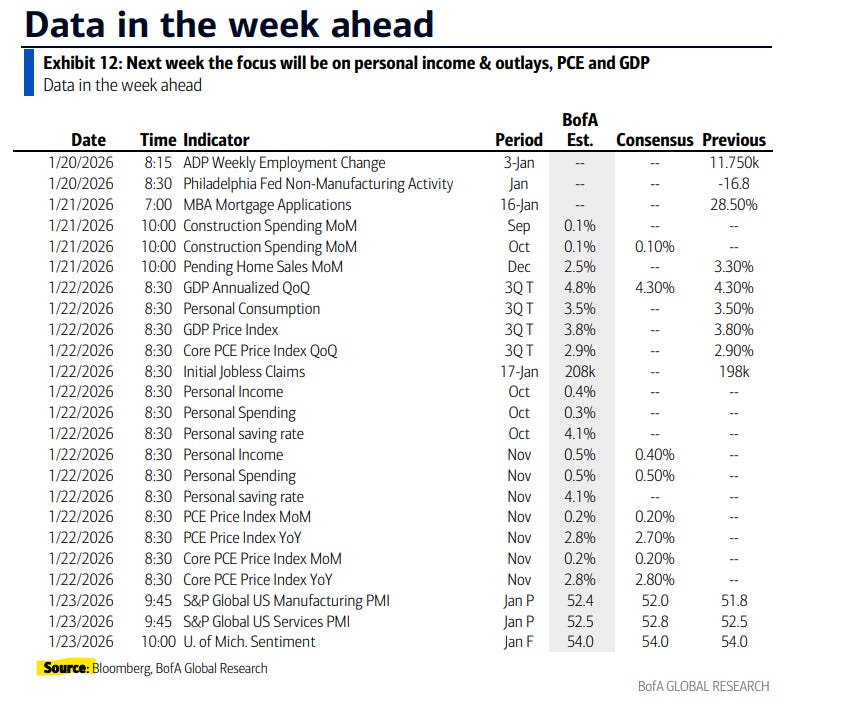
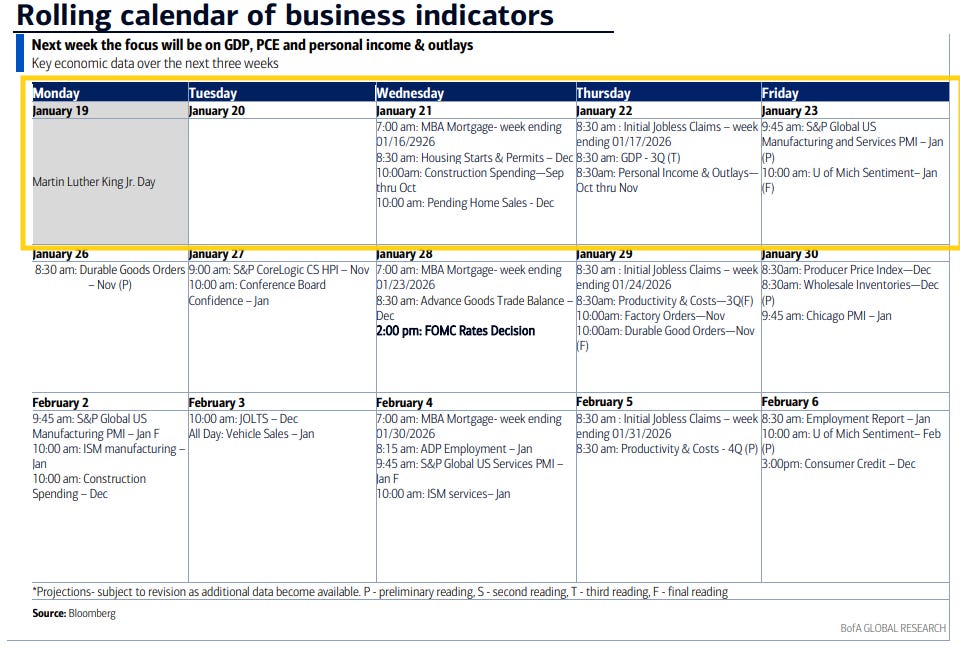
It’s a holiday shortened week (Monday all US markets are closed for Martin Luther King Day). It’s also a lighter week as is often the case for the third week of the month, although we will get a couple of normally more important reports that are delayed in the Nov personal income and spending report which includes PCE prices (the Fed’s preferred inflation indicator) as well as the first revision (and I think only revision in this case) to 3Q GDP.
We’ll also get a delayed Oct construction spending report along with Jan flash PMIs and the final UMich consumer sentiment read, Dec pending home sales, and the normal weekly reports (ADP, jobless claims, mortgage applications, EIA inventories).
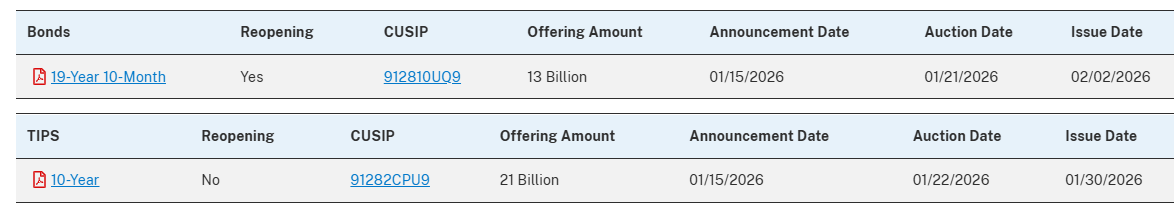
No Fed speakers with the blackout, but we will get a couple of Treasury auctions, although ones that are rarely (as in once or twice) covered in the thinly traded 20yr Treasury Bond and 10yr TIPS.
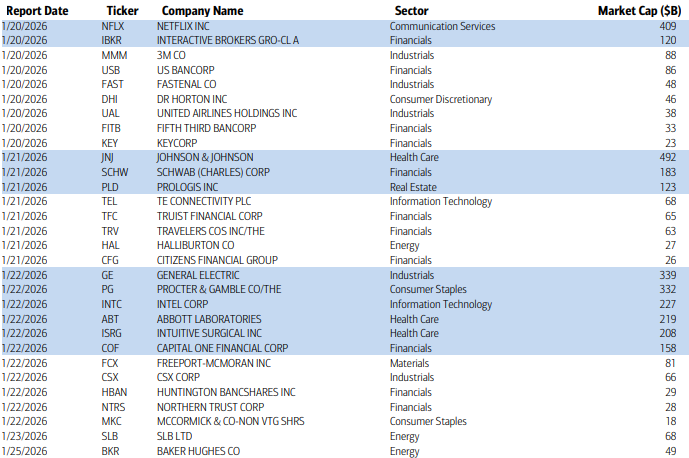
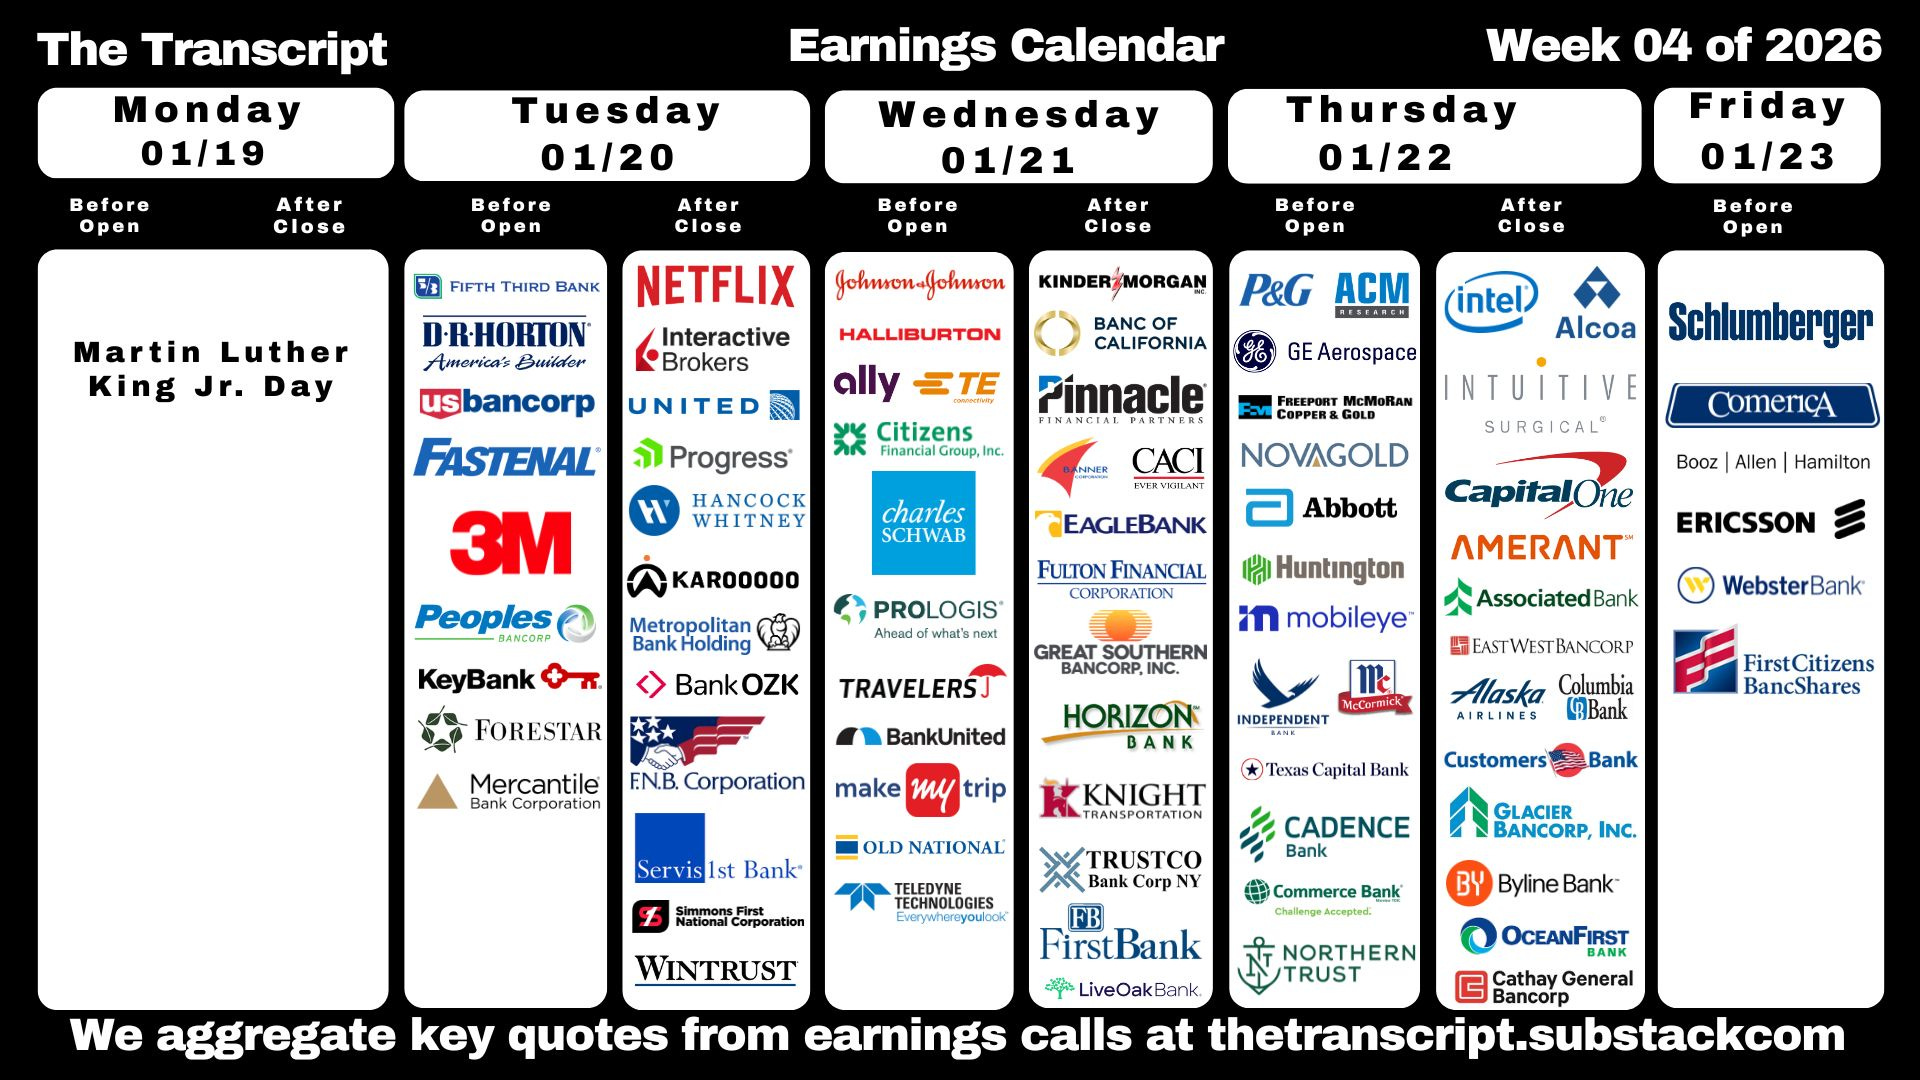
Q4 SPX earnings season picks up next week with 30 SPX reporters (although again 7% of SPX by earnings weight, the same as this last week), 11 of which are over $100bn in market cap in NFLX, IBKR, JNJ, SCHW, PLD, GE, PG, INTC, ABT, ISRG, COF (in order of reporting date).
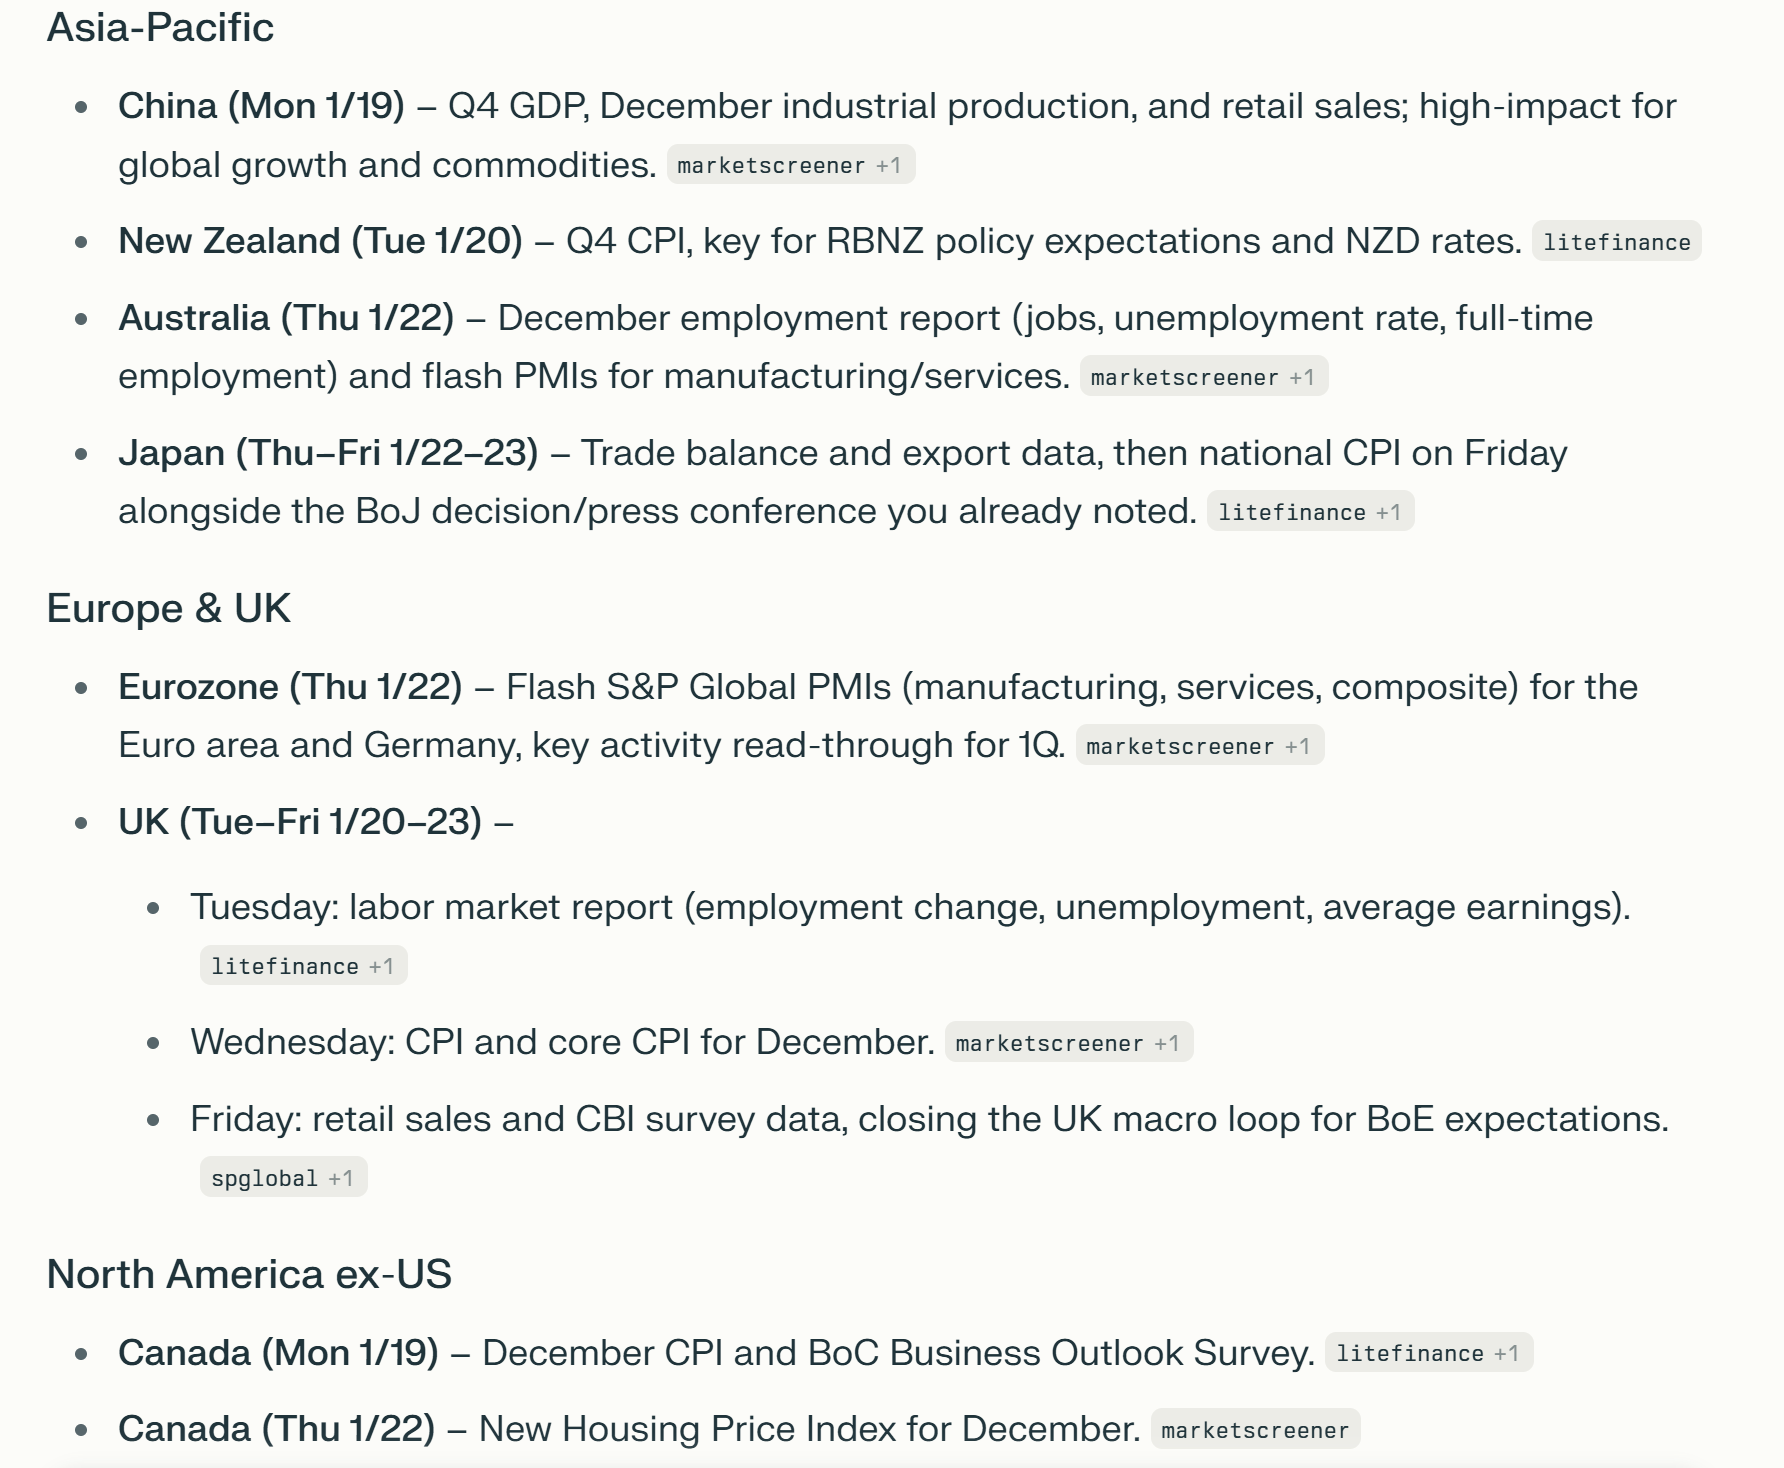
Ex-US a heavier week with highlights a policy decision from the BoJ (and PBOC), flash PMIs, Japan CPI and trade data, the monthly “data dump” from China (GDP, retail sales, IP, unemployment, FAI, property prices, etc.), ZEW economic sentiment, UK employment, retail sales, and CPI, Australia employment.


Link to X posts - Neil Sethi (@nelksethi) / X
To subscribe to these summaries, click below (it’s free!).
To invite others to check it out,