Markets Update - 12/13/24
Update on US equity and bond markets, US economic reports, the Fed, and select commodities with charts!
To subscribe to these summaries, click below (it’s free!).
To invite others to check it out (sharing is caring!),
Link to posts - Neil Sethi (@neilksethi) / X (twitter.com)
Note: links are to outside sources like Bloomberg, CNBC, etc., unless it specifically says they’re to the blog.
US equities were weak again on Friday as Treasury yields and the dollar continued to climb higher, as bets on 2025 rate cuts continued to shrivel, offsetting a huge day from Broadcom which lept 24% to join the trillion dollar club.
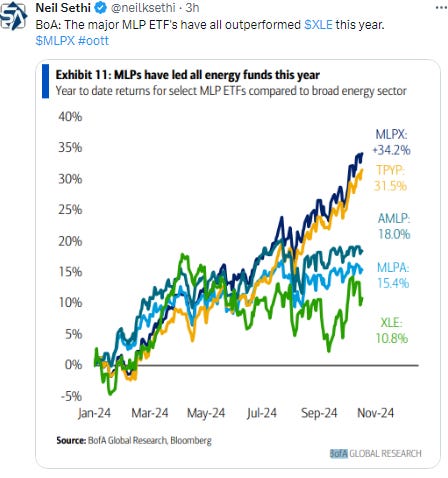
As with Thurs, the rise in the dollar and yields appeared to impact gold and copper which gave up their prior gains for the week. Nat gas also fell back while oil and bitcoin moved higher.
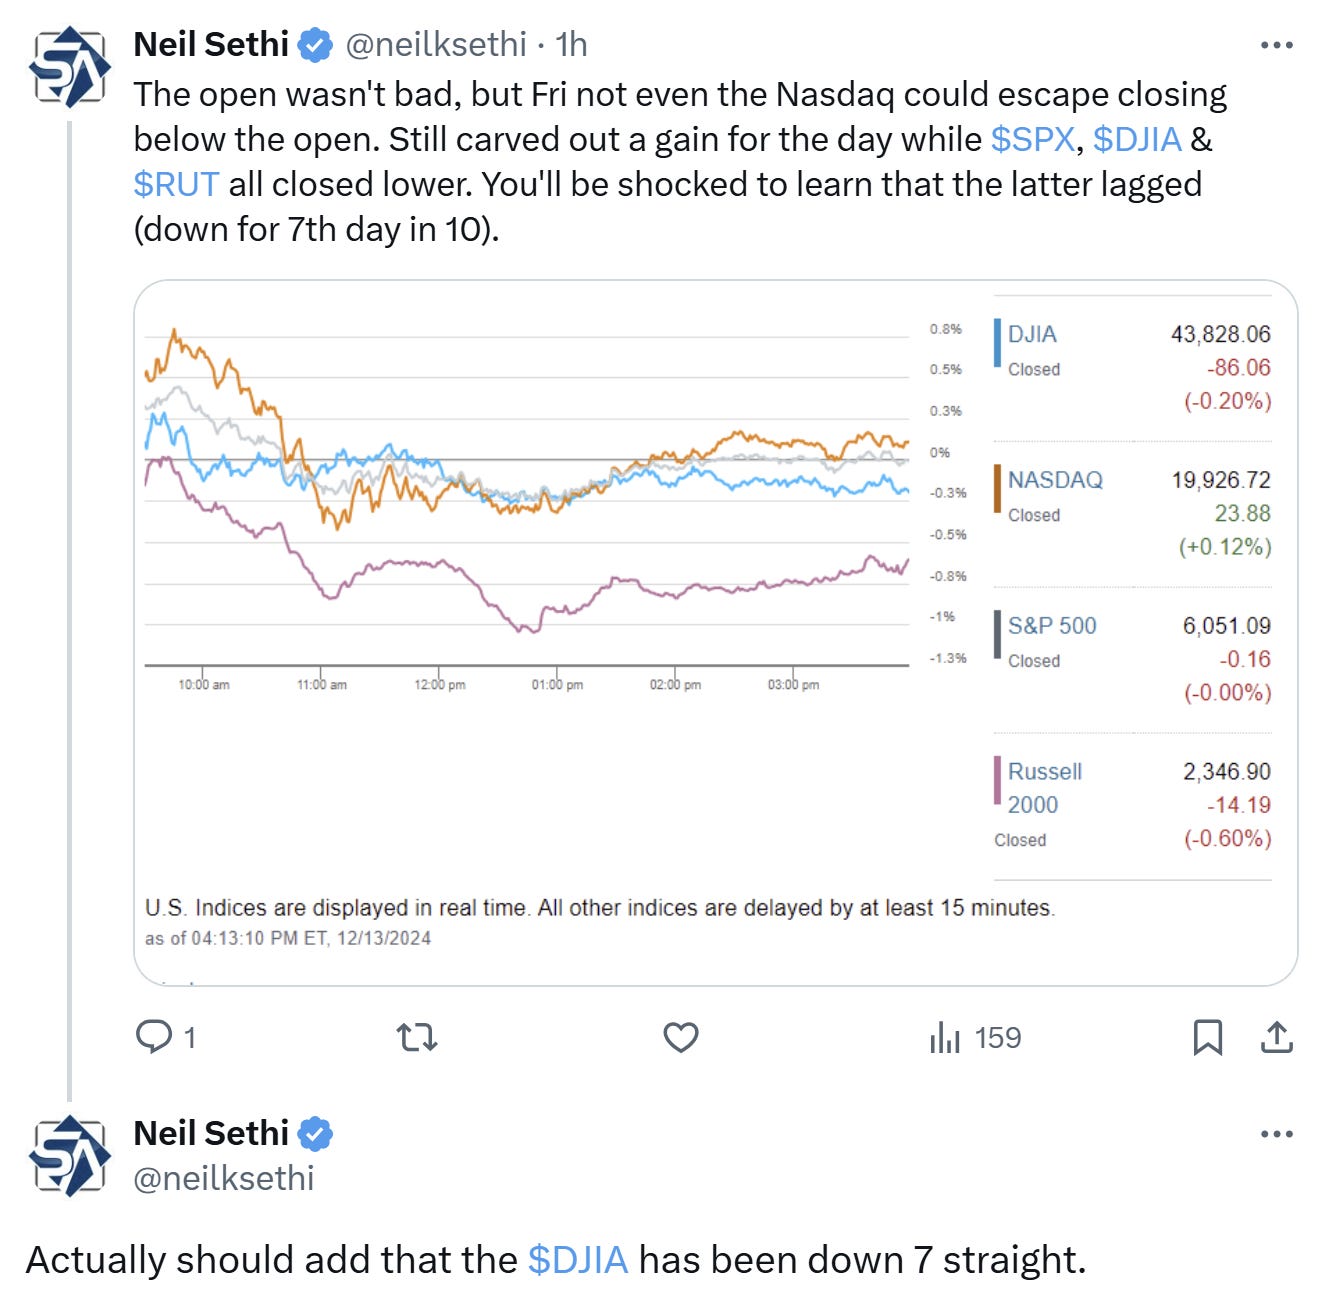
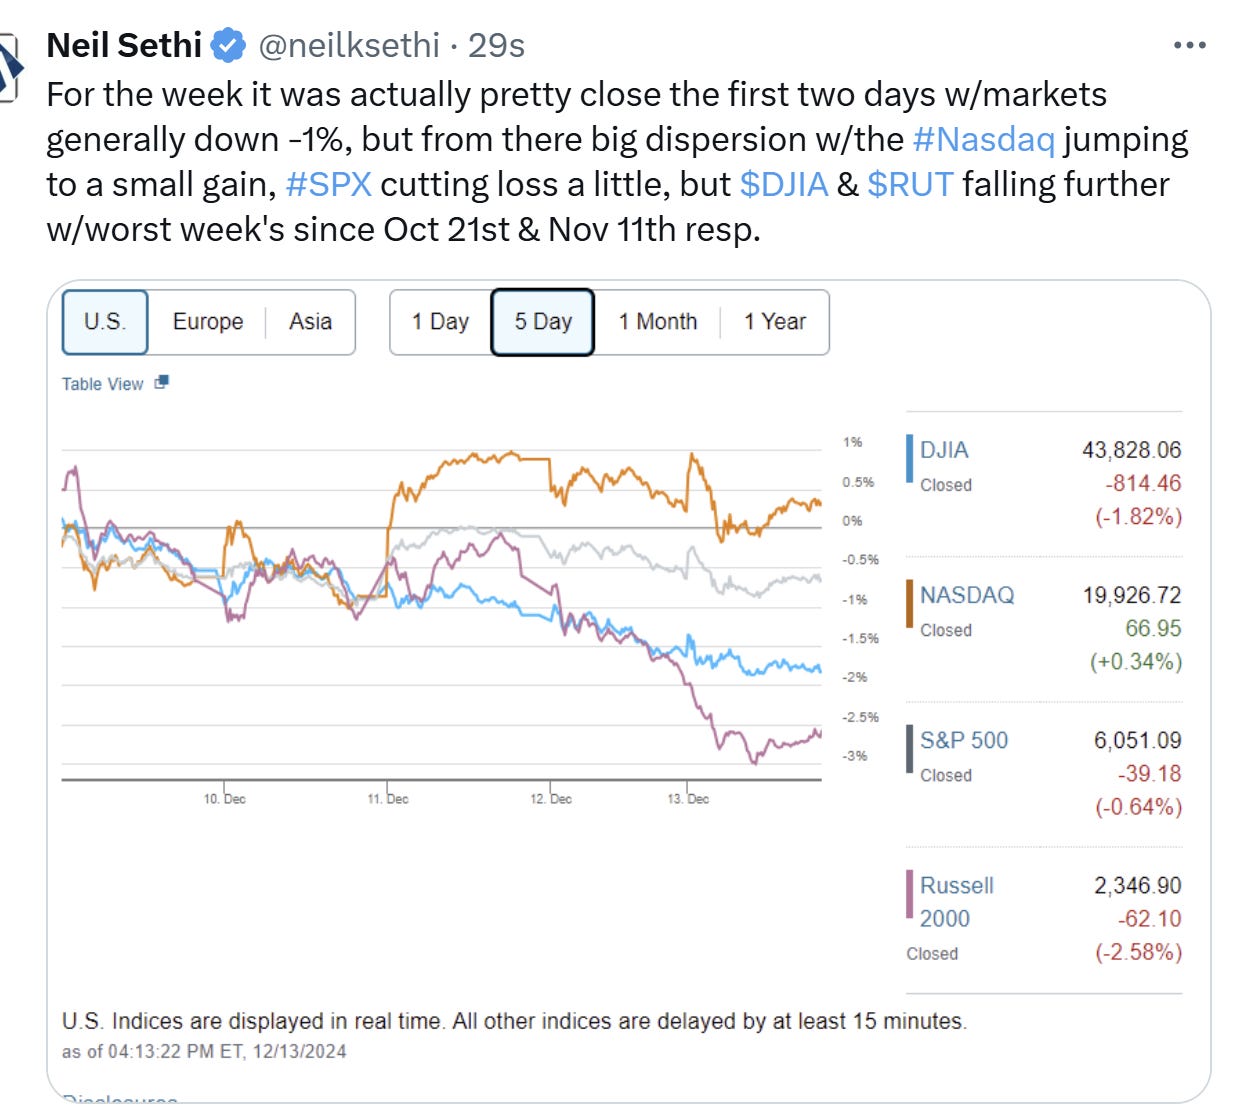
The market-cap weighted S&P 500 was unch, the equal weighted S&P 500 index (SPXEW) -0.4%, Nasdaq Composite +0.1% (and the top 100 Nasdaq stocks (NDX) +0.5%), the SOX semiconductor index +3.4%, and the Russell 2000 -0.7%.
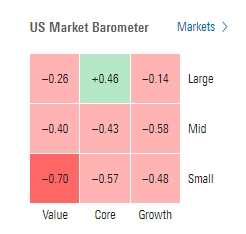
Morningstar style box consistent with most every style down again led by small caps.
Market commentary:
“You have a US economy which is doing well and an incoming administration that is very pro-corporate — all that is in the price, but it doesn’t mean the rally can’t extend,” said Timothy Graf, head of EMEA macro strategy at State Street Global Markets.
“I think we’re at the point of optimism, I don’t think we’re at the point of euphoria right now,” Joe Terranova, chief market strategist at Virtus Investment Partners, said Thursday on CNBC’s “Closing Bell.” “I think the reason to be skeptical about the ability for the market to have another significant positive year like it’s had the last two years is the fact that everyone is bullish.” He thinks now is the time for investors to focus on specific sectors, rather than an overall rise in equities.
“We expect stocks inch higher to 6,100 on the S&P 500 by year-end,” said David Laut, chief investment officer at Abound Financial. “The Santa Claus rally that we typically see at the very end of the year, likely came early this year, as there are very few near-term catalysts to push stocks higher.”
“We’re kind of stuck in this trading range,” Jay Hatfield, CEO at Infrastructure Capital Advisors, told CNBC. “The Nasdaq will outperform, small caps will underperform, [and the] Dow will underperform till we get some catalyst.”
“Tech stocks have reminded investors over the past week that the AI/quantum computing movement isn’t dying down anytime soon,” said Tom Essaye, founder of The Sevens Report. Still, “strength in tech masked what was an average performance for the rest of the market.”
“The market is readying for another move from the Fed that is more likely than not to be characterized as a hawkish cut,” BMO’s Ian Lyngen wrote to clients Thursday.
The US central bank’s three-year outlook won’t fully incorporate “Trump shocks,” according to Evercore ISI’s Krishna Guha, “implying the median three could really be two on a fully marked-to-market basis.”
“The Fed is adopting a high optionality approach around a baseline that seeks to keep policy dynamically well-positioned as we move into the high-uncertainty Trump period,” the former New York Fed official said.
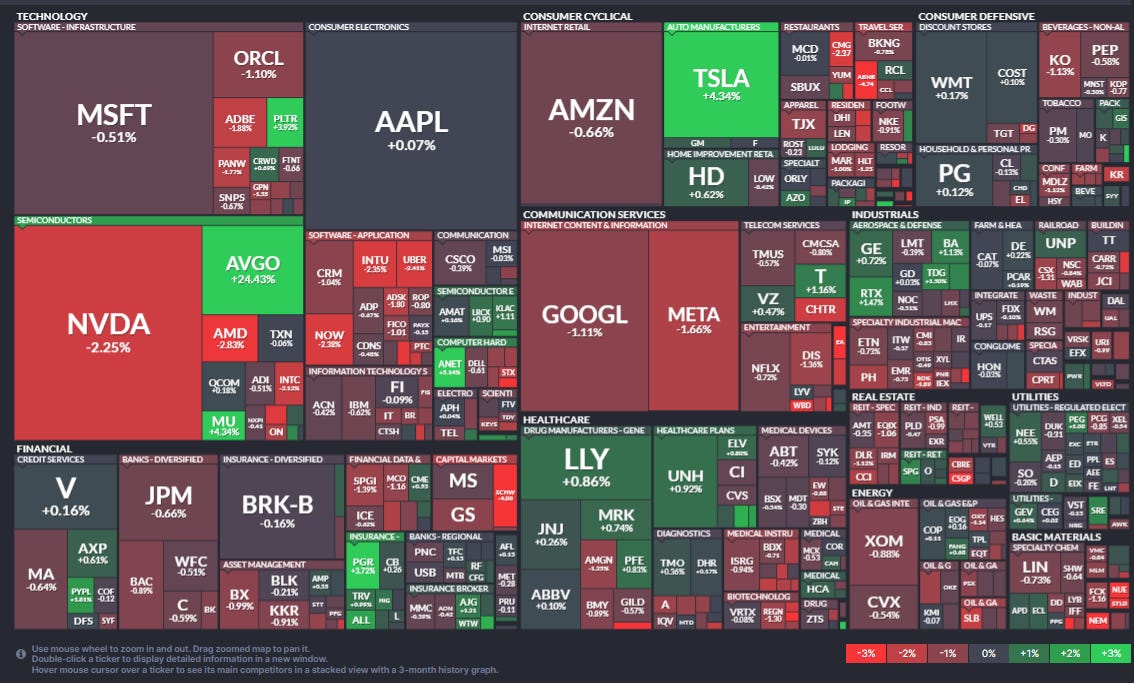
In individual stock action, Nvidia fell more than 2% reversing early gains, and Meta Platforms shed more than 1%. Amazon shares were also marginally lower. On the other hand, Broadcom reached a market cap of $1 trillion, rallying more than 24% after posting fiscal fourth-quarter adjusted earnings that beat estimates and reporting that artificial intelligence revenue soared 220% for the year.
Some tickers making moves at mid-day from CNBC.
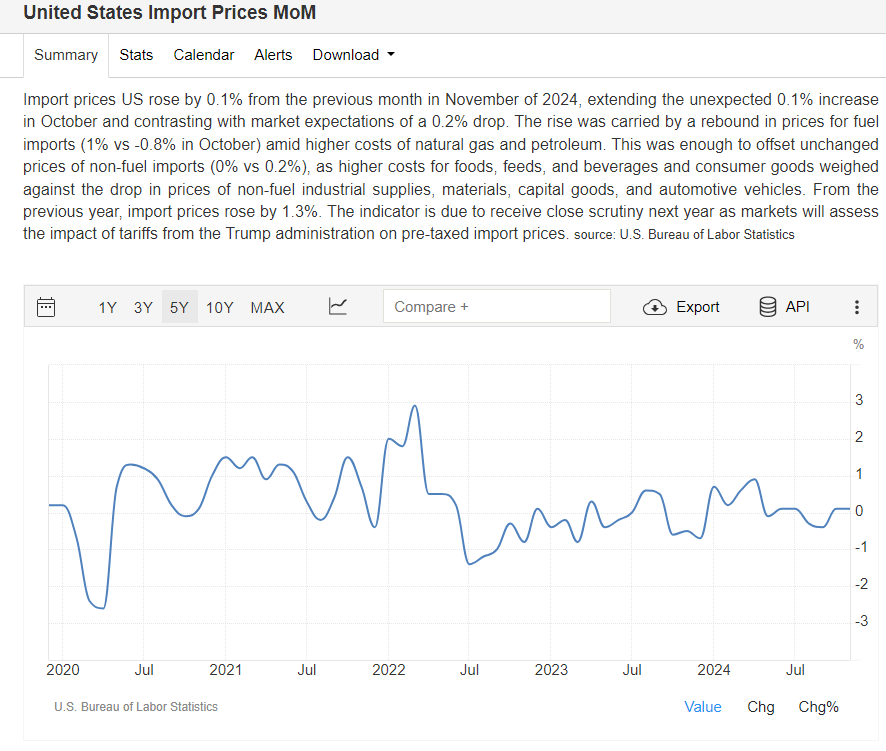
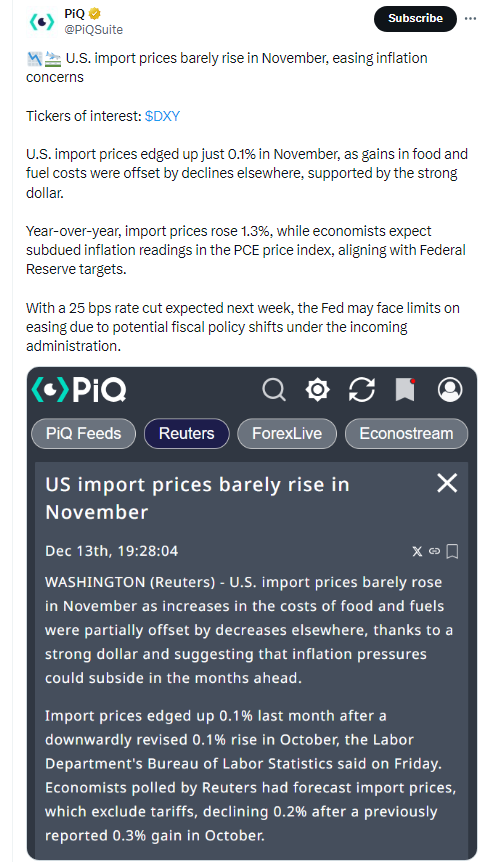
In US economic data import prices came in above expectations but at only +0.1% vs a small expected decline as fuel prices rose 1%.
Link to posts - Neil Sethi (@neilksethi) / X (twitter.com) for more details.
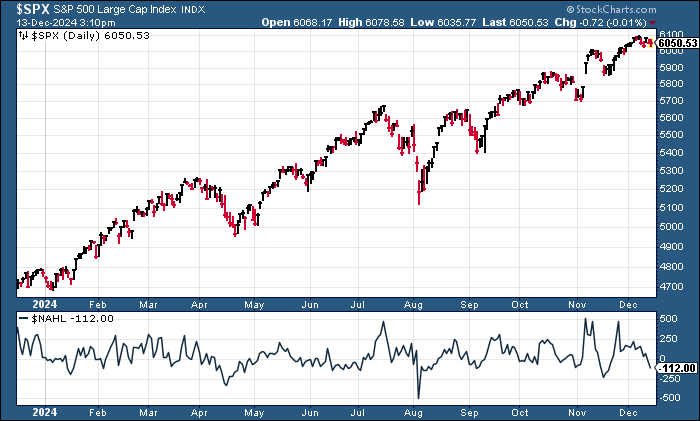
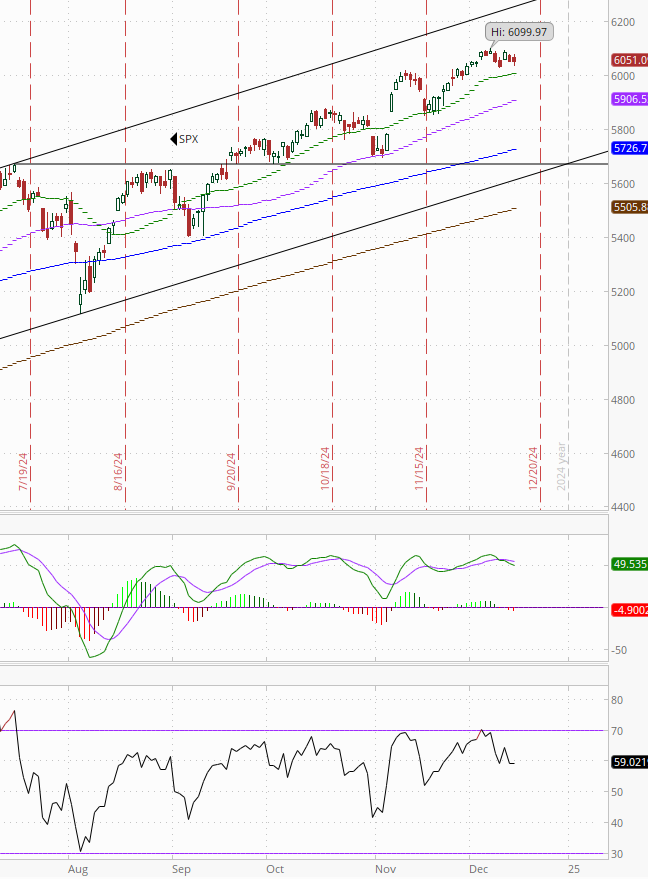
The SPX unchanged Friday remaining above the 20-DMA which it hasn’t touched since Nov 20th. Its daily MACD & RSI are starting to push negative though.
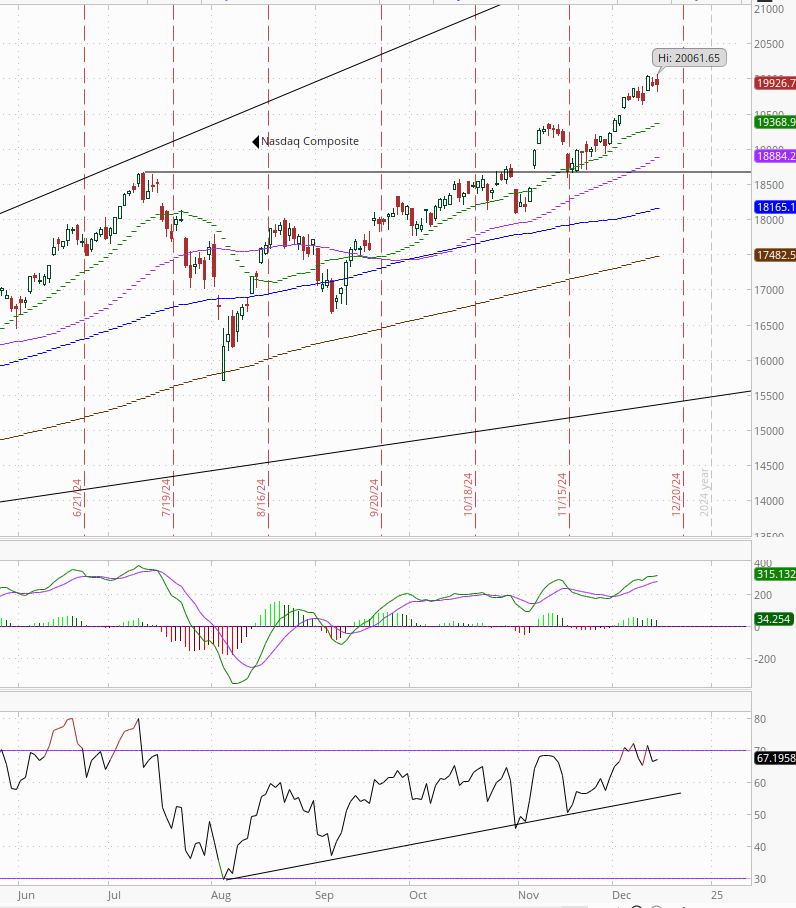
The Nasdaq Composite continues to outperform, and its daily MACD & RSI also remain more positive than the SPX.
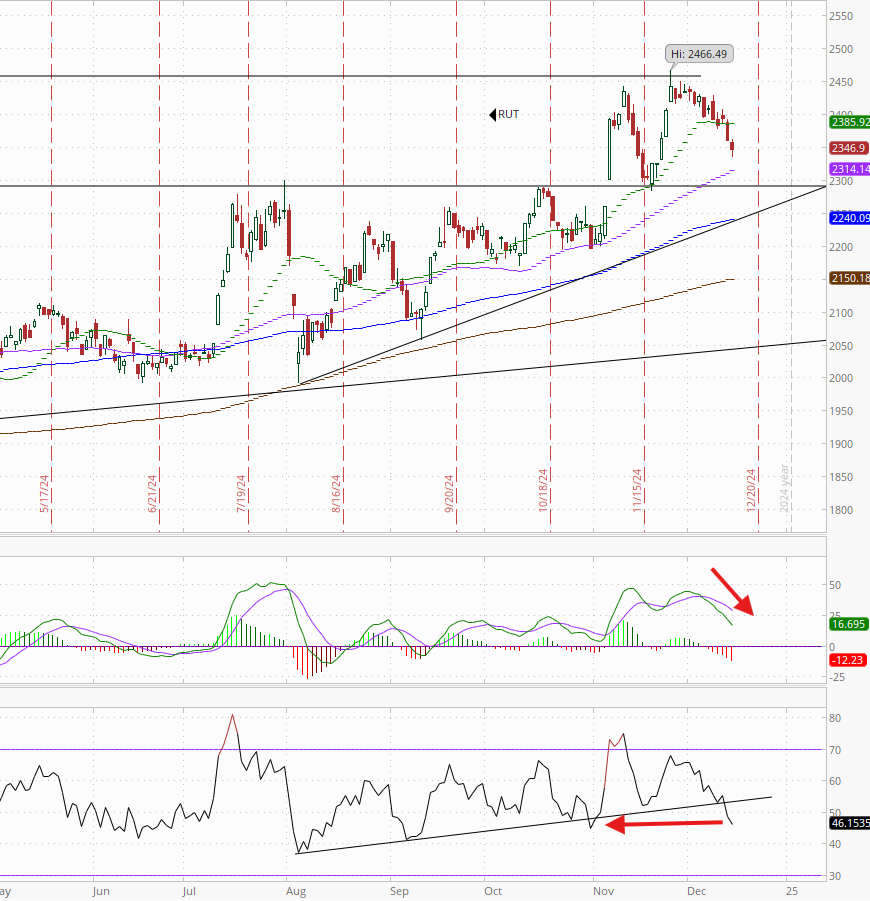
RUT (Russell 2000) as noted Tuesday “not looking good” as it continues down since then (7th decline in 10 sessions) seemingly headed for its 50-DMA support and perhaps the important 2300 level below that. Daily MACD has turned negative and the RSI has fallen to the least since November.
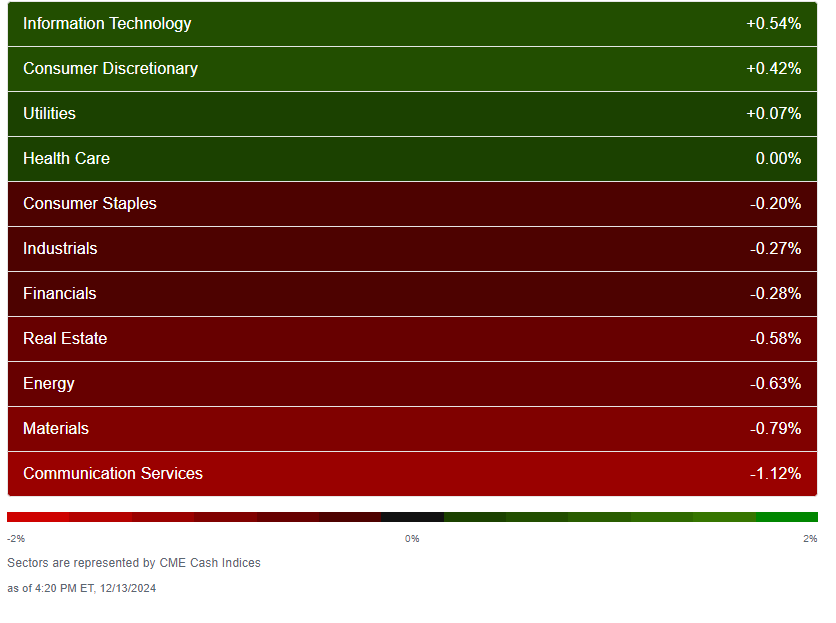
Equity sector breadth from CME Indices improved Fri from the worst in weeks Thurs w/4 green sectors Fri (up from 1) although no sector was up more than around a half percent. Four sectors down that much or more. Growth generally outperformed although it also took the bottom spot w/Comm Services -1.1%.
Stock-by-stock SPX chart from Finviz consistent, with another day of more red than green although again most of it not the “bright” red indicative of -3%+ drops.
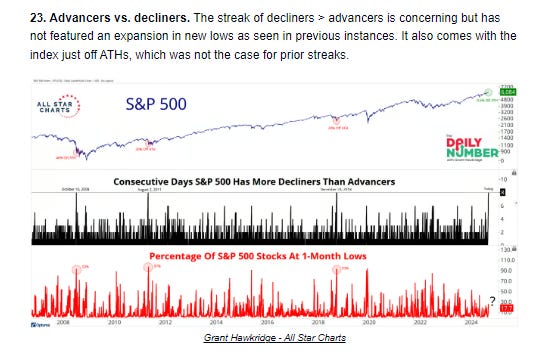
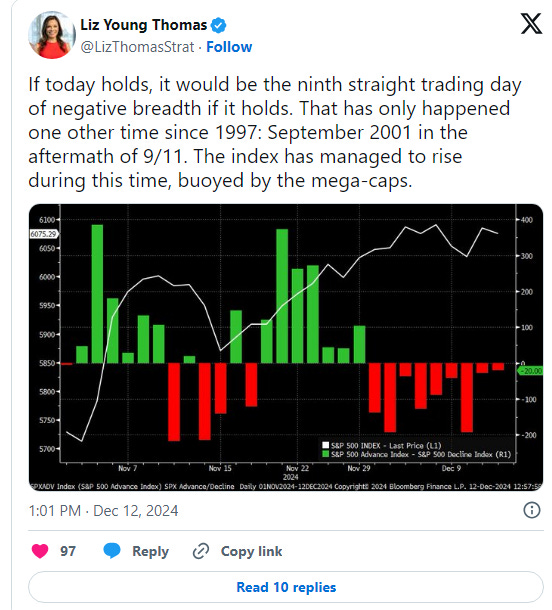
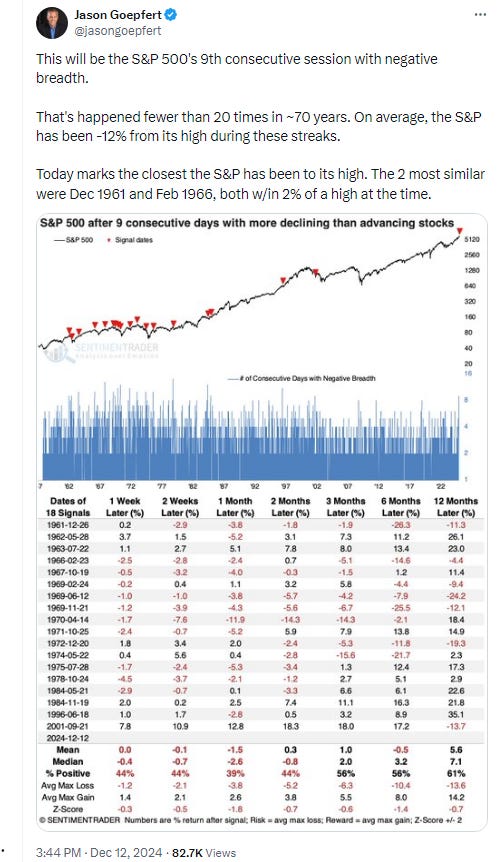
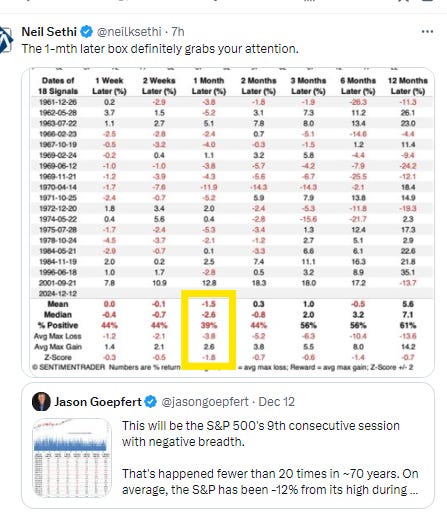
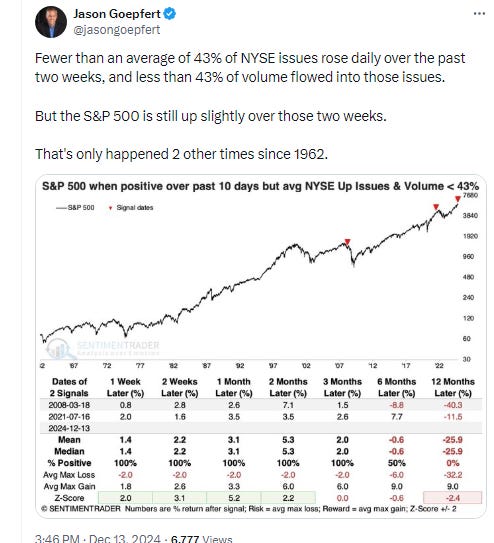
Positive volume improved a bit Friday from the worst since Nov 12th along with the indices but remained weak. NYSE came in at 34%, up from 25%, while Nasdaq actually fell back to 45% from 48% (even though Friday was a small gain versus a loss on Thursday). Positive issues (stocks trading higher for the day) were 32 & 33% respectively continuing the unusually weak number of stocks advancing (see posts below).
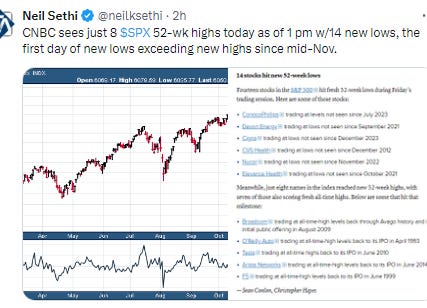
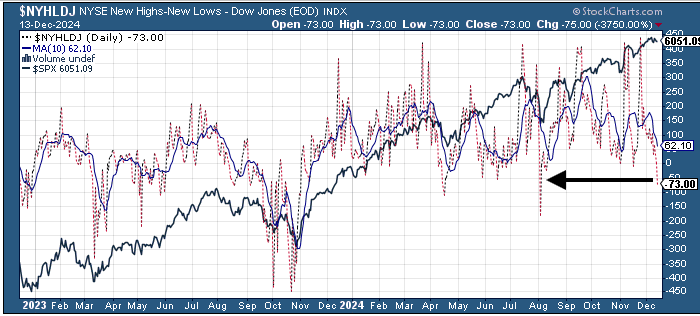
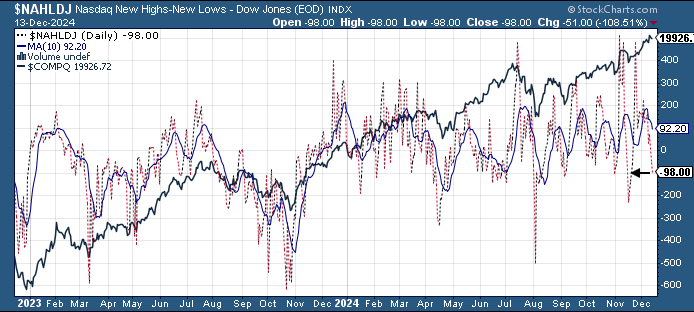
New highs-new lows were similar with the NYSE falling to -73, the weakest since Aug, while the Nasdaq fell to -101, the least since 11/19. Both remain below the respective 10-DMAs which are heading lower (more bearish).
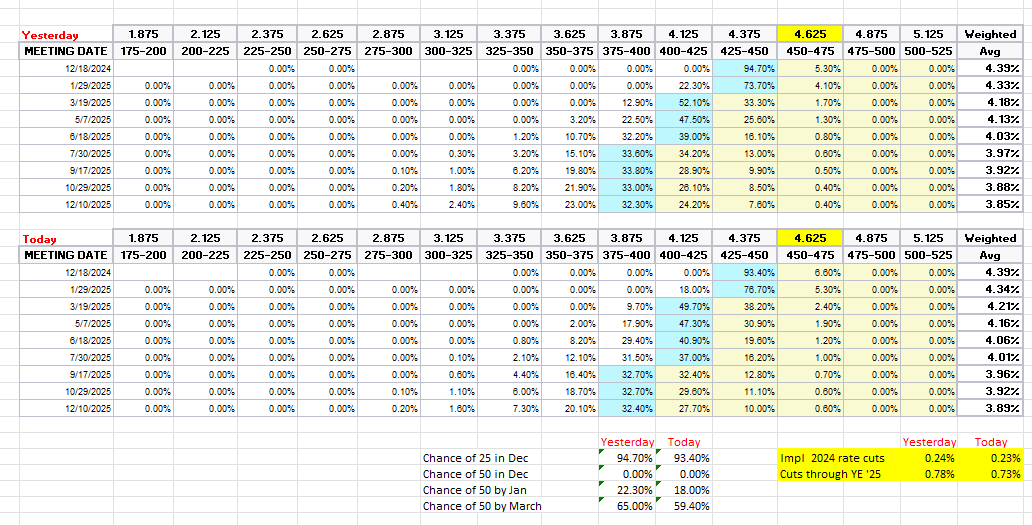
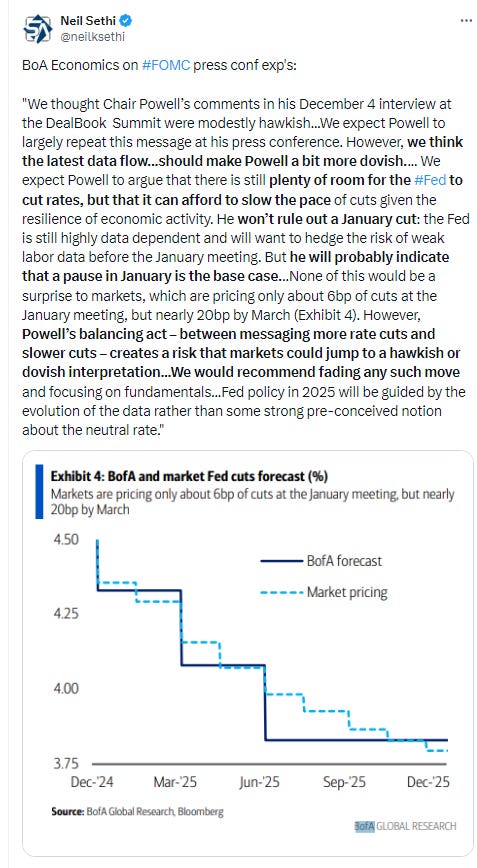
FOMC rate cut probabilities from CME’s #Fedwatch tool fell to the least of the week, although bets on a December cut remained very high at 93% (meaning if the Fed is at all not sure they’re going to cut, we should see a media article tipping that fact very (very) soon). A further cut in March edged back to 59%, and total cuts through YE 2025 fell back to 73bps (the least in over a week, meaning we’ve priced out almost a full cut since earlier in the week, back under 2 full cuts after December’s cut, explaining some of the strength in 10yr yields).
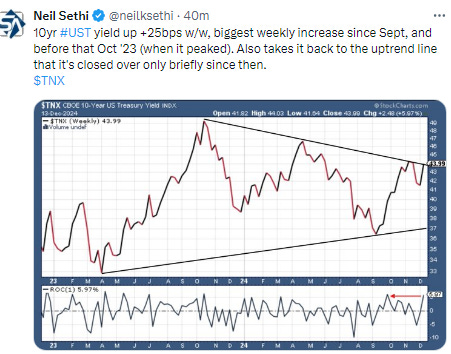
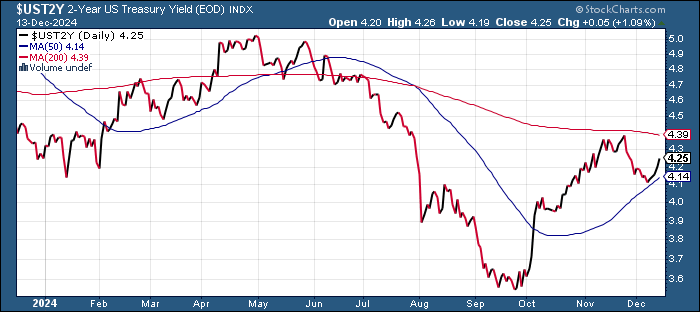
Treasury yields pushed higher for a 5th day on the long end with the 10yr yield +8bps to 4.40%, now up 28bps from the low on Friday when it bounced off what is now a decent uptrend line, now back to what has been a strong downtrend line. That cut its decline since the election to -2bps. The 2yr yield, more sensitive to Fed policy, also was higher +6bps to 4.24%. While down -12bps the last 2 wks it was up +14bps this wk.
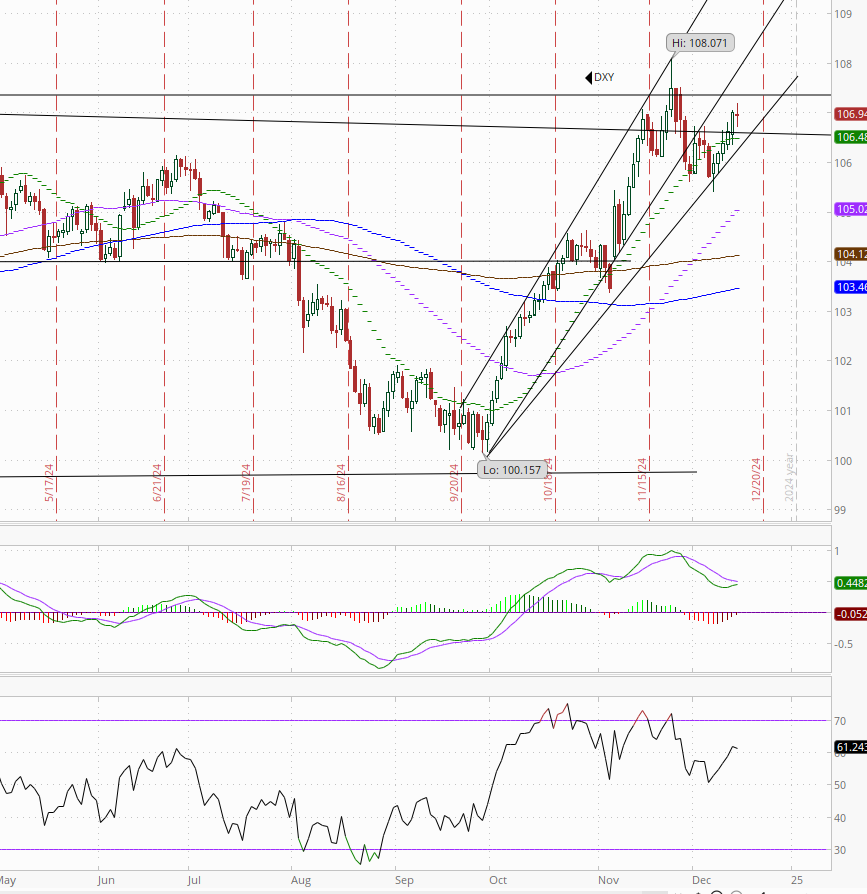
Dollar ($DXY) broke it’s 5 session streak of gains with a tiny decline after giving up an early advance as the euro strengthened throughout the day. It’s just off its highest close since Nov 22nd and remains less than a percent from a 2-yr high. As noted Wed, just minor resistance now between it and the prior high. Daily MACD is starting to turn more neutral (from negative) while the RSI remains constructive.
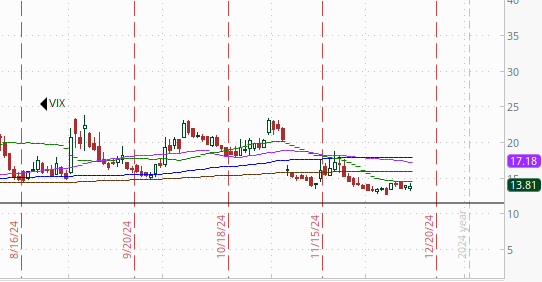
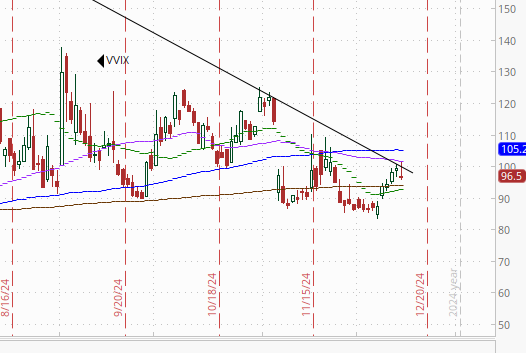
The VIX was little changed at 13.8 (consistent w/0.87% daily moves over the next 30 days) while the VVIX (VIX of the VIX) fell back for the 1st day in 6 from the highest since 11/22 at 96.5 (consistent with “moderately elevated” daily moves in the VIX over the next 30 days).
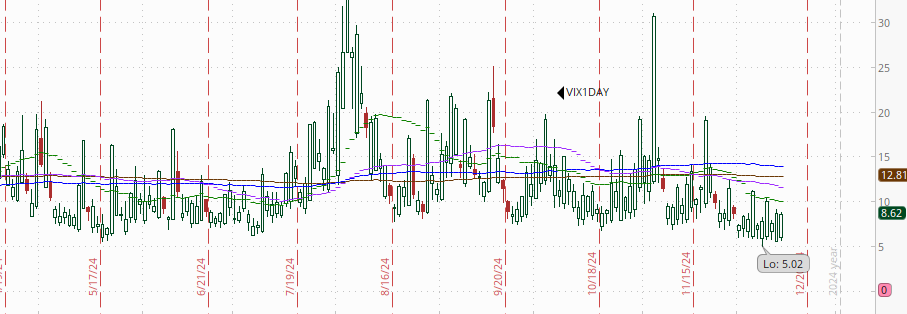
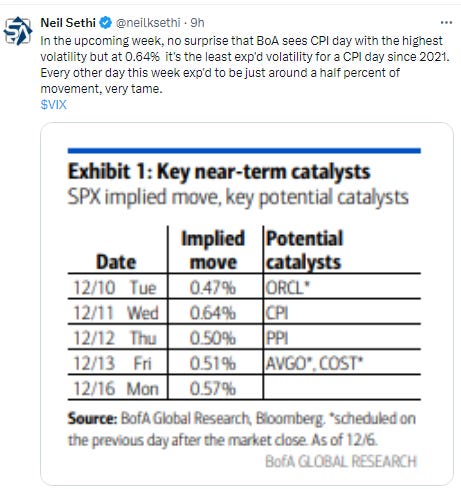
1-Day VIX also little changed at 8.6 , looking for a move of just +0.52% Thursday, in-line with the +0.57% BoA said was implied by options coming into the week.
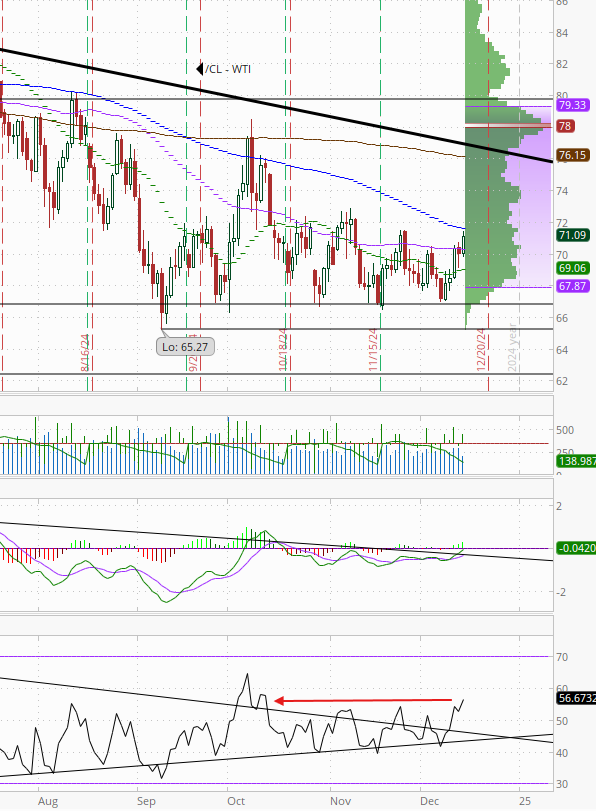
WTI advanced for the 4th day in 5, up nearly 6% on the week and taking it to a 3-wk high. As mentioned Wed “it’s now threatening to break the series of lower highs the past 2 months consistent with the note a week ago that ‘it’s been able to bottom in this area every previous time this year.’” Daily MACD & RSI are gaining some momentum with the latter the strongest since Oct. Could see a big short covering rally if it gets over $72.
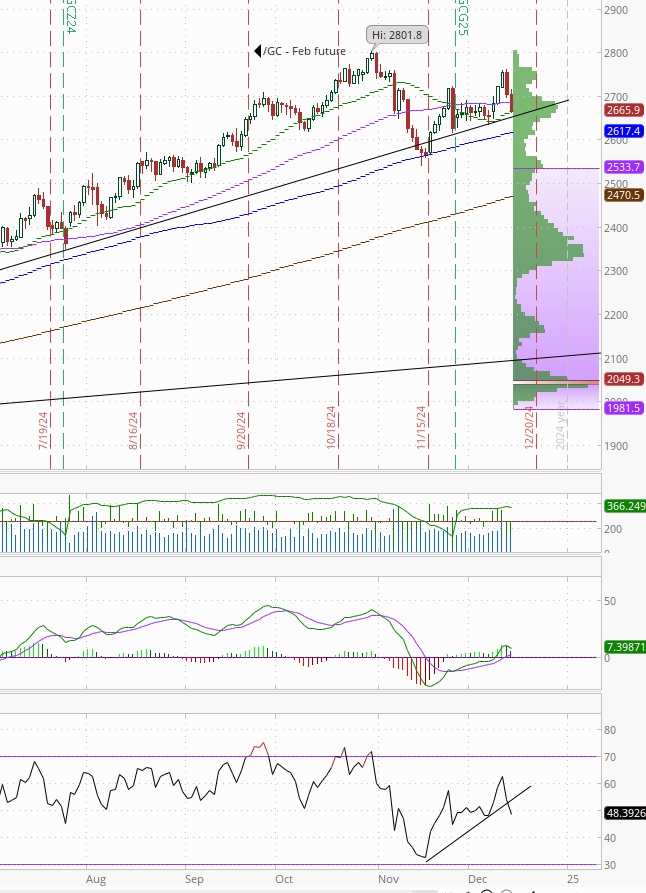
Gold fell back for a 2nd day giving up its gains for the week and falling under its 50-DMA to the area of its uptrend from Feb. Its “clear path to test its ATH” is now less clear. It’s MACD remains supportive for now but its RSI is not.
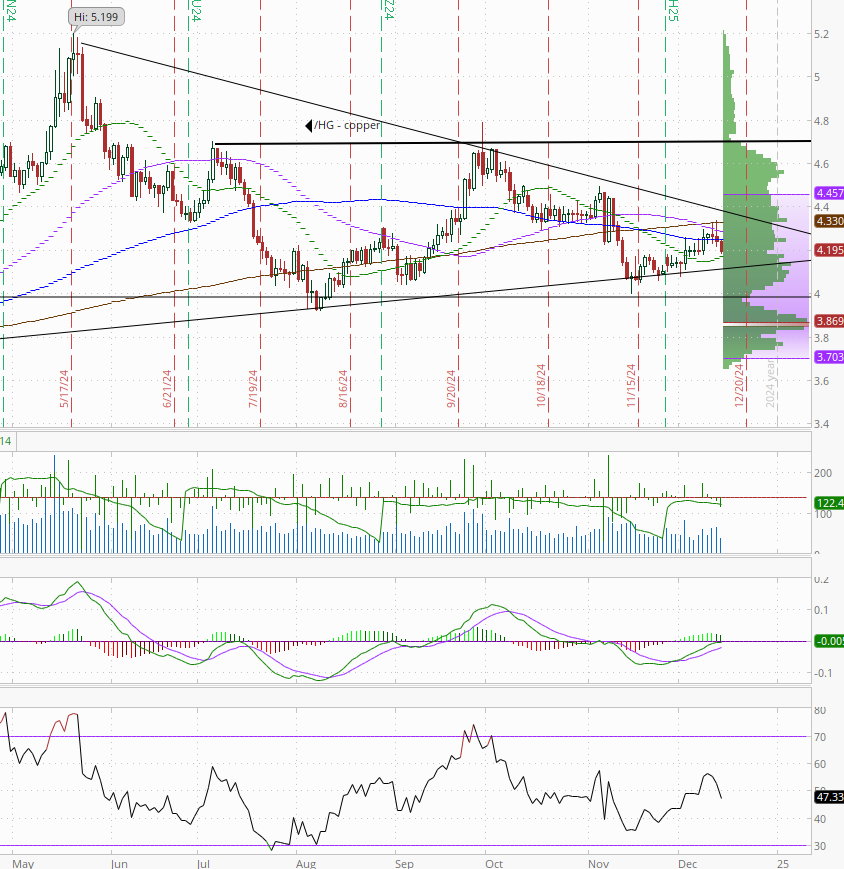
Copper (/HG) also fell back for a 2nd day Friday although remains above its uptrend line. Like gold though it’s seen its RSI deteriorate while its MACD remains in better shape.
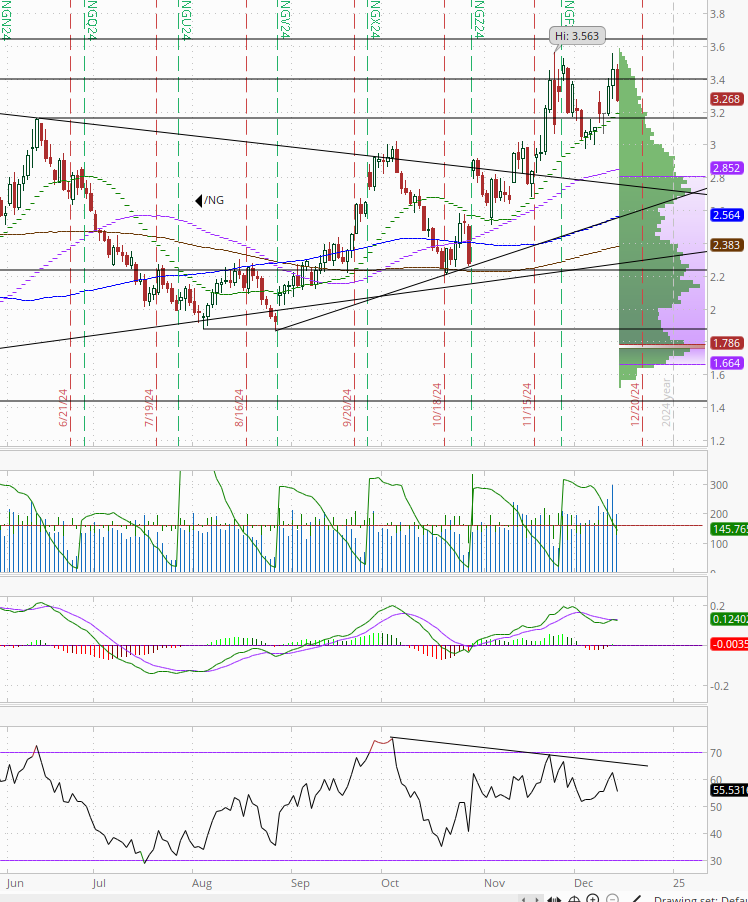
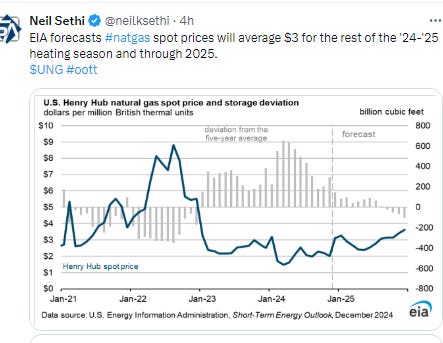
Nat gas (/NG) fell back Friday after at one point Thursday making it close to the highs of the year. Still its uptrend is generally intact. Daily MACD remains more neutral, while the RSI is positive but deteriorating.
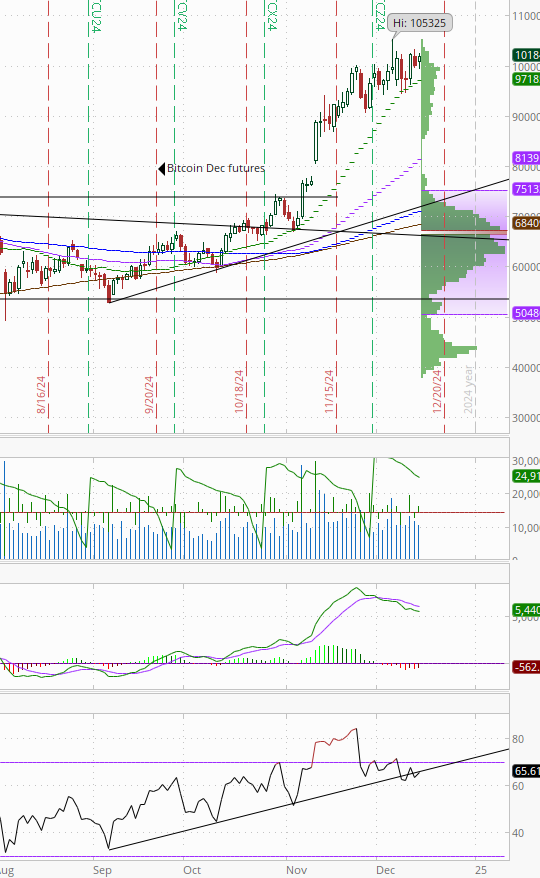
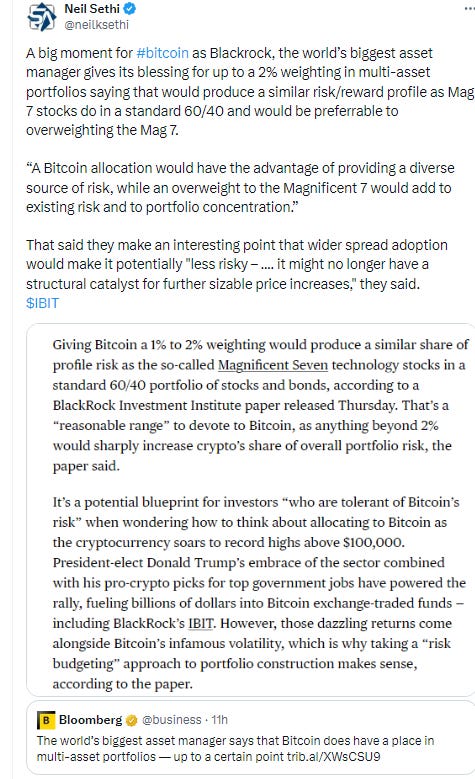
Bitcoin futures edged higher remaining near all-time closing highs above the $100k level. The daily MACD as noted two weeks ago is “more negative again but that has actually been a contrary indicator with Bitcoin for the most part this year.” As mentioned Wed, '“looks like it was again this time.” RSI was weak but is improving.
The Day Ahead
More on Sunday. Enjoy your weekend.
Link to X posts - Neil Sethi (@neilksethi) / X (twitter.com)
To subscribe to these summaries, click below (it’s free!).
To invite others to check it out,


