Markets Update - 12/20/24
Update on US equity and bond markets, US economic reports, the Fed, and select commodities with charts!
To subscribe to these summaries, click below (it’s free!).
To invite others to check it out (sharing is caring!),
Link to posts - Neil Sethi (@neilksethi) / X (twitter.com)
Note: links are to outside sources like Bloomberg, CNBC, etc., unless it specifically says they’re to the blog.
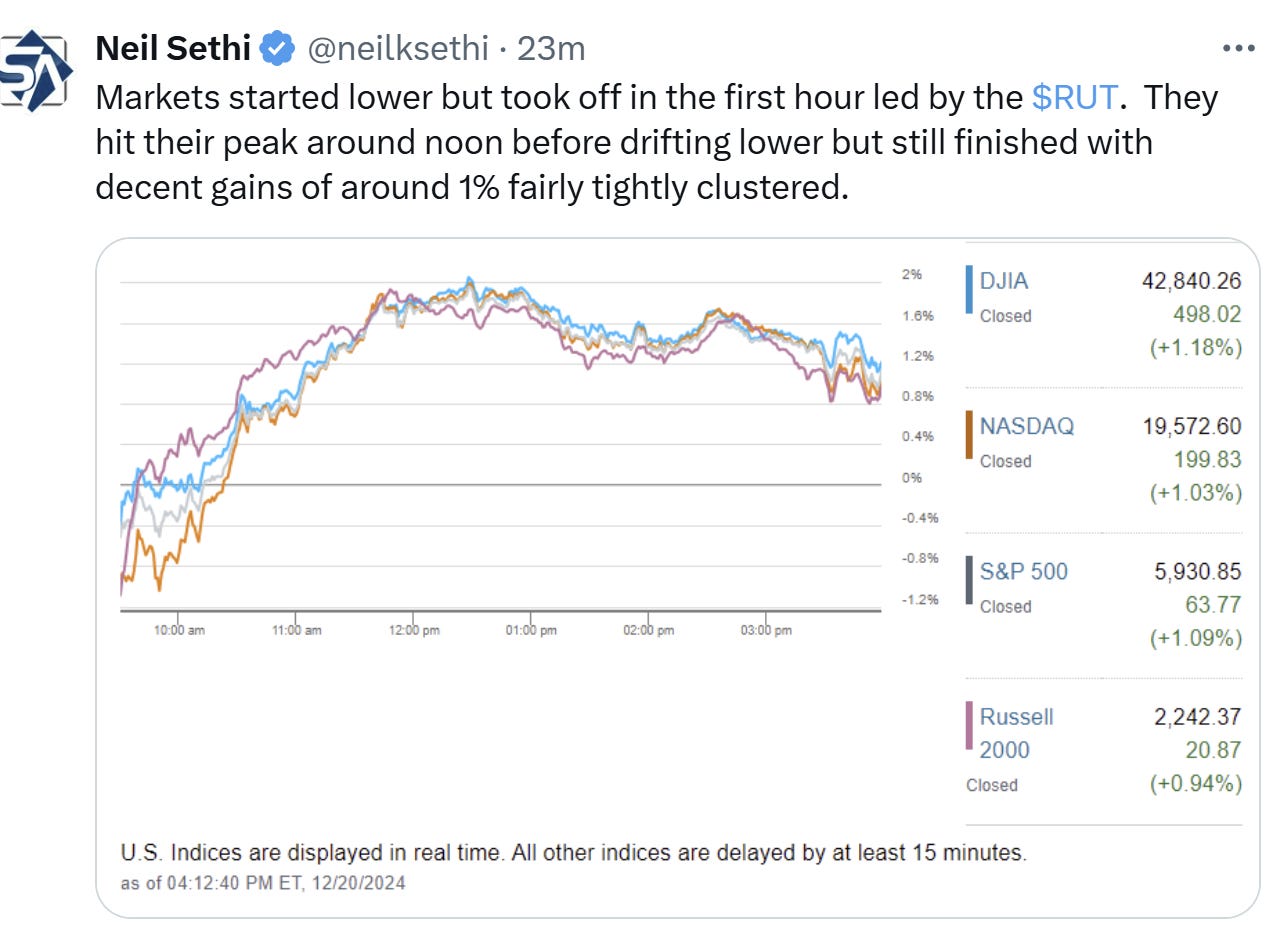
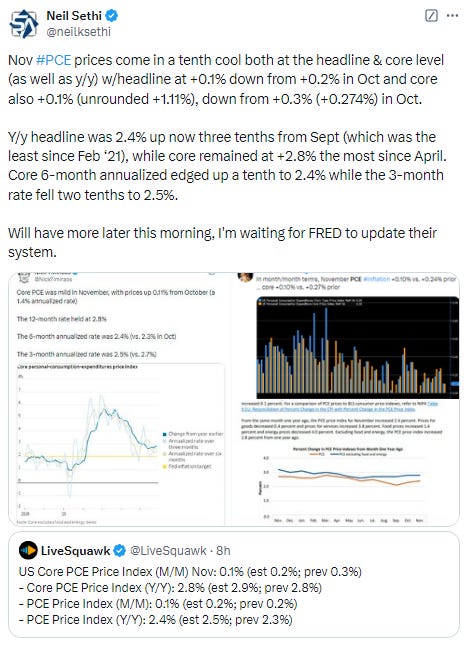
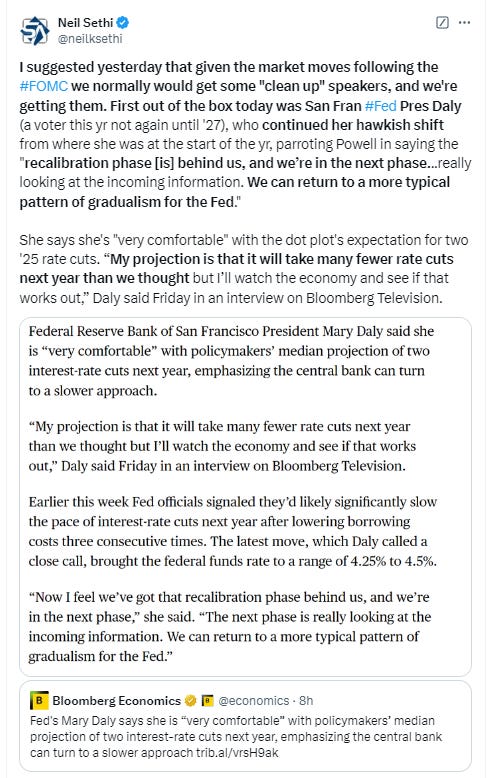
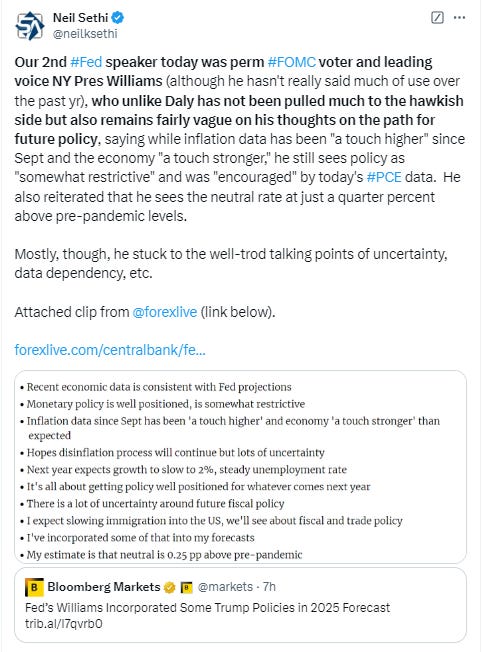
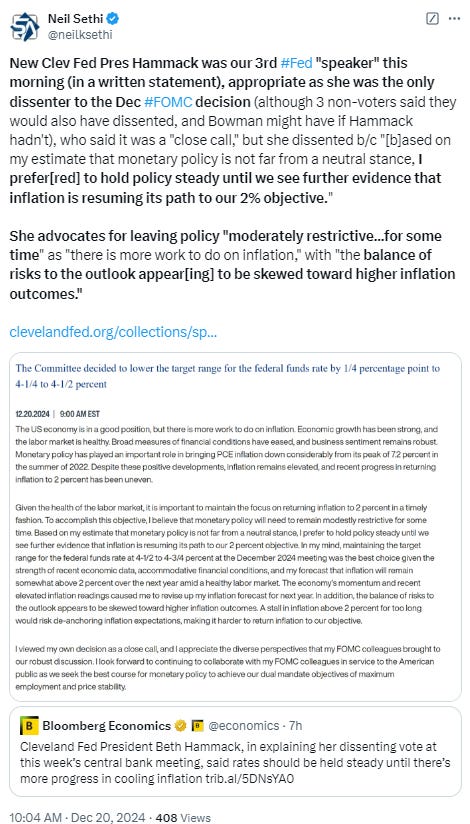
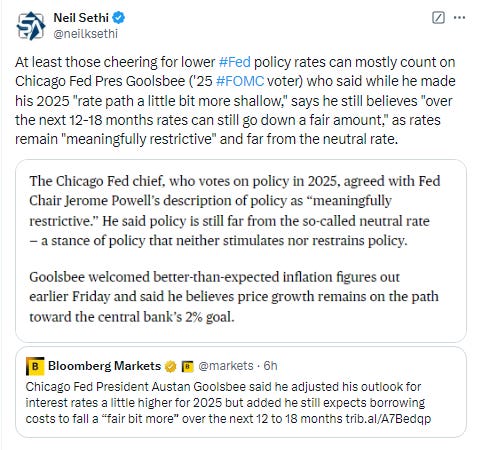
US equities tried their hand again at a bounce Friday, and did a little better. While finishing off the highs, they were able to hold gains of around 1% on the major indices with a broad rally after core PCE prices for Nov (a key inflation measure focused on by the FOMC) came in a tenth below expectations, as did monthly gains in personal incomes and spending, which in turn saw bond yields fall back and bets on FOMC rate cuts increase. A succession of relatively hawkish speakers (ex-dove Austan Goolsbee) though saw some of that reverse which probably played a part in the index easing back in the afternoon (it was also a big options expiration day with index rebalances as noted yesterday, so that may have also played a part).
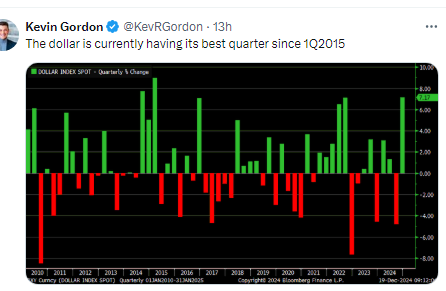
Like yields, the dollar fell, in its case the most this month (but still advanced for a 3rd week), giving some breathing room to commodities. Gold, oil, copper, nat gas and bitcoin all advanced, although all but nat gas were down for the week.
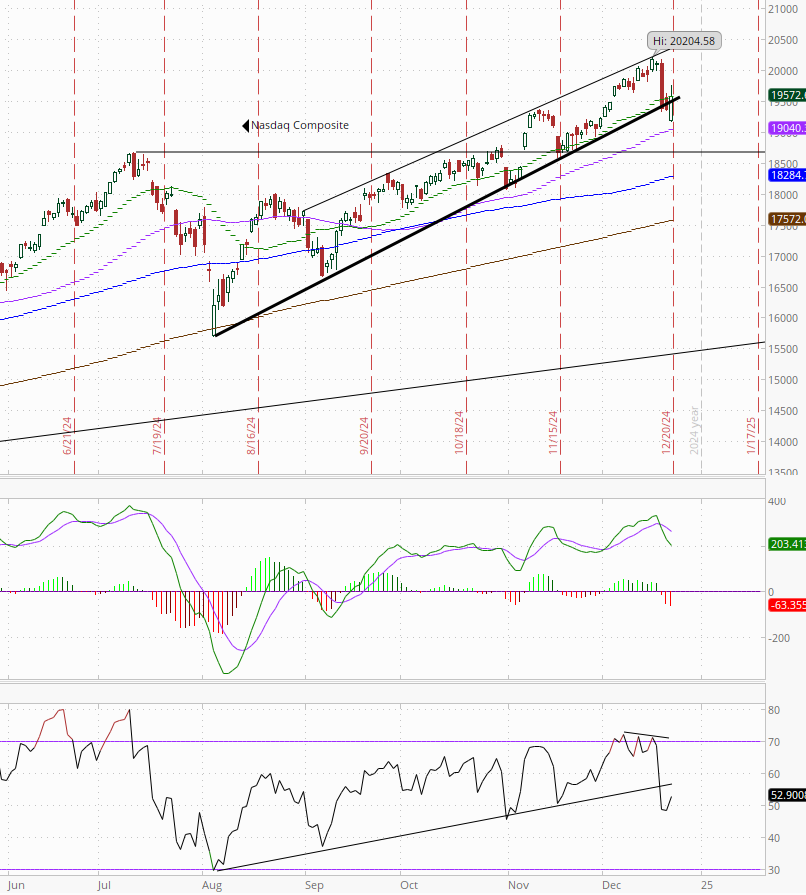
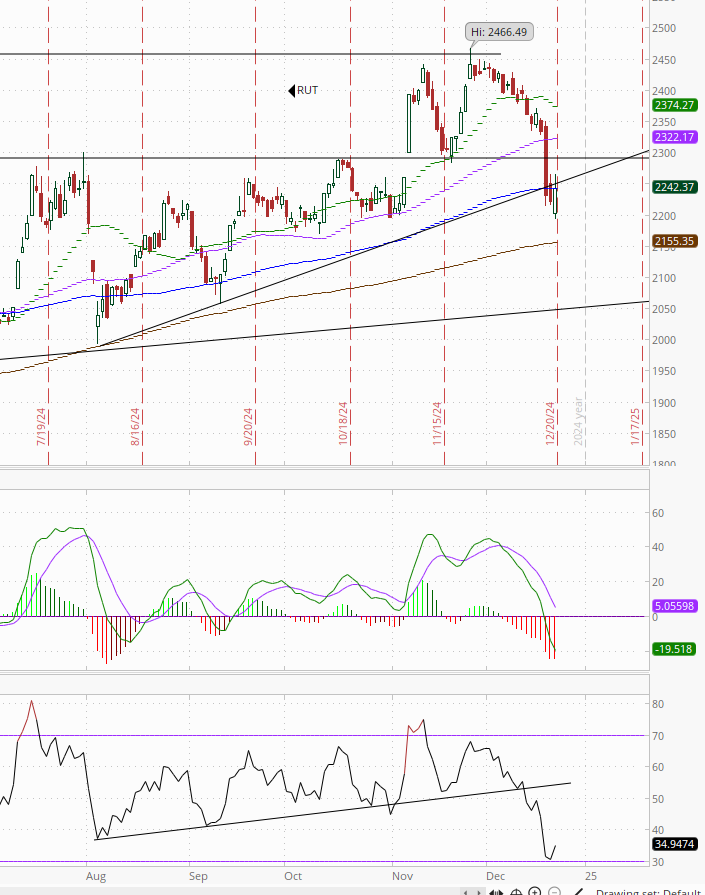
The market-cap weighted S&P 500 was +1.1%, the equal weighted S&P 500 index (SPXEW) +1.4%, Nasdaq Composite +1.0% (and the top 100 Nasdaq stocks (NDX) +0.8%), the SOX semiconductor index +1.5%, and the Russell 2000 +0.9%.
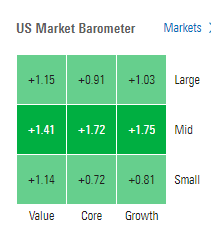
Morningstar style box saw every style up with some interesting relative strength in mid-caps.
Market commentary:
“Overall, [the personal income and spending report] was a round of data that was consistent with the more benign inflation profile that appears to be emerging in the fourth quarter,” wrote Ian Lyngen of BMO Capital Markets. “However, core inflation didn’t print low enough to prevent a January Fed pause.”
“Today has calmed people down,” said Tom Fitzpatrick, managing director at R.J. O’Brien and Associates. ”[It’s] unlikely we get a downside catalyst now ahead of Christmas and New Year’s, so [the] moves of the last few days can get unwound a bit.”
“I don’t know why we always have to be reminded that the Fed not cutting rates — or not cutting rates as fast — is actually good news if it’s driven by stronger economic data, and that’s exactly what the Fed is telling us,” Art Hogan, chief market strategist at B. Riley Wealth, said in an interview, adding that the selloff after the Fed meeting was a “major overreaction.”
The Fed is now likely to wait and see how tariff and immigration policies unfold over the next coming months before implementing another cut, said Olu Sonola, Fitch Ratings’ head of US economic research.
With the central bank facing these policy uncertainties from the incoming administration, odds still favor a pause on rate cuts in January, said Chris Larkin, managing director, trading and investing, E*Trade from Morgan Stanley.
“There’s plenty of room for volatility to kick in and a selloff to take place,” said Neil Birrell, chief investment officer at Premier Miton Investors. “There’s going to be less liquidity as well. You’ll see a rapid pace of moves taking place as people adjust their portfolios for the year-end and that could affect all asset classes.”
A US shutdown can “inevitably increase the market volatility in the short term, especially after Fed’s hawkish pivot two days ago,” Jasmine Duan, a senior investment strategist at RBC Wealth Management Asia, told Bloomberg TV. Investors face risks from “potentially more sticky inflation and also the debt issue in the US,” she said.
In individual stock action, 23 of the 30 Dow components closed in the green led by NVIDIA (NVDA 134.70, +4.02, +3.1%) and UnitedHealth (UNH 500.13, +10.88, +2.2%). NIKE (NKE 76.94, -0.16, -0.2%) was among the handful of DJIA components that closed lower after disappointing with its fiscal Q3 revenue guidance after initially trading strongly higher last night (per the Thursday report).
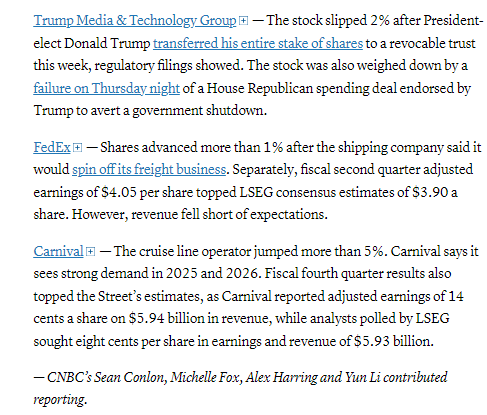
Some tickers making moves at mid-day from CNBC.
In US economic data:
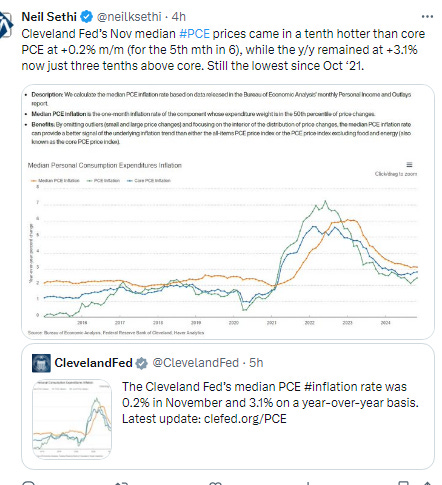
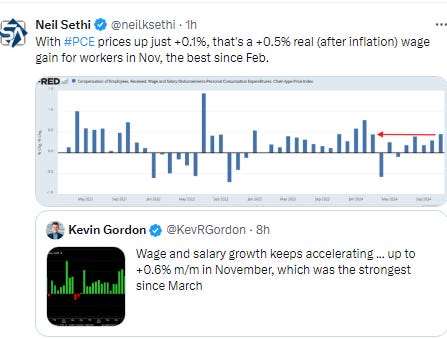
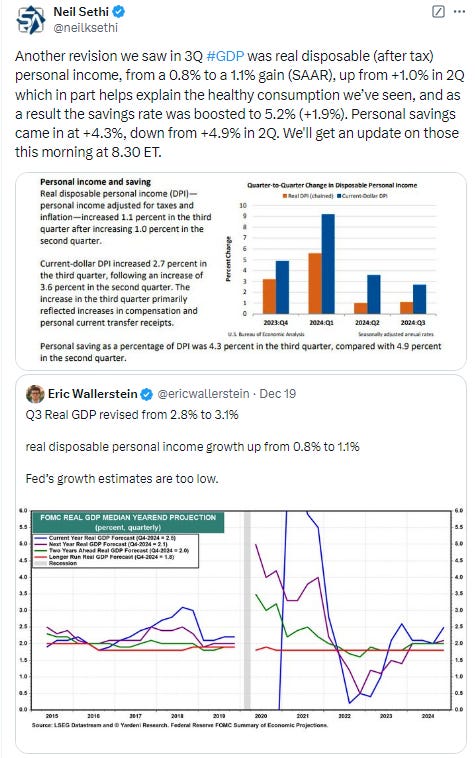
Personal income and spending came in a tenth soft at +0.3% & +0.4% m/m respectively, still solid numbers (and inflation adjusted compensation rose the most since Feb), while the core PCE price index (Fed’s most preferred inflation gauge) also was a tenth soft at just +0.1% as was the y/y reading although it held steady at +2.8%.
U of Michigan consumer sentiment survey came in consistent with the flash survey showing a decline in future expectations but a big jump in current conditions in part on a jump in durable goods buying intentions to front-run tariffs.
Link to posts - Neil Sethi (@neilksethi) / X (twitter.com) for more details.
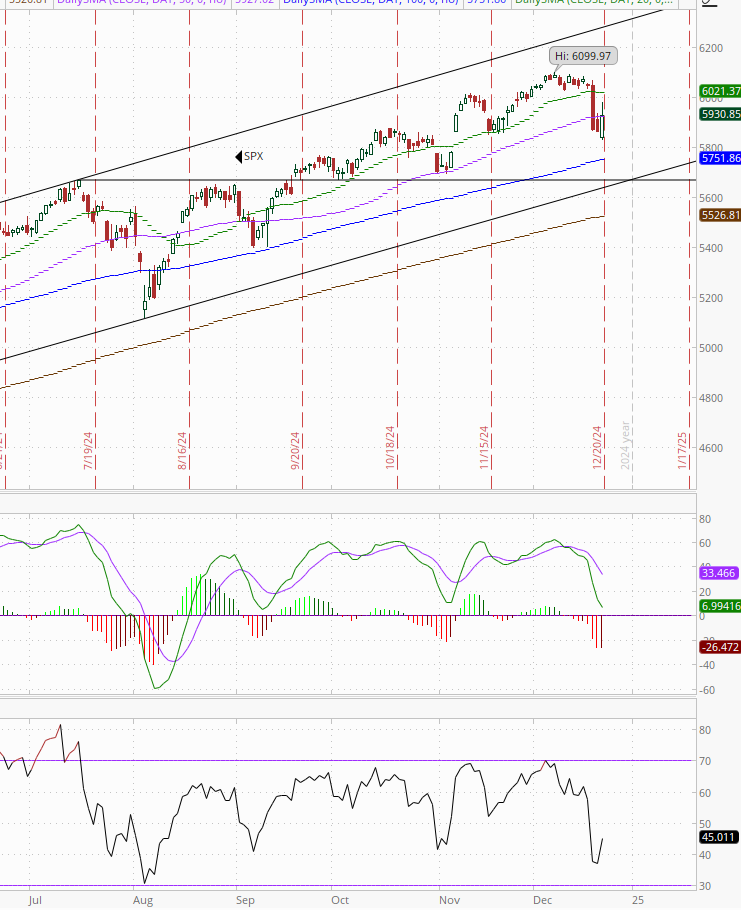
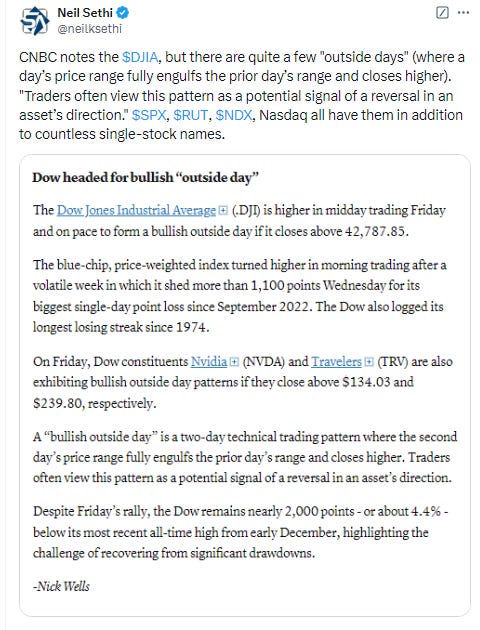
The SPX rallied again over the 50-DMA Fri, and while it again fell under, this time it kept more of the gains creating an “outside day” as described below. Still, it’s in precarious positioning below and the MACD & RSI remain weak.
The Nasdaq Composite for its part was able to close just above the 20-DMA and bottom of its uptrend channel Fri. Its daily MACD remains fairly negative, but its RSI is neutral.
RUT (Russell 2000) was just able to recover its 100-DMA Friday but not the uptrend line from the Aug low. Daily MACD & RSI remain very weak.
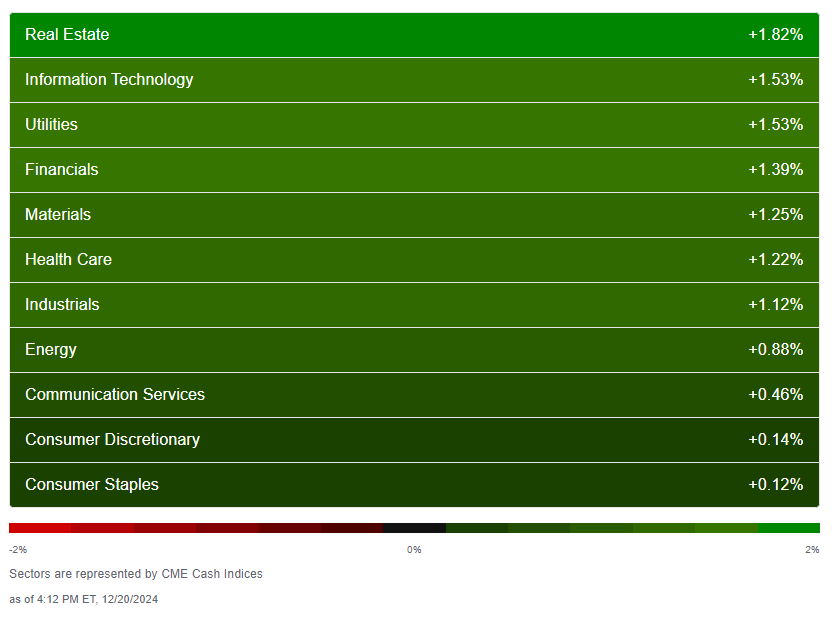
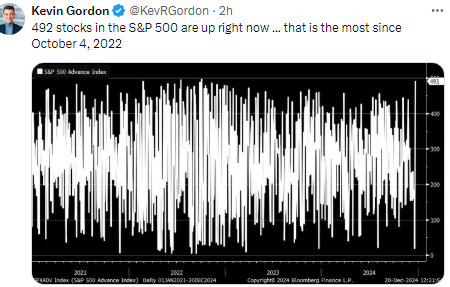
Equity sector breadth from CME Indices very good with every sector finishing higher and seven finishing up over 1%. Good mix of sectors too, with no particular style dominating. Megacap growth lagged a bit taking 2 of the bottom 3 spots.
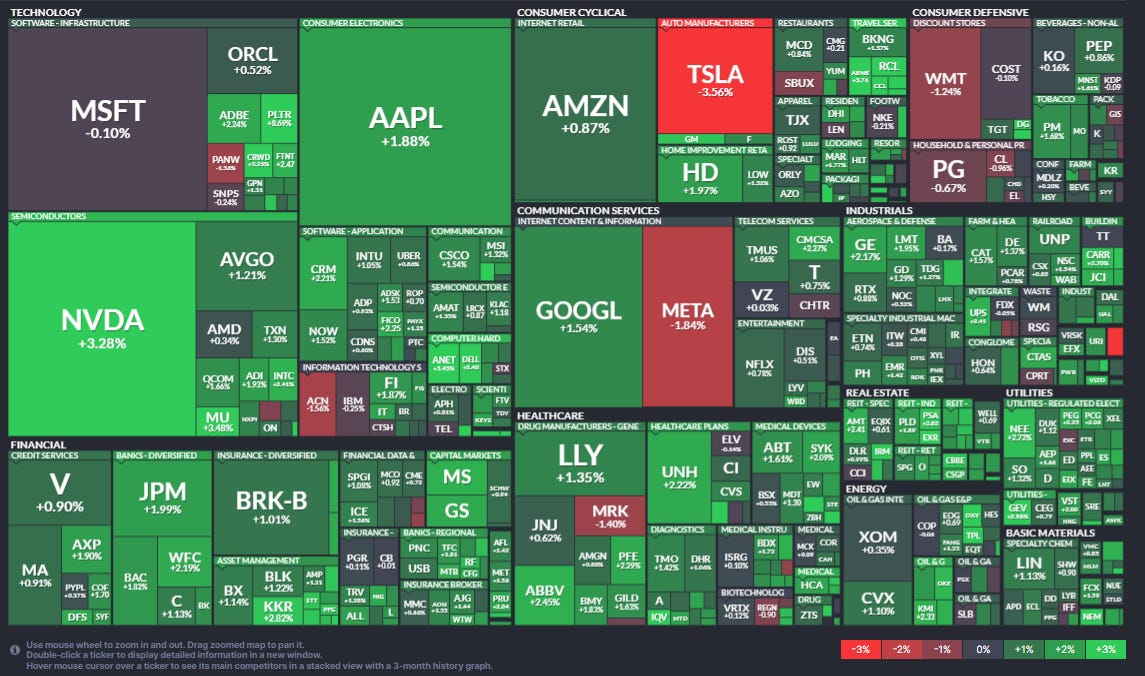
Stock-by-stock SPX chart from Finviz relatively consistent with lots of green. TSLA a notable decliner.
Positive volume (the percent of volume traded in stocks that were up for the day) much better Friday but finished well off its best levels of the session on both exchanges with the NYSE coming in at 82% (it was over 90% at one point, but still a lot better than the previous 8 sessions when it couldn’t crack 50%), while Nasdaq was 79%. Positive issues (percent of stocks trading higher for the day) remained weaker at 73 & 66% respectively.
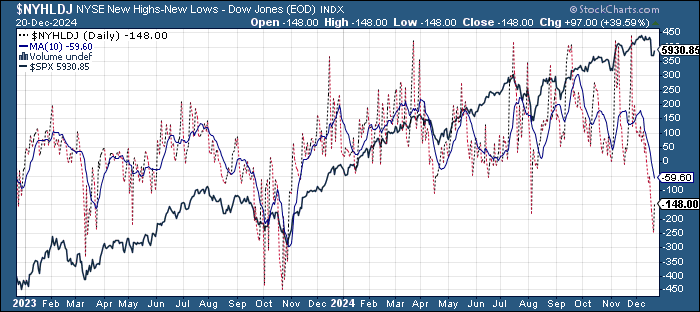
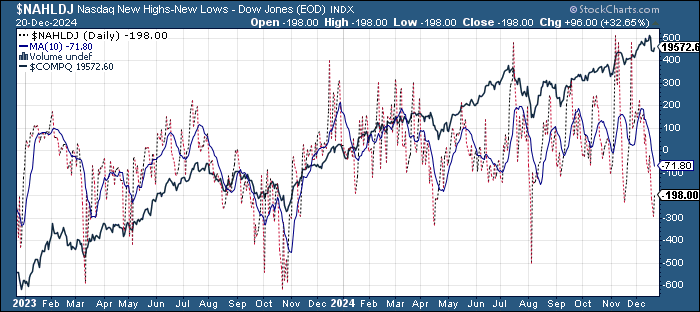
New highs-new lows also improved but both remained solidly negative with the NYSE at -146 from -245 Thurs (the weakest since Aug and 2nd weakest since Oct ‘23), while the Nasdaq moved to -197 from -297 (the least since Aug (& 2nd least since April). Both remain well below the respective 10-DMAs which are heading sharply lower (more bearish) w/the NYSE the least since Nov ‘23.
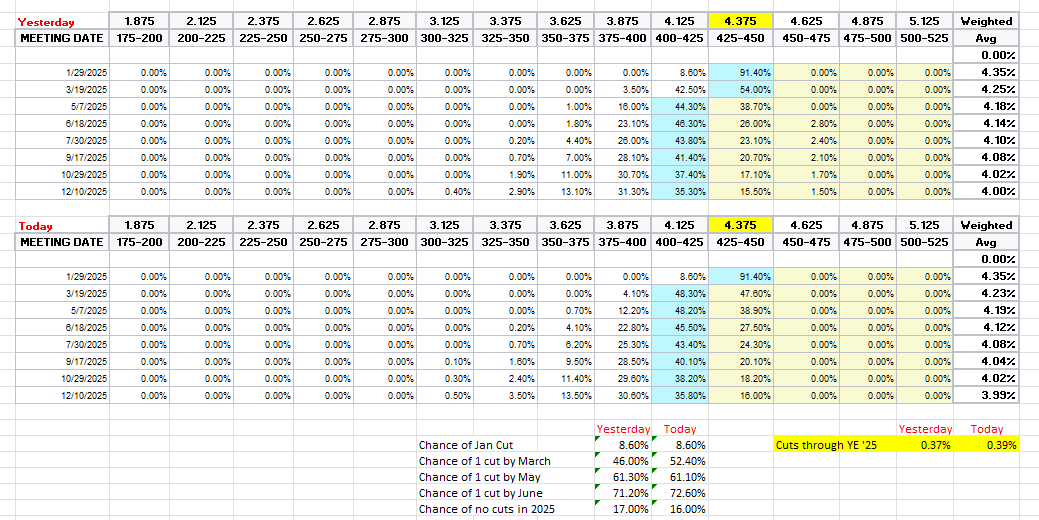
FOMC rate cut probabilities from CME’s #Fedwatch tool moved further dovish (more cuts) from the aggressive shifting following the Fed meeting but firmed some after the noted Fed speakers. Overall, 2025 cut expectations increased to 39bps so around a 50/50 chance for two cuts, fewer than even the more aggressive dot plot which has a full two. The one cut is now priced in March (53%). This overall still seems quite aggressive to me, and I continue to expect at least two cuts, but I guess you never know, and we do have that pesky residual seasonality in 1Q inflation (inflation has tended to increase in 1Q the past few years) that may see the first cut pushed off to the summer.
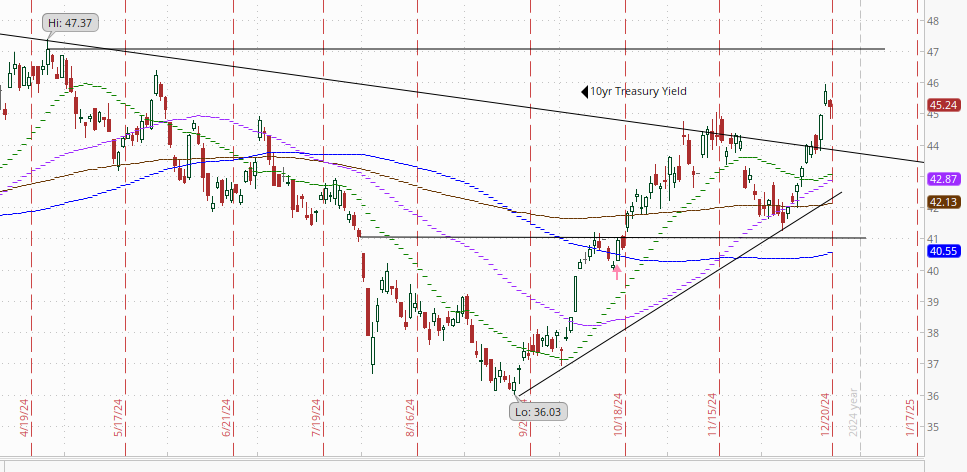
Treasury yields eased back on the long end Friday with the 10yr down -5bps, but still over 4.5% at 4.52%, just off the highest close since May and still up +14bps since the FOMC meeting (& +40bps from the low two weeks ago when it bounced off what is now a decent uptrend line), still eyeing the 4.7% level. The 2yr yield, more sensitive to Fed policy, remained at 4.32%.
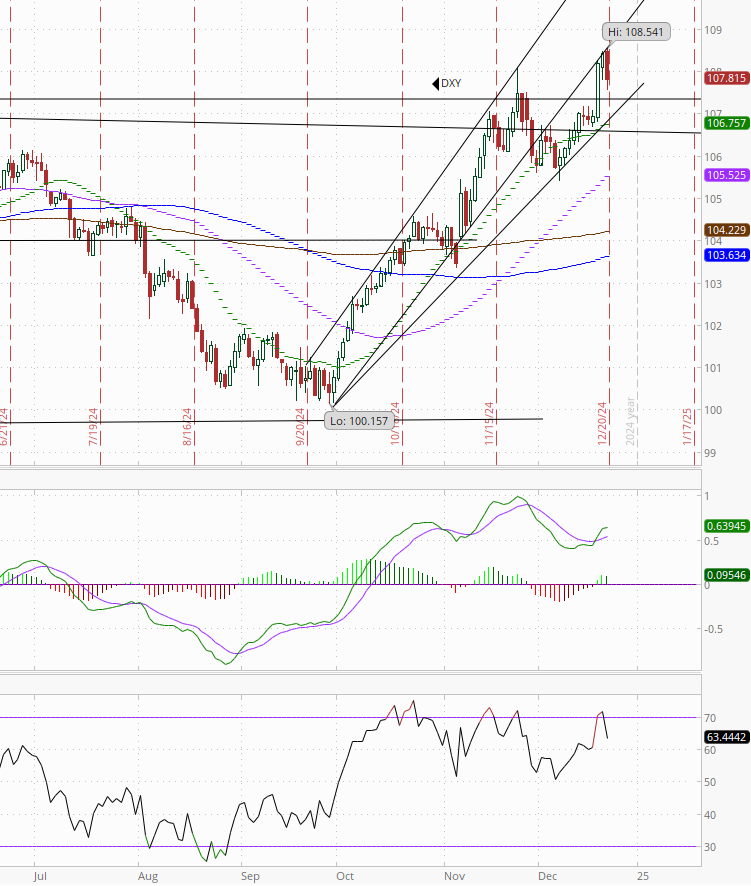
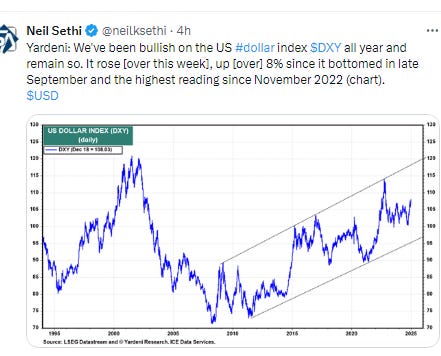
Dollar ($DXY) fell back from 2yr highs, its worst day of the month, but still finishing up for a 3rd week (& 10th in 11). Daily MACD and RSI remain positive.
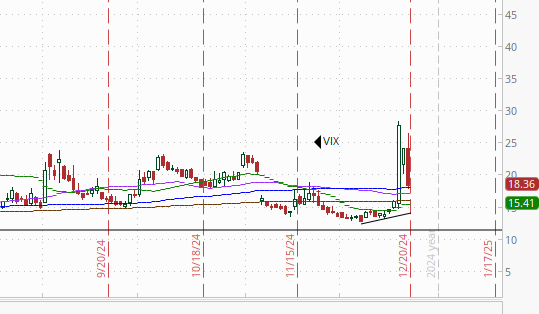
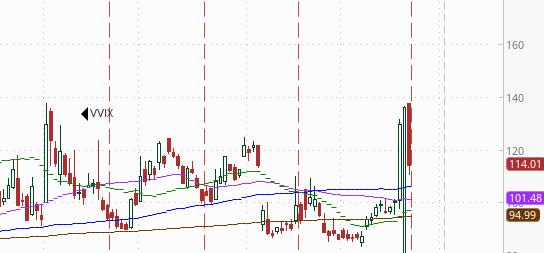
The VIX started the day higher but fell sharply later in the day now down to a more pedestrian (but still elevated) 18.4 (consistent w/1.16% daily moves over the next 30 days), and the VVIX (VIX of the VIX) fell back from its highest close since August but remains over 100 at 114 (consistent with “elevated” volatility and daily moves in the VIX over the next 30 days (normal is 80-100)).
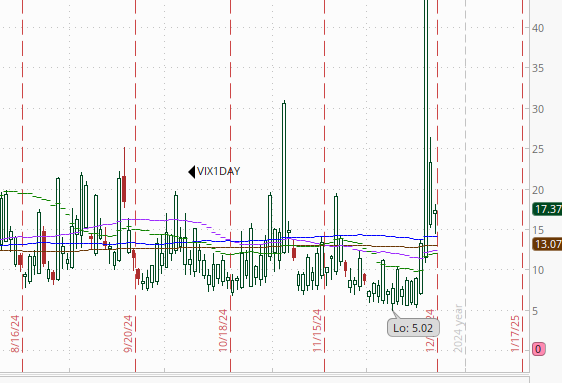
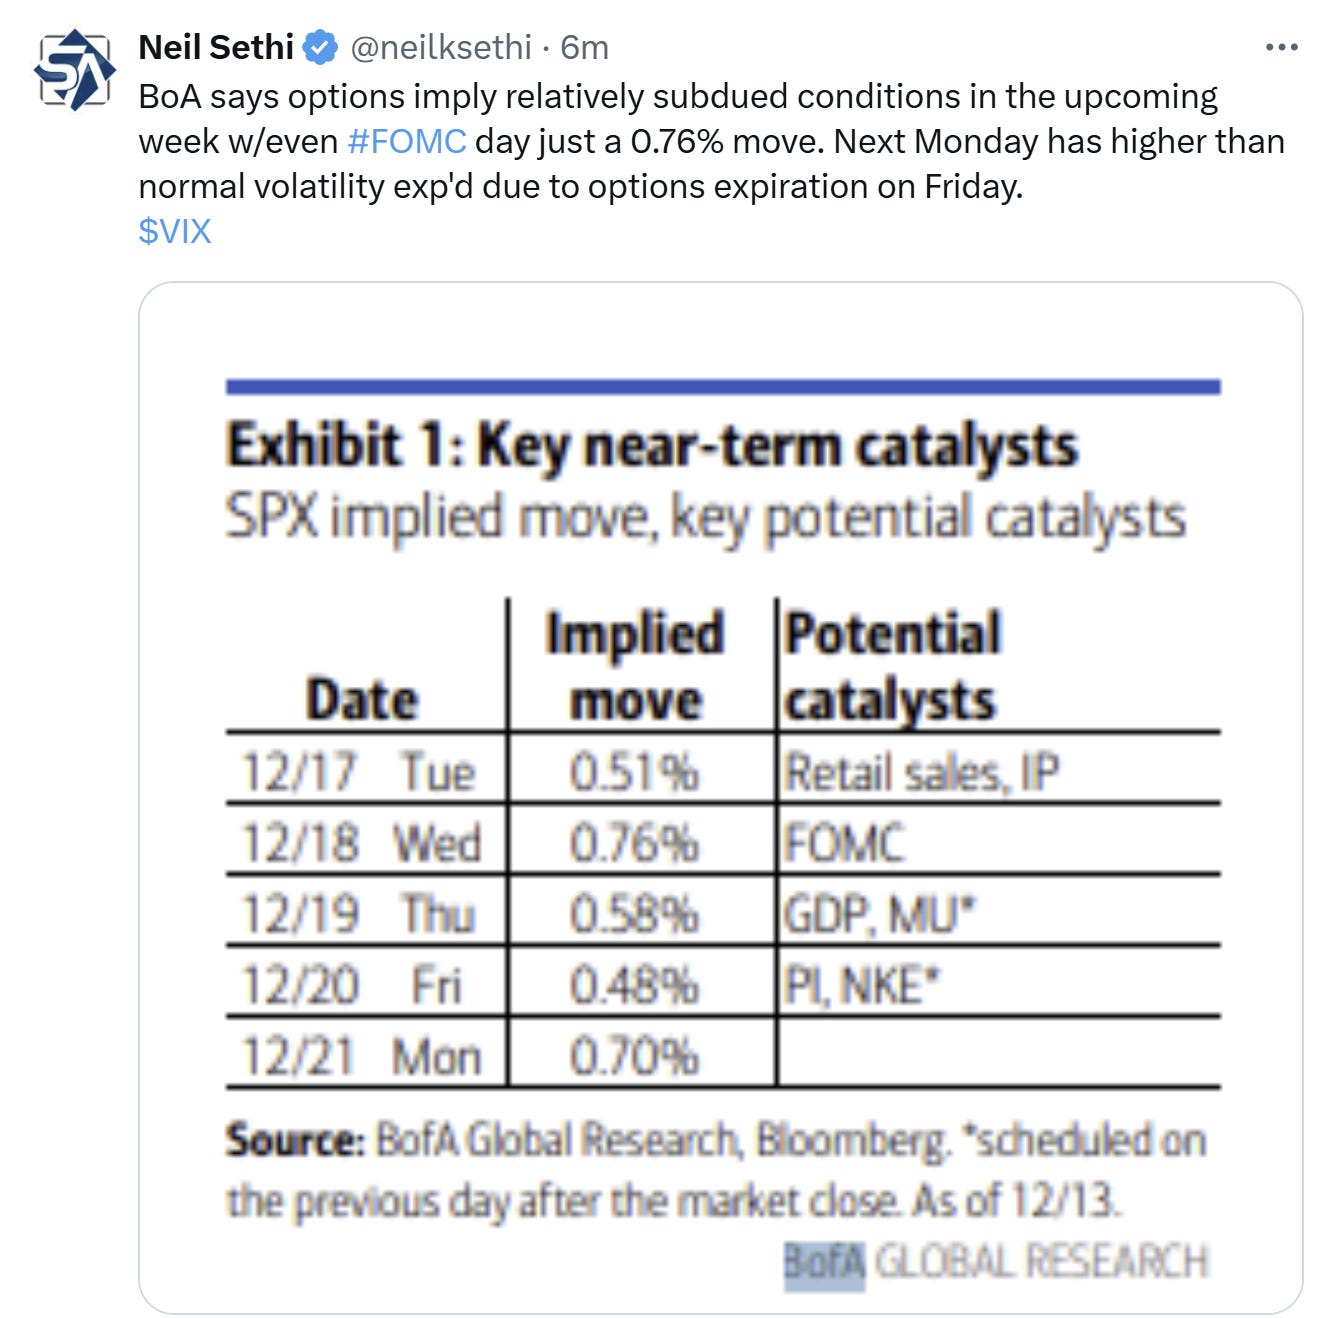
1-Day VIX also fell back after closing Wed at an ATH (since inception in April ‘23) now down to 17.4, still looking for a move of 1.10% Fri. BoA said 0.7% was implied by options coming into the week (due to the large gamma expiration Friday from the options expiration which I’ll talk about more this weekend).
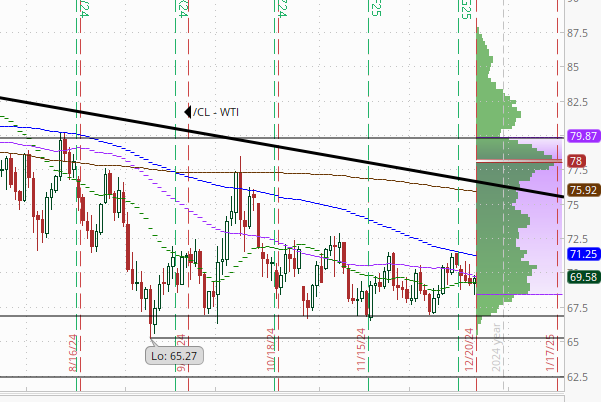
WTI broke its 4-day losing streak (barely) Friday but still settled lower for the week leaving it in the middle of its range since mid-Aug. Daily MACD & RSI tilt positive though. Needs to get over the 100-DMA which seems to have become resistance since August and the $72 level.
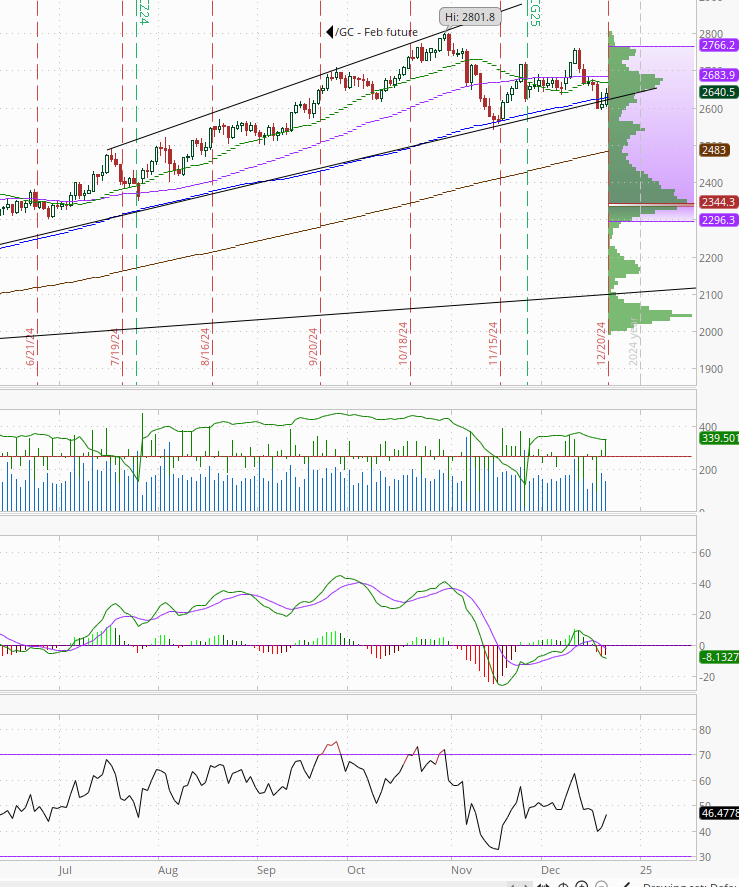
Gold able to sustain its rally better Friday getting back over its 100-DMA & uptrend line from Feb. Its MACD and RSI are negative for now though.
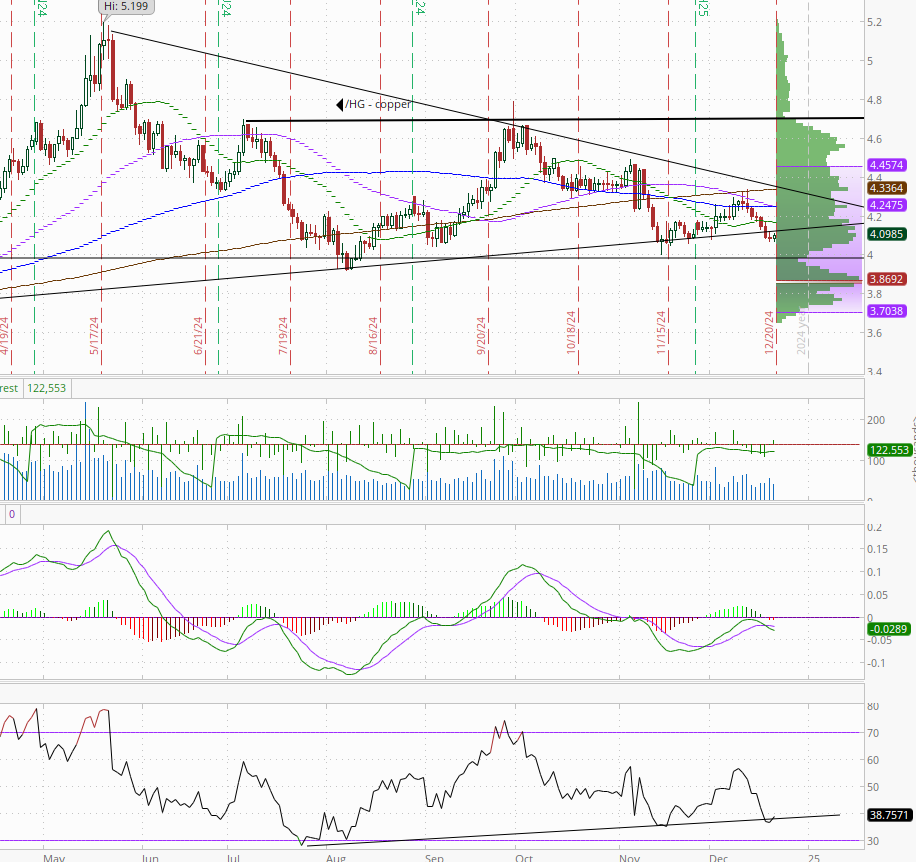
Copper (/HG) unlike gold couldn’t get back over support turned resistance Friday (in the form of the uptrend line running back to Oct ‘23) although did manage a modestly positive session after falling in 6 of the previous 7. Its RSI and MACD are negative though.
Nat gas (/NG) up another 3% today, now up ~15% the past 4 sessions and the highest since Jan ‘23. Daily MACD and RSI are positive w/the RSI starting to break out of a negative divergence.
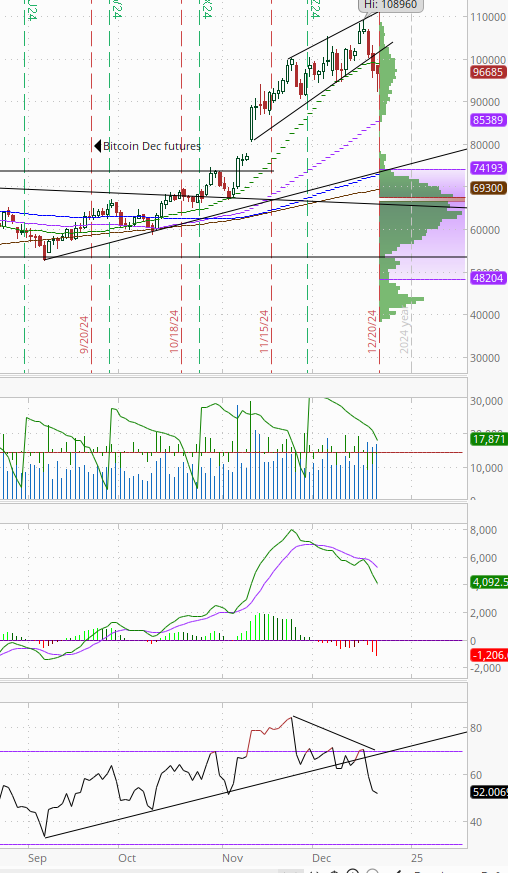
Bitcoin futures rallied after falling to the lows of the month Friday ending little changed, but still below its 20-DMA and uptrend channel from Nov 11th. The daily MACD remains very weak and the the RSI is the weakest since early November.
The Day Ahead
It’s been an unusually busy and volatile December. Between the light calendar, vacations, and holidays, hopefully we continue today’s gains and get back to business as usual next week.
Link to X posts - Neil Sethi (@neilksethi) / X (twitter.com)
To subscribe to these summaries, click below (it’s free!).
To invite others to check it out,


