
Markets Update - 12/23/25
Update on US equity and bond markets, US economic data, the Fed, and select commodities with charts!

To subscribe to these summaries, click below (it’s free!).
To invite others to check it out (sharing is caring!),
Link to posts - Neil Sethi (@neilksethi) / X
Note: links are to outside sources like Bloomberg, CNBC, etc., unless it specifically says they’re to the blog. Also please note that I do often add to or tweak items after first publishing, so it’s always safest to read it from the website where it will have any updates.
Finally, if you see an error (a chart or text wasn’t updated, etc.), PLEASE put a note in the comments section so I can fix it.

NOTE: GIVEN IT’S ONLY A HALF SESSION WED WITH NOT MUCH GOING ON, I WON’T BE DOING AN UPDATE BUT WILL DO ONE FRIDAY. HAVE A WONDERFUL HOLIDAY.
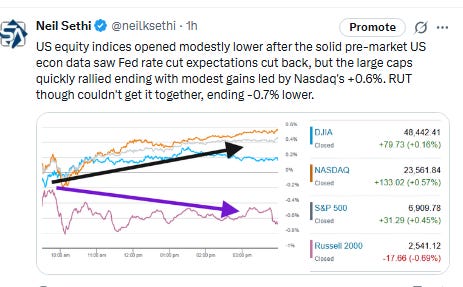
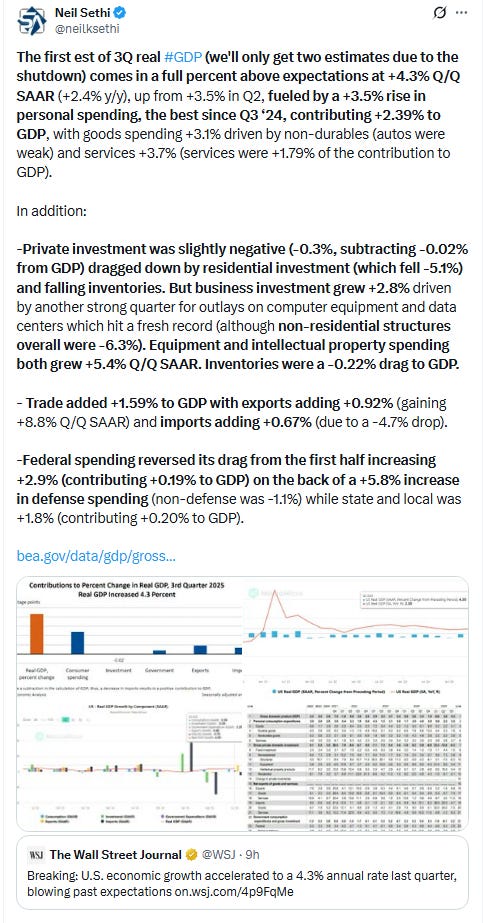
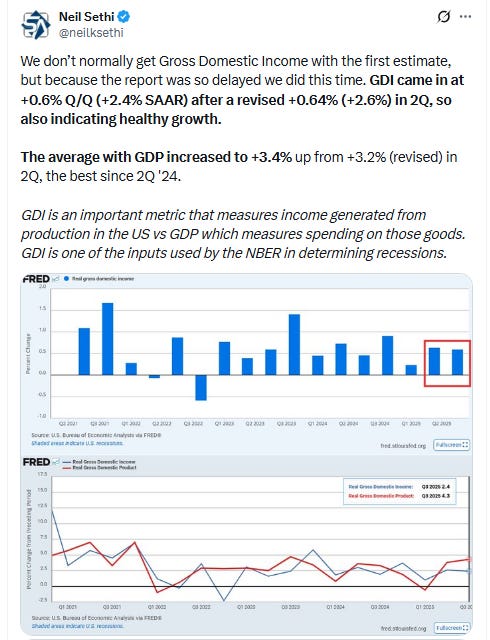
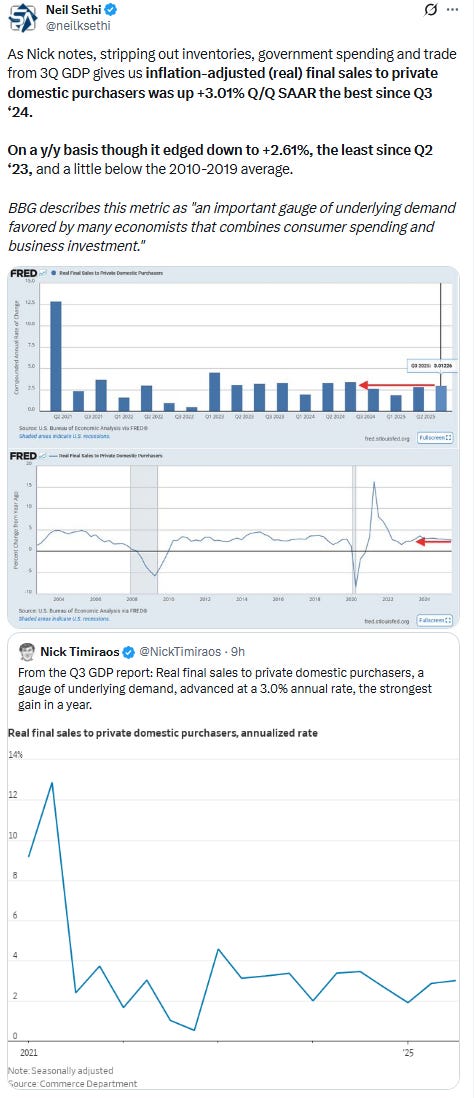
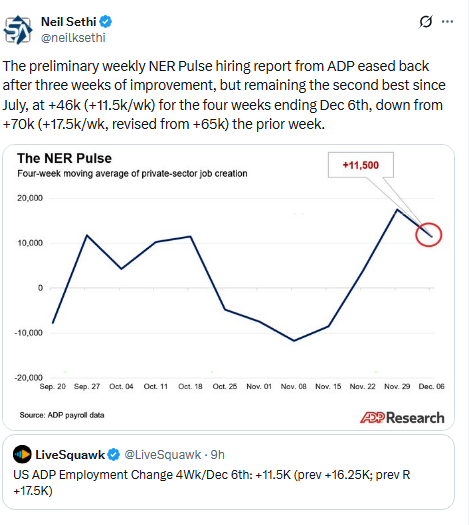
US equity indices opened modestly lower following a stronger than expected Q3 GDP reading fueled by consumption, trade, and AI spending, which along with better than expected core capital goods (Oct) and industrial production (Nov) readouts and an ADP job growth update that remained at the second best level since July, led to Fed rate cut expectations falling back initially pressuring stocks.
Large cap indices though quickly rallied on the back of the largest stocks even as most of the rest of the market lagged (more below). The Nasdaq/SPX/DJIA ended with modest gains led by Nasdaq's +0.6% and the SPX hitting a record high. RUT though couldn't get it together, ending -0.7% lower, and the SPX equal-weighted index was -0.25%.
Elsewhere, bond yields rose a bit at the short end with the Fed rate cuts falling, but the dollar fell back to the least since early Oct. Also lower was bitcoin, while gold (to another record), crude, copper, and natgas all saw solid advances.
The market-cap weighted S&P 500 (SPX) was +0.5%, the equal weighted S&P 500 index (SPXEW) -0.25%, Nasdaq Composite +0.6% (and the top 100 Nasdaq stocks (NDX) +0.5%), the SOXX semiconductor index +0.6%, and the Russell 2000 (RUT) -0.7%.
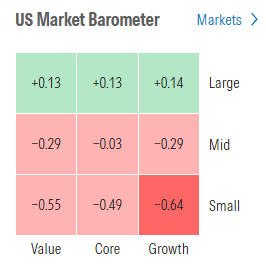
Morningstar style box showed the clear preference for larger shares Tuesday.
Market commentary:
“If the economy keeps producing at this level, then there isn’t as much need to worry about a slowing economy and concerns may actually flip back to the price-stability constraint,” said Chris Zaccarelli at Northlight Asset Management.
The latest GDP reading vindicates the astounding rebound in stocks since the April lows, as the US economy has remained remarkably resilient in the face of meaningful changes to trade policy, according Michael Reynolds at Glenmede.
“As attention shifts to the year ahead, the outlook for US economic growth appears bright,” he said. “The combined effects of tariff policy, fiscal stimulus, shifts in the labor market, AI-related productivity, and the potential for deregulation point to above trend prospects in 2026.”
The third-quarter GDP report showed solid growth for the U.S. economy. Although stock futures dipped immediately following the report, Bret Kenwell, U.S. investment analyst at eToro, said the report gave investors reasons to be optimistic about the economy. “For the second straight quarter, U.S. GDP came in well ahead of economists’ expectations, reaffirming the resilience of the consumer and the economy. While worries surrounding the jobs market, tariffs, and inflation continue to swirl, the economy continues to defy its doubters by chugging higher,” Kenwell wrote in an email. Kenwell noted that official economic data have been sparse over the past few months due to the government shutdown. But in their absence, strong corporate earnings implied that the economy was doing well. “Earnings have continued to surprise to the upside and have been a major contributor to this year’s rally. Bulls are hoping to see this trend continue in 2026 as investors look for further upside,” he said.
Stock investors are “trying to decipher what a strong GDP report combined with a weak hiring environment means for monetary policy,” said Scott Wren, senior global market strategist at Wells Fargo Investment Institute. In an email, he added: “We believe the next 12 months will favor U.S. equities, based on our expectations for higher US GDP, broadening & accelerating earnings growth, moderating inflation and improved global growth.
“We may not see the market back out of those two rate cuts right now,” said Eric Sterner, chief investment officer at Apollon Wealth Management. “The odds of a rate cut early in the year are probably lower, but we’re soon going to find out who’s Trump’s nomination for the new Fed chair, and it’s almost certainly going to be someone who’s a bit more dovish than Powell.
“There’s going to be more bumps in this road, but there’s also good reason to believe the trends driving the economy — AI investment and high-end consumer spending — will continue in 2026, and that the market can continue to follow earnings growth to the upside,” said Daniel Skelly, head of Morgan Stanley’s Wealth Management Market Research & Strategy Team.
Paul Stanley, the chief investment officer of Granite Bay Wealth Management, says that the “Santa” rally is caused by a combination of low volume and lack of bad news. He said that those two things should keep the rally in play for the end of 2025. “The stock market is finally starting to eke out some gains for December after a choppy few weeks, and just in time for the market’s Santa Claus rally, which we expect to take place in its typical format via the last several trading days of the year,” Stanley wrote in an email.
“Volatility is sitting at the lows of the year, while credit spreads are among the most compressed we’ve seen in decades,” said Alberto Tocchio, portfolio manager at Kairos Partners. “That dynamic is helping sustain the current market bonanza, especially in an environment where trading volumes are falling sharply and many discretionary players are already on the sidelines.”
“Even though tech stocks have been volatile in recent months, there is little reason to doubt tech’s staying power and leadership in this market, especially for 2026,” said Paul Stanley at Granite Bay Wealth Management. Valuations in tech are high, Stanley noted, but some “Magnificent Seven” names have actually underperformed the S&P 500 this year. That suggests that there is still more room to run and that not all tech stocks are trading at runaway or complacent valuations, he said.
“Equity markets seem to be entering a lackluster period until year end,“ said Roberto Scholtes, head of strategy at Singular Bank. “Given the uneven performance by sectors and stocks this year, there might be some rotation from big gainers to laggards that could continue in the first days of January.”
“This market is still rather healthy. Valuations are not high enough at this level. We don’t see the frothiness that we saw back then, and the commercial aspect is so much better now than it was in the late ’90s,” Chris Harvey, head of equity and portfolio strategy at CIBC Capital Markets said on CNBC’s “Closing Bell,” comparing the hype around AI stocks to the froth of the dot-com bubble. Harvey noted that unlike the internet investment craze of the late 1990s, financials have led the market higher in recent weeks as investors have rotated into cyclical areas of the market. JPMorgan Chase shares have also outperformed a sizable portion of tech names over the past three and five years, Harvey pointed out.
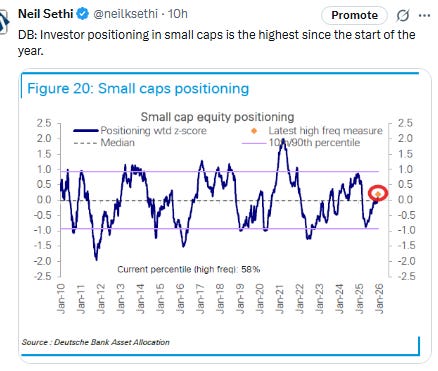
The market has started to become less concentrated, which is a good sign, according to Adrian Helfert, Westwood’s chief investment officer of multi-asset strategies. “The narrow leadership of 2025 needs to broaden for the rally to sustain. The good news is we’re seeing signs of that broadening—small caps rallied hard, all sectors participated in Q3, and international markets are coming to life,” Helfert wrote in a note. Helfert said there is a scenario in which stocks continue to grind higher, but he also noted that policy uncertainty remains a risk worth keeping an eye on.
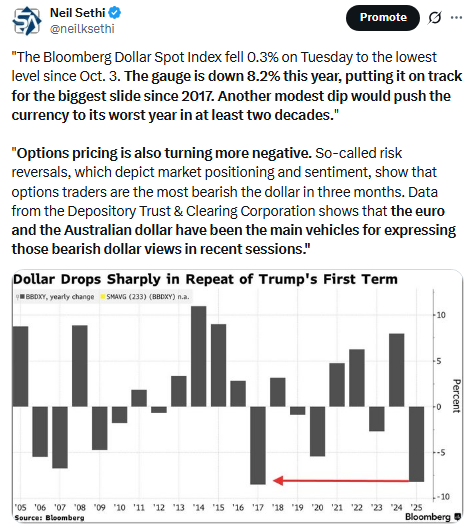
“The structural drivers of US dollar weakness remain intact,” wrote Patrick Brenner, chief investment officer of multi-asset at Schroders Plc. “Institutional credibility continues to erode, fiscal deficits are widening, and global reserve managers remain steady buyers of gold rather than US dollar assets.”

Link to X posts - Neil Sethi (@neilksethi) / X for full posts/access to charts.
In individual stock action:
Gains in tech giants Nvidia and Broadcom, which rose around 3% and more than 2%, respectively, lifted the index.
Corporate Highlights from BBG:
US airlines expect to ferry a record number of passengers over the holidays after a year in which economic uncertainty and a government shutdown have whipsawed travel demand.
ServiceNow Inc. has reached a deal to buy the cybersecurity startup Armis in a deal valued at $7.75 billion, representing its largest acquisition to date.
A patient died after receiving Pfizer Inc.’s drug for hemophilia, marking another setback for the company in the treatment of blood disorders.
Johnson & Johnson was ordered to pay about $1.56 billion to a Maryland woman who blamed the company’s talc-based baby powder for causing her asbestos-linked cancer, the largest such jury verdict for an individual in 15 years of litigation.
Novo Nordisk A/S won approval to sell a pill version of its blockbuster obesity shot Wegovy in the US, a crucial step in its effort to defend its market share from rival Eli Lilly & Co.
Ford Motor Co. cut back its EV plans last week in a major announcement, but it simultaneously placed a big bet on a new business line: producing batteries for energy storage.
Equinor ASA and Orsted A/S said they are engaging with US authorities over security concerns tied to their offshore wind projects, after the Trump administration issued another round of work suspension orders.
Orsted A/S agreed to sell a majority stake in a Taiwanese wind farm to local firm Cathay as it presses ahead with plans to repair its balance sheet.
Saks Global Enterprises, facing limited options ahead of a more than $100 million debt payment due at the end of this month, is considering Chapter 11 bankruptcy as a last resort, according to people with knowledge of the situation.
Ryanair Holdings Plc was fined nearly €256 million ($302 million) by Italy’s antitrust watchdog for allegedly using an “abusive strategy” to thwart customers who booked through travel agencies.
Samsung Electronics Co.-owned Harman International is buying a key driver-assistance business from Germany’s ZF Group for €1.5 billion ($1.8 billion), as financial stress across Europe’s auto-supplier sector forces companies to rethink their portfolios.
S&P Global Ratings downgraded China Vanke Co. to selective default on Tuesday, labeling the developer’s recent onshore bond extension as a distressed debt restructuring tantamount to a default.
Huawei Technologies Co.’s ultra-luxury Maextro S800 sedan is so popular in China nowadays, it’s outselling Porsche AG’s Panamera, Mercedes-Benz Group AG’s S-Class and all other vehicles with sticker prices of at least $100,000.
Japan’s Tokyo Electric Power Co. saw its shares jump on Tuesday, after local media reported the company plans to develop a data center near its nuclear power plant that’s due for a restart in Niigata prefecture.
Mid-day movers from CNBC:
In US economic data:

Link to posts for more details/access to charts (all free) - Neil Sethi (@neilksethi) / X
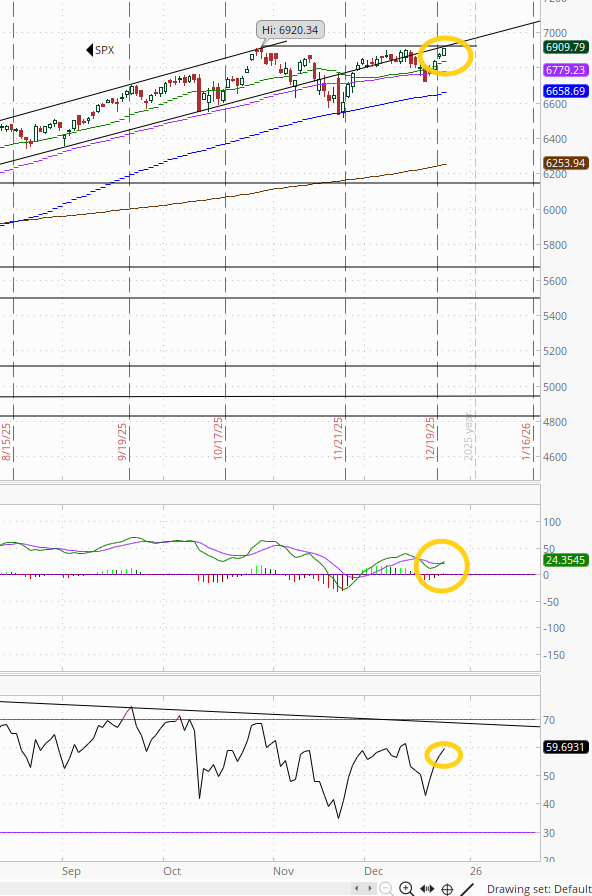
The SPX made further progress back towards its ATH and made a new closing ATH. The daily MACD has flipped back to “go long” positioning, while the RSI is over 50 but both with negative divergences (lower highs).
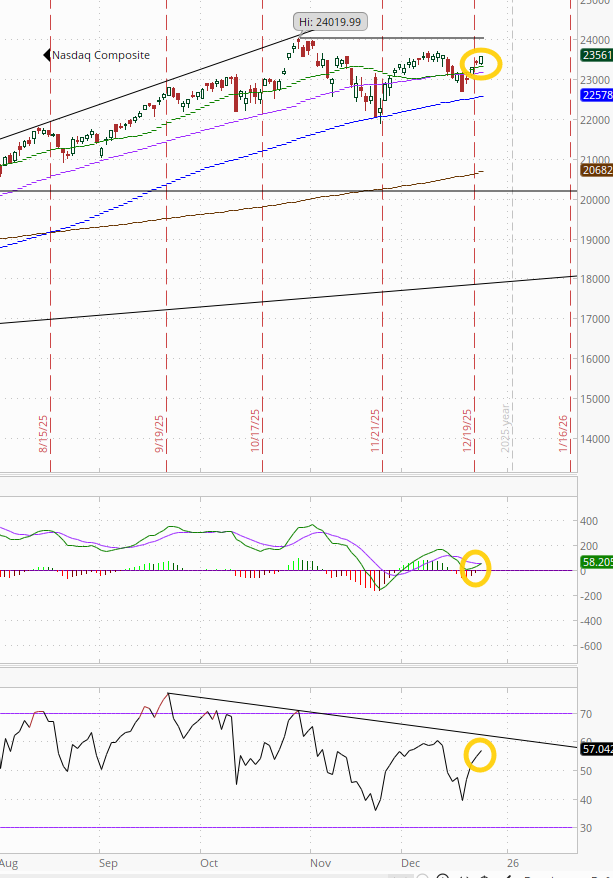
The Nasdaq Composite a similar story a little further from its ATH.
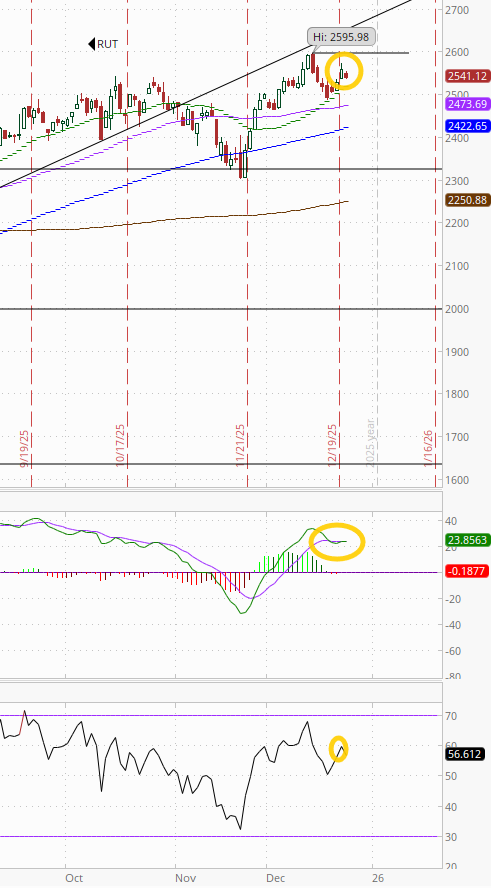
RUT (Russell 2000) went from the best to the worst technical picture of the three, but it’s still above both its 20 and 50-DMAs and not far from its ATH. As noted Thurs we did get a daily MACD crossover to “sell longs” but very mild for now. RSI remains over 50.
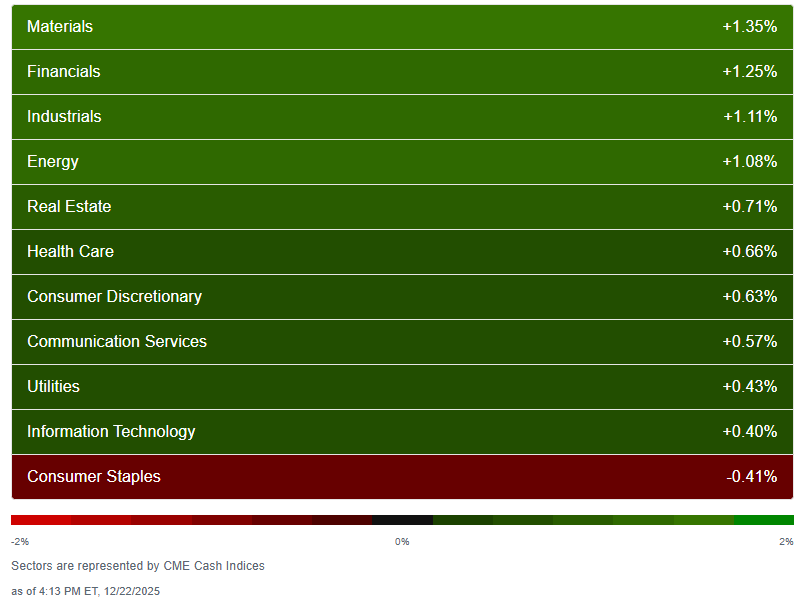
Sector breadth from CME Cash Indices (uses futures prices) deteriorated for the first time in six sessions falling back to 7 of 11 sectors higher, down from 10 Mon, but still the joint best otherwise in the past week (matching Friday).
After two days of lagging the megacap growth sectors got back in the lead (at least two of the three, the fifth day in six they’ve traded mostly as a group) with Comm Services and Tech up just under 1% (in contrast to Monday where it was four classic cyclicals which took the top 4 spots all up over +1%). Energy the only other sector up over +0.3%.
But losses were mild. Staples finished in last place for a second session (and down for the third session -0.4% (matching Mon, -0.5% Fri). No other sector down over -0.2%.
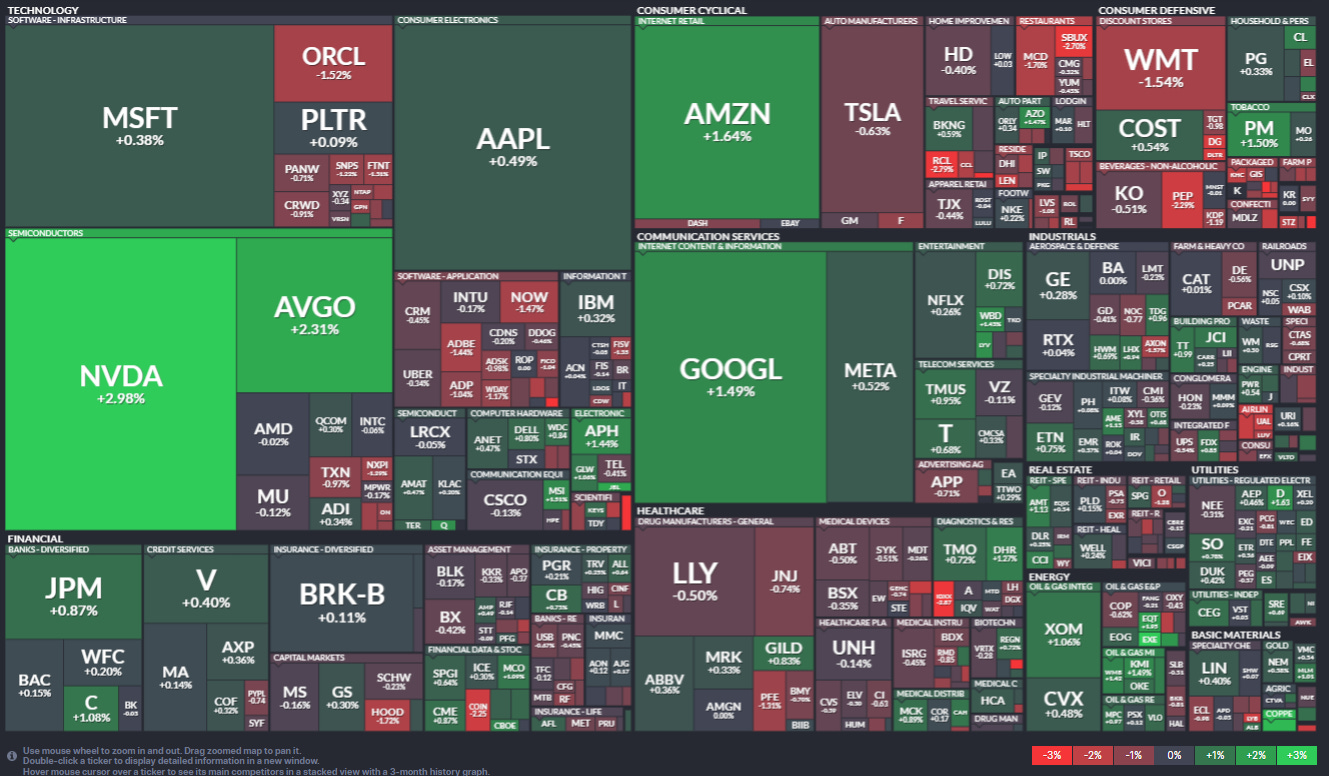
SPX stock-by-stock flag from @finviz_com definitely a lot more red than Monday outside of the largest names, even in the sector leaders.
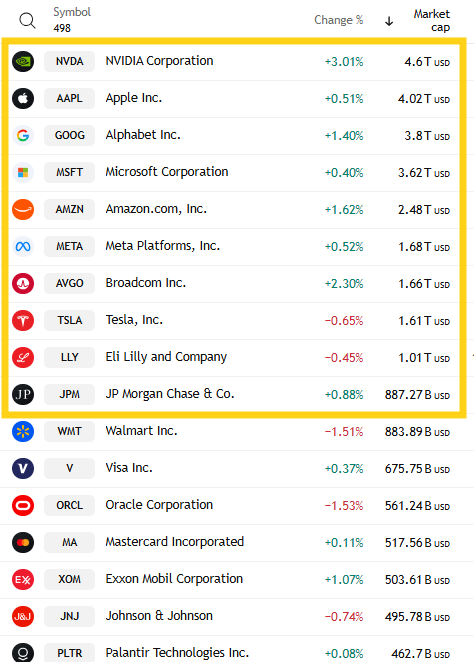
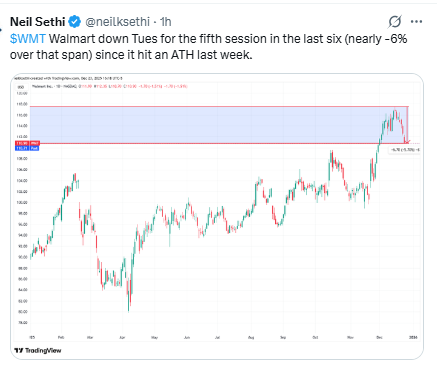
In that regard, just 2 of the top 10 by market cap were lower (down from 3 Mon/Fri but up from one Thurs, but down from nine Wed), led by Mon’s leader to the upside TSLA but just -0.7%. It would have been WMT -1.5%, but it fell out of the top 10 after its fifth down session in the last six (down nearly -6% over that span after it hit an ATH last week), replaced by JPM (who is up +8.5% the past 2 weeks).
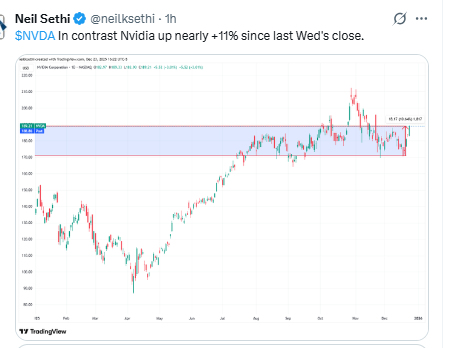
NVDA led to the upside +3.0%, after finishing second Mon, first Fri (it’s up nearly +11% since the close last Wed). Mag-7 was +0.9% on track for its 4th up week in the last 5.
Just 2 SPX components were up 3% or more, down from 17 Mon, 25 Fri, 22 Thurs, 8 Wed, 7 Tues, led by Expand Energy EXPE +3.1% (I don’t remember the last time there was a non-negligible gain on the SPX where the leading stock was up so little). The >$100bn in market cap up 3% or more was just NVDA.
5 SPX components down -3% or more, up from 3 Mon, 2 Fri, down from 9 Thurs, 28 Wed, led by Moderna MRNA -7.5%. For a third session though none >$100bn in market cap. The closest was PEP -2.3%.
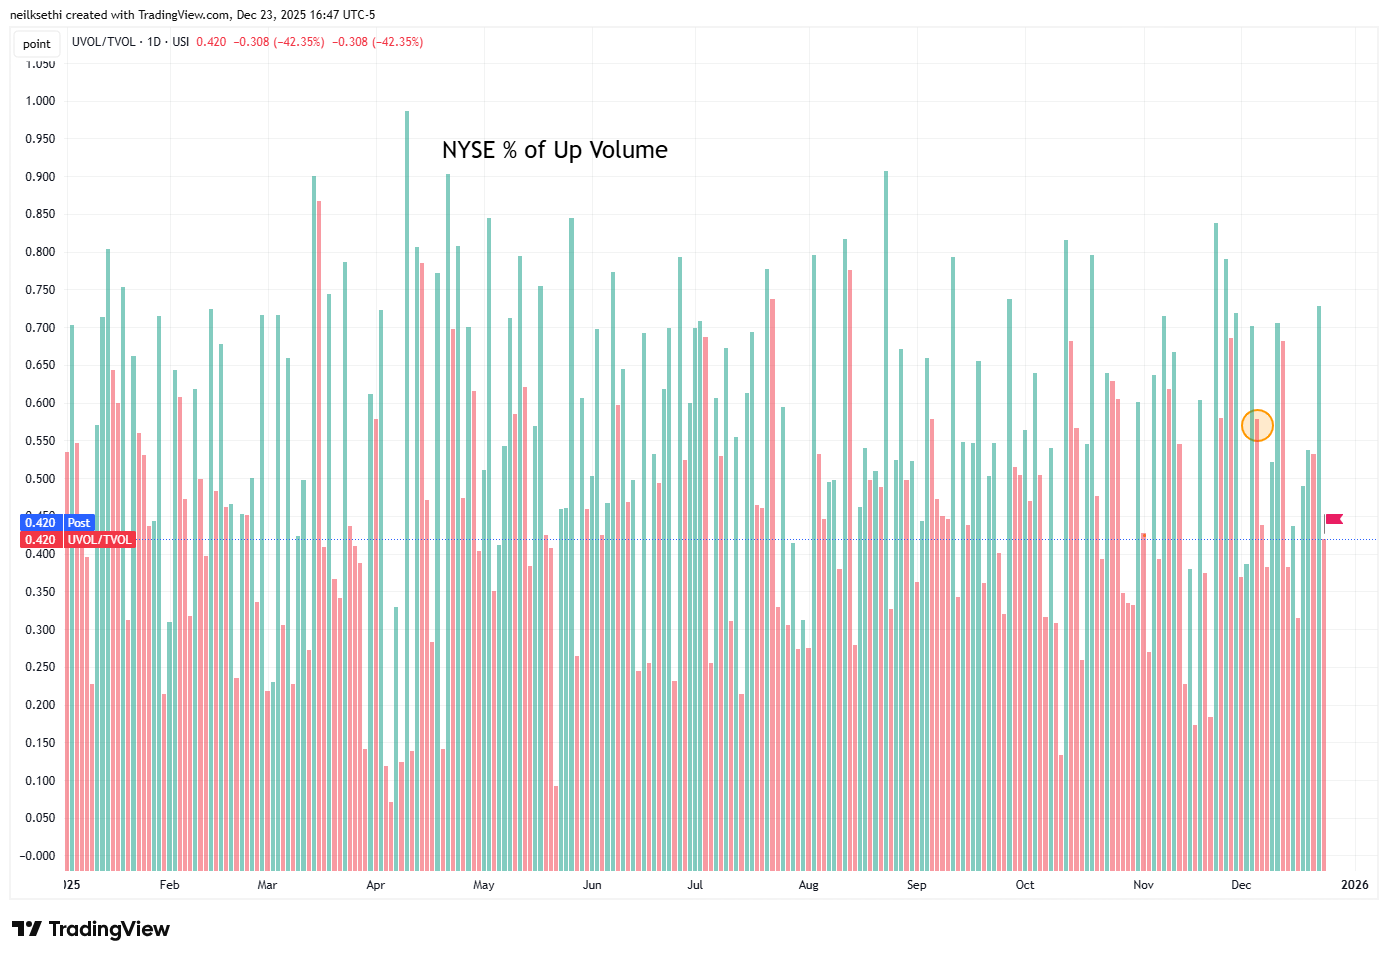
NYSE positive volume (percent of total volume that was in advancing stocks (these also use futures)) after seeing a big improvement Mon was back to weak at just 42.0% Tues despite an index gain of +0.18%.
We saw something similar last Monday. But compare that to Dec 4th when it was 57.8% with a +0.14% gain (circle).
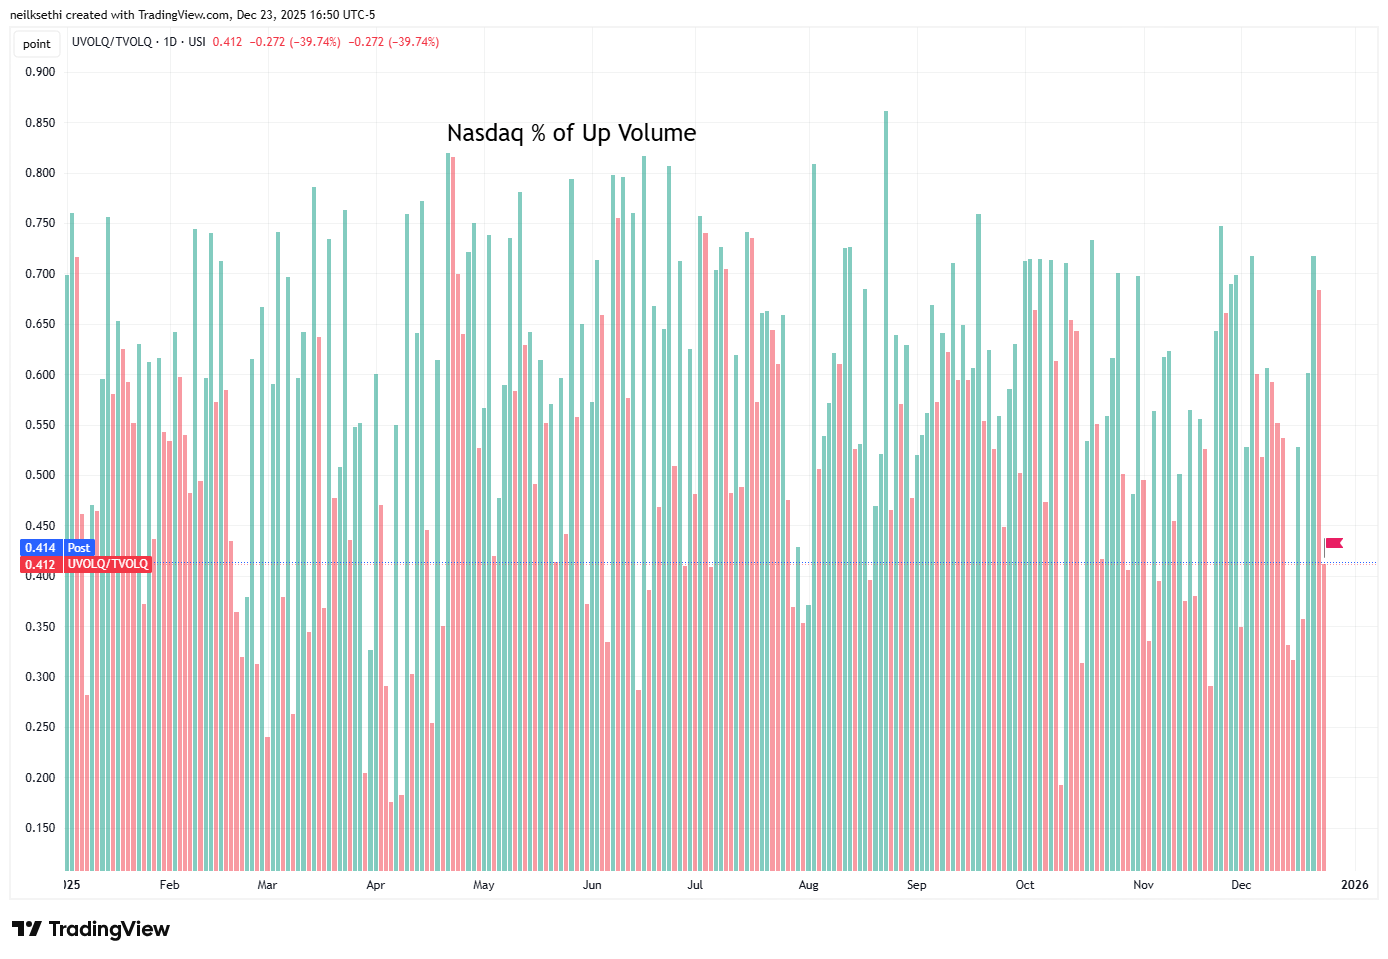
Nasdaq positive volume (% of total volume that was in advancing stocks) was even worse at just 41.2% despite the index gaining +0.57%. Compare that to Mon when it was 68.0%(!) on a +0.52% gain.
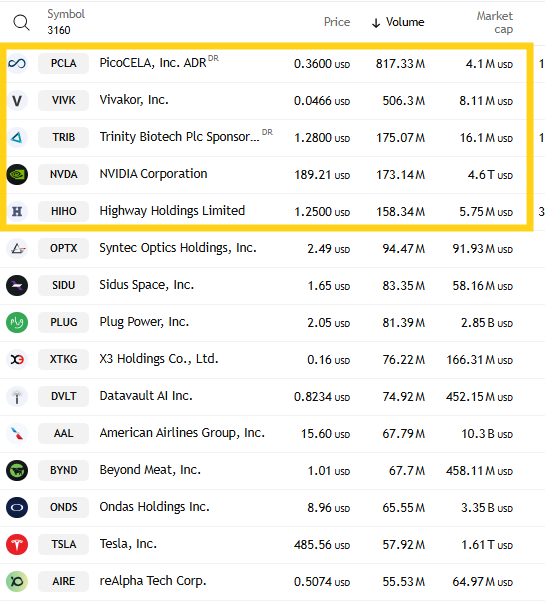
And that was even as speculative volume on the Nasdaq increased with the top three stocks back over 1bn shares traded at 1.5bn shares matching Fri, although again just 5 companies with over 100mn shares traded in contrast to the 17(!) Fri (the most since I’ve started tracking this early summer), but up from 4 Thurs.
Positive issues (percent of stocks trading higher for the day) which are not as inflated by penny/meme stocks a bit lower on both exchanges with the Nasdaq at 38% while the NYSE was 40%.
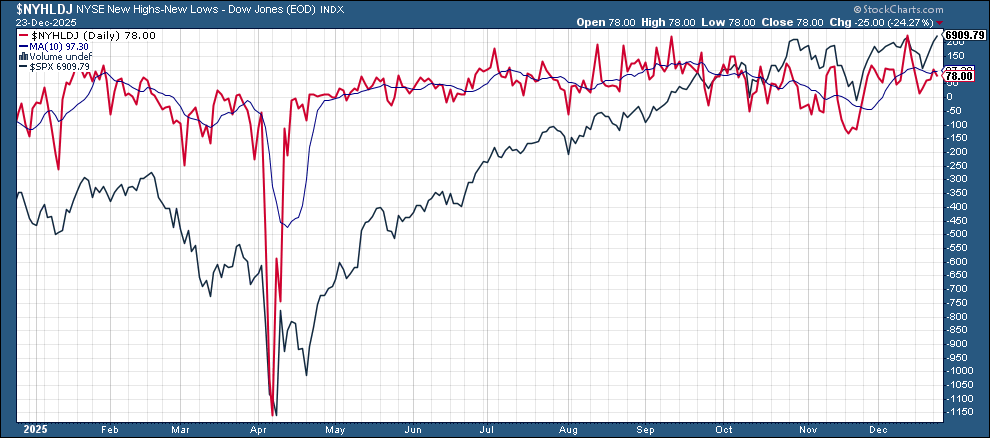
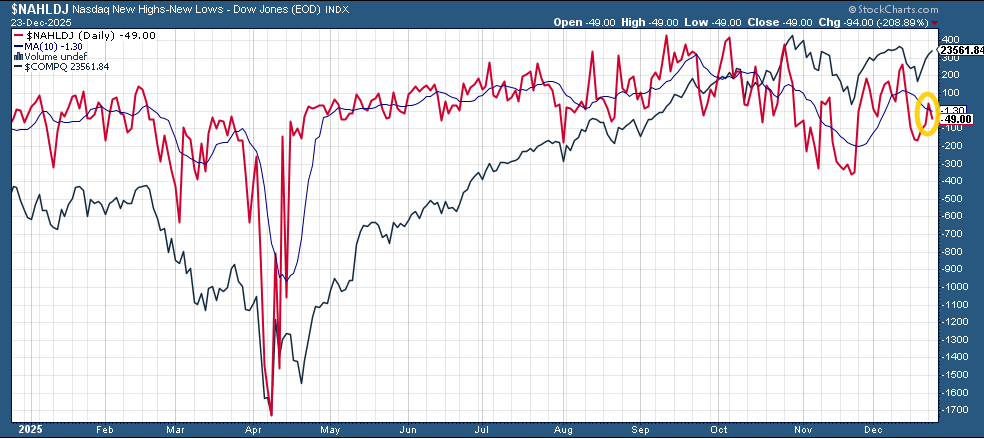
New 52-wk highs minus new 52-wk lows (red lines) also fell back despite the positive index gains to 78 from 104 on the NYSE, and -49 from 34 on the Nasdaq.
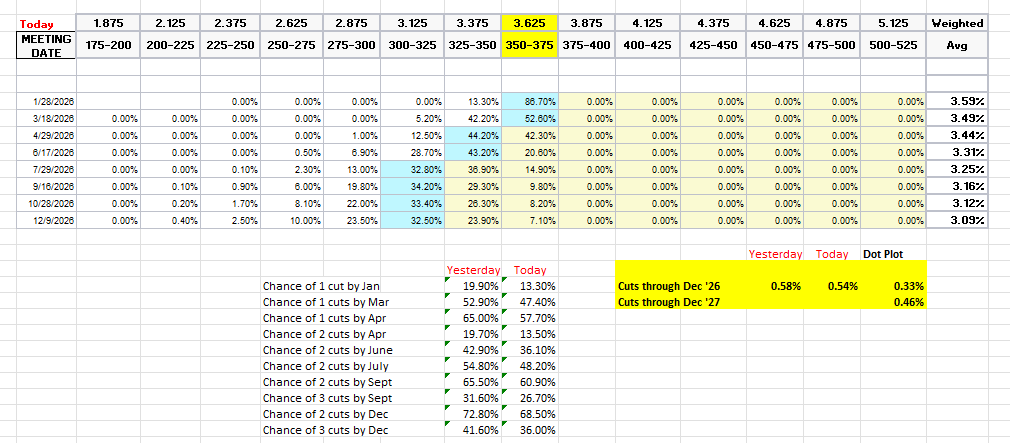
As noted at the top, #FOMC rate cut pricing from the CME’s Fedwatch tool fell to the least since before the Dec FOMC following the strong GDP, core capital goods, and industrial production data. A cut in Jan fell back to 13%, a cut by March to 47%, putting a first cut now into April 58%. A second cut is now pushed to Sept 61%.
Pricing for 2026 overall moved -4bps to 54bps, with pricing for two cuts 69% and three cuts 36% (down from 68bps Dec 3rd (and 80bps mid-Nov which was highest we’d been for 2026 cuts)).
The dot plot as reminder has just 33bps for the average dot for 2026.
Remember that these are the construct of probabilities. While some are bets on exactly one, two, etc., cuts some of it is bets on a lot of cuts (3+) or none (and may include a hike at some point).
The 10yr #UST yield though gave up early gains to finish unchanged at 4.17%. Still in its range over the past two weeks.

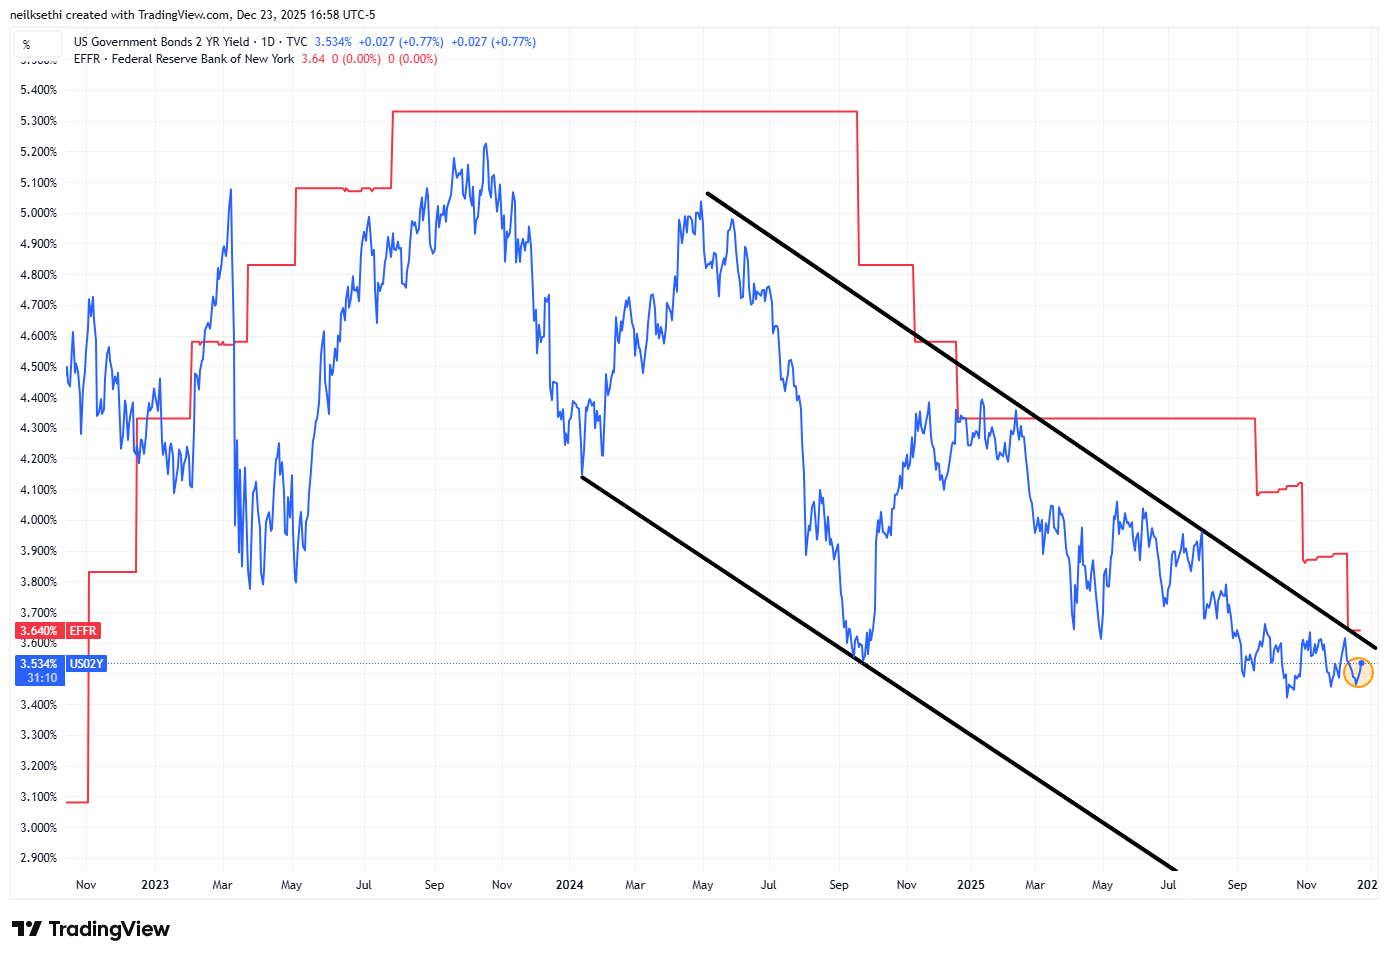
The 2yr yield, more sensitive to FOMC rate cut pricing, though +3bps to 3.54%. It remains in the channel it’s been in since the start of 2024, now 12bps above the least since 2022 and 9bps below the Fed Funds midpoint. Outside of recessions it is normally above by around 50bps on average, so still calling for a couple more rate cuts.
The Effective Fed Funds Rate (red line) remained at 3.64%.
This seems like a fairly rich yield at these levels unless we really aren’t going to get any more rate cuts (then it’s a bit expensive (i.e., yield should be higher)). That said I just don’t know that I want to buy 2-years at what is basically the 1-month yield.
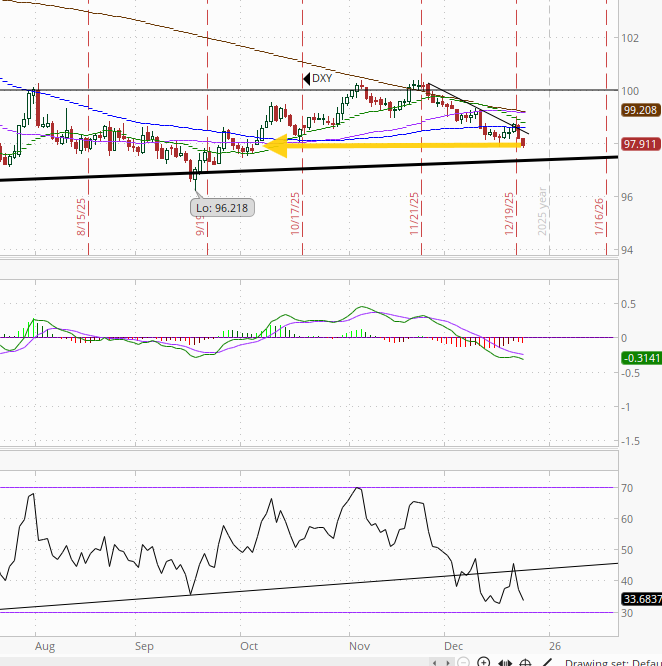
The $DXY dollar index (which as a reminder is very euro heavy (57%) and not trade weighted) fell back again now down to the lowest close since Oct 3rd. The daily MACD and RSI remain negative with the former in “go short” territory as noted two weeks ago, while the RSI is below 40.
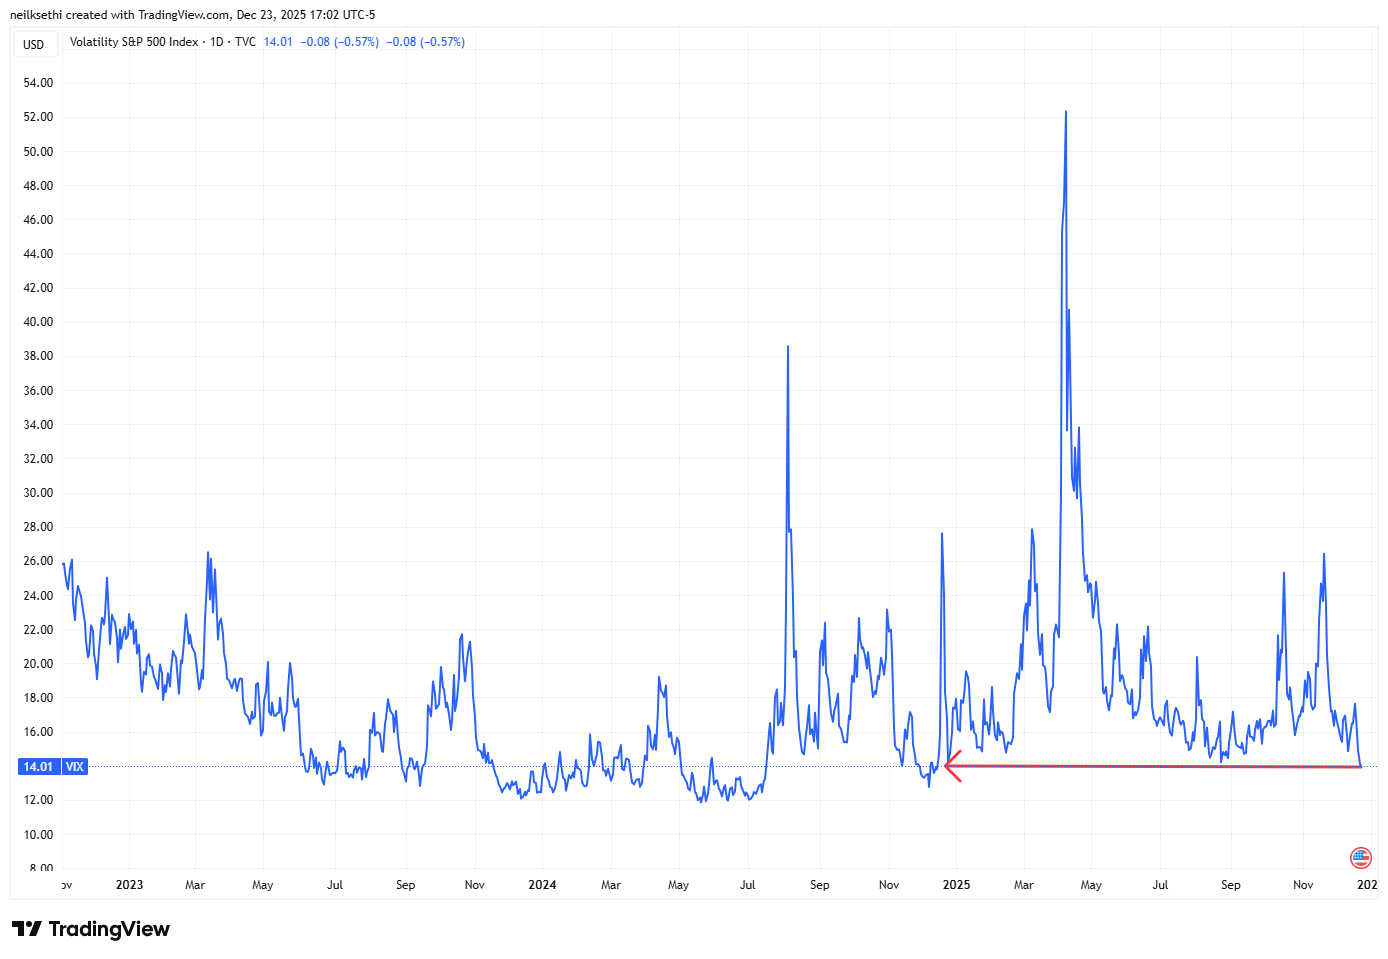
VIX edged to 14.0, still again the lowest close since last December. The current level is consistent w/~0.88% average daily moves in the SPX over the next 30 days.
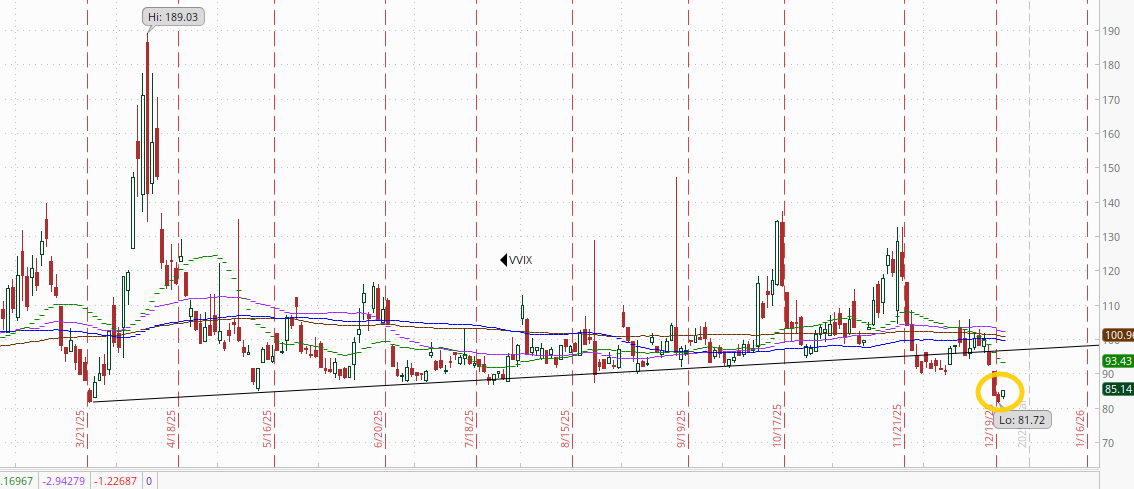
The VVIX (VIX of the VIX) though got a small bounce to 85.1 after Mon touching the lowest levels since July ‘24 (before the carry trade blow-up). The current level remains consistent with “moderate” daily moves in the VIX over the next 30 days (historically normal is 80-100, but we’ve been above 90 almost the entire time since July ‘24)).
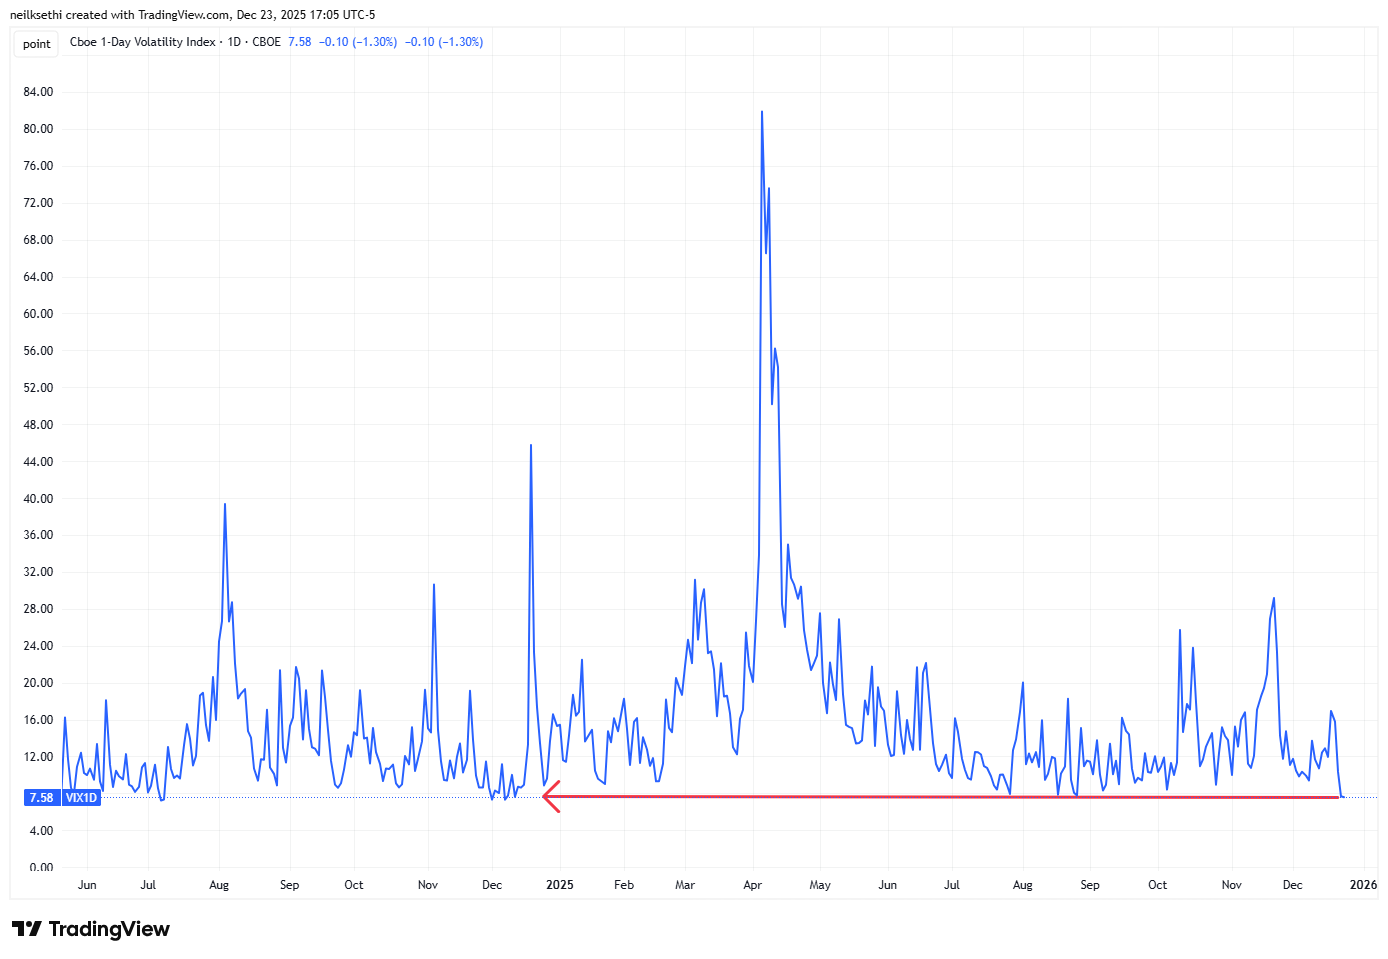
Like the VIX the 1-Day VIX edged to a new lowest close for the year at 7.6. The current reading implies a ~0.47% move in the SPX next session.
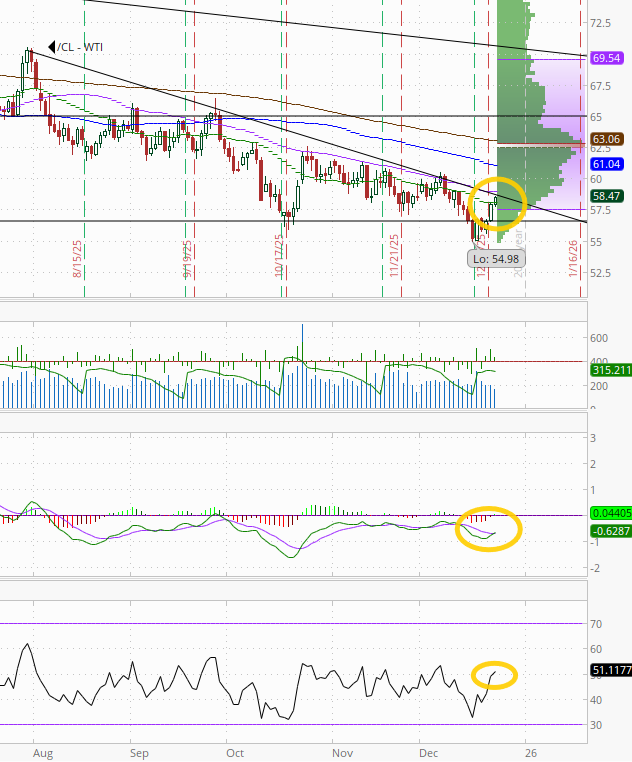
#WTI futures once again have made it up to the resistance they have struggled with since the start of Oct (50-DMA and downtrend line from the July highs). Like several previous times it comes with the daily MACD crossing to “cover shorts” and the RSI moving over 50.
But maybe they can make it through on a light volume pre-Christmas session? For now they remain in their downtrend since the Sept ‘23 high.
The unstoppable run of gold futures (/GC) continues now through $4500 . Daily MACD as noted last week remains in “go long” positioning, but the RSI is now at 80 so starting to get extended (but not yet as extended as in Oct)
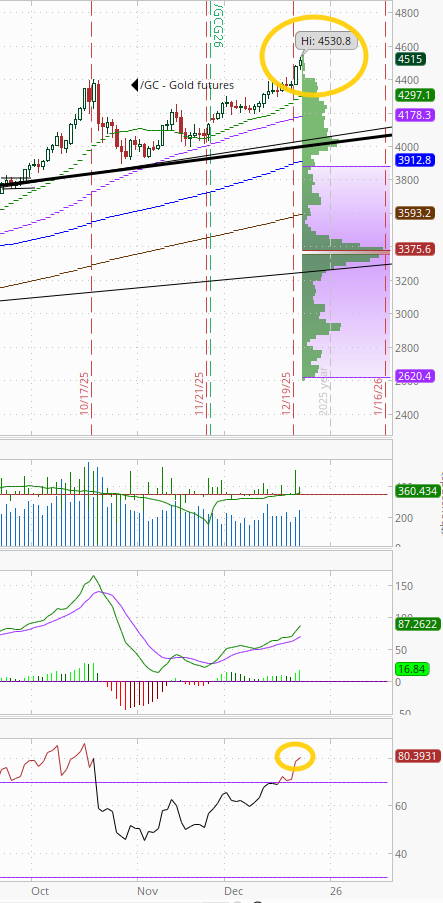
.
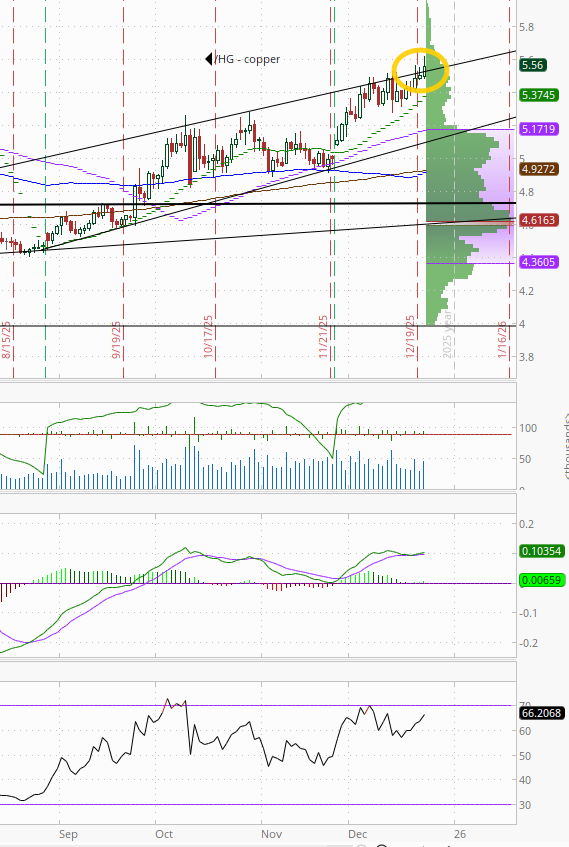
Do we have a change in trend? US copper futures (/HG) again closed higher but this time just over the old support line from the start of the year that has capped their advance the last couple of months.
As noted three weeks ago the daily MACD has crossed to “go long” positioning, and RSI has pushed above 60 although with negative divergences (lower highs). Longer term, copper futures remain in the grinding uptrend since August (and longer than that in the uptrend started in March 2020).
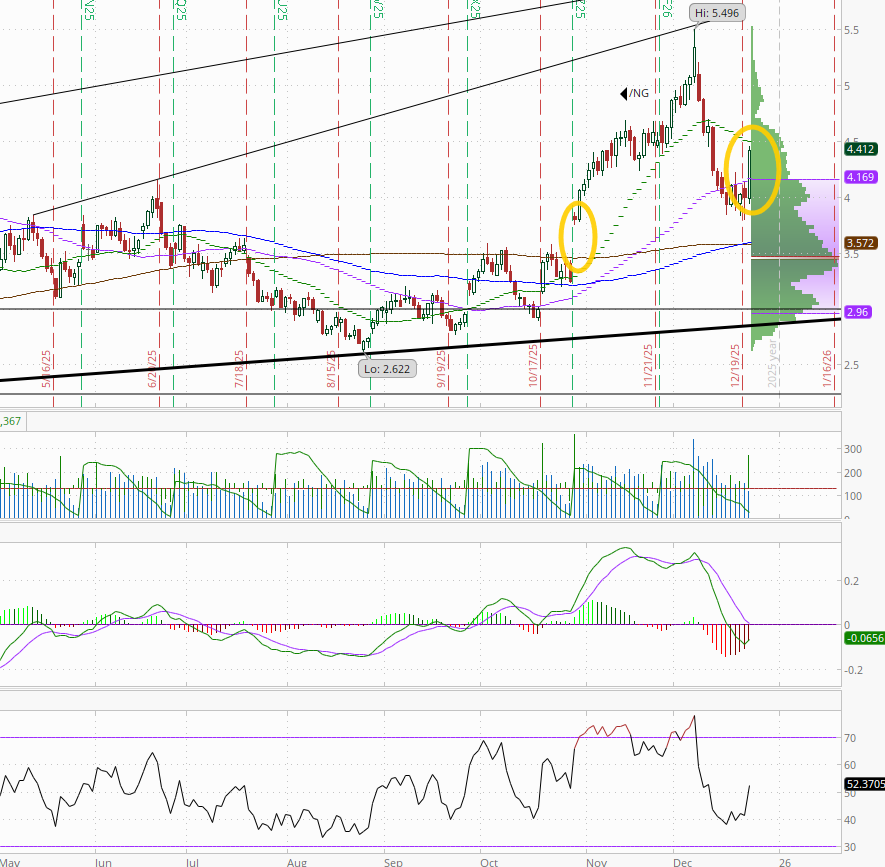
Natgas futures (/NG) jumped over +10% Tues, the largest one-day gain since Oct 30th (when it rolled contract months), on colder weather model updates. I did say on Thurs they seemed to be trying to carve out a bottom, but I certainly wasn’t expecting that.
The daily MACD remains in ‘sell longs’ positioning, but the gain shot the RSI back up over 50.
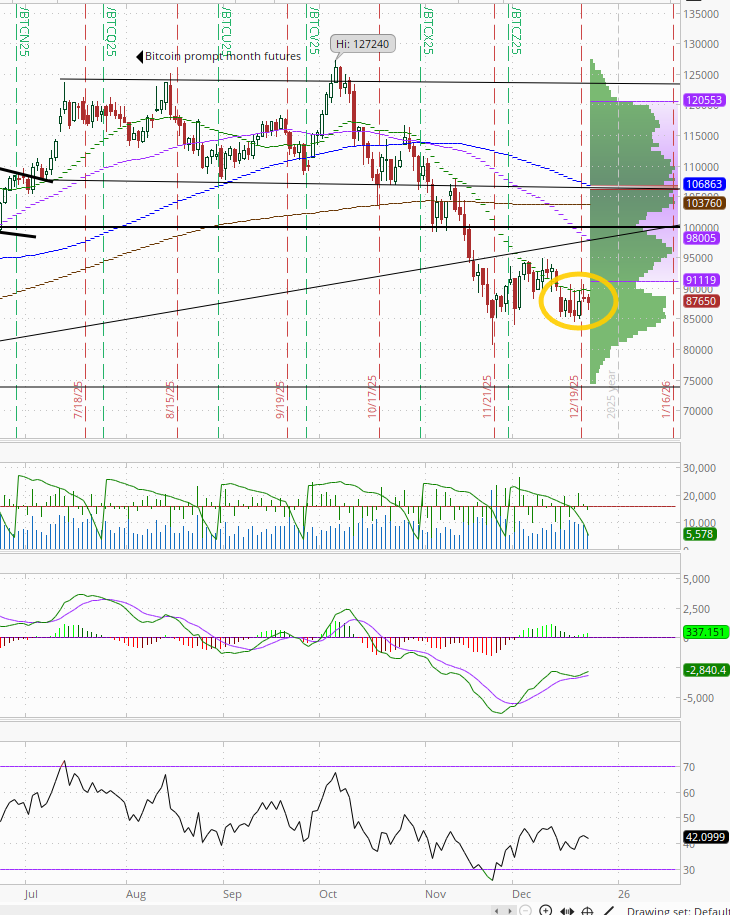
Bitcoin futures remain trapped between the $85k level on the downside and $90k resistance. The daily MACD remains “go long” positioning, but the RSI is still under 50.
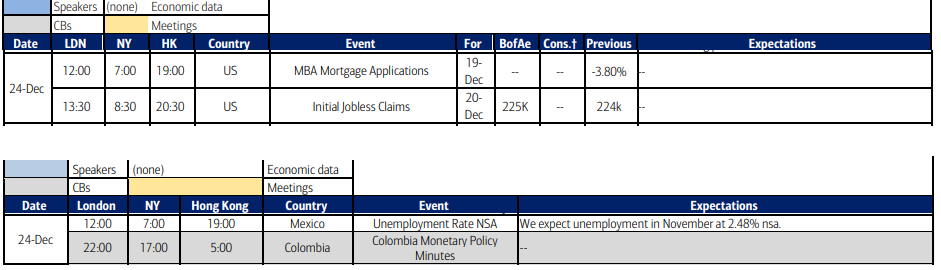
The Day Ahead
Wednesday brings us the last of our notable economic reports of the week with weekly jobless claims plus MBA mortgage applications and EIA petroleum inventories.
Treasury auctions will also wrap up with 7yr USTs.
Ex-US DM highlights include BoJ (Japan) minutes which will be highly scrutinized, but much of the world will either be on holiday or starting one Wed with most carrying through to Monday.
In EM, highlights are Columbia central bank minutes (also with many countries off through Monday).
Reminder that US markets close early Wednesday (1pm ET for stocks, 2pm for bonds) and are closed Thursday.
Link to X posts - Neil Sethi (@nelksethi) / X
To subscribe to these summaries, click below (it’s free!).
To invite others to check it out,