
Markets Update - 12/29/25
Update on US equity and bond markets, US economic data, the Fed, and select commodities with charts!

To subscribe to these summaries, click below (it’s free!).
To invite others to check it out (sharing is caring!),
Link to posts - Neil Sethi (@neilksethi) / X
Note: links are to outside sources like Bloomberg, CNBC, etc., unless it specifically says they’re to the blog. Also please note that I do often add to or tweak items after first publishing, so it’s always safest to read it from the website where it will have any updates.
Finally, if you see an error (a chart or text wasn’t updated, etc.), PLEASE put a note in the comments section so I can fix it.
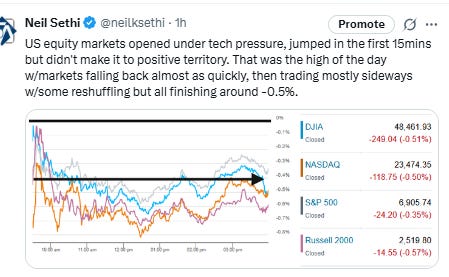
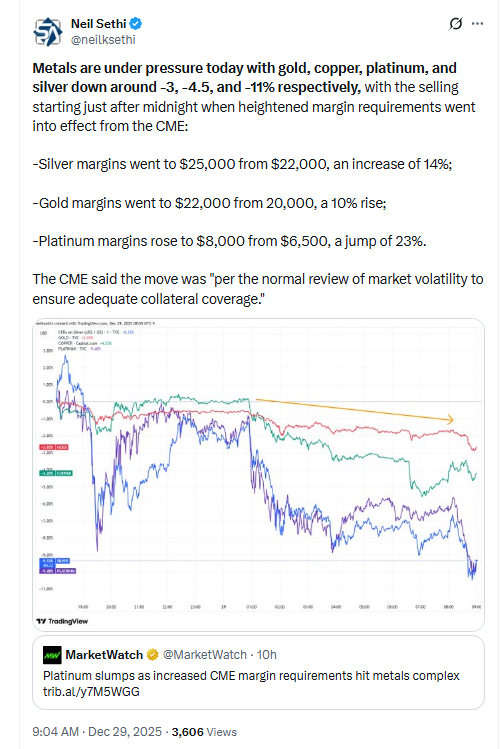
US equity indices opened lower pressured by AI names despite a big deal in the space (Japan’s SoftBank said it has agreed to buy data center investment firm DigitalBridge for $4 billion). Nvidia shares dropped more than -1% premarket, as did Tesla, Micron Technology and Oracle. In the prior week, Nvidia rose more than 5%, while Micron and Oracle climbed around 7% and 3%, respectively. Metals also were under pressure with gold, copper, platinum, and silver down around -3, -4.5, and -11% respectively, with the selling starting just after midnight when heightened margin requirements went into effect from the CME.
Equities jumped in the first 15 minutes of trading but weren’t able to make it to positive territory. That jump marked the highs for the day and indices fell back almost as quickly as they had risen. From there they traded mostly sideways with some upward bias to the Nasdaq and downward bias to the small cap Russell 2000 which finished -0.6%. The Nasdaq and DJIA were -0.5% and the SP -0.35%.
Elsewhere, bond yields edged lower again, while the dollar was little changed. Crude gained, while gold and copper (and silver and platinum) fell as noted above. Bitcoin and natgas were little changed (but some systems rolled to the next month contract on the latter which would cause a decline).
The market-cap weighted S&P 500 (SPX) was -0.4%, the equal weighted S&P 500 index (SPXEW) -0.2%, Nasdaq Composite -0.5% (and the top 100 Nasdaq stocks (NDX) -0.5%), the SOXX semiconductor index -0.4%, and the Russell 2000 (RUT) -0.6%.
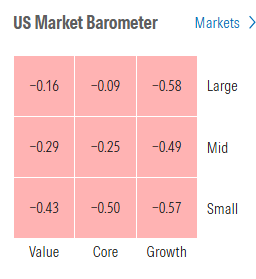
Morningstar style box showed broad losses led by growth and small cap styles.
Market commentary:
The weakness in equities “is a reversal from last week when tech stocks led on the way up,” said Joe Mazzola, head trading & derivatives strategist at Charles Schwab. However, it “doesn’t appear connected to any single fundamental factor.”
With the last week of December light on economic data releases and potentially market-moving events, the way stocks perform may depend more on momentum, according to Chris Larking, managing director of trading and investing at E-Trade. “If stocks are going to close out another year of double-digit gains on a high note, they’ll likely need tech to do much of the heavy lifting.” Larkin said in an email.
"Momentum is certainly on the side of the bulls," said Paul Nolte, senior wealth adviser and market strategist at Murphy & Sylvest Wealth Management. "Barring any exogenous event, the path of least resistance for stocks, I think, is higher."
"There are more investors that are buying in to the narrative that the economy is on pretty solid footing right now," Anthony Saglimbene, chief market strategist at Ameriprise Financial said. "And it has weathered a lot of potential roadblocks this year that might not be such roadblocks next year."
“The broader picture is ideal with the US economy growing strongly, inflation under control, high earnings growth and signals that the cycle of interest rate cuts will continue in 2026,” said David Kruk, head of trading at La Financiere de l’Echiquier. “My take at the moment is that 2026 will look a lot like 2025 so I wouldn’t be surprised to see strong buying flows at the beginning of the year.”
“As attention shifts to the year ahead, the outlook for U.S. economic growth appears bright,” wrote Jason Pride, chief of investment strategy and research and Michael Reynolds, vice president of investment strategy at Glenmede. “The combined effects of tariff policy, fiscal stimulus, shifts in the labor market, AI-related productivity, and the potential for deregulation point to above trend prospects in 2026.”
“The dollar and the S&P 500 were expected to shine in 2025, yet the reality turned out a little different as turmoil and backtracking on tariff announcements in April briefly sank confidence in American policy. The US benchmark has had a good year, but it hasn’t convincingly beaten peers, even in tech.” — Sebastian Boyd, Macro Strategist, Markets Live
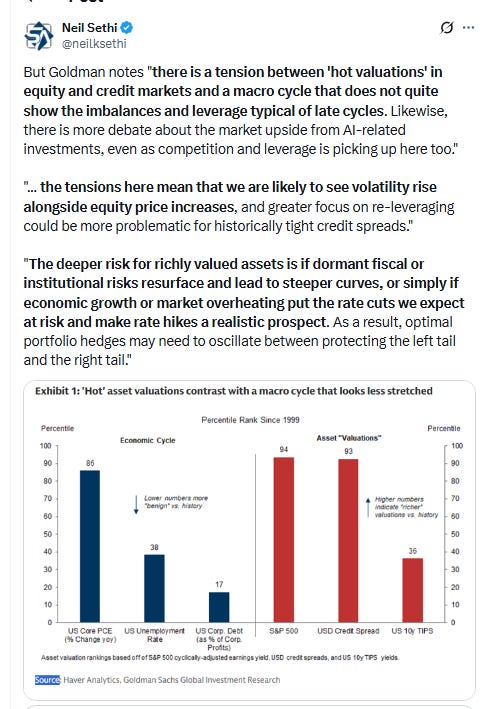
“The question of ‘is AI a bubble’ will remain front and center for investors in 2026,” wrote Richard Flax, chief investment officer at Moneyfarm. “The scale of current investment and the pace of innovation mean that even the skeptics cannot ignore its influence on both markets and the real economy.”
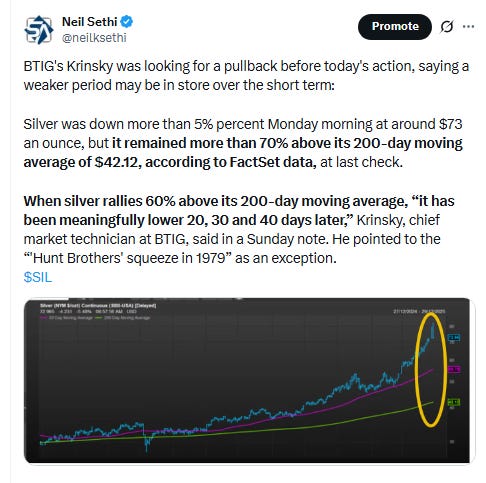
Precious metals “had become quite overbought on a short-term basis, so the fact that they’re seeing some outsized declines this morning is not the end of the world at all,” according to Matt Maley, chief market strategist at Miller Tabak + Co. “We believe that any weakness in these names over the next week or two should create another good buying opportunity.”
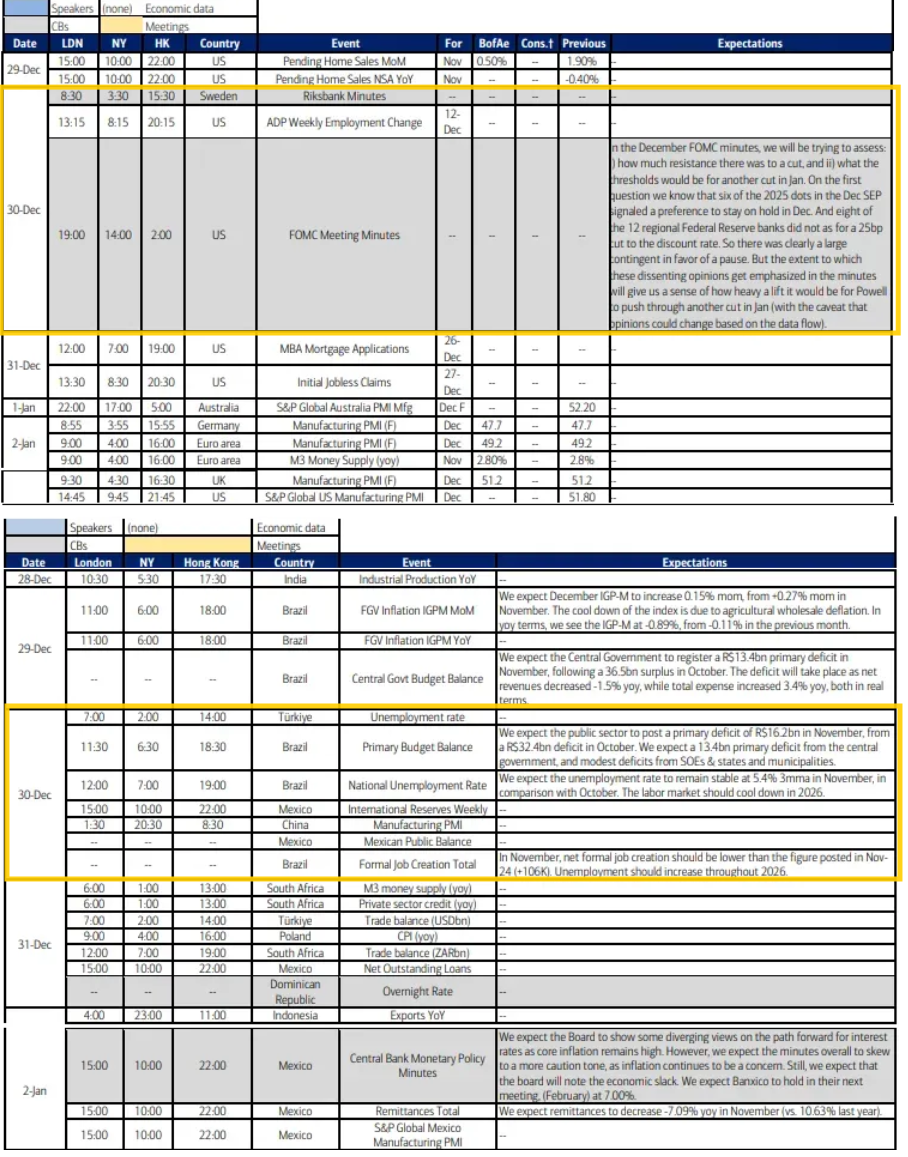
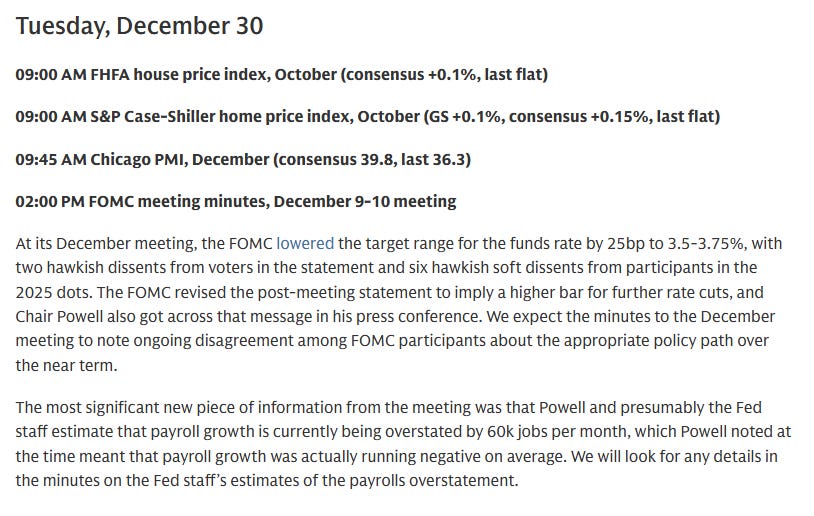
The FOMC minutes from the December meeting, due to be released on Tuesday, may be “illuminating to hear what some of the arguments were around the table,” said Michael Reynolds, vice president of investment strategy at Glenmede. “Handicapping how many rate cuts we’re going to get next year is a big thing markets are focused on right now,” Reynolds said. “We’ll just get a little bit more information on that next week.”


Link to X posts - Neil Sethi (@neilksethi) / X for full posts/access to charts (all free).
In individual stock action:
The artificial intelligence trade came under a bit of pressure in the session. Nvidia shares dropped more than 1%, giving back some of its more than 5% gain in last week’s period. Palantir Technologies and Meta Platforms also suffered losses, as did Oracle
Corporate Highlights from BBG:
Lululemon Athletica Inc. founder Chip Wilson is pushing for changes to the board before the yogawear maker selects a new chief executive officer, highlighting the contentious relationship between the company and one of its biggest shareholders.
Airbus SE is churning out aircraft at a rapid clip in the final days of the year, with confidence building at the European planemaker that it can achieve the delivery goal it was forced to cut only a few weeks ago, according to people familiar with the situation.
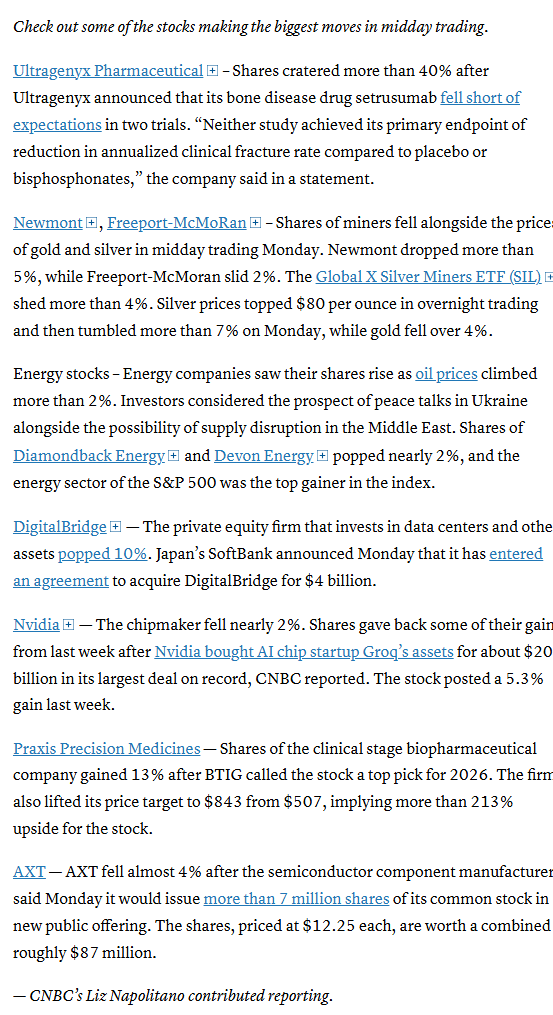
Mid-day movers from CNBC:
In US economic data:
Link to posts for more details/access to charts (all free) - Neil Sethi (@neilksethi) / X
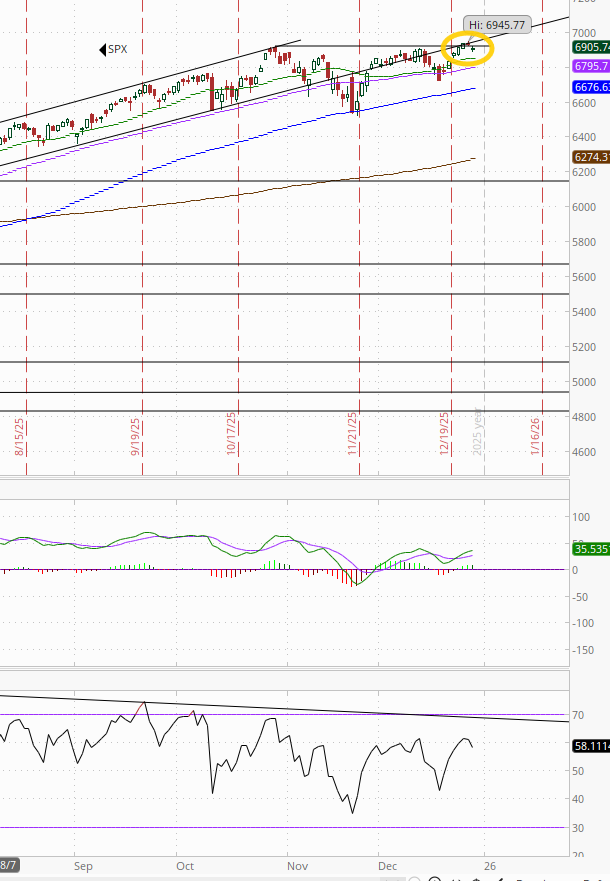
The SPX edged further back from the ATH made Wed. As noted Tues the daily MACD has flipped back to “go long” positioning, while the RSI is over 50 but both with negative divergences (lower highs).
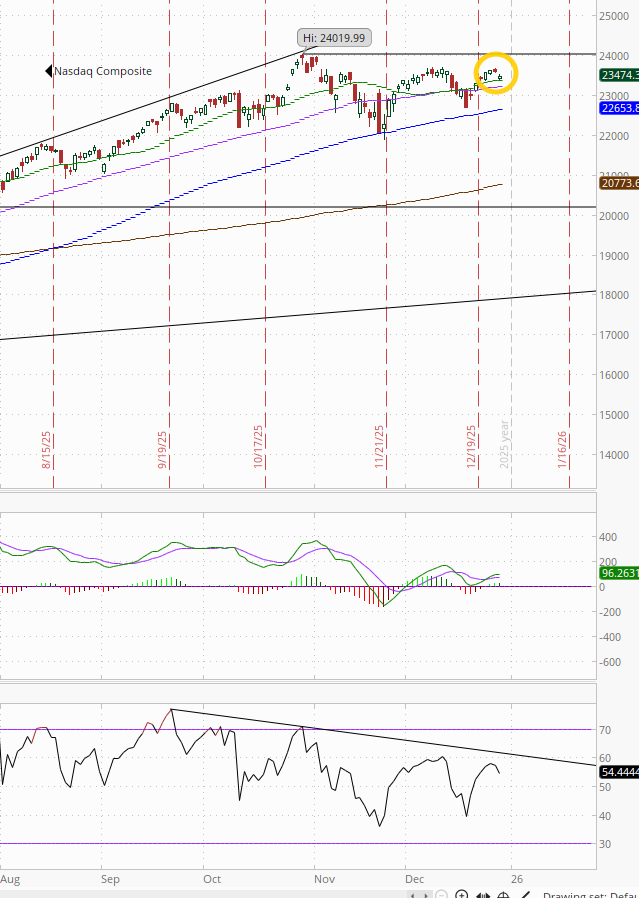
The Nasdaq Composite eased back to its 20-DMA just above the 50-DMA.
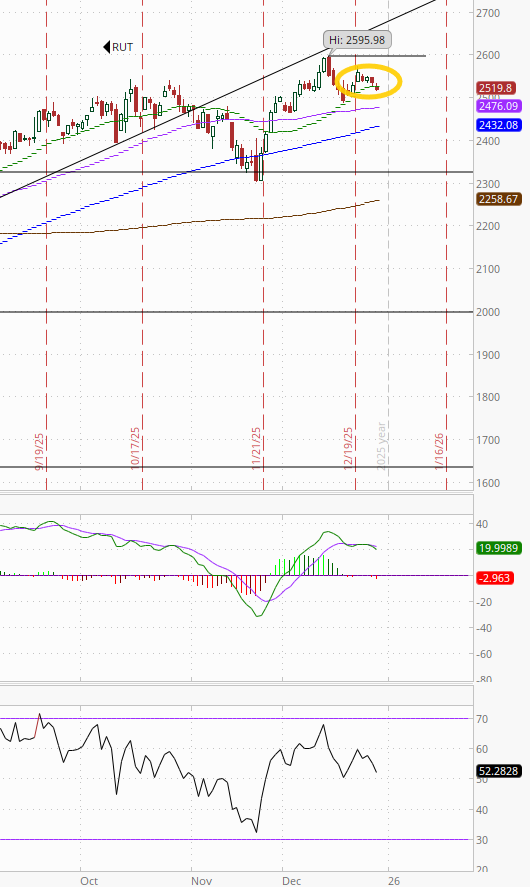
RUT (Russell 2000) fell through its 20-DMA (a touch). It also has a mild “sell longs” MACD positioning and falling RSI (though remains over 50).
Weekly charts are mixed, but interestingly the RUT is the only one with a “go long” weekly MACD.
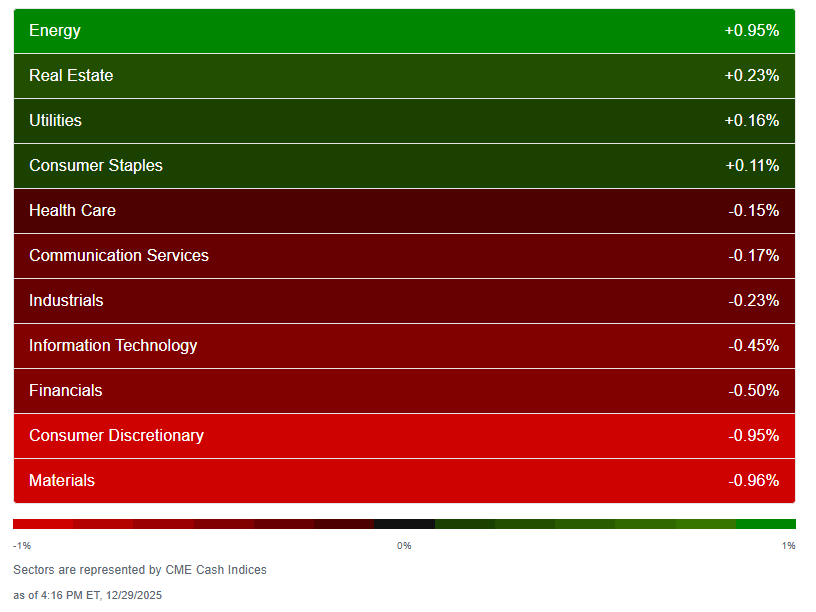
We again got just 4 of 11 sectors higher according to CME Cash Indices (uses futures prices) matching Fri (down from 10 Wed) with just Energy up over +0.25%. Bond proxies RE, Utilities, and Staples were the other green sectors as rates edged lower.
Four sectors down more than -0.25% although none down more than -1% (Cons Discr and Materials were close though (Cons Discr also led to the downside Fri)).
SPX stock-by-stock flag from @finviz_com looks quite a bit like Friday’s with again definitely more red than green, some of it shifting around, but overall not many names moving more than 1% in either direction.
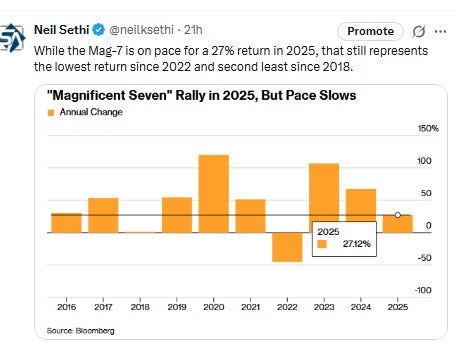
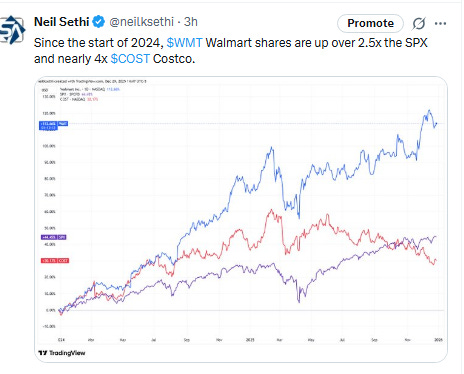
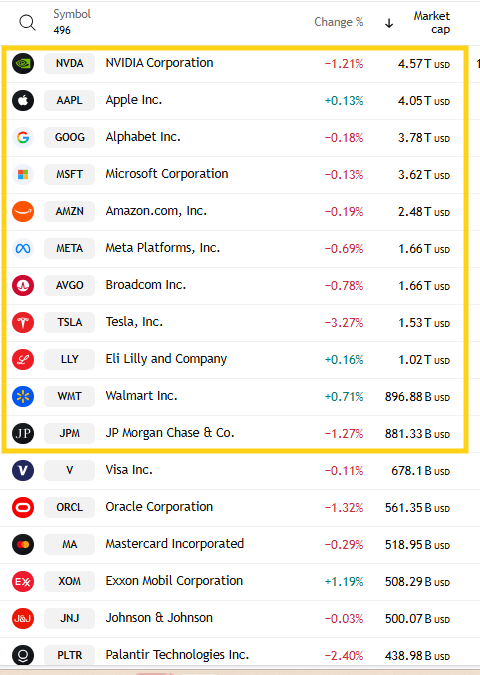
In that regard, 8 of the top 11 by market cap (I’m just going to include both JPM and WMT as they keep shifting back and forth for #10) were lower (the most in a couple of weeks and up from 6 Friday), but similar to Friday only three moved more than 1%. To the downside was again TSLA -3.3% after -2.1% Friday, while to the upside it was WMT but just +0.7%. Mag-7 was -0.8% after finishing last week +1.3% up for the 4th week in the last 5 .
Again just one SPX components was up 3% or more, tied for the least since I started doing this early summer (last time before Friday was Nov 17th), Micron MU +3.4%. That was also obviously the only >$100bn in market cap up 3% or more (after none the prior two sessions).
3 SPX component down -3% or more (up from one Friday) led byt Newmont -5.6% on the drop in metals prices. NEM, TSLA the >$100bn in market cap down -3% or more (after having none the prior four sessions).

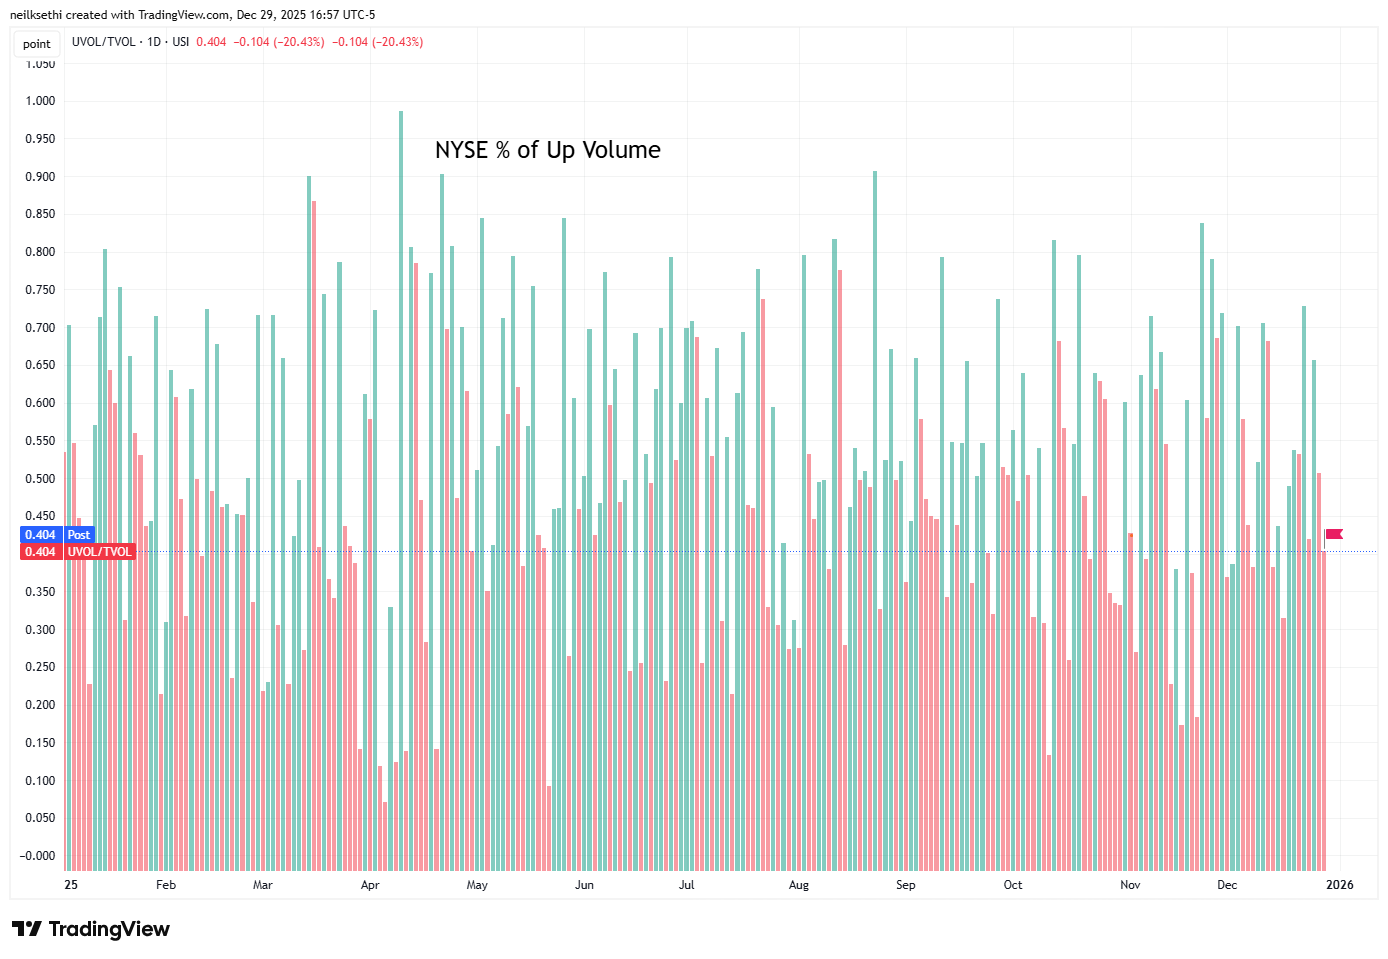
NYSE positive volume (percent of total volume that was in advancing stocks (these also use futures)) deteriorated along with the index coming in at 40.4%, weak even considering the -0.36% loss in the index. Compare to Dec 17th when it was 49% on a larger -0.39% loss.
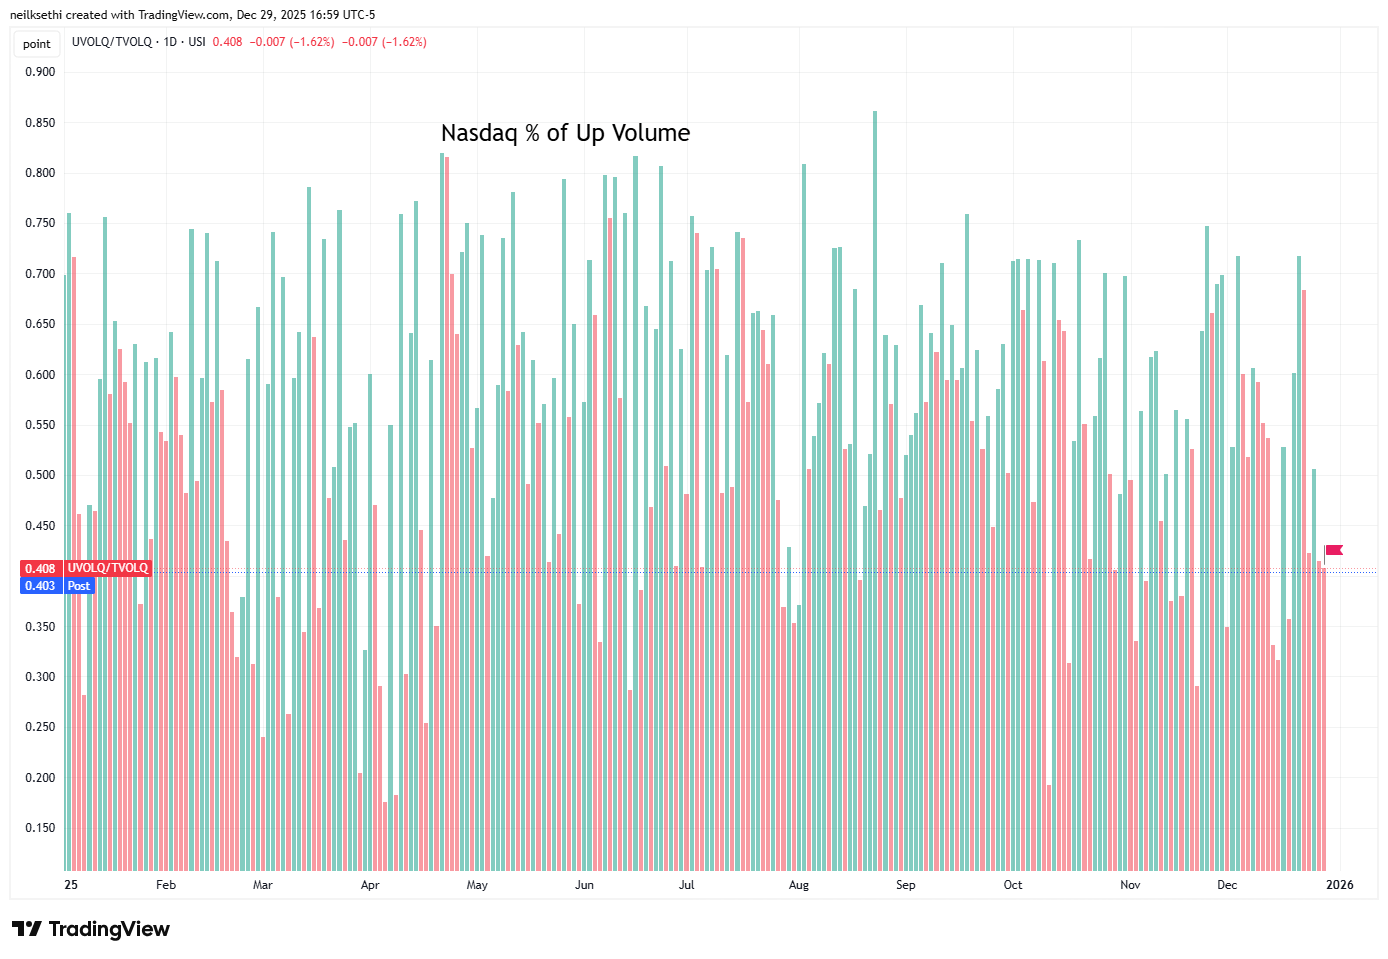
Nasdaq positive volume (% of total volume that was in advancing stocks) was even weaker at 40.3% but that was on a larger -0.50% decline in the index. Considering that, it was not bad at all. Compare that to Friday when it was 41.4% with just a -0.09% decline.
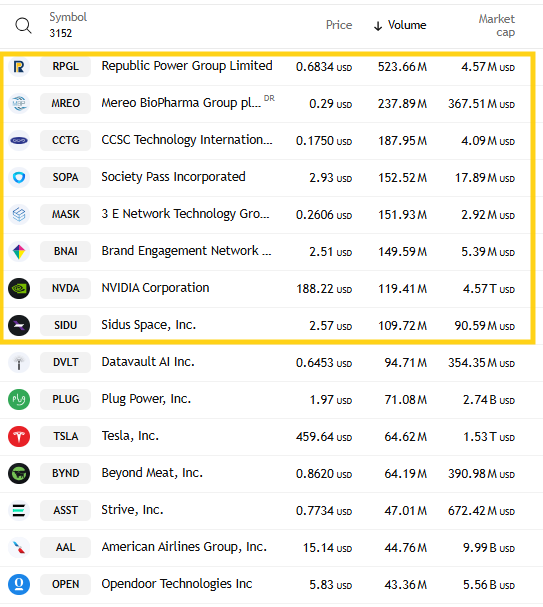
But in part that is due to higher speculative volumes than what we saw the end of last week with the top three stocks by volume on the Nasdaq Monday collectively trading nearly 900mn shares. While down from the over 1bn shares we regularly saw a couple of weeks ago (and last Tues) it was up from Friday (~700mn) and 8 companies had volumes over 100mn shares up from 5 Fri/Wed.
Positive issues (percent of stocks trading higher for the day) which are not as inflated by penny/meme stocks much weaker on the Nasdaq at 28.5% while the NYSE was 36.1%.
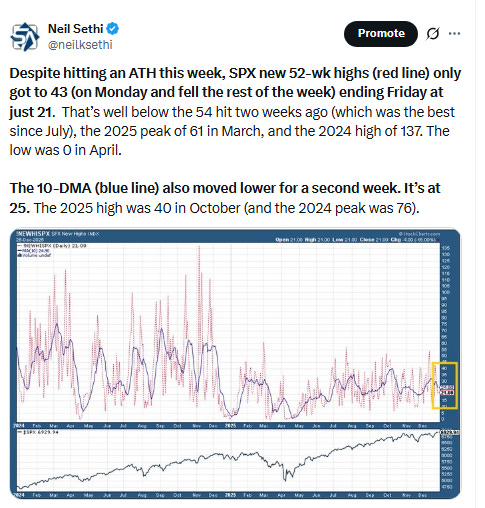
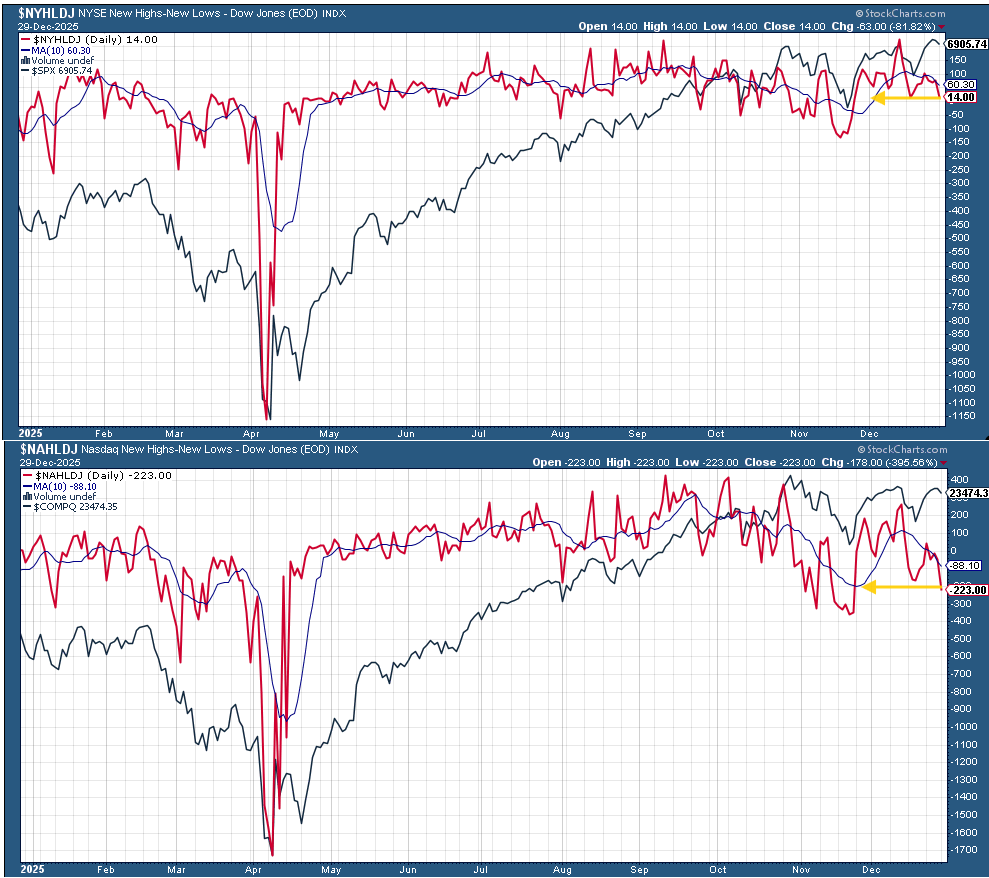
New 52-wk highs minus new 52-wk lows (red lines) dropped back to 14 on the NYSE and -223 on the Nasdaq, both the least in over a month.
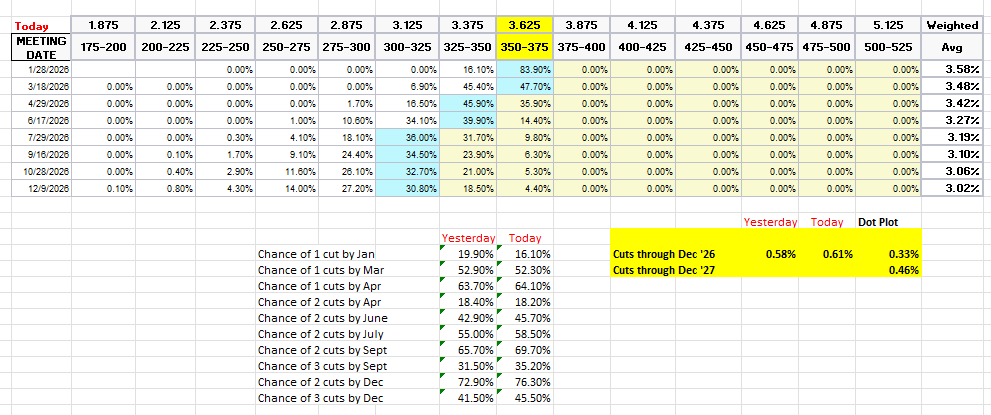
#FOMC rate cut from the CME’s Fedwatch tool overall continued their rebound after falling to the least since before the Dec FOMC on Tues. A cut in Jan remains low at 16% (up from 13%), a cut by March 52% (from 47%). A second cut is in July at 59%.
Pricing for 2026 overall +3bps from Friday to 61bps, with pricing for two cuts 76% (from 69% Tues) and three cuts 46% (from 36%), but still down from 68bps Dec 3rd (and 80bps mid-Nov which was highest we’d been for 2026 cuts)).
The dot plot as a reminder has just 33bps for the average dot for 2026.
Remember that these are the construct of probabilities. While some are bets on exactly one, two, etc., cuts some of it is bets on a lot of cuts (3+) or none (and may include a hike at some point).
The 10yr #UST yield edged to the least since Dec 18th at 4.12%. Still in its range over the past three weeks.

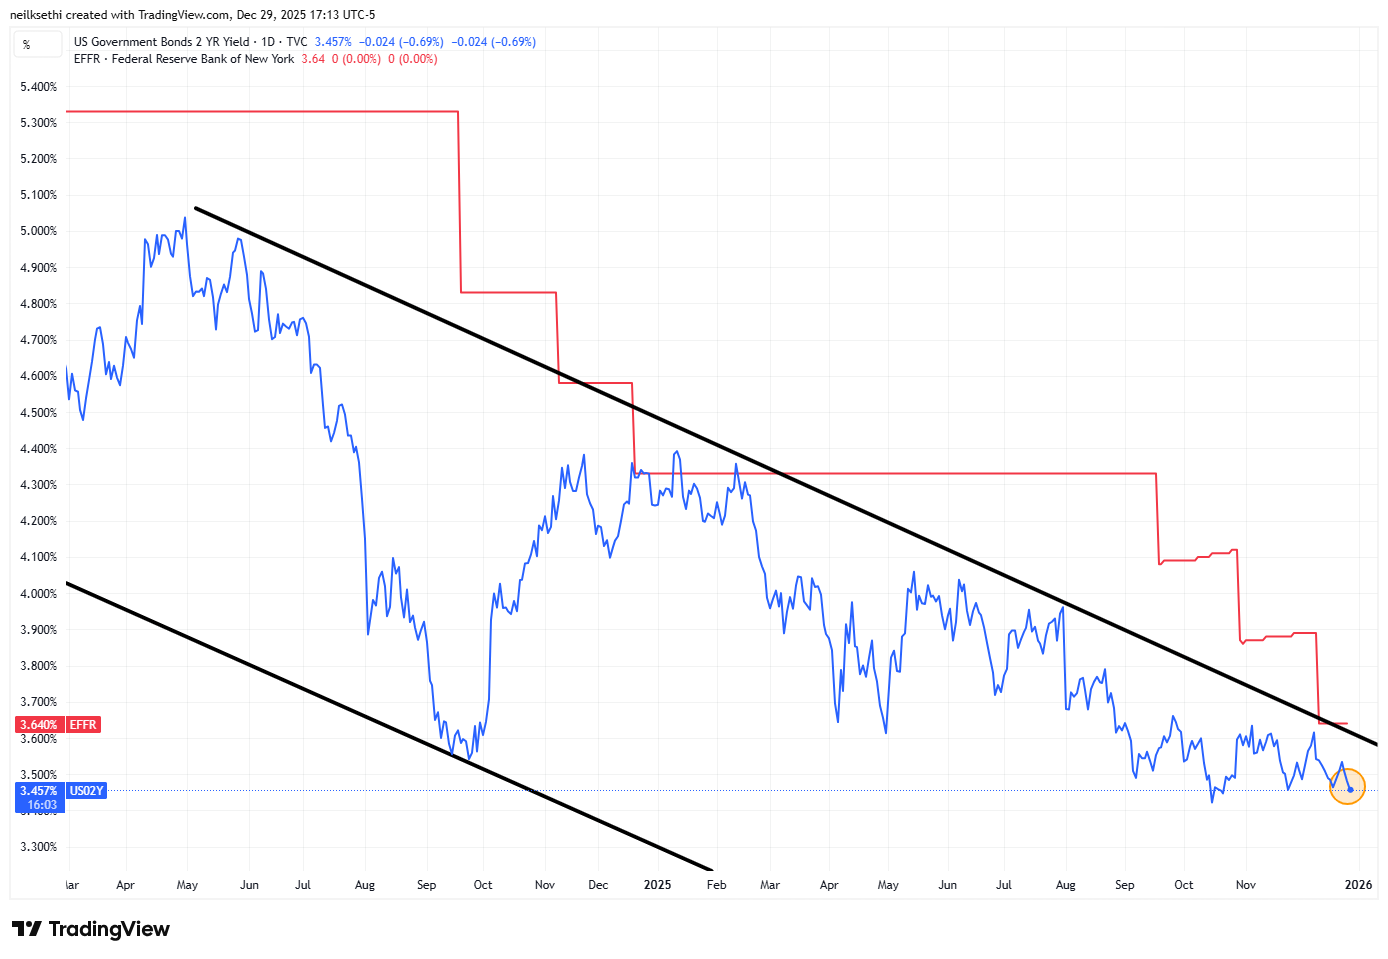
The 2yr yield, more sensitive to FOMC rate cut pricing, also edged lower to 3.46%, the lowest in a month. It remains in the channel it’s been in since the start of 2024, but just 4bps above the least since 2022 and -17bps below the Fed Funds midpoint. Outside of recessions it is normally above by around +50bps on average, so still calling for a couple more rate cuts.
The Effective Fed Funds Rate (red line) remained at 3.64%.
This seems like a fairly rich yield at these levels unless we really aren’t going to get any more rate cuts (then it’s a bit expensive (i.e., yield should be higher)). That said I just don’t know that I want to buy 2-years at what is basically the 1-month yield.
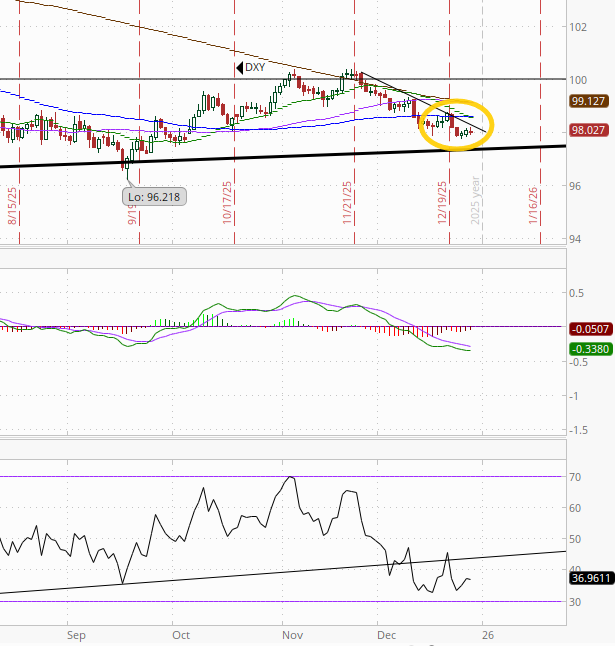
The $DXY dollar index (which as a reminder is very euro heavy (57%) and not trade weighted) remained just off the lowest close since Oct 3rd hit Tuesday but remains in its short-term downtrend from the Nov peak for now. The daily MACD and RSI remain negative with the former in “go short” territory as noted three weeks ago, while the RSI is below 40.
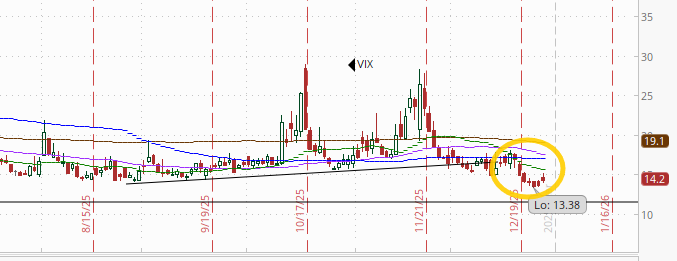
VIX little changed edged off its 52-week lows to 14.2. The current level is consistent w/~0.89% average daily moves in the SPX over the next 30 days.
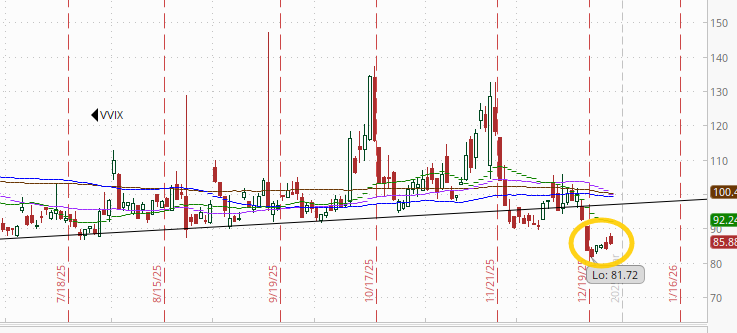
The VVIX (VIX of the VIX) also edged higher to 85.9 after hitting 81.7 a week ago, which was the least since July ‘24 (before the carry trade blow-up). The current level remains consistent with “moderate” daily moves in the VIX over the next 30 days (historically normal is 80-100, but we’ve been above 90 almost the entire time since July ‘24)).
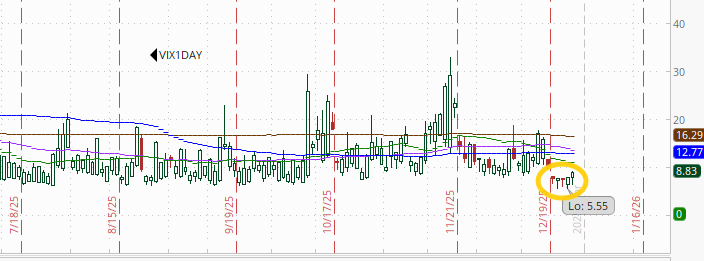
Like the VIX and VVIX the 1-Day VIX edged off the lows of the year to 8.8. The current reading implies a ~0.55% move in the SPX next session.
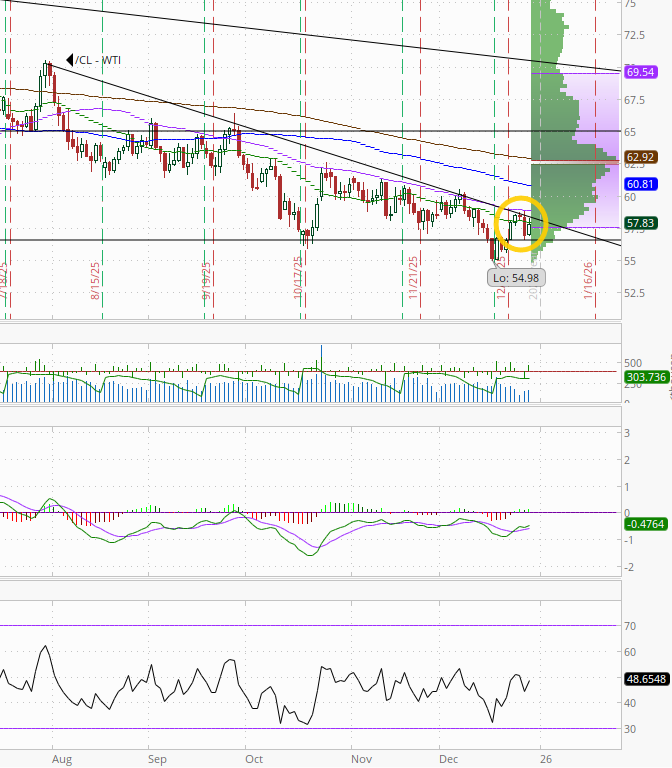
#WTI futures gained but once again just back to the resistance they have struggled with since the start of Oct (50-DMA and downtrend line from the July highs). As I said Friday, “like several previous times the daily MACD crossing to ‘cover shorts’ and the RSI moving over 50 weren’t enough [so far at least] to push it through.”
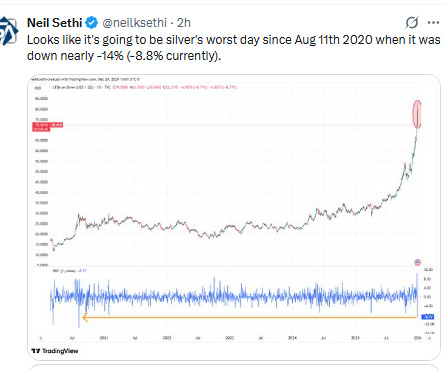
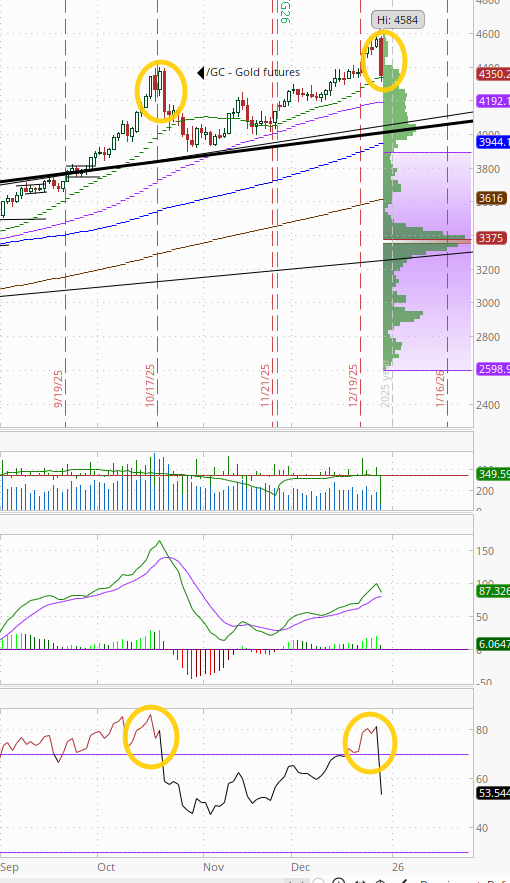
Gold futures (/GC) pulled back sharply along with other metals prices, apparently catalyzed by the CME increasing their margin requirements. It was the biggest pullback since October which was also from an ATH. Like then, the RSI fell from well over to well under 70, although the daily MACD has not yet crossed over.
After that plunge, gold futures drifted lower over the following week or so before resuming the uptrend. We’ll see if we get something similar here.
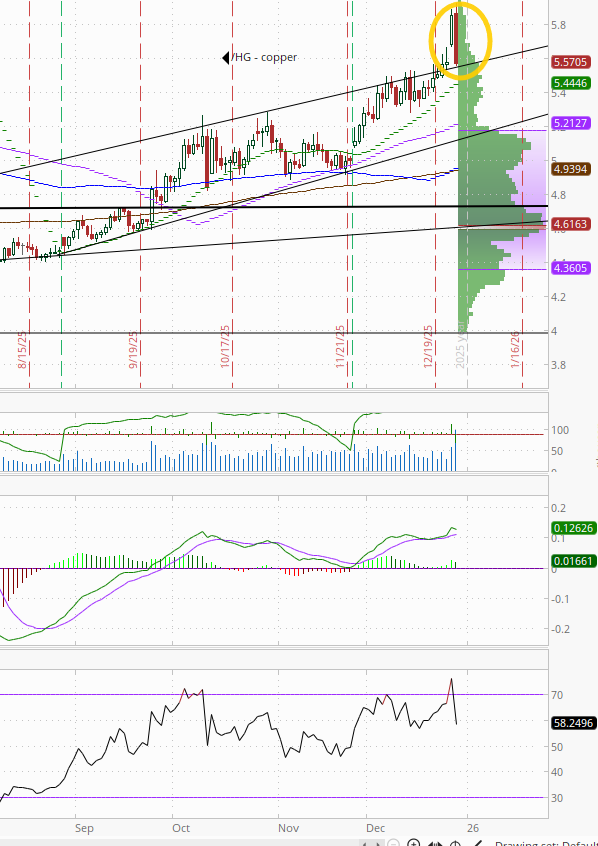
Like gold, US copper futures (/HG) saw their biggest drawdown since Oct which took them back to the top of that trendline they had been struggling to get over most of 4Q. Similar to gold the RSI went from well over to well under 70, but the daily MACD has not crossed over from “go long” positioning.
Longer term, copper futures remain in the grinding uptrend since August (and longer than that in the uptrend started in March 2020).
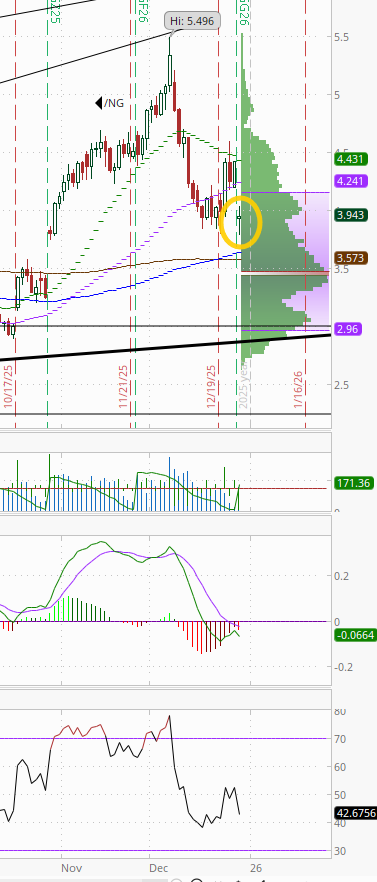
Natgas futures (/NG) rolled to the February contract which saw them drop to around the lowest since they rolled to the December contract two months ago, a -10% drop. Taking that out, they were little changed Monday.
That will mess up the daily MACD which remains in ‘sell longs’ positioning, and RSI which dropped back under 50 in the short term.
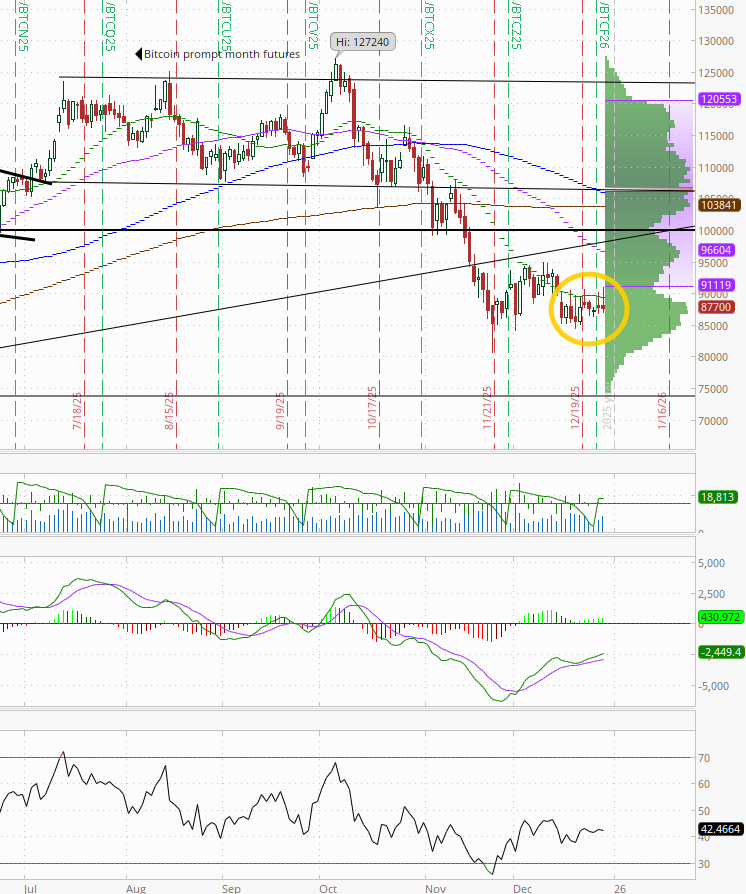
Bitcoin futures took a stab at breaking out but fell back remaining trapped between the $85k level on the downside and $90k resistance (now for over two weeks). The daily MACD remains “go long” positioning, but the RSI is still under 50.
The Day Ahead
US economic data Tuesday remains light with just Oct repeat home price indices and the weekly ADP employment change report and EIA petroleum inventories (the last according to BBG).
No Fed speakers on the calendar, but we’ll get the FOMC minutes from the Dec meeting which may shed some more light on where the committee’s collective mind is around the expected path for rates in 2026.
Non-Bill Treasury auctions (>1yr in duration) are done for the year.
As are SPX earnings (done for the year).
Ex-US DM highlights are minutes from Sweden’s Riksbank and Spain CPI.
In EM, we’ll get S Korea industrial production and retail sales and Brazil budget and unemployment.
Link to X posts - Neil Sethi (@nelksethi) / X
To subscribe to these summaries, click below (it’s free!).
To invite others to check it out,