Markets Update - 12/30/24
Update on US equity and bond markets, US economic reports, the Fed, and select commodities with charts!
To subscribe to these summaries, click below (it’s free!).
To invite others to check it out (sharing is caring!),
Link to posts - Neil Sethi (@neilksethi) / X (twitter.com)
Note: links are to outside sources like Bloomberg, CNBC, etc., unless it specifically says they’re to the blog.
Note: Have to attend a gathering early evening so Tuesday’s update will go out on Wednesday.
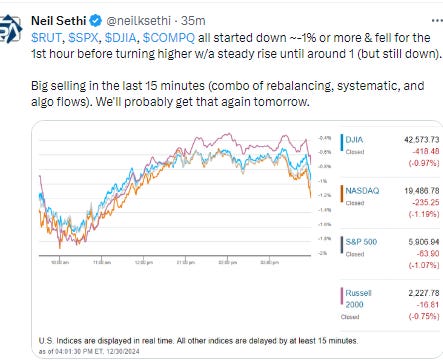
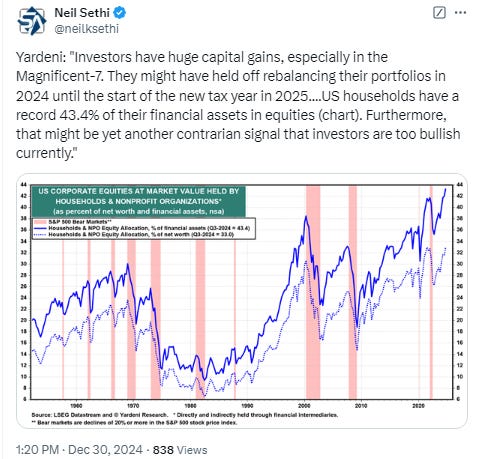
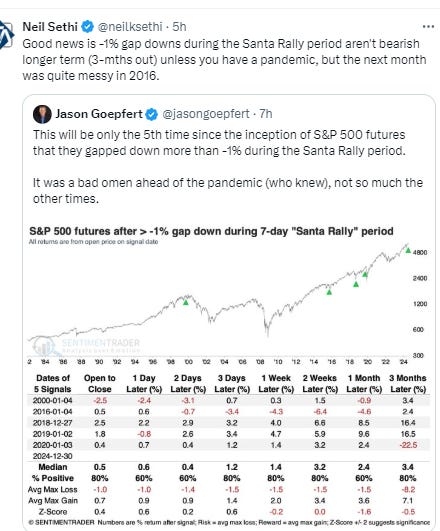
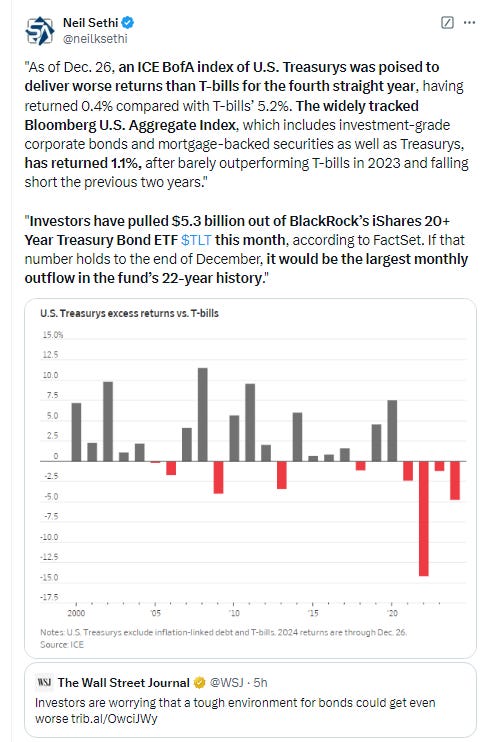
Santa, who I said Friday took off early for the weekend, remained MIA on Monday as equities finished with their worst back-to-back losses during the Santa Rally period since 1952, with another broad based decline seeing every sector end in the red again today. While it’s hard to pin down a specific catalyst, a couple of obvious culprits are the year-end rebalancing after a big up year for stocks and relatively weak one for bonds (which I’ve been flagging in the weekend updates) as well as systematic selling on the back of the higher volatility (also flagged this week).
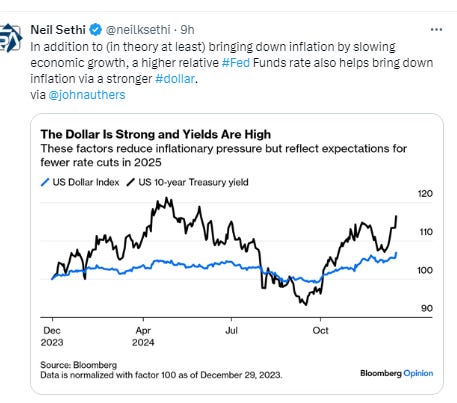
The former reason (rebalancing out of stocks and into bonds) may have been why we saw bond yields drop to a 1-week low after 10 & 30yr yields had moved to the highest closes since May & April respectively on Friday. The dollar though was little changed for a 4th day, while commodities were mixed with crude and nat gas advancing (the latter with a huge +15% gain on a cold January forecast for the Eastern US), while gold, copper and bitcoin moved lower.
The market-cap weighted S&P 500 was -1.1%, the equal weighted S&P 500 index (SPXEW) -1.0%, Nasdaq Composite -1.2% (and the top 100 Nasdaq stocks (NDX) -1.3%), the SOX semiconductor index -1.9%, and the Russell 2000 -0.8%.
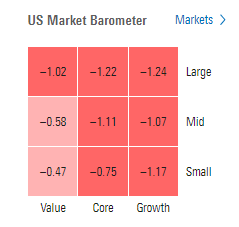
Morningstar style box again showed the broad decline with some outperformance by small caps.
Market commentary:
“Santa has already come — have you seen the performance this year?” said Kenny Polcari, a strategist at SlateStone Wealth LLC. The coming week “is another holiday-shortened week, volumes will be light, moves will be exaggerated. Don’t make any major investing decisions,” he said.
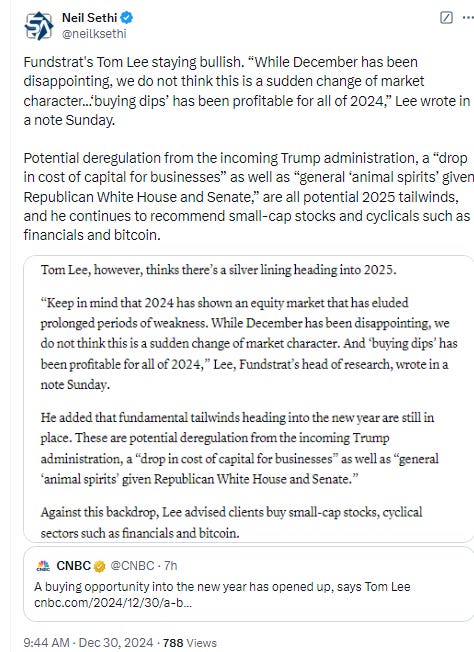
“In these moments, it’s best to stay put,” said Nicolas Domont, a fund manager at Optigestion in Paris. “The US remains the place to be. Growth stocks continue to outperform and earnings forecasts are good, so there are good reasons to remain optimistic.”
“There’s a little bit of trepidation heading into year-end, owing in part to uncertainty over how the international trade picture may take shape in 2025,” said Tim Waterer, chief market analyst at Kohle Capital Markets Pty. “Some traders are taking risk off the table heading into year-end.”
“I really think we’re going to take a pause this next year,” Jeremy Siegel, senior economist to WisdomTree and emeritus professor of Finance at The Wharton School, said on “Squawk on the Street.”
“As time has gone on, I think the probability of a correction next year, which is defined as a 10% drop in the S&P, is getting higher. ... The major forces to propel things upward I think have already been built in,” Siegel added.
Adam Crisafulli, founder of Vital Knowledge, noted that thin trading in the holiday week could trigger wild swings in stocks. “Keep in mind too that trading is characterized this week by extremely thin volume, liquidity, and attendance, which creates a lot of air pockets, exacerbating moves in both directions,” he said in a note Monday. That being said, the tech-led sell-off on Friday did unsettle investors and prompted many to wonder whether the group could be setting up for a period of profit taking after an impressive bout of outperformance this year, he added.
“The market’s largest companies and other related technology darlings are still being awarded significant premiums,” said Jason Pride and Michael Reynolds at Glenmede. “Excessive valuations leave room for downside if earnings fail to meet expectations. Market concentration should reward efforts to regularly diversify portfolios.”
“Large cap valuations appear expensive, and the US economy sits in the late stage. As a result, the road ahead may be shorter than the bull market’s age alone would suggest,” said Pride and Reynolds at Glenmede. “The combination of a young bull market, a late-cycle expansion and premium valuations justifies a neutral risk posture given the relatively balanced implications for risk assets,” the Glenmede strategists concluded.
John Belton at Gabelli Funds says valuation alone is not a reason to be bearish on the US equity market, but impacts risk/reward in the near-term.
Yet Belton notes the “Magnificent Seven” still look like a well-positioned group.
“I remain bullish on the tech sector, despite concerns about high valuations,” said David Miller at Catalyst Funds. “The growth potential, particularly driven by AI, justifies these valuations, as it significantly enhances productivity for companies.”
To Tom Essaye at The Sevens Report, sentiment is no longer euphoric and markets will start the year with regular investors much more balanced in their outlook — and that would be a “good thing as it reduces air pocket risk,” but advisors have largely ignored the recent volatility. “It’s fair to say that this recent dip in stocks has taken the euphoria out of individual investors, but it has not dented advisors’ sentiment,” he said. “And if we get bad political news or Fed officials pointing towards a ‘pause’ in rate cuts, that likely will cause more short, sharp drops.”
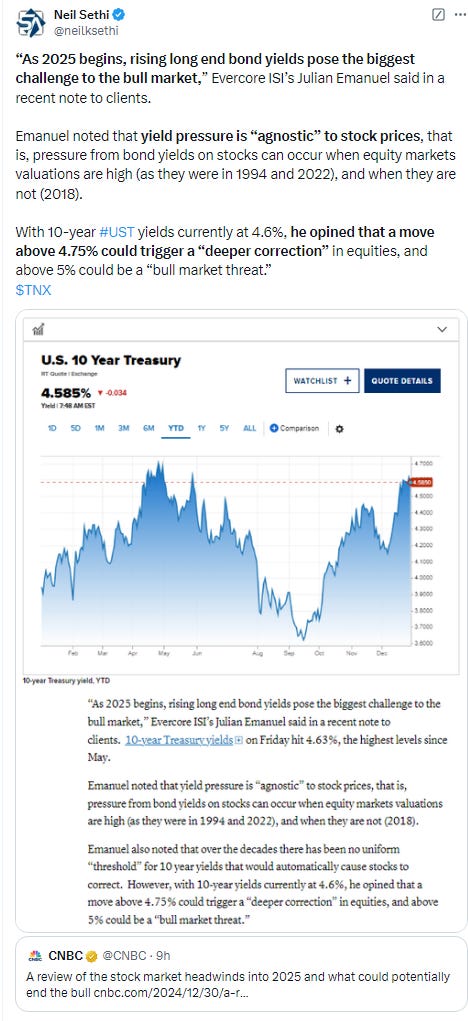
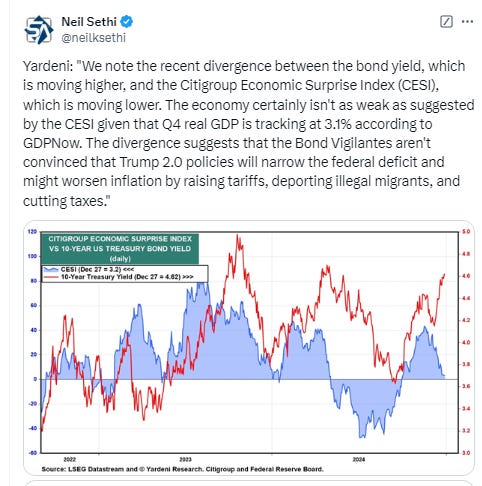
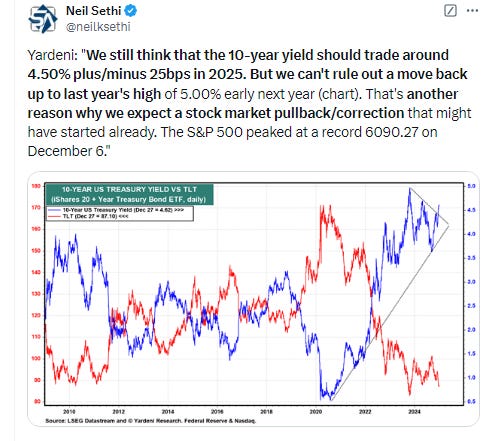
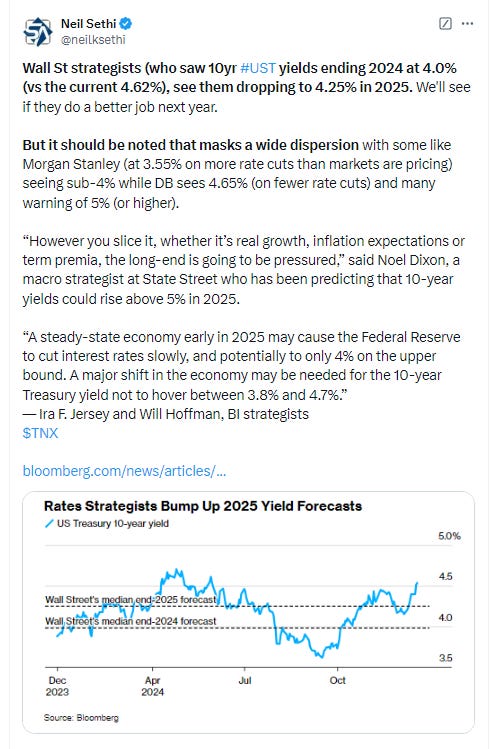
“As 2025 begins, rising long end bond yields pose the biggest challenge to the bull market,” Evercore ISI’s Julian Emanuel said in a recent note to clients. 10-year Treasury yields on Friday hit 4.63%, the highest levels since May.
Emanuel noted that yield pressure is “agnostic” to stock prices, that is, pressure from bond yields on stocks can occur when equity markets valuations are high (as they were in 1994 and 2022), and when they are not (2018).
Emanuel also noted that over the decades there has been no uniform “threshold” for 10 year yields that would automatically cause stocks to correct. However, with 10-year yields currently at 4.6%, he opined that a move above 4.75% could trigger a “deeper correction” in equities, and above 5% could be a “bull market threat.”
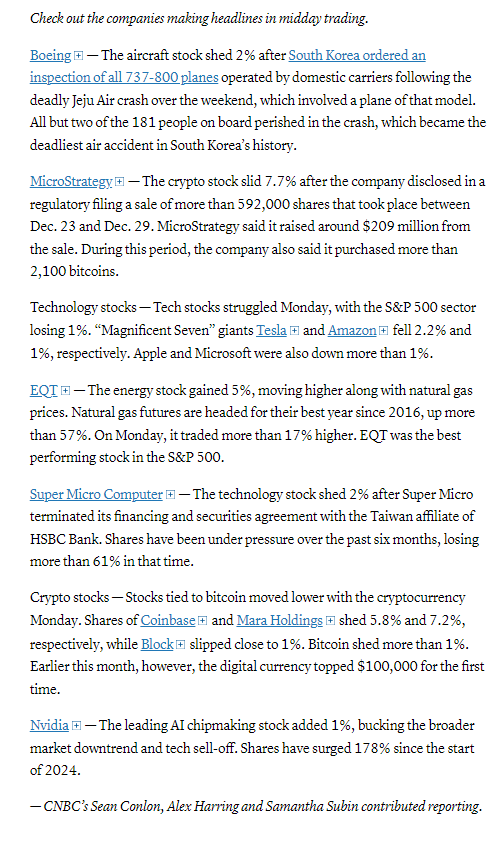
In individual stock action, turnaround action in NVIDIA (NVDA 137.49, +0.48, +0.4%) helped the major indices move off session lows. NVDA shares had been down as much as 2.2% at their worst levels of the day. Boeing shed -2% after South Korea ordered an inspection of all 737-800 planes operated by domestic carriers following the deadly Jeju Air crash over the weekend, which involved a plane of that model.
Some tickers making moves at mid-day from CNBC.
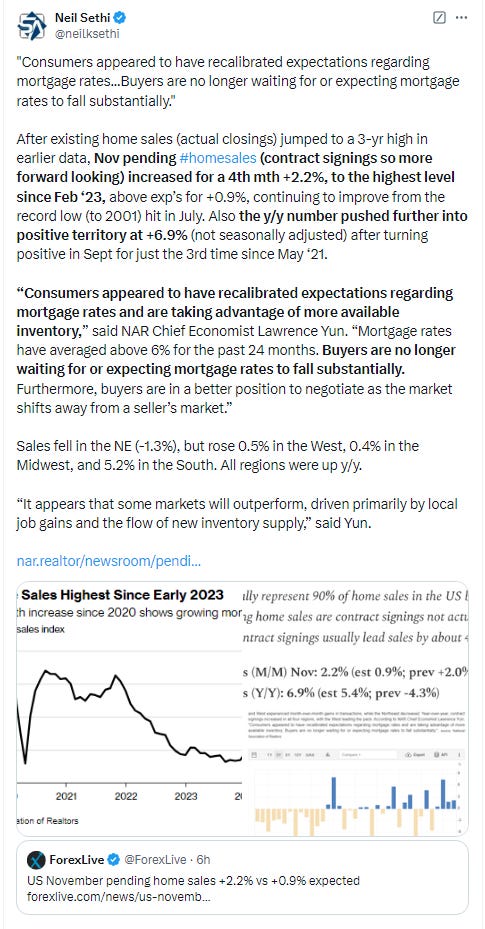
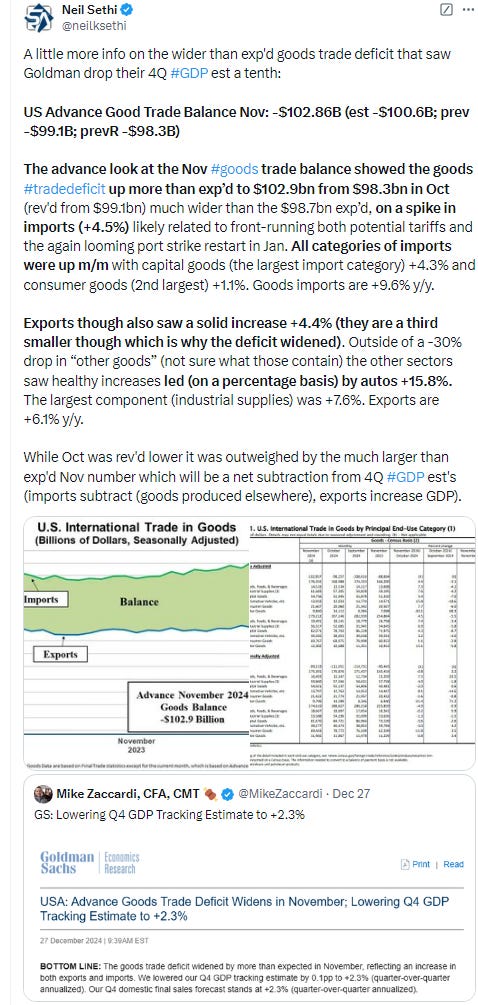
In US economic data we just got Nov pending home sales (contract signings on existing homes) which, after existing home sales (actual closings) jumped to a 3-yr high in data earlier this month, increased for a 4th mth a better than expected +2.2%, to the highest level since Feb ‘23.
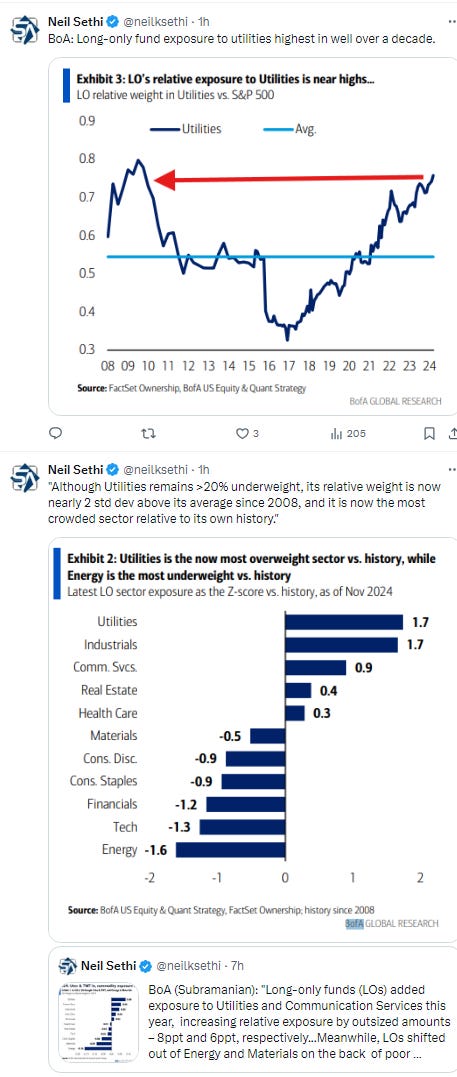
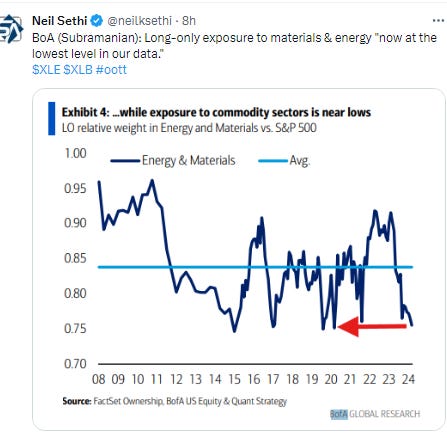
Link to posts - Neil Sethi (@neilksethi) / X (twitter.com) for more details.
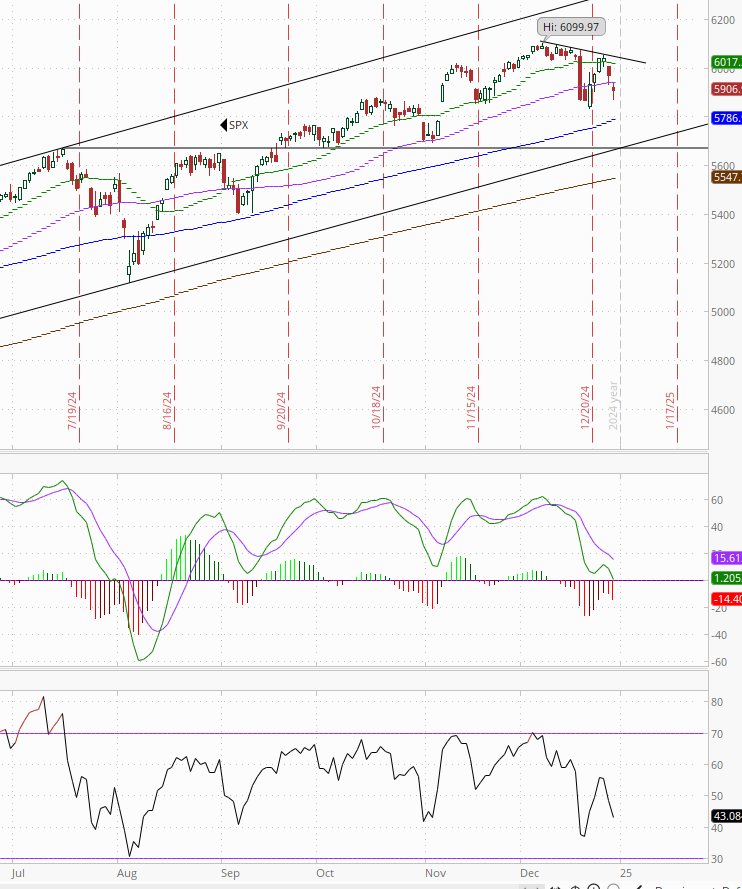
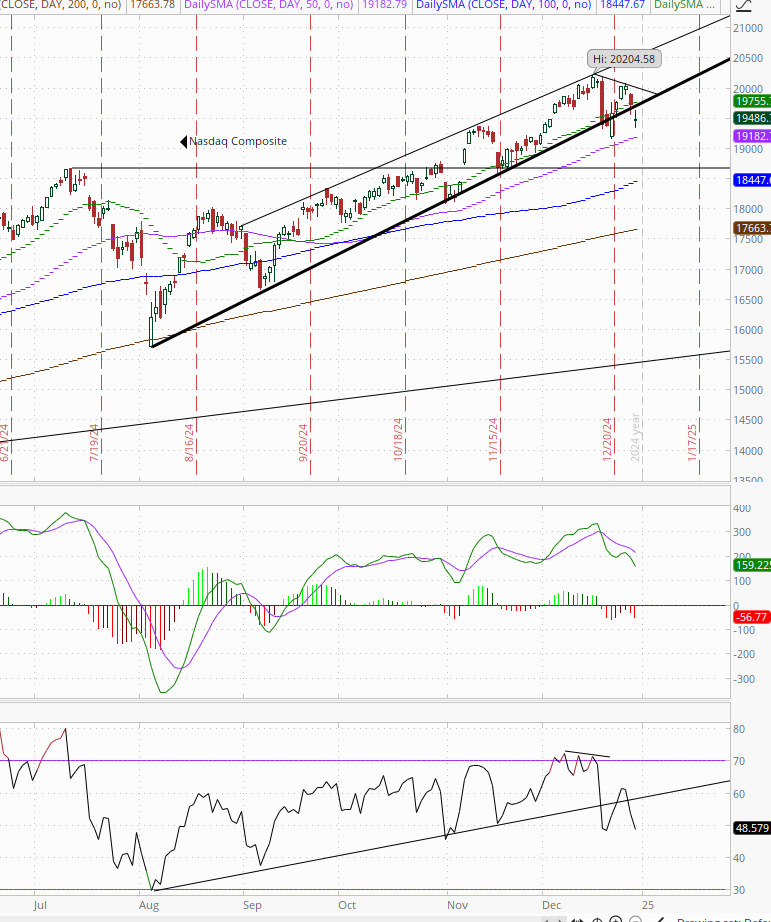
The SPX fell through its 50-DMA, and then failed at it when it tried to recover. That’s a negative technical pattern. Adding to that the daily MACD remains weak and the RSI is under 50, so we look lower until it can get back over the purple line.
The Nasdaq Composite for its part fell under its 20-DMA and uptrend channel, although it has better support in the 50-DMA just below. Its daily MACD remains weak, and its RSI is also now under 50.
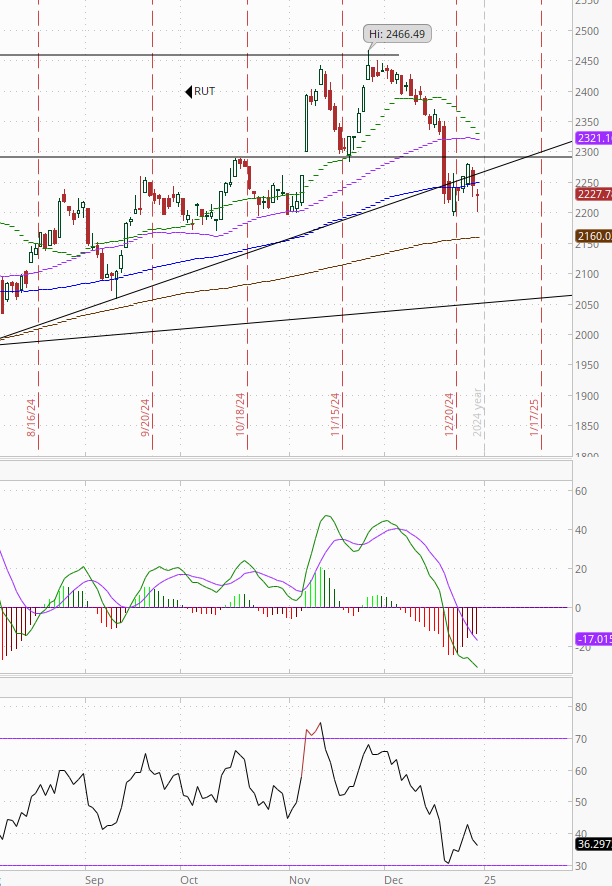
RUT (Russell 2000) for its part fell under its 100-DMA and tested last week’s lows (which held for now). Daily MACD & RSI remain the weakest of the three.
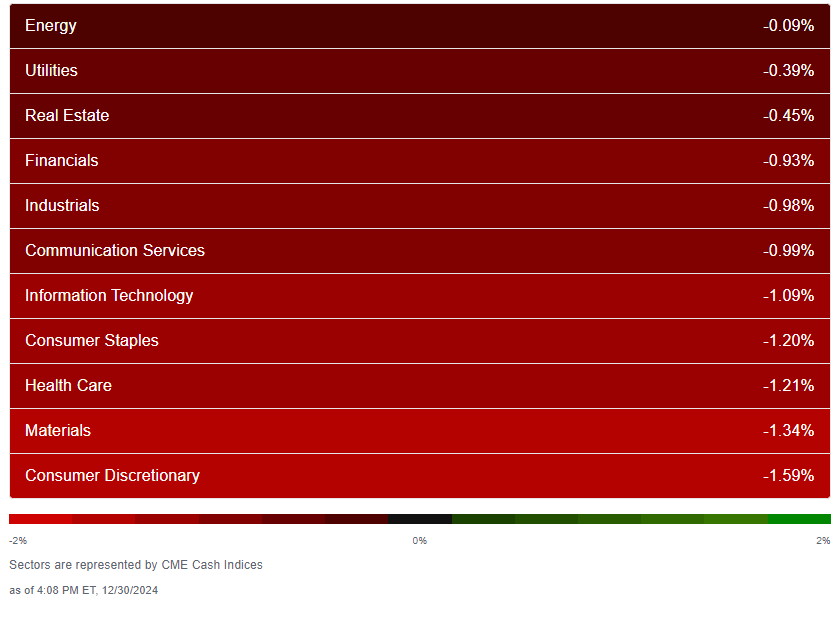
Equity sector breadth from CME Indices similar to Friday (but a little worse) with every sector down again, energy leading with a tiny loss, and consumer discretionary coming in at the bottom. Unlike Friday though the other megacap growth sectors (tech & comm services) didn’t finish in the other bottom 3 spots (today was materials and health care), although they were still down around -1%, giving us 8 sectors down around -1% or more (up from 4 Friday).
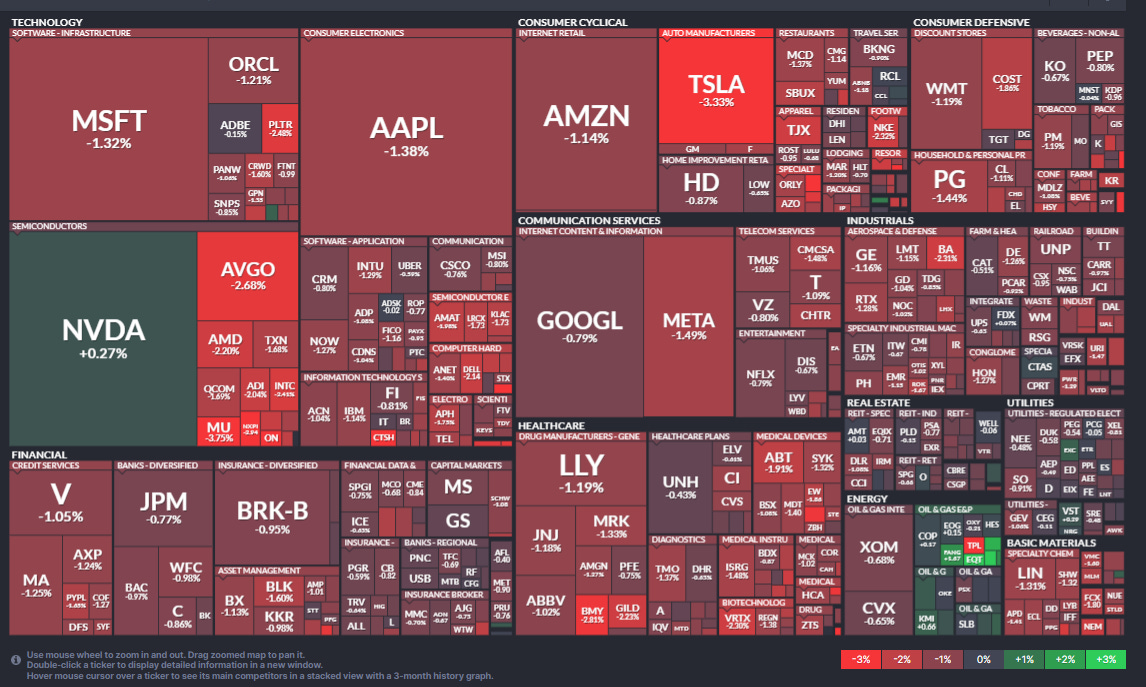
Stock-by-stock $SPX chart from Finviz also similar to Friday with very little green, and what there was not up by much outside of nat gas exposed names. Another bad day for TSLA now down -8% last 2 sessions (although still up +25% over the past month).
Positive volume (the percent of volume traded in stocks that were up for the day) another mixed day with the NYSE weak again at 28% after 22% on Friday, while Nasdaq was 54% after 51% Friday, again an excellent result given the index was down over -1%, the 6th consecutive day over 50%. Positive issues (percent of stocks trading higher for the day) improved but were still sub-50% at 35 & 36%.
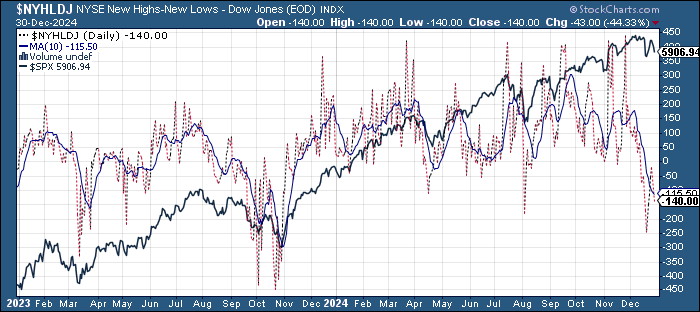
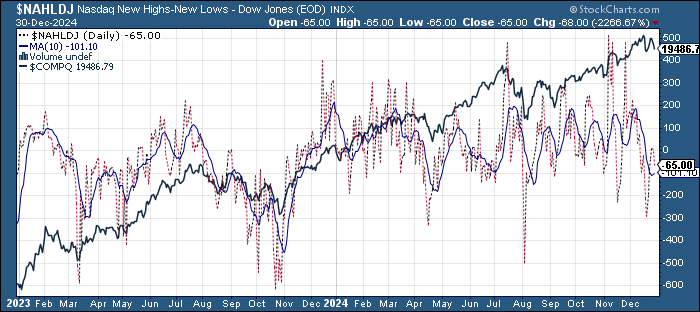
New highs-new lows (charts) deteriorated again with the NYSE falling to -140 (still up from -245 a little over a week ago (which was the weakest since Aug and 2nd weakest since Oct ‘23)), while the Nasdaq fell to -68 from +3 (also still above the -297 from two weeks ago, the least since Aug (& 2nd least since April)). The NYSE is now back under its 10-DMA which continues to head lower (more bearish) the least since Nov ‘23, but Nasdaq remains above, and its 10-DA (the least since Aug) is curling up.
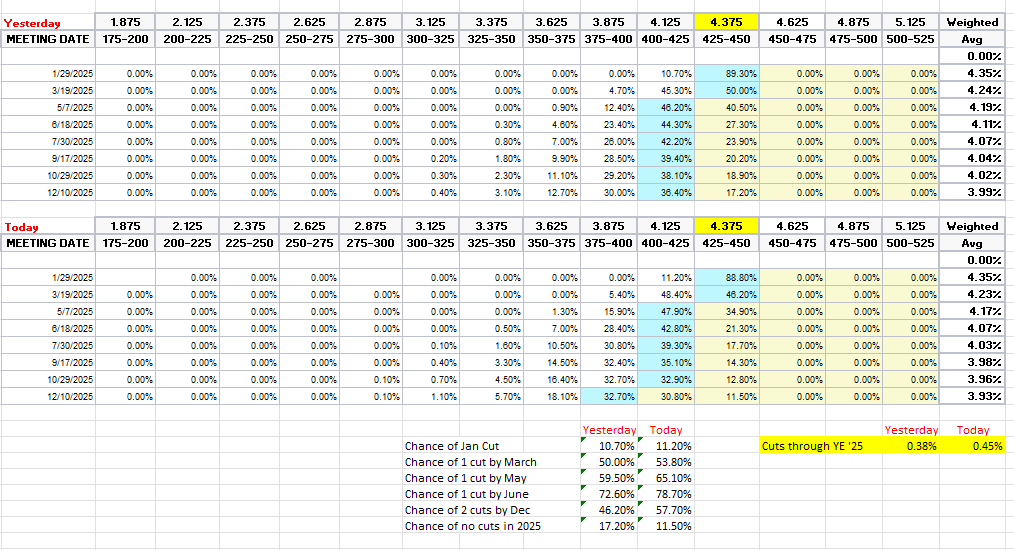
FOMC rate cut probabilities from CME’s #Fedwatch tool saw a bit of a shift now pricing in a 2nd cut in 2025 at better than 50% (58%) from 46% Friday. Overall 2025 cut expectations now 45bps (from 38). First cut remains in March at 53%. Chance of no cuts falls to 12% (from 17%).
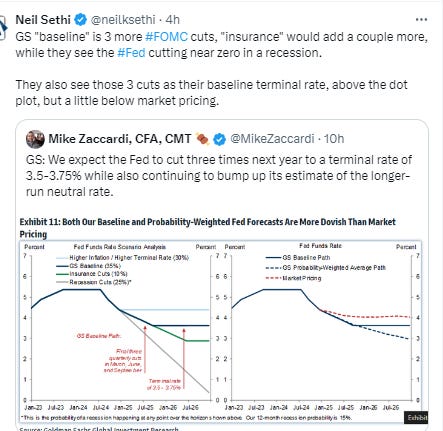
I had previously noted the market seemed quite aggressively priced to me, and that I continued to expect at least two cuts, and it seems the market is moving in my direction. Of course it’s all just a big guess as we know it will all come down to the data.
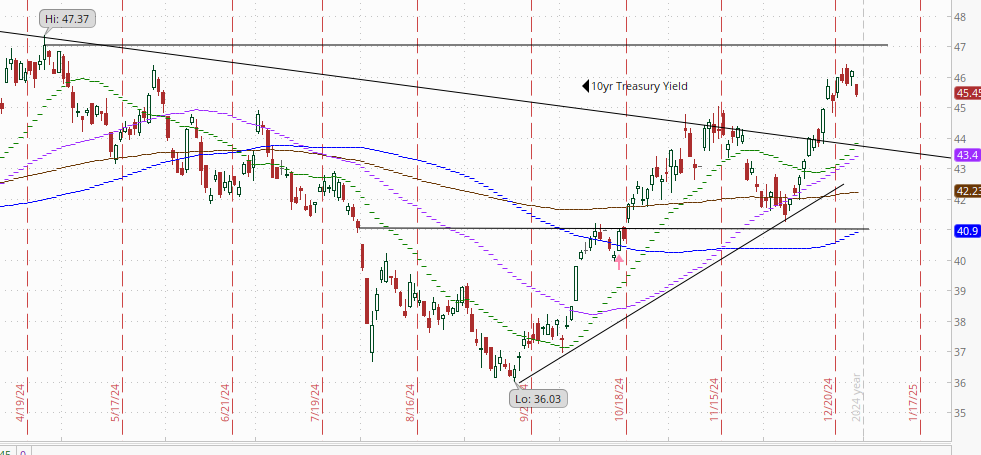
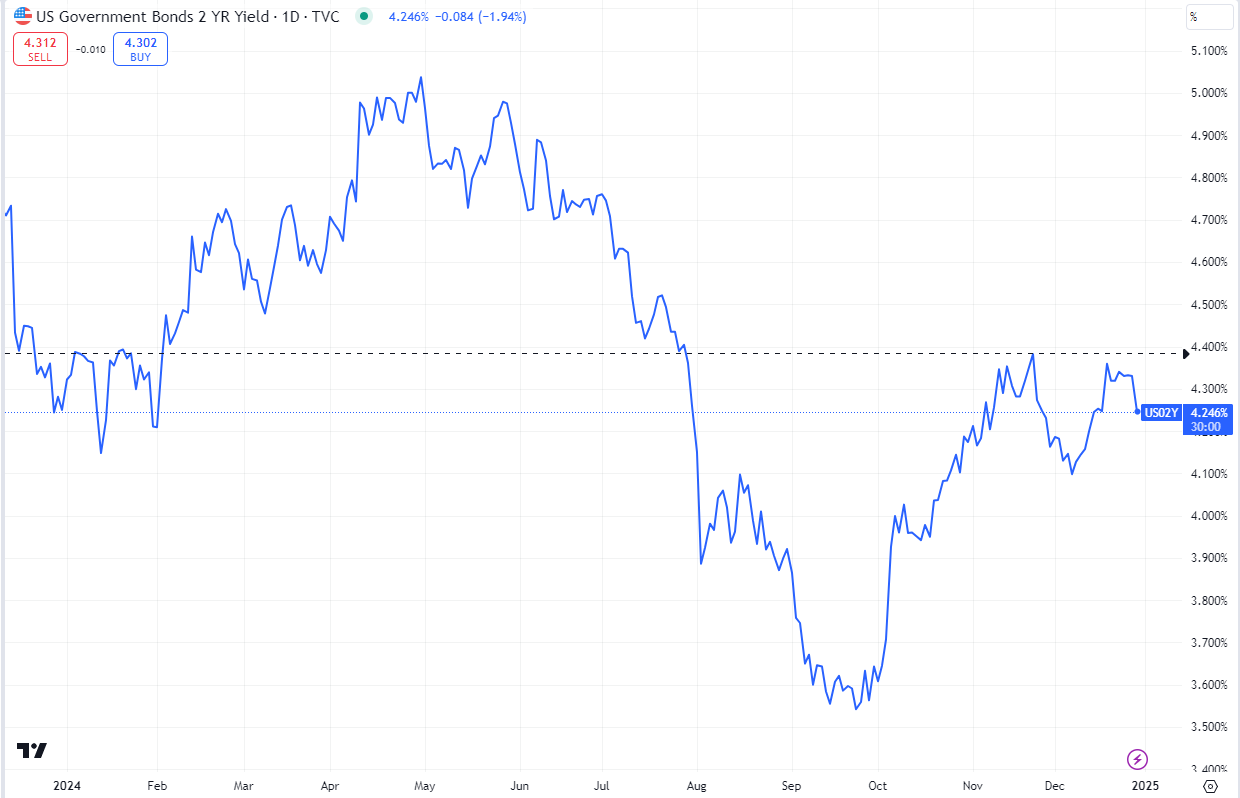
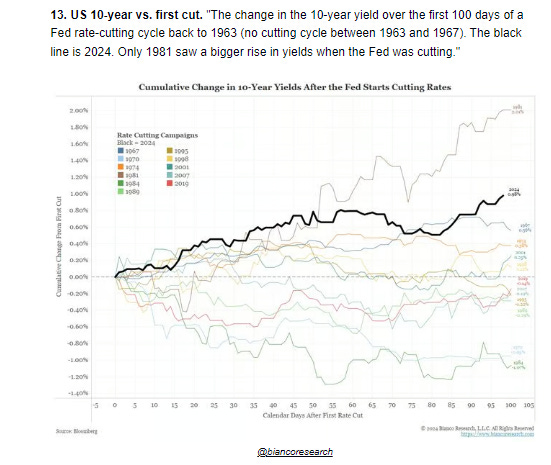
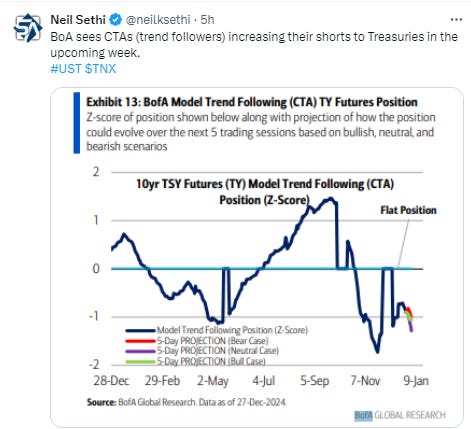
Treasury yields eased back as bonds benefitted from rebalancing flows with the 10yr yield down -7bps at 4.55%, from the highest close since May to a 1-week low, still +16bps since the Dec FOMC meeting (& +79bps from the Sept FOMC meeting), as I’ve said the past 2 weeks “still eyeing the 4.7% level” (although looks like they might take a dip first). The 2yr yield, more sensitive to Fed policy, was -8bps lower at 4.25%, a 2-week low, as rate cut bets increased as noted above.
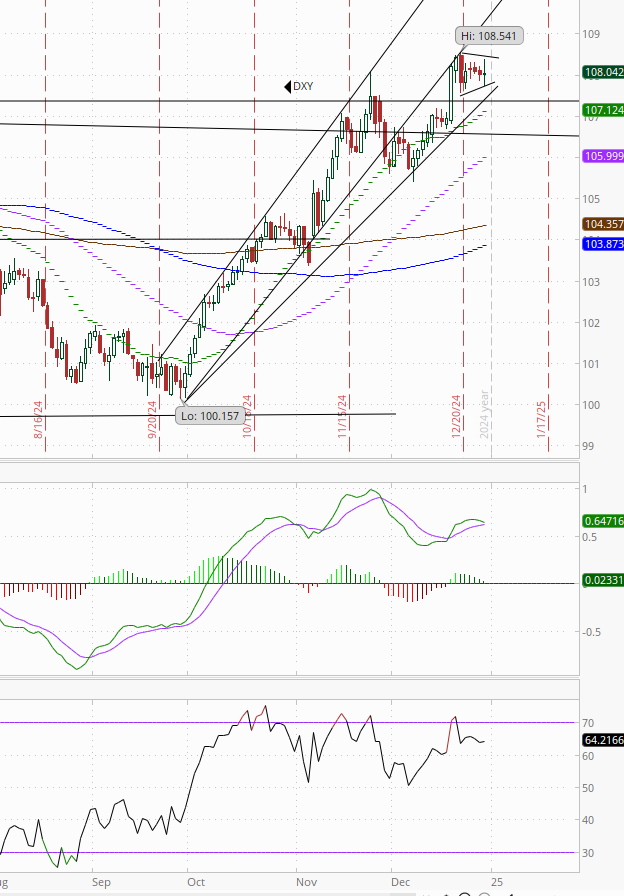
Dollar ($DXY) little changed for a 5th day creating a bit of a flag pattern. It remains just below last week’s near 2-yr highs. Daily MACD and RSI tilt positive.
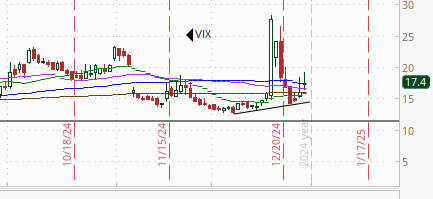
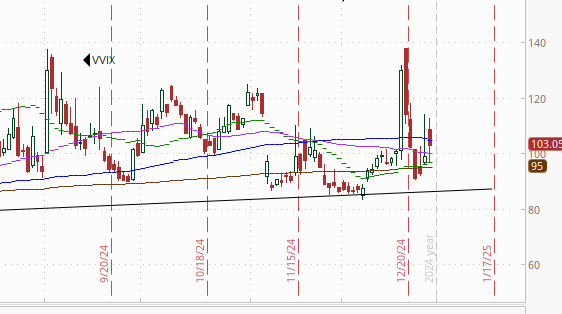
The VIX moved higher again, although again finished off the highs of the day, at 17.4 (consistent w/1.1% daily moves over the next 30 days), after falling under 16 for the 1st time post-FOMC last Tuesday, and the VVIX (VIX of the VIX) back over the 100 “stress level” identified by Nomura’s Charlie McElligott (consistent with “elevated” volatility and daily moves in the VIX over the next 30 days (normal is 80-100)).
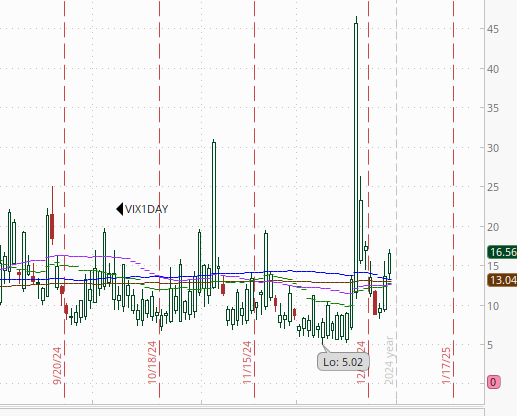
1-Day VIX continues to climb now over 16 at 16.6, after seeing the lowest close since before the Dec FOMC meeting last Tuesday, looking for a move of 1.05% tomorrow.
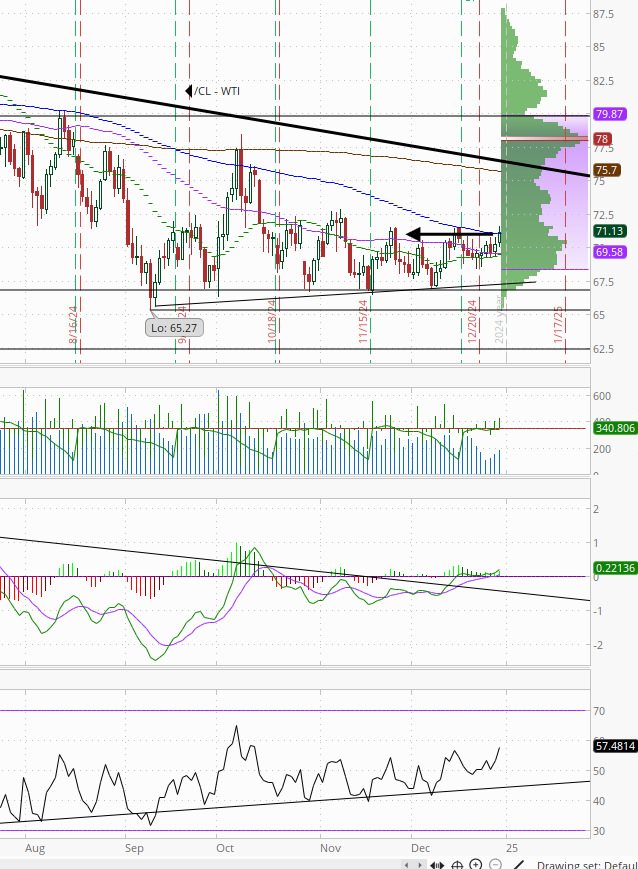
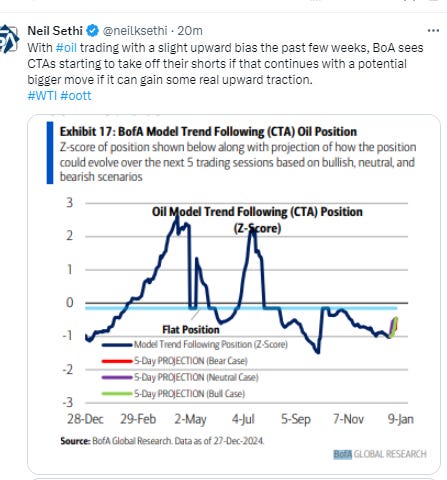
WTI up for a second day, moving to the top of its range since November, and closing over the 100-DMA for the 1st time since early Oct. Daily MACD & RSI are also positive with the latter the highest since early Oct as well. I’ve said the past 2+ weeks, “it needs to get over the 100-DMA which seems to have become resistance since August, then the $72.50 level,” and it took the first step today. We’ll see if it continues.
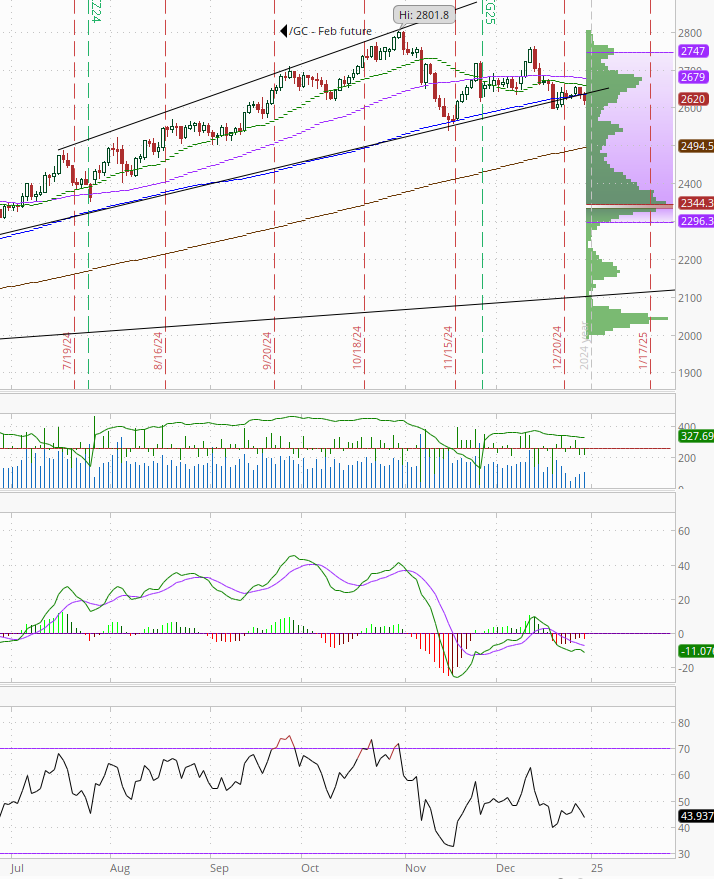
Gold fell back under its 100-DMA again, although remains above last week’s lows. Needs to hold those. Its MACD and RSI remain negative for now as noted the two weeks.
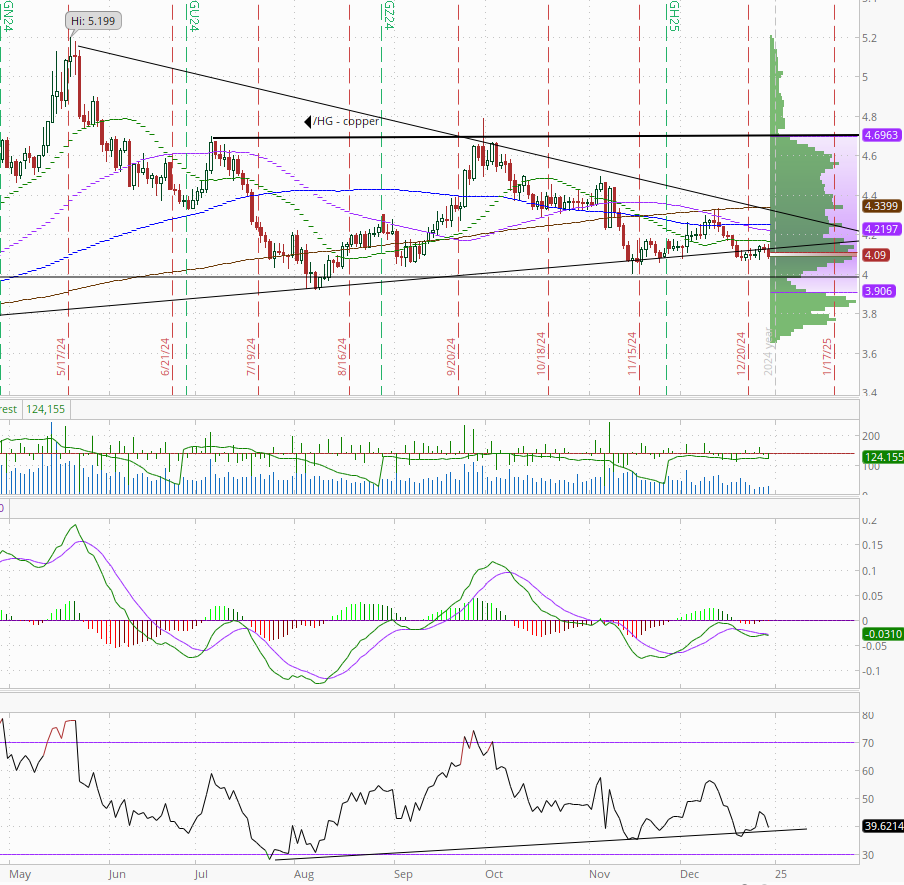
Copper (/HG) fell back under the uptrend line running back to Oct ‘23. Its RSI and MACD remain negative for now.
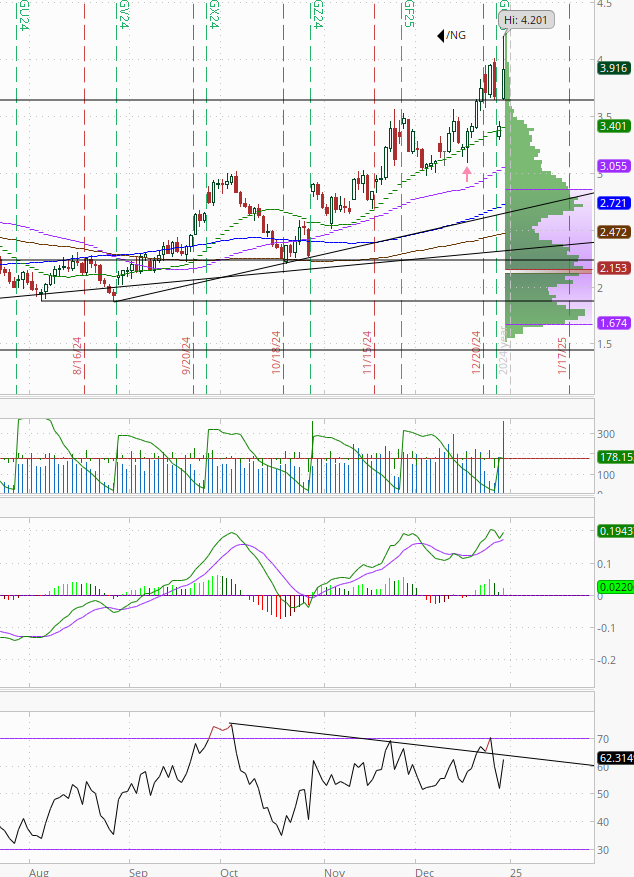
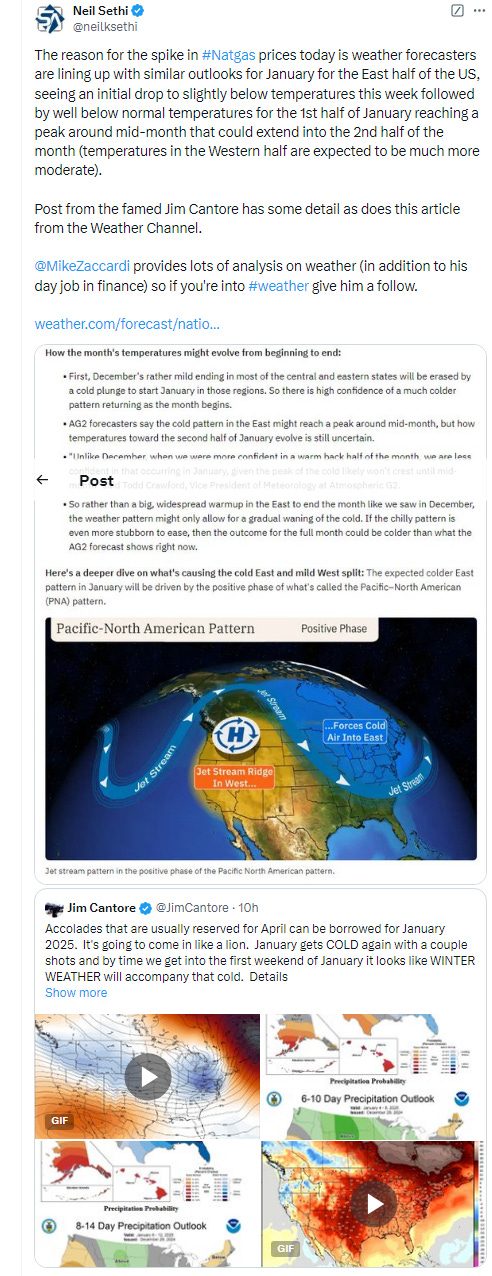
Nat gas (/NG) had quite the day. Forecasts over the weekend lined up for a very cold start to January (see post below) which saw it jump 10% at the open and run up well over 20% at one point before falling back to end the day up 15%. So we got a weird technical pattern of a big gap up, green candle, but huge wick (which is supposed to mean buyers rejected prices in that area and is thought to be the start of a reversal pattern if followed by a down day tomorrow, but we’ll see). Overall though it’s back above the $3.65 breakout level but still hasn’t been able to close over $4. Daily MACD and RSI remain positive for now (though we still have the negative RSI divergence).
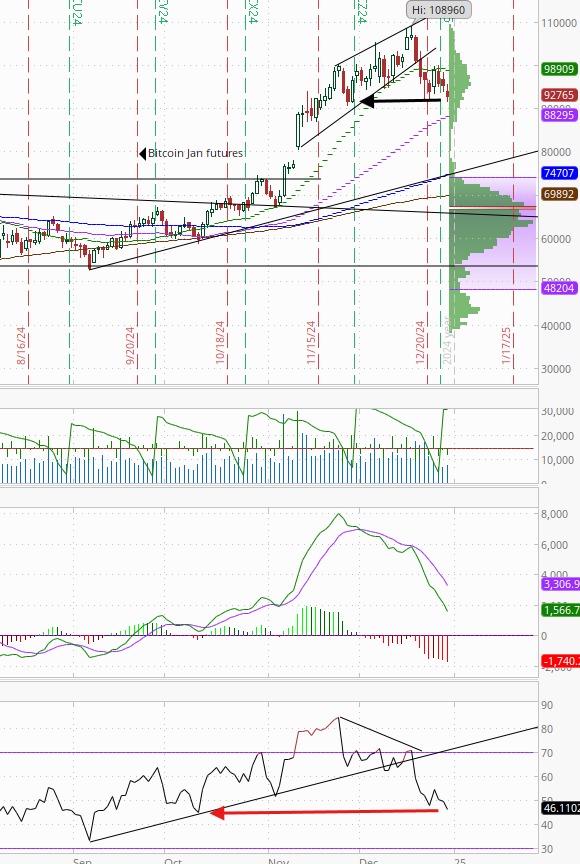
Bitcoin futures fell for 3rd day to lowest close in a month. The daily MACD remains very weak, and the RSI is the weakest since mid-October.
The Day Ahead
In US economic data we’ll wrap up the year with another light day with just the two main repeat buyer home price reports (FHFA & S&P).
No Fed speakers on the calendar and no Treasury auctions.
Also no earnings of note.
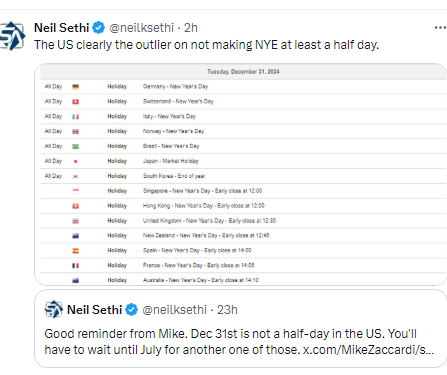
Ex-US light as well with most all the rest of the world either off or with a half day. We will though get China’s official PMIs.
Link to X posts - Neil Sethi (@neilksethi) / X (twitter.com)
To subscribe to these summaries, click below (it’s free!).
To invite others to check it out,


