Markets Update - 12/31/24
Update on US equity and bond markets, US economic reports, the Fed, and select commodities with charts!
To subscribe to these summaries, click below (it’s free!).
To invite others to check it out (sharing is caring!),
Link to posts - Neil Sethi (@neilksethi) / X (twitter.com)
Note: links are to outside sources like Bloomberg, CNBC, etc., unless it specifically says they’re to the blog.
Happy New Year.
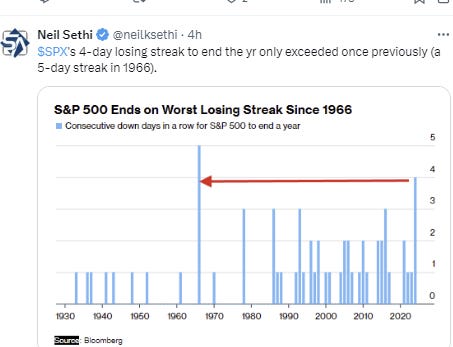
Santa, who I said Friday took off early for the weekend, and remained MIA on Monday was also mostly absent Tuesday as the S&P 500 finished down once again as bond yields moved higher, its 1st time finishing down for the last four sessions of the year since 1966. Overall, though, it was just a blip in a year which saw the S&P 500 surge 23.3%, building on a gain of 24.2% from 2023. The two-year gain of 53% is the best since 1997-98. Meanwhile, the Dow added 12.9%, while the Nasdaq outperformed with a gain of 28.6%. Both also closed lower Tuesday.
Despite the strong year-to-date performance, Wall Street struggled in December, with investors taking profits in some of 2024′s biggest winners and fears mounting over rising rates into year-end. The Dow ended the month down -5.3%, the S&P 500 fell -2.5%, and the RUT had its worst month since 2022. The Nasdaq was the only one able to manage any gain (+0.5%).
Tuesday, the market-cap weighted S&P 500 was -0.4%, the equal weighted S&P 500 index (SPXEW) -0.1%, Nasdaq Composite -0.8% (and the top 100 Nasdaq stocks (NDX) -0.9%), the SOX semiconductor index -0.9%, and the Russell 2000 +0.1%.
Morningstar style box at last wasn’t all red for the first session in three showing underperformance by growth.
Market commentary:
It sort of makes sense, if you think about it,” Bespoke Investment Group co-founder Paul Hickey told CNBC’s “Closing Bell: Overtime” on Monday. “You go into the end of the year with market up a lot, you’re coming in with a new administration — so the uncertainty is going to be there. You can’t fault investors for ringing the register a little bit here.”
Phillip Toews, CEO and portfolio manager at Toews Corporation, said a potential move above 5% for the 10-year yield is a risk for Wall Street entering the new year. “A continued trend like that looks really bad for both the stock and the bond market. And that could just easily happen, even absent Fed action, even absent inflation being even more stubborn if it has been, if the yield curve just normalizes,” Toews told CNBC.
“I think a lot of what drove that enthusiasm is you had good developments on all those fronts in 2024. You had inflation on a downward trajectory, the Fed coming out aggressively in September when they started cutting rates,” said Yung-Yu Ma, chief investment officer for BMO Wealth Management. “And for a lot of the time you had a 10-year Treasury yield that was very well behaved, along with earnings growth. So you got everything together at once that was going well.”
“If we have high valuations, and a lot of this is priced in, what is the next catalyst for the next 10% move? And if that’s not obvious, then I think, at least right now at the end of the year, we’re just getting people locking in a lot of profits,” Ma added.
In individual stock action, shares of U.S. Steel jumped 7% after the Washington Post reported that Nippon Steel sent the Biden administration an updated acquisition proposal.
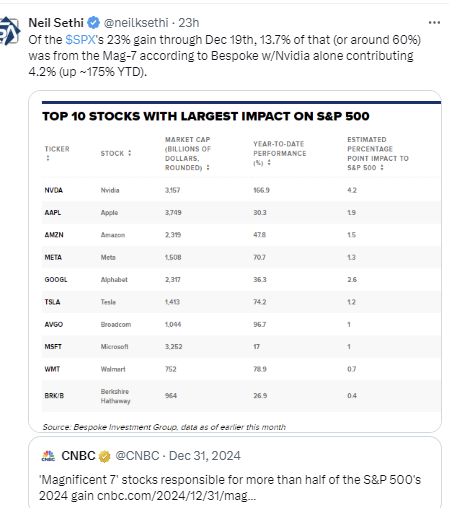
Most stocks in the S&P 500 ended the month in the red, with only a few more than 60 names in the broad market index managing to come out higher. Broadcom, Tesla and Lululemon were the top gainers, respectively. Broadcom gained a whopping 44% this month alone, while Tesla gained more than 21.5%. Megacap tech stocks Alphabet, Amazon and Apple also ended higher. Outside of technology, Boeing, Ulta Beauty and Darden Restaurants raked in gains in December. Texas Pacific Land, CVS Health, UnitedHealth and Omnicom Group were among the biggest losers, as were several homebuilders, including Lennar, Builders FirstSource and Pultegroup
Some notable movers from BBG.
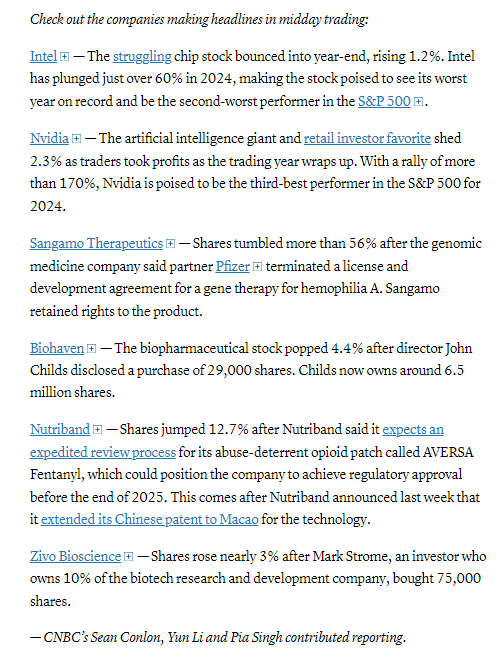
Some tickers making moves at mid-day from CNBC.
In US economic data we just got the repeat home price indices which showed continued but slowing home price growth in October.
Link to posts - Neil Sethi (@neilksethi) / X (twitter.com) for more details.
The SPX failed again at retaking its 50-DMA. As noted Monday, “that’s a negative technical pattern. Adding to that the daily MACD remains weak, and the RSI is under 50, so we look lower until it can get back over the purple line.”
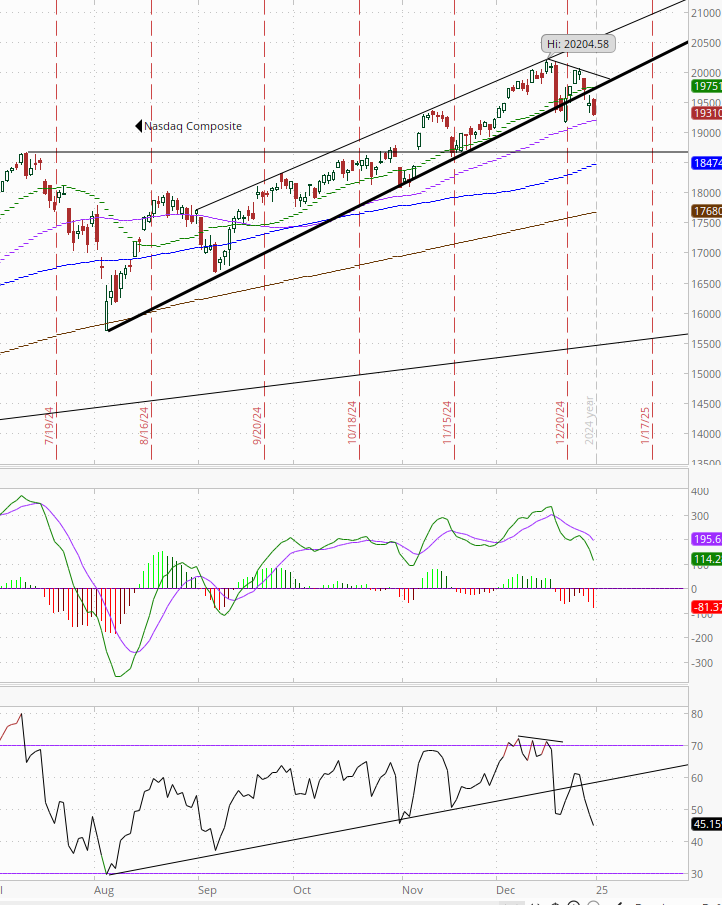
The Nasdaq Composite for its part fell back to its 50-DMA, back under its uptrend channel back to August. Its daily MACD remains weak, and its RSI is also now under 50.
RUT (Russell 2000) for its part remains under its 100-DMA. Daily MACD & RSI remain the weakest of the three.
Equity sector breadth from CME Indices at least wasn’t all red as it was Fri & Mon, but like those days we saw energy in the lead (the only sector up over 1%) and like Fri the megacap growth sectors took the bottom 3 spots. Two of them were down around -1% or more, but a big improvement from seeing 8 sectors down that much Mon (and 4 Fri).
Stock-by-stock $SPX chart from Finviz confirms much of the declines were in the biggest names while many other areas saw a decent amount of green.
Positive volume (the percent of volume traded in stocks that were up for the day) improved on the NYSE getting back over 50% after falling well underneath the prior two sessions at 59%, a very solid reading with the SPX finishing lower. The Nasdaq remained near recent levels at 55%, again an excellent result given the index was down around -1%, the 7th consecutive day over 50%. Positive issues (percent of stocks trading higher for the day) improved but were still sub-50% on Nasdaq at 62 & 44% respectively.
New highs-new lows (charts) also improved with the NYSE up to -40 from -140 (still negative for a 12th session), while the Nasdaq moved to -27 from -68 (negative for the 11th session in 13). both are back above their 10-DMAs although the NYSE continues to head lower (more bearish) the lowest since Nov ‘23. The Nasdaq’s though is curling up.
FOMC rate cut probabilities from CME’s #Fedwatch tool edged back but still pricing in a 2nd cut in 2025 at better than 50% (55%) from 46% Friday. Overall 2025 cut expectations now 43bps (from 38 Friday). First cut remains in March at 53%. Chance of no cuts at 13% (from 17%).
I had previously noted the market seemed quite aggressively priced to me, and that I continued to expect at least two cuts, and it seems the market is moving in my direction. Of course it’s all just a big guess as we know it will all come down to the data.
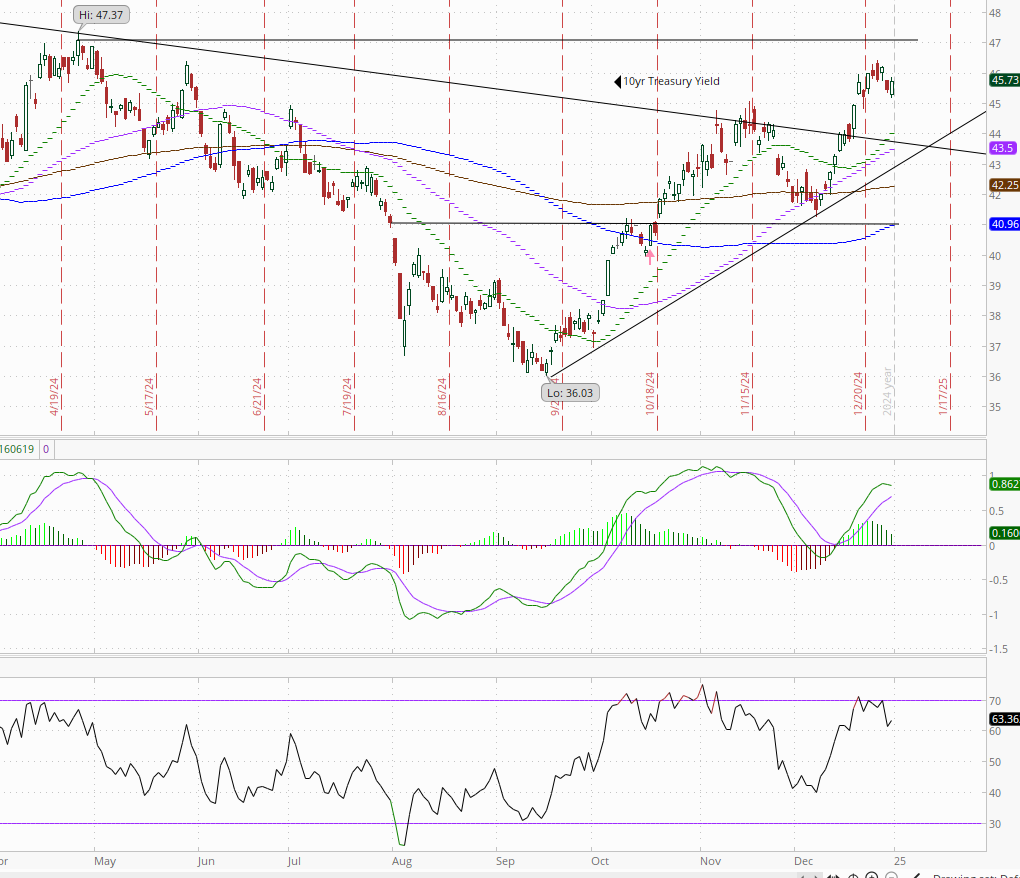
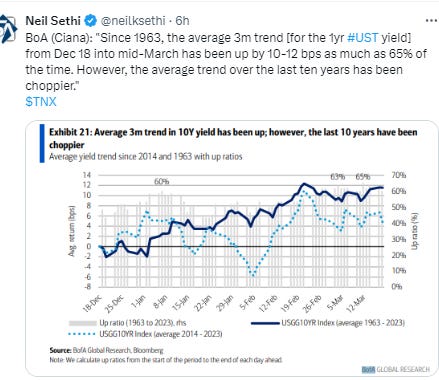
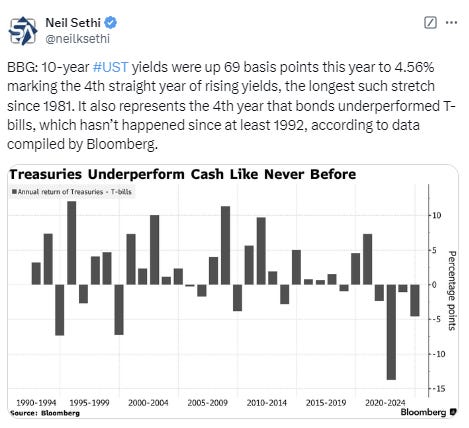
Longer duration Treasury yields rebounded after falling to 1-week lows early in the session with the 10yr yield up +2bps at 4.57%, 6bps below the recent high, and +18bps since the Dec FOMC meeting (& +81bps from the Sept FOMC meeting), as I’ve said the past 2 weeks “still eyeing the 4.7% level” (although looks like they might take a dip first). The 2yr yield, more sensitive to Fed policy, was -1bp to 4.24%, a 2-week low.
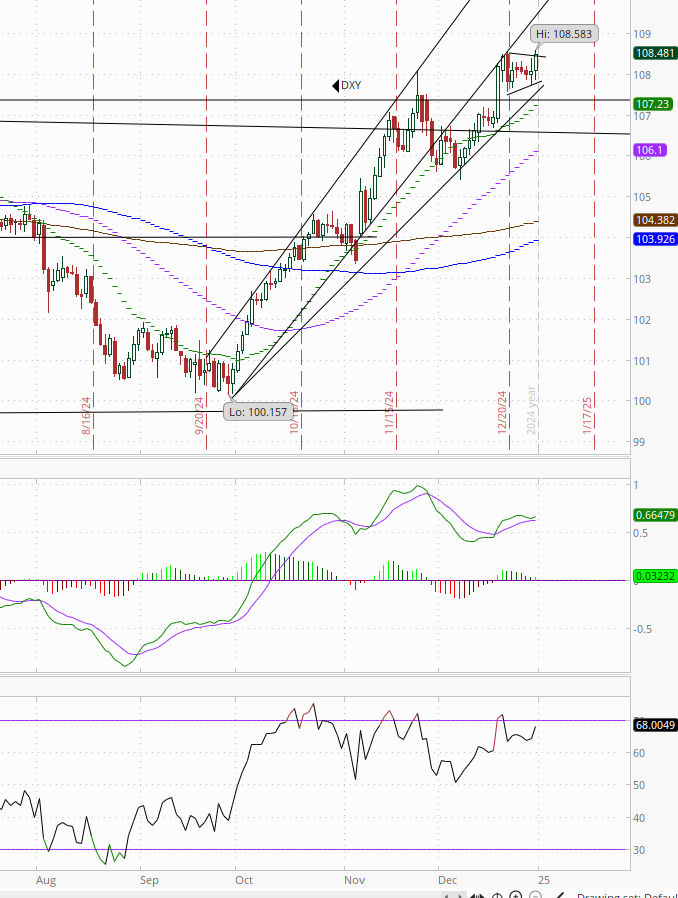
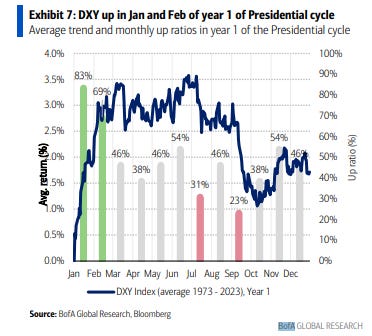
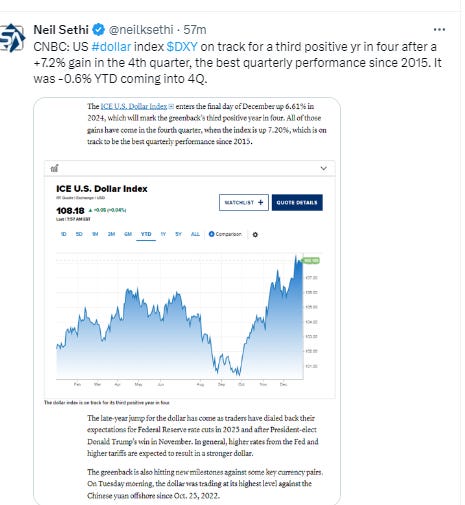
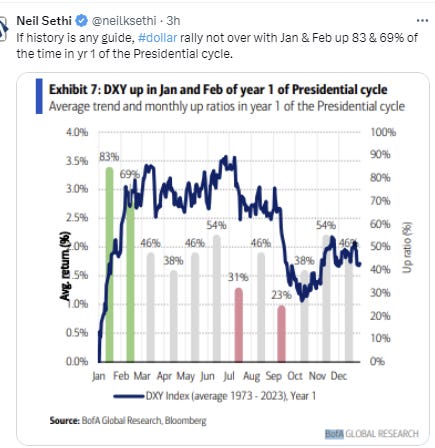
Dollar ($DXY) ran to the top of its recent range (actually highest close since Nov ‘22) looking to potentially break out of its flag pattern (which would measure to over $109. Daily MACD and RSI tilt positive.
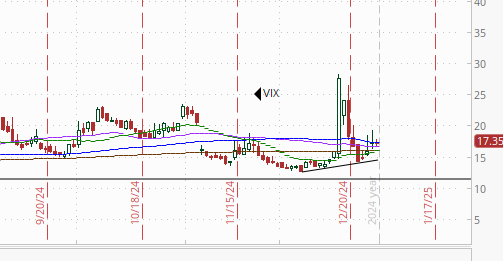
The VIX was little changed remaining relatively elevated at 17.4 (consistent w/1.1% daily moves over the next 30 days), after falling under 16 for the 1st time post-FOMC Christmas Eve, and the VVIX (VIX of the VIX) remained at 104, over the 100 “stress level” identified by Nomura’s Charlie McElligott (consistent with “elevated” volatility and daily moves in the VIX over the next 30 days (normal is 80-100)).
1-Day VIX edged back but still remains relatively elevated at 15.3, well above the sub-10 readings we were seeing before the Dec FOMC meeting, looking for a move of 0.96% Thursday.
WTI up for a third day, moving to the top of its range since November, and closing over the 100-DMA for the 1st time since early Oct. Daily MACD & RSI are also positive with the latter the highest since early Oct as well. I’ve said the past 2+ weeks, “it needs to get over the 100-DMA which seems to have become resistance since August, then the $72.50 level,” and it’s done the first, let’s see if it can do the second next week.
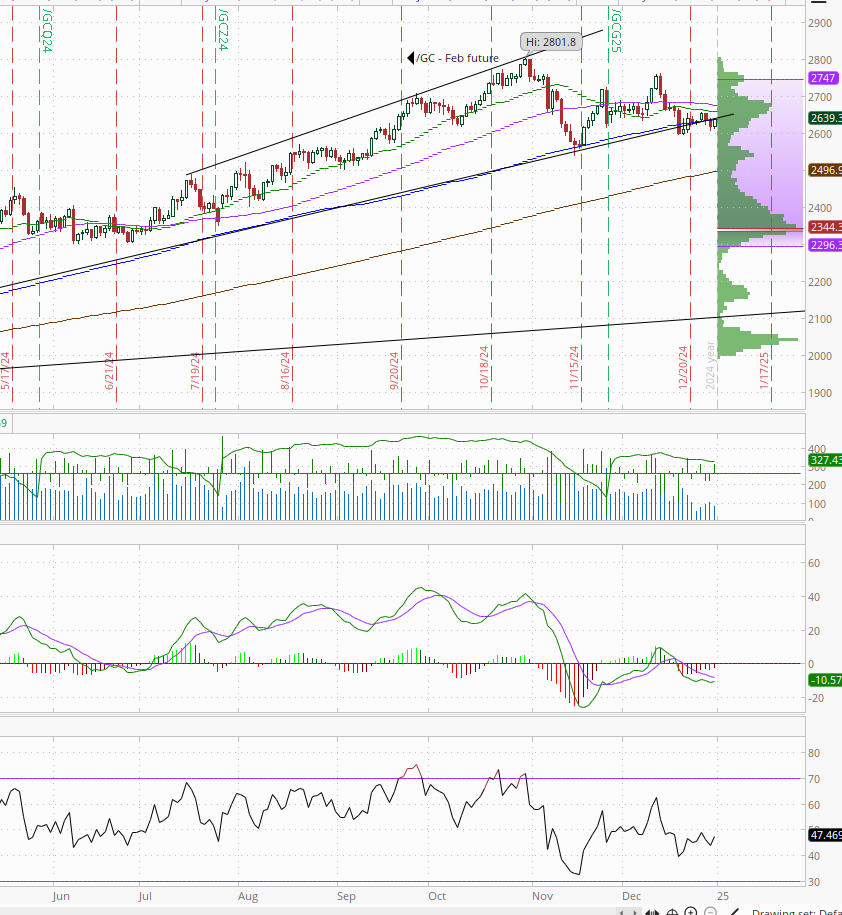
Gold up but remained under its 100-DMA. Its MACD and RSI remain negative for now as noted the last two weeks.
Copper (/HG) fell to the lowest close since August pushing back towards the $4 mark it has only tested once (for one session) since then. Its RSI and MACD remain negative for now with the former the least since Aug as well.
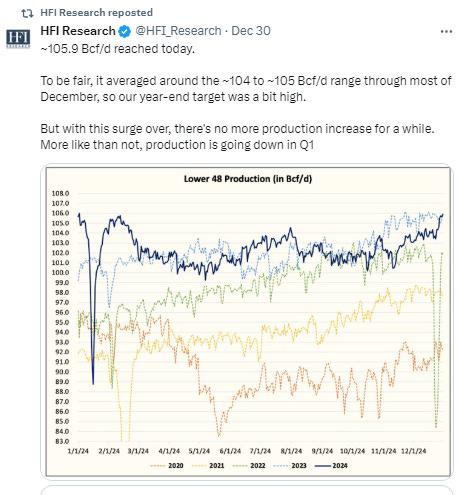
Nat gas (/NG) remains very volatile falling sharply (not sure of the catalyst but it could have been on high production as well as a warmer turn in the weather forecasts) and closing just below the $3.65 breakout level. I noted Monday “we got a weird technical pattern of a big gap up, green candle, but huge wick (which is supposed to mean buyers rejected prices in that area and is thought to be the start of a reversal pattern if followed by a down day tomorrow, but we’ll see).” Well we got the down day (plus the close under the key level), so I wouldn’t at all be surprised to see it fall at least back down towards the 20-DMA (green line) that’s provided support. Daily MACD and RSI remain positive for now (though we still have the negative RSI divergence).
Bitcoin futures able to break 3-day losing streak that took them to the lowest close in a month. The daily MACD remains very weak though, and the RSI is just off the weakest since mid-October.
The Day Ahead
In US economic data we’ll kick off the new year with a good amount of data points (for this week) in the weekly initial and continuing claims at 8:30 ET and EIA Crude Oil Inventories at 10:30 ET, plus final December S&P Global US Manufacturing PMI at 9:45 ET and November Construction Spending at 10:00 ET.
No Fed speakers scheduled, Treasury auctions, or notable earnings.
Ex-US we’ll get final Dec manufacturing PMI’s, UK house prices, and EU Nov lending data.
Link to X posts - Neil Sethi (@neilksethi) / X (twitter.com)
To subscribe to these summaries, click below (it’s free!).
To invite others to check it out,


