
Markets Update - 1/23/26
Update on US equity and bond markets, US economic data, the Fed, and select commodities with charts!

To subscribe to these summaries, click below (it’s free!).
To invite others to check it out (sharing is caring!),
Link to posts - Neil Sethi (@neilksethi) / X
Note: links are to outside sources like Bloomberg, CNBC, etc., unless it specifically says they’re to the blog. Also please note that I do often add to or tweak items after first publishing, so it’s always safest to read it from the website where it will have any updates.
Finally, if you see an error (a chart or text wasn’t updated, etc.), PLEASE put a note in the comments section so I can fix it.
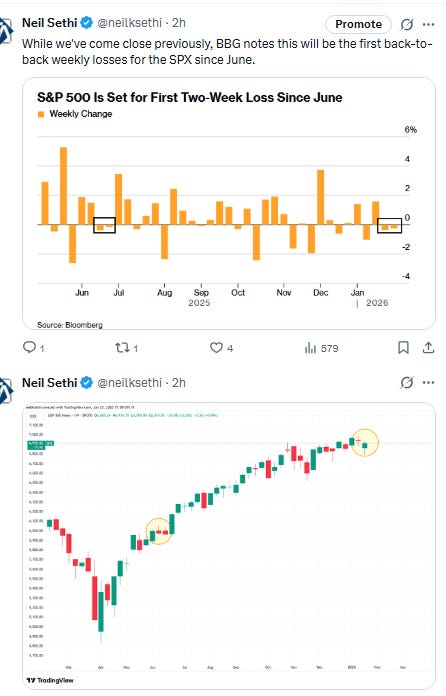
US equity indices opened today’s session trading modestly lower with the SPX on track for its first back-to-back losses since June. That was despite shares of Nvidia and Advanced Micro Devices rising more than 1% and about 3%, respectively, in early trading as people familiar with the matter told CNBC that Nvidia CEO Jensen Huang is planning to visit China in the coming days as Bloomberg reported Chinese officials have told the country’s largest tech firms including Alibaba Group they can prepare orders for Nvidia Corp.’s H200 AI chips. Intel shares, in contrast, tumbled -12% (they would finish -17%, their worst day since Aug 2024) after the chipmaker reported a disappointing first-quarter outlook, warning it was struggling with manufacturing problems.
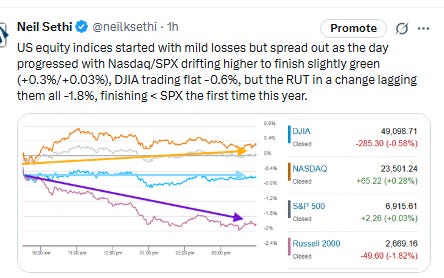
The equity indices spread out as the day progressed though with Nasdaq/SPX drifting higher to finish slightly green (+0.3%/+0.03% respectively), while the DJIA traded flat ending -0.6%, but the RUT, for the first time this year, lagged them all -1.8%, and finishing under SPX after the longest run of outperformance since 1996 (14 sessions).
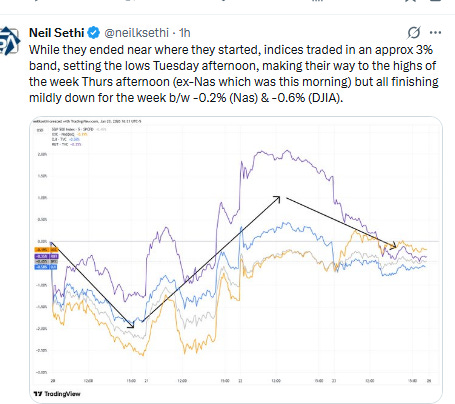
For the week, like a player running sideways back and forth across the field, while they traveled around 3%, indices ended up around where they started, after setting the lows of the week Tuesday afternoon, then making their way to the highs of the week Thursday afternoon (except the Nasdaq which made its highs this morning), but all finishing mildly down between -0.2% (Nasdaq) & -0.6% (DJIA). Chart is below.
Elsewhere, bond yields edged lower, but the dollar fell more abruptly, completing its worst two-day loss since April. Natgas though jumped another +10%, while gold completed one of its best weeks since 2008. Copper also pushed higher to set a weekly all-time high, and crude got to the highest since late October. Just bitcoin sat out the party little changed and down for the week.
The market-cap weighted S&P 500 (SPX) was UNCH, the equal weighted S&P 500 index (SPXEW) -0.5%, Nasdaq Composite +0.3% (and the top 100 Nasdaq stocks (NDX) +0.3%), the SOXX semiconductor index -1.2%, and the Russell 2000 (RUT) -1.8%.
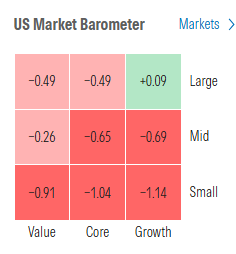
Morningstar style box saw just large cap growth escape the red.
Market commentary (note almost all were before Trump took tariff threat completely off the table):
“I hope that the geopolitical situation starts to ease so that the market can focus on substance versus noise,” said Andrea Gabellone, head of global equities at KBC Global Services. “Full-year 2026 guidances are, in my view, the most crucial piece of data the market has been waiting for quite some time, given valuations and growth expectations.”
“This week’s market action is an important reminder for investors to not allow political headlines out of Washington to affect their portfolio, and to be opportunistic when stocks succumb to headline risk,” said Alexander Guiliano at Resonate Wealth Partners. “The stock market is likely to remain headline sensitive for some time.”
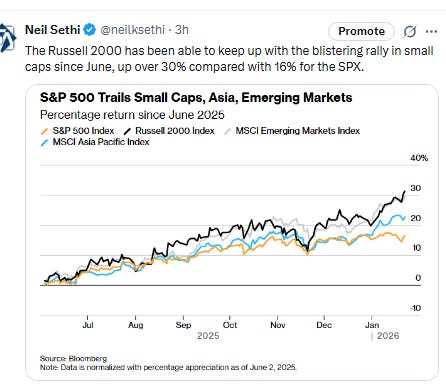
“Despite signs of stabilization in the labor market and broader economic improvement, growth remains fragile. The burden now sits with small caps to show that the swift rally is justified by earnings that can carry the index to new highs which keep performance ahead of the AI-fueled S&P 500.”
—Tatiana Darie, Macro Strategist, Markets Live.
“There is a clear shift in leadership underway, and while there will be pullbacks, we want to stick on the side of this new trend which is still in its early days, in our view,” said Jonathan Krinsky, chief market technician at BTIG.
Earnings resilience and stability in the rates market are crucial for stocks to shrug off geopolitical noise, according to Barclays Plc strategists led by Emmanuel Cau.
A slow start to the earnings season suggests geopolitics isn’t the only driver of stock market volatility, according to RBC Capital Markets strategists led by Lori Calvasina. They noted that analysts’ 2026 earnings growth forecast has fallen slightly while macro commentary remains cautiously optimistic on earnings calls.
“Investors remain conditioned to buy every dip — retail money rushed in during this week’s selloff, reinforcing a pattern that’s been in place since 2020,” said Mark Hackett at Nationwide. “That combination of broadening leadership and deeply ingrained buy-the-dip behavior continues to tilt the odds in favor of the bulls.” Stress-driven selloffs are becoming increasingly short-lived, and the latest one was not echoed in other technical indicators such as credit spreads, the put/call ratio, or financial conditions, Hackett noted. “Following the strong run to record highs, it is not unusual or unhealthy to see a period of consolidation,” he said. Hackett also added that the pattern in seven of the past eight quarters is that equity markets rally into earnings season but are met with volatility and market sluggishness, despite better-than-expected results, as skepticism arises, investors are more reactive and companies are unable to buy back shares due to earnings blackout periods.
Two big issues have mattered to U.S. equity investors this week, according to Thomas Martin, a portfolio manager at Globalt Investments. The first, of course, related to the tensions over Greenland that spurred a short-lived revival of the “Sell America” trade earlier this week. The second was a handful of strong economic reports that helped drive more gains for value stocks and small caps alike. The latest reading on weekly jobless claims showed layoffs remained low, while a reading on third-quarter GDP growth hinted at an accelerating economy. “You’ve had good economic news, and the consumer is doing OK,” Martin said. “Earnings haven’t been super well received by the markets, but I don’t really see any disasters there so far.”
Gregory Daco, chief economist of EY-Parthenon, identified two triggers that officials probably need to see to restart rate cuts in 2026: clearer, more durable evidence of disinflation and a renewed labor-market “downshift.” In a note, Daco said the first 2026 Fed rate cut is unlikely to occur before June — a view that is in line with that of fed-funds futures traders. “We anticipate 50 basis points of easing through 2026,” which is more than the single 25-basis-point rate cut for 2026 that Fed officials penciled in last December.
Policy uncertainty “absolutely” overshadows positive news from companies, said Steve Sosnick, chief strategist at Interactive Brokers. “It does make it much harder for management to plan... but what CEO is going to say, ‘the policy instability coming out of the White House is making it very difficult for me to manage my business?’”
“Typically, safe bonds and Treasuries have been a source of diversification during times of uncertainty, but particularly Treasuries haven’t provided any cushion over the past days,” said Philipp Lisibach, head of strategy and research at LGT Private Banking. “That’s also why gold continues to rally.”
Link to X posts - Neil Sethi (@neilksethi) / X for full posts/access to charts (all free).
In individual stock action:
A nearly 4% slide in Goldman Sachs weighed on the 30-stock index
Nvidia and Advanced Micro Devices were among those supporting the Nasdaq and the S&P 500, climbing 1.5% and more than 2%, respectively.. Other tech names like Microsoft saw a boost as well.
Companies making the biggest moves after-hours from CNBC.
None today.
Corporate Highlights from BBG:
Apple Inc. accused the European Commission of using “political delay tactics” to postpone new app policies as a pretense to investigate and fine the iPhone maker.
Meta Platforms Inc., the reigning leader in the growing smart glasses category, is being sued by another glasses maker over patent infringement in a case that also targets the US entity of eyewear giant EssilorLuxottica SA and its Oakley subsidiary.
Federal Communications Commission Chairman Brendan Carr sees “legitimate competition concerns” in Netflix Inc.’s proposed acquisition of Warner Bros. Discovery Inc.’s studios and streaming businesses, concerns he doesn’t share if Paramount Skydance Corp. were to acquire those assets.
SLB, the world’s largest oilfield-services provider, raised its dividend and posted fourth-quarter earnings that beat estimates as activity in the Middle East and other key regions accelerated and its data-center business rapidly expanded.
DoorDash Inc. and Uber Technologies Inc. lost a bid to block a New York City law requiring a tipping option be presented to customers at checkout from going into effect Monday.
Goldman Sachs Group Inc. boosted Chief Executive Officer David Solomon’s pay to $47 million, capping a year in which the investment bank’s shares soared and its leader reasserted his control at the top.
Capital One Financial Corp. reported adjusted earnings per share that missed the average analyst estimate. The company also agreed to acquire Brex, a financial-technology company that focuses on corporate expense management and accounting, for $5.15 billion.
Walgreens Boots Alliance Inc. has started selling vapes in some stores across the US, a surprise reversal after the drugstore chain stopped selling them more than six years ago amid concerns about their popularity with teens.
Software maker Databricks Inc. has lined up $1.8 billion of new financing from broadly syndicated loan investors and private credit lenders.
Affirm Holdings Inc. said it applied for a limited bank charter to help roll out additional financial-technology products for the buy-now, pay-later company’s US customers.
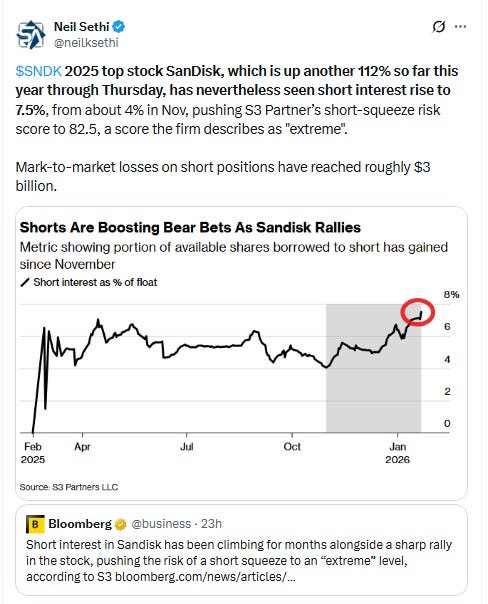
Short interest in Sandisk Corp. has been climbing for months alongside a sharp rally in the stock, pushing the risk of a short squeeze to an “extreme” level, according to S3 Partners LLC.
The online arm of Saks Global Enterprises won court approval to hire a liquidator to sell its inventory separately from the rest of the luxury retailer.
Deutsche Lufthansa AG faces the risk of having to block off almost the entire business-class section on its new Boeing Co. 787 aircraft for longer as seat certification drags out, an expensive setback at a time when more passengers are upgrading to the front of the cabin.
Ericsson AB proposed its first-ever buyback after fourth-quarter earnings beat analysts’ forecasts, boosted by the Swedish telecommunications equipment maker’s efforts to cut costs and raise margins in a sluggish market.
Thyssenkrupp AG is considering the sale of a roughly 30% stake in its Rothe Erde bearings business, people familiar with the matter said, in a deal that could value the asset at about €1.5 billion ($1.8 billion).
Pirelli & C. SpA’s biggest Italian investor said it won’t renew a shareholder agreement governing the tiremaker with China’s Sinochem Group, citing an inability to adapt the company’s governance to US legal requirements.
French authorities received a report of a second infant death, as a tainted formula crisis that’s engulfed Nestlé SA, Danone SA and Groupe Lactalis widens.
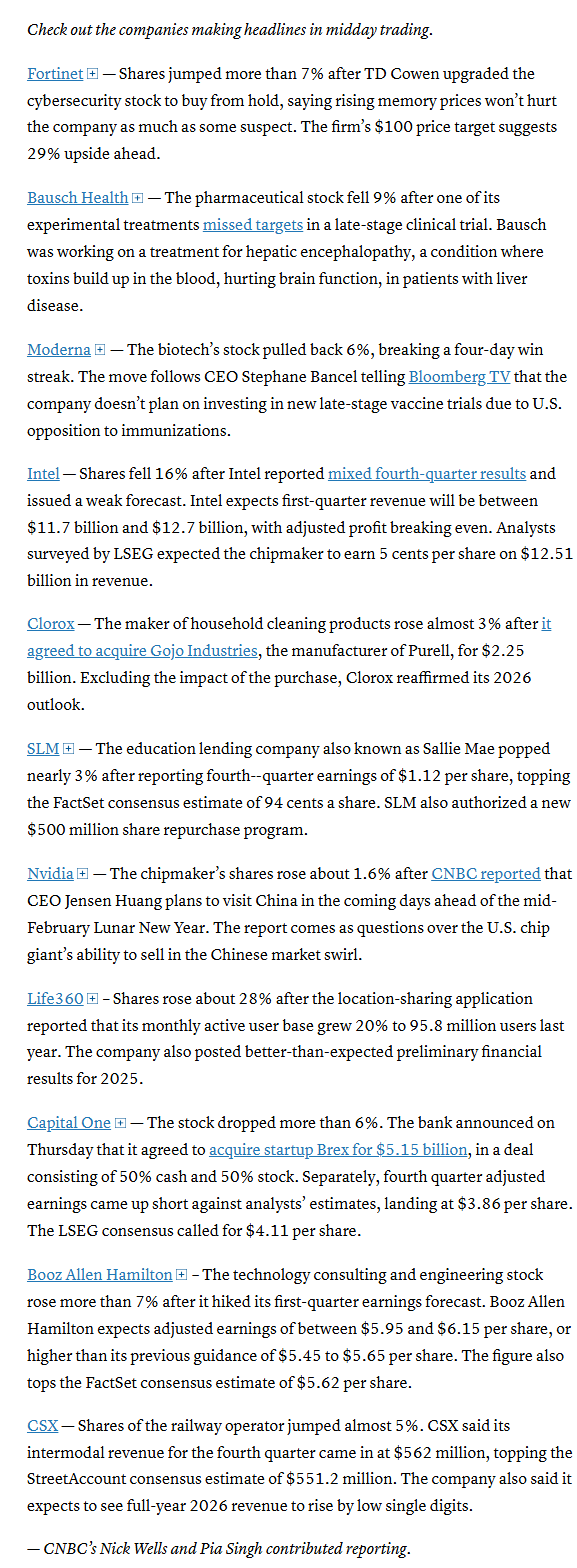
Mid-day movers from CNBC:
In US economic data:
All covered in the Substack articles:
Link to posts for more details/access to charts - Neil Sethi (@neilksethi) / X
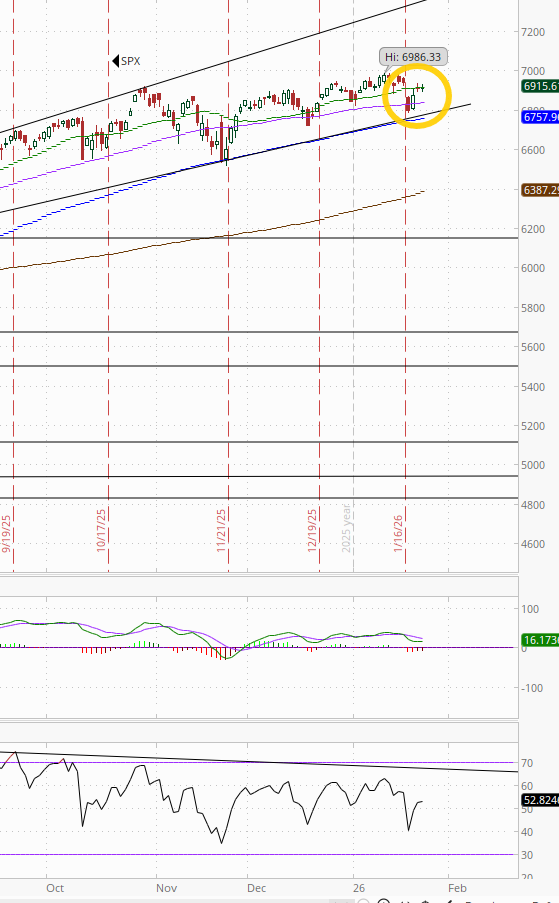
The SPX little changed still sitting right on the 20-DMA. The daily MACD remains in “sell longs” positioning while the RSI bounced from the weakest since Nov but continues to remain in divergence.
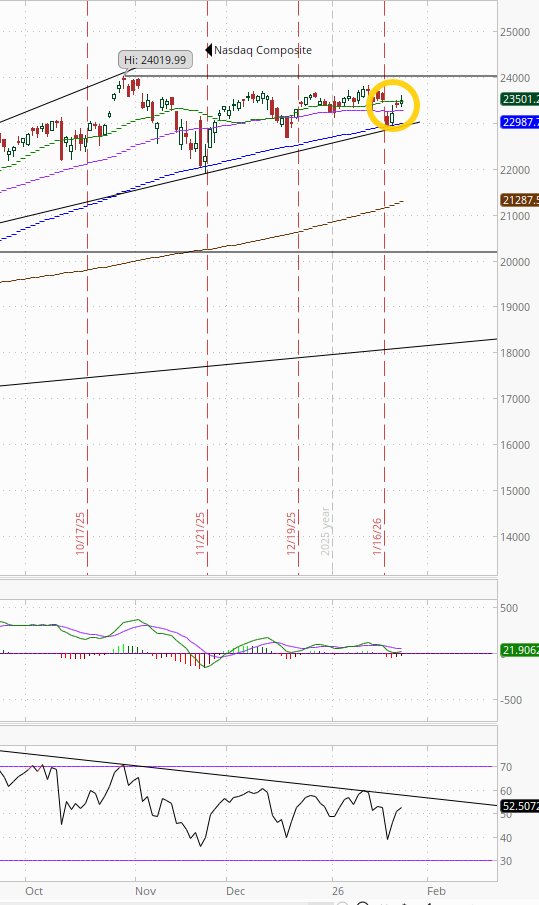
The Nasdaq Composite a similar story.
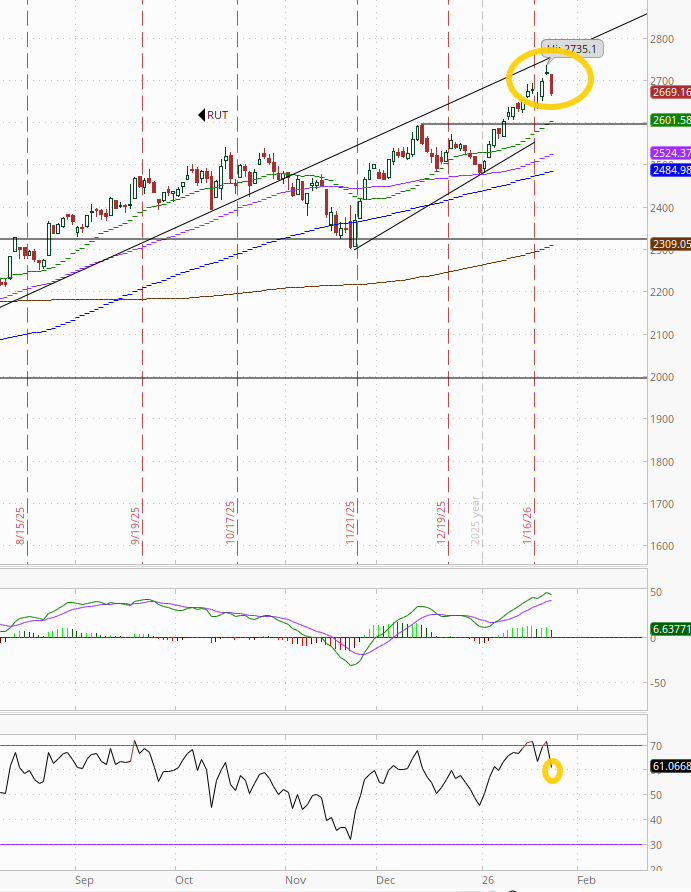
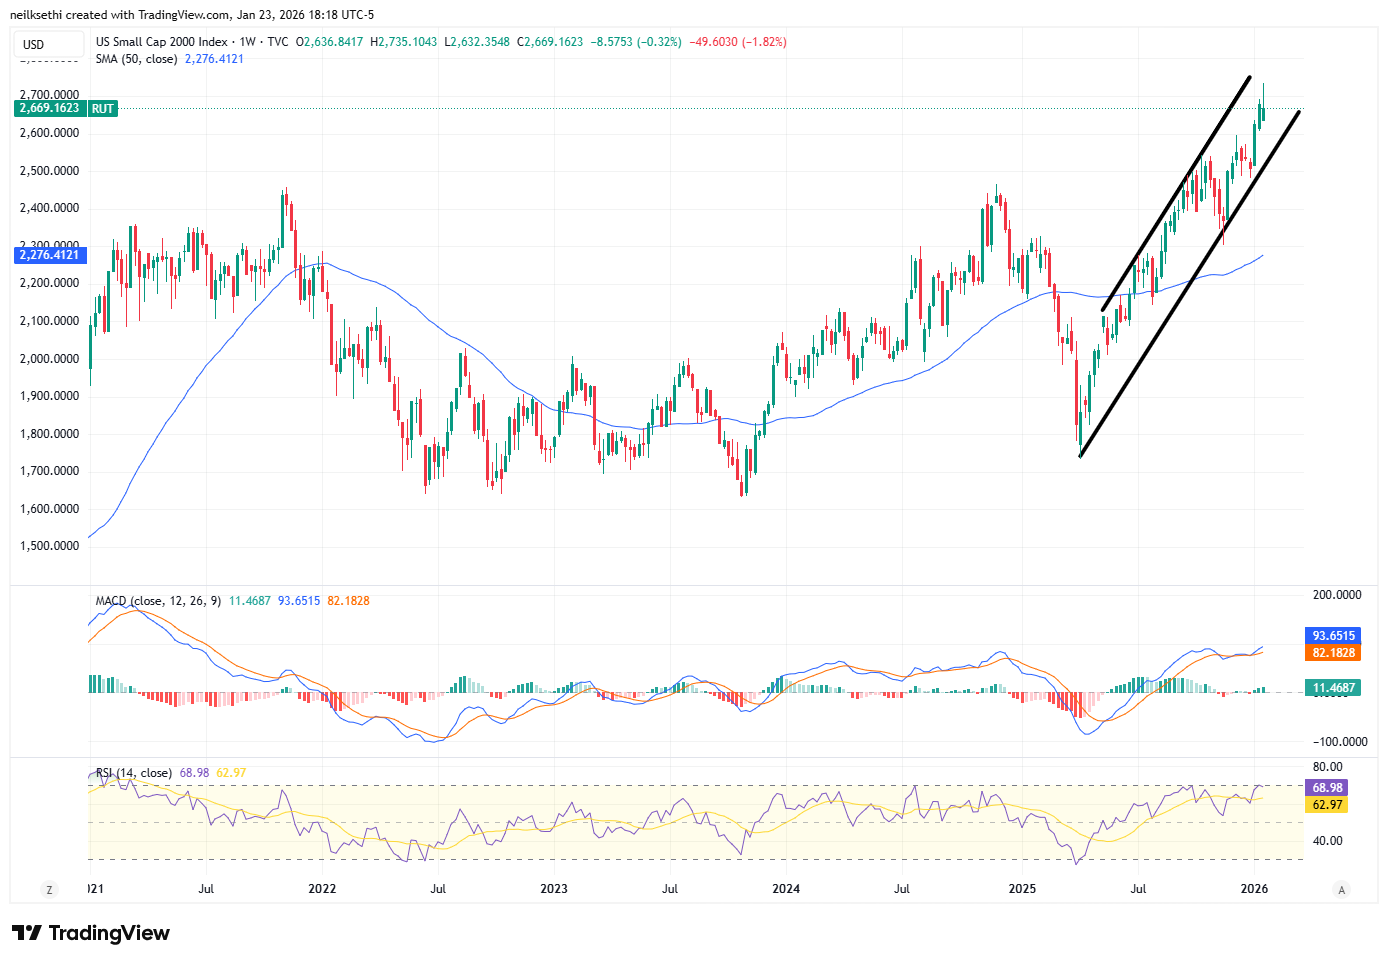
RUT (Russell 2000) remains the best chart of the bunch but a little less so after its worst day since Nov falling back from ATH territory. I’m not sure if that old trendline means anything but the last rally stopped there, so I’m going to leave it for now.
The MACD remains with a “go long signal,” but the RSI fell back to the least in a couple of weeks (I mentioned yesterday it had gotten to “levels that have seen the index stall out in the past year”).
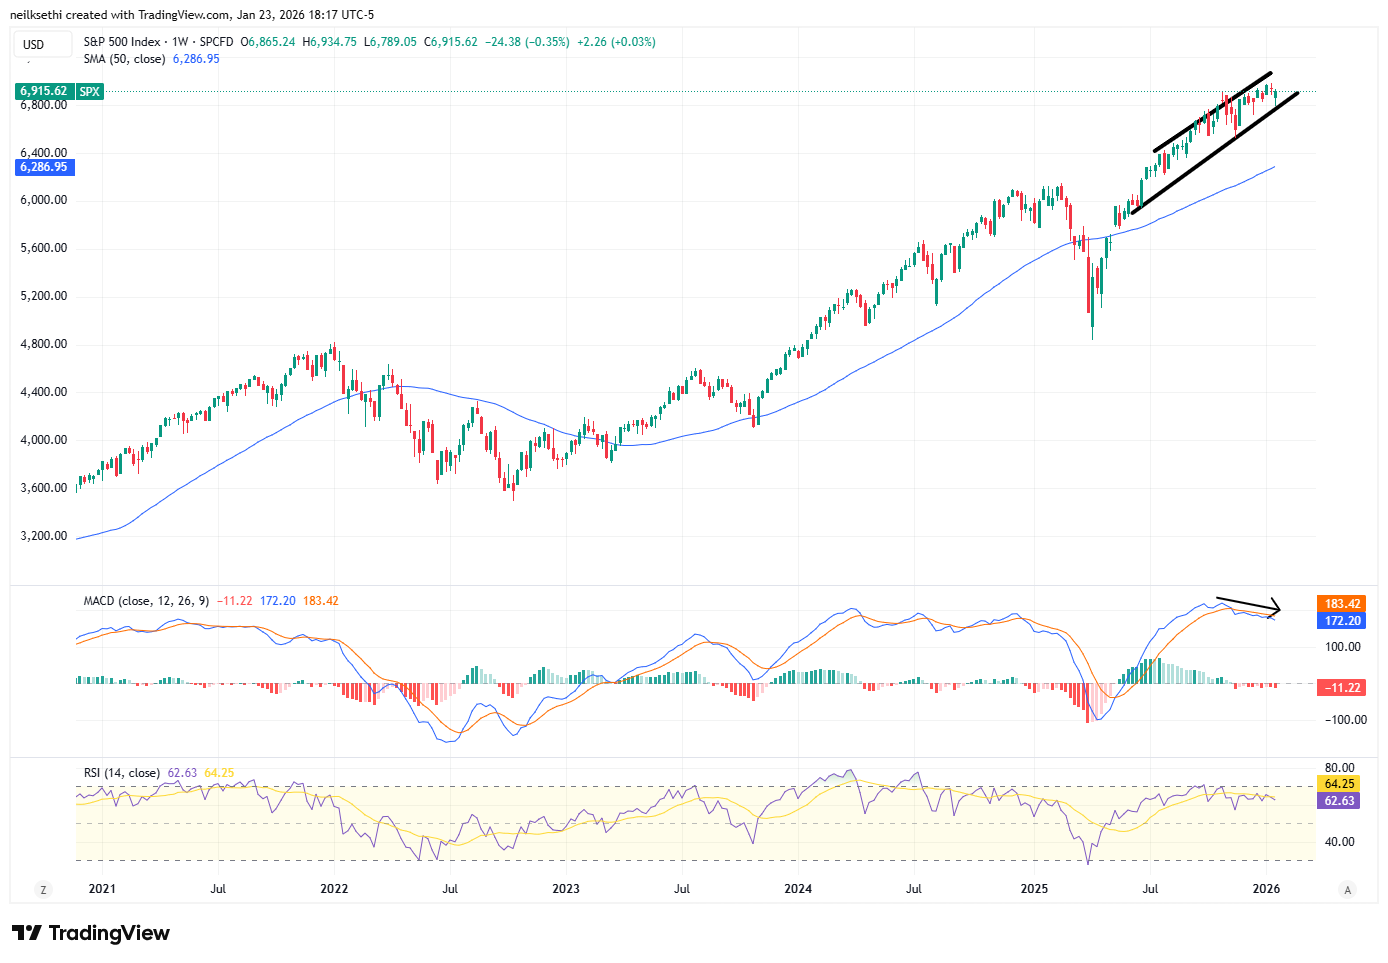
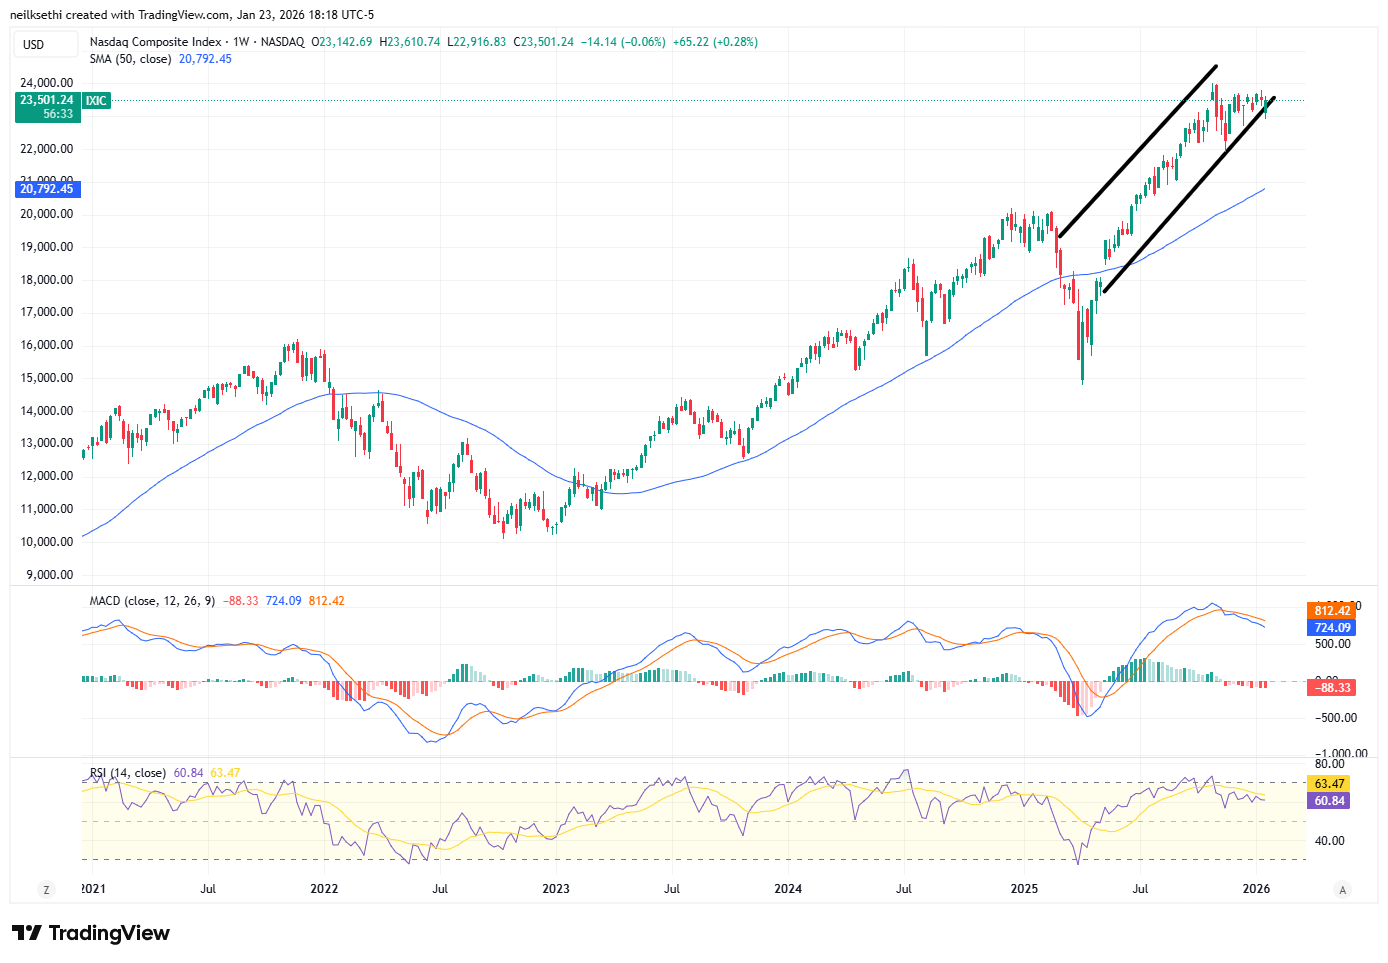
Weekly charts no major change remaining in their new channels but with the SPX and Nasdaq still seeing negative RSI and MACD divergences (lower highs). RUT the best of the bunch.
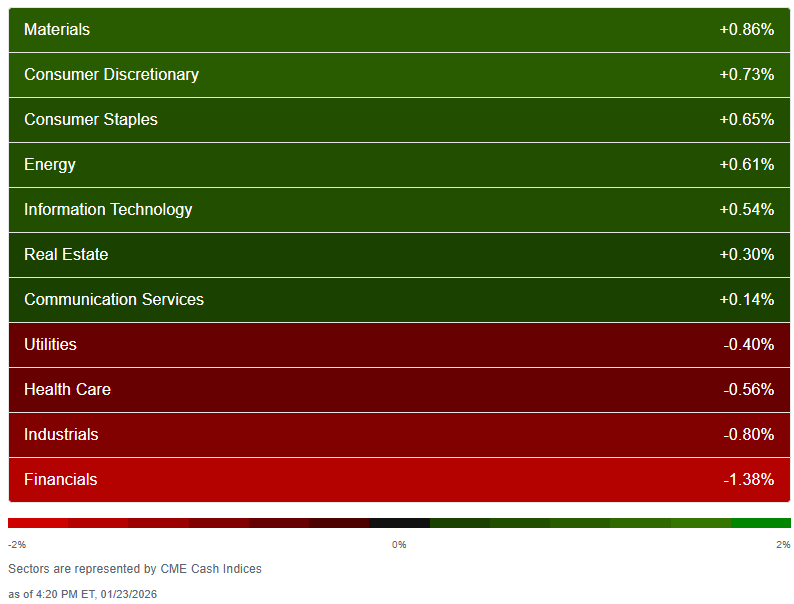
Sector breadth according to CME Cash Indices remained with the better breadth we had seen all year outside of Tues and Jan 7th (the only two days with less than 6 sectors higher) with again 7 of 11 sectors in the green.
After finishing in the top three spots for the first time this year the megacap growth sectors (Comm Services, Cons Discr, Tech) were more dispersed but all finished in the green along with Materials, Staples, Energy, and RE, but no sector up more than +0.9% (after two Thurs) while one sector was down more than that (Financials -1.4%).
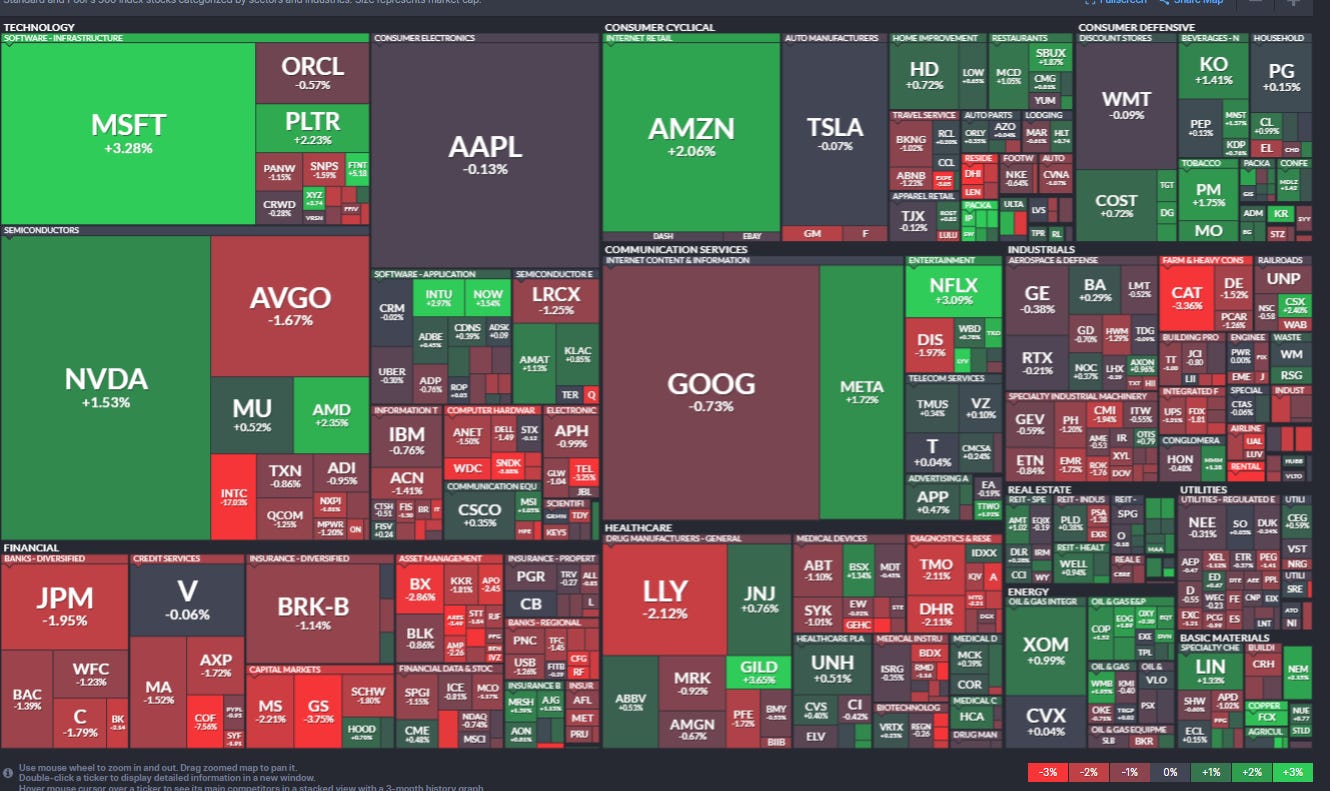
Less green and more red on the stock-by-stock flag from @finviz_com particularly in Financials, Industrials, and Tech.
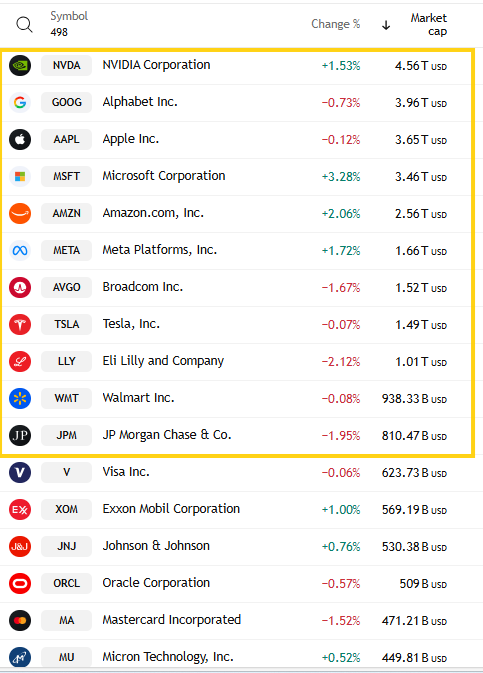
Just four of the largest 11 SPX components were higher (from 9 Thurs, 8 Wed, but 1 Tues) led by MSFT +3.3%. The other three though (AMZN, META, NVDA) all were also up over 1%. LLY led to the downside -2.1%.
Mag-7 +1.0%, which was also basically its gain for the week.
10 SPX components were up 3% or more (after ~20 Thurs, 100 Wed, 8 Tues), led by live Nation LYV +6.4%.
4 of those 10 up 3% or more were >$100bn in market cap in GILD, NOW, MSFT, NFLX (in descending order of percentage gains).
14 SPX components down -3% or more (after 13 Thurs, Wed, but 125 Tues, the most this year) led by Intel INTC -17.0%, the most since Aug ‘24.
3 of the 13 down -3% or more were >$100bn in market cap in INTC, COF, CAT (in order of percentage losses).
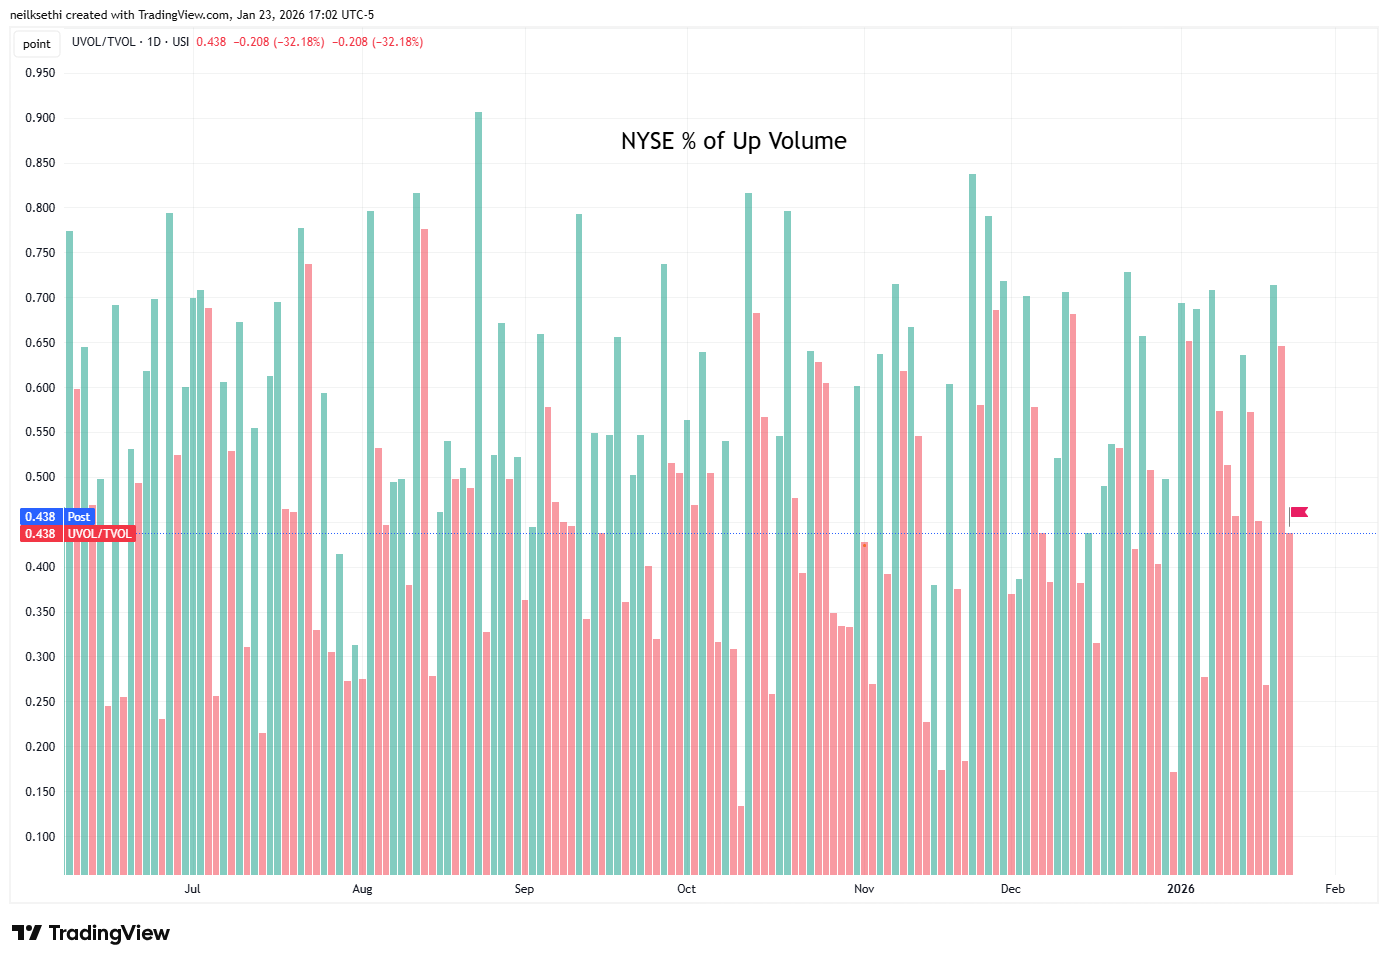
NYSE positive volume (percent of total volume that was in advancing stocks (these also use futures)) fell back to 43.8% around what you’d expect with a -0.18% loss in the index.
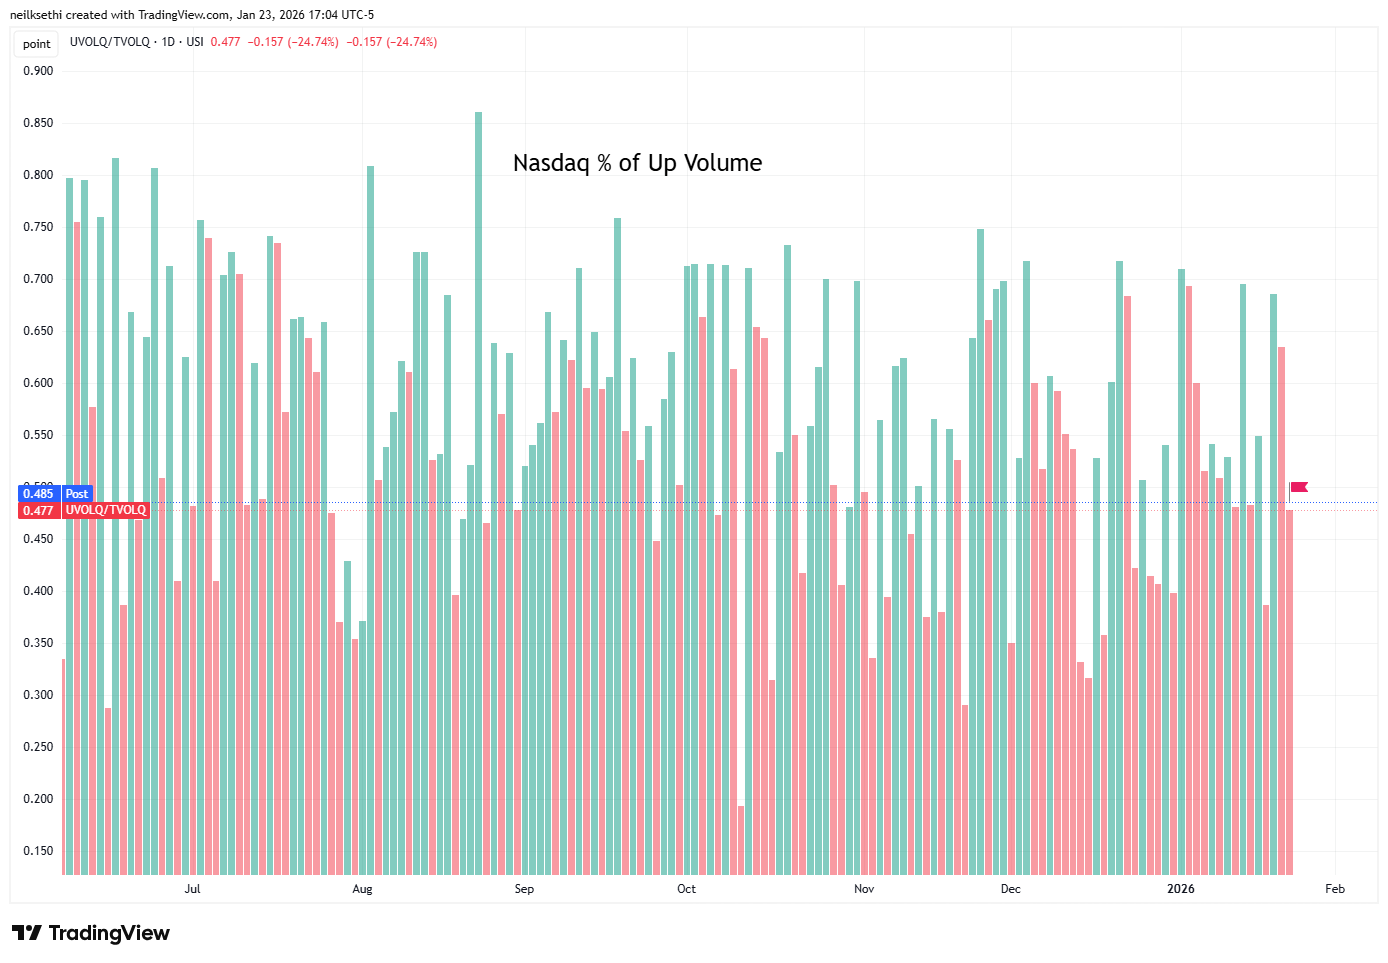
Nasdaq positive volume (% of total volume that was in advancing stocks) also fell back in its case to 48.5% also around what you might expect for the +028% gain in the index (with the usual caveat that positive volume on the Nasdaq is all over the place due to the speculative volumes).
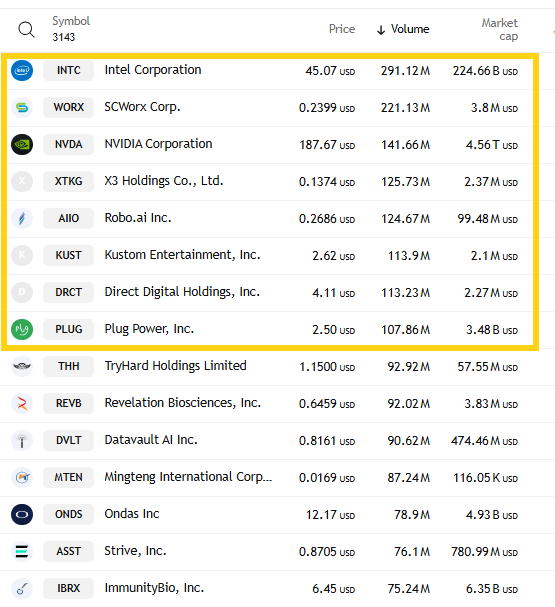
And in regard to those speculative volume on the Nasdaq, it edged back to around the lows of the week with the top three stocks by volume at around 650mn a touch above the 600mn Wed but down from 1bn a week ago (and 4bn Jan 14th).
There were another five that traded over 100mn shares (up from four Wed but down from 6 Thurs, 7 Tues, 10 a week ago) so speculative activity while still elevated is much less so than last week.
Also for the second time in three days, two of the top three stocks by volume were large market caps (today INTC and NVDA).
Positive issues (percent of stocks trading higher for the day), which are not inflated by high speculative volumes, were weaker than positive volume at 38% on both indexes.
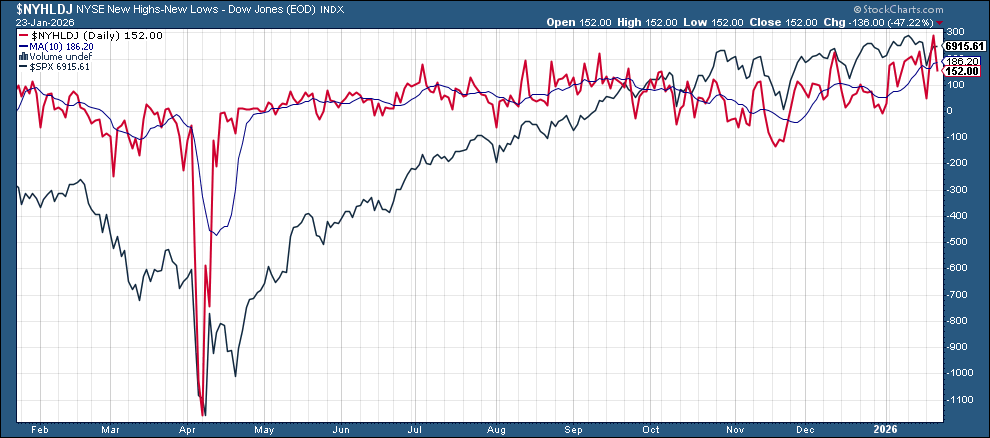
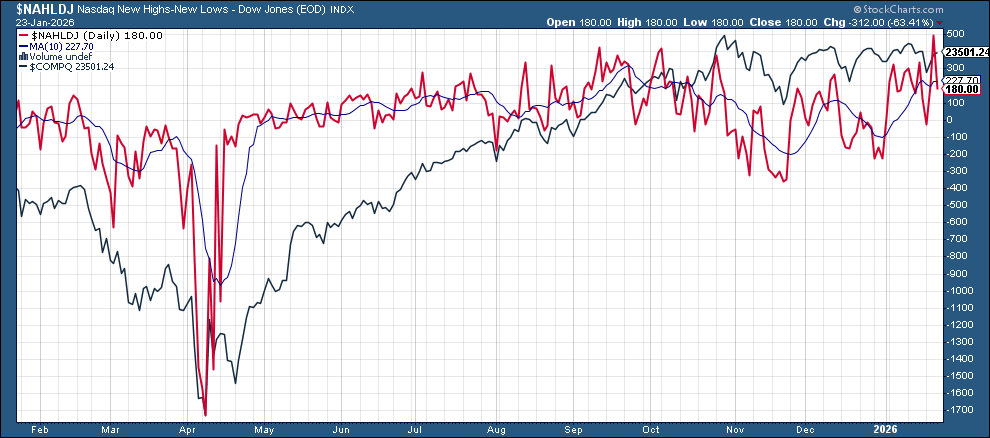
New 52-wk highs minus new 52-wk lows (red lines) fell back from the best levels since Nov ‘24 at 152 (from 288) on the NYSE, and 176 (from 490) on the Nasdaq.
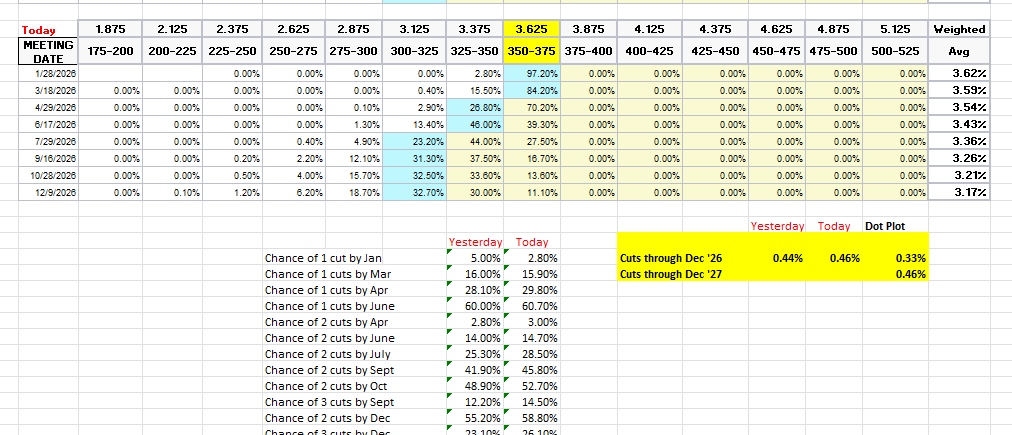
#FOMC 2026 rate cut pricing edged a little higher (more cuts) after hitting the least since pricing for the Dec ‘26 contract was initiated (or at least as far back as the CME Fedwatch tool has been tracking it) with a second cut moving back into October.
January down to 2.8%, so off the table. March is 16% (from 51% Jan 6th), April 30% (from 63%), with the first cut in June (61%). As noted the second cut moved back to Oct (53%, but as compared to a a 55% chance of a July cut on Jan 6th).
Pricing for 2026 +2ps to 46bps, with pricing for two cuts 59% and three cuts 26% (down from 68bps Dec 3rd (and 80bps mid-Nov which was highest we’d been for 2026 cuts)).
The dot plot as a reminder has 33bps for the average dot for 2026.
Remember that these are the construct of probabilities. While some are bets on exactly one, two, etc., cuts some of it is bets on a lot of cuts (3+) or none (and may include a hike at some point).
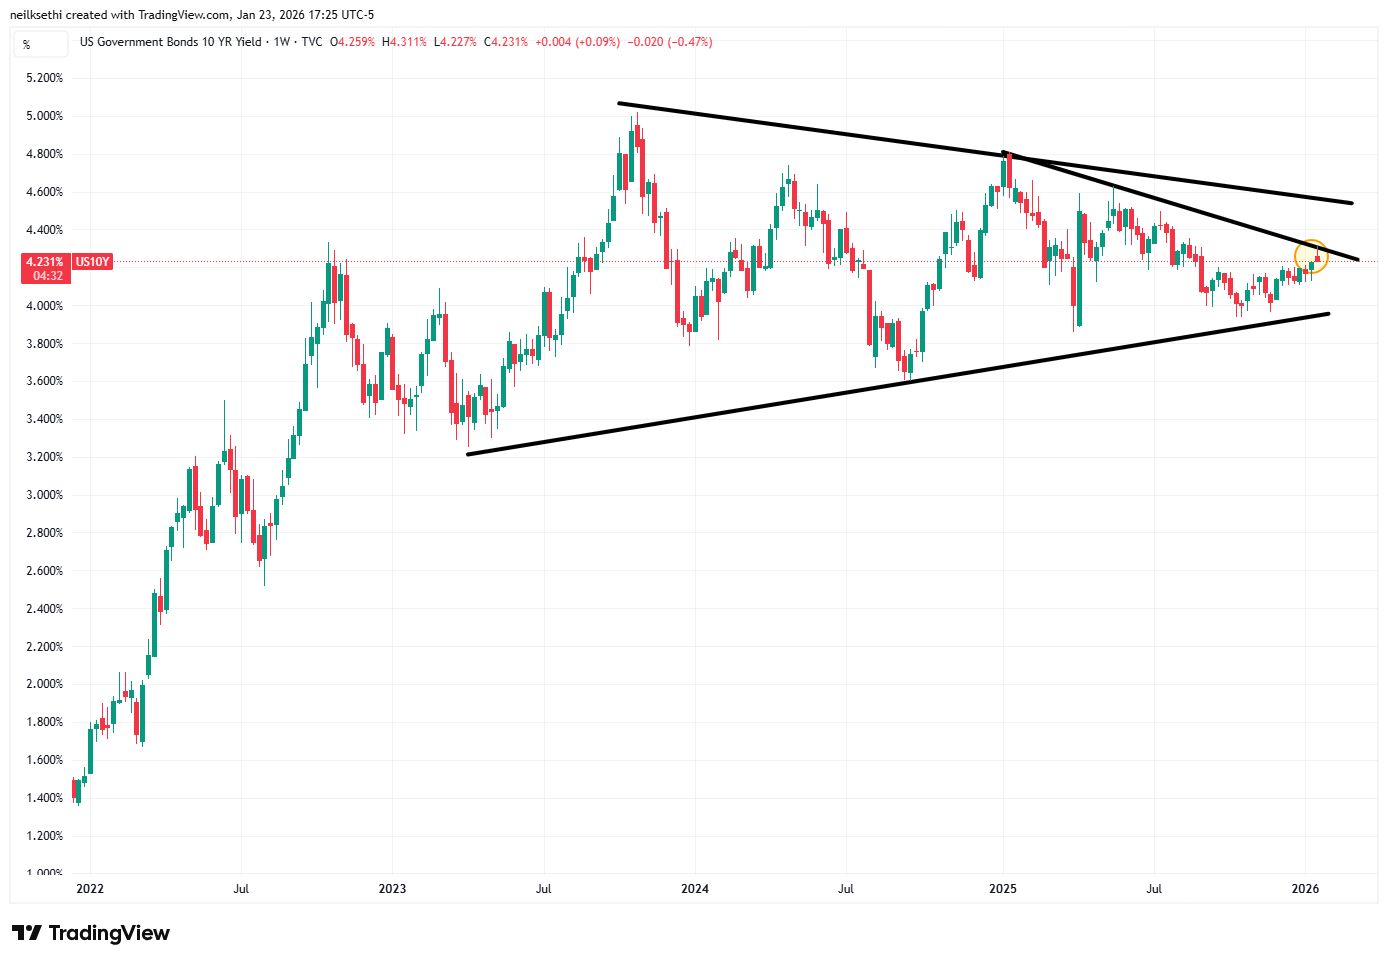
The 10yr #UST yield fell back from the trendline from the Nov ‘24 highs for a third session but continued to hold the 200-DMA ending at 4.24%. As I said Thurs “We’ll see if it breaks through that and returns to its old range or bounces to again test that major downtrend line.”
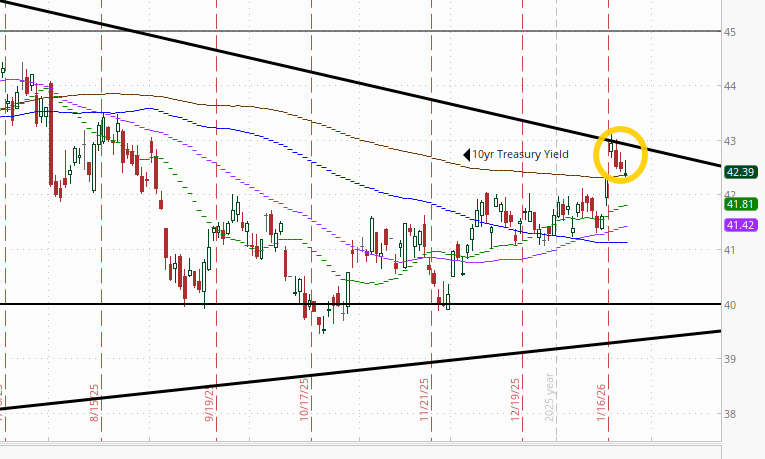
For the week, 10yr yields were -5bps.
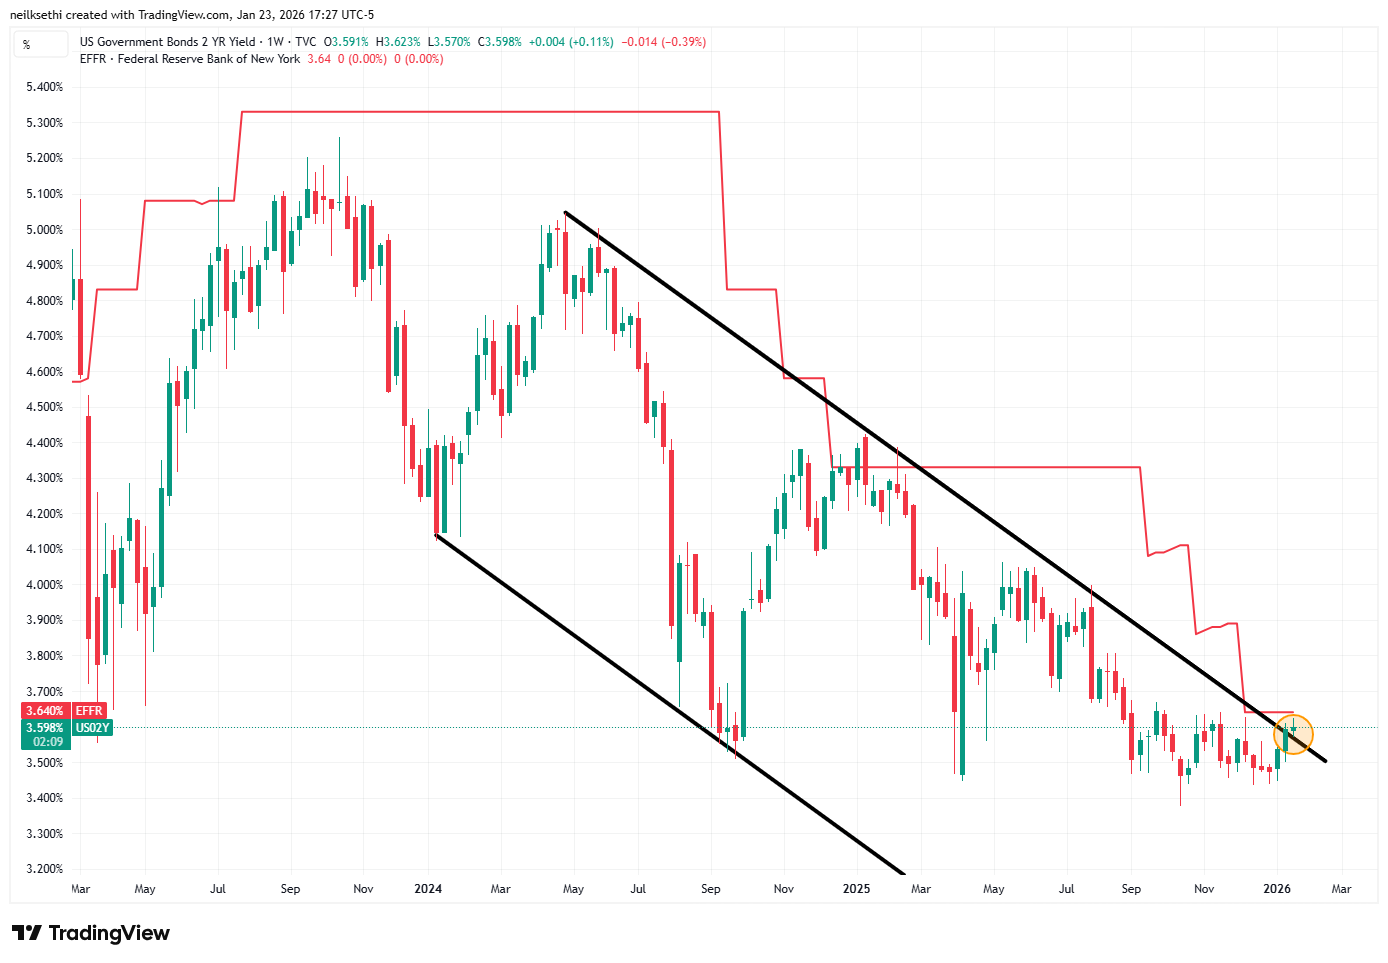
With rate cut bets increasing, the 2yr yield, more sensitive to FOMC rate cut pricing, edged off the highs of the year to 3.60% still over the top of the channel it had been in since the start of 2024 until breaking out last week.
It is -4bps below the Fed Funds midpoint. Outside of recessions it is normally above by around +50bps on average, so still calling for rate cuts, but now just one or two.
The Effective Fed Funds Rate (red line) remained at 3.64%.
This seems like a fairly rich yield at these levels unless we really aren’t going to get any more rate cuts (then it’s a bit expensive (i.e., yield should be higher)). That said I just don’t know that I want to buy 2-years at what is basically the 1-month yield., but I’m starting to get tempted.
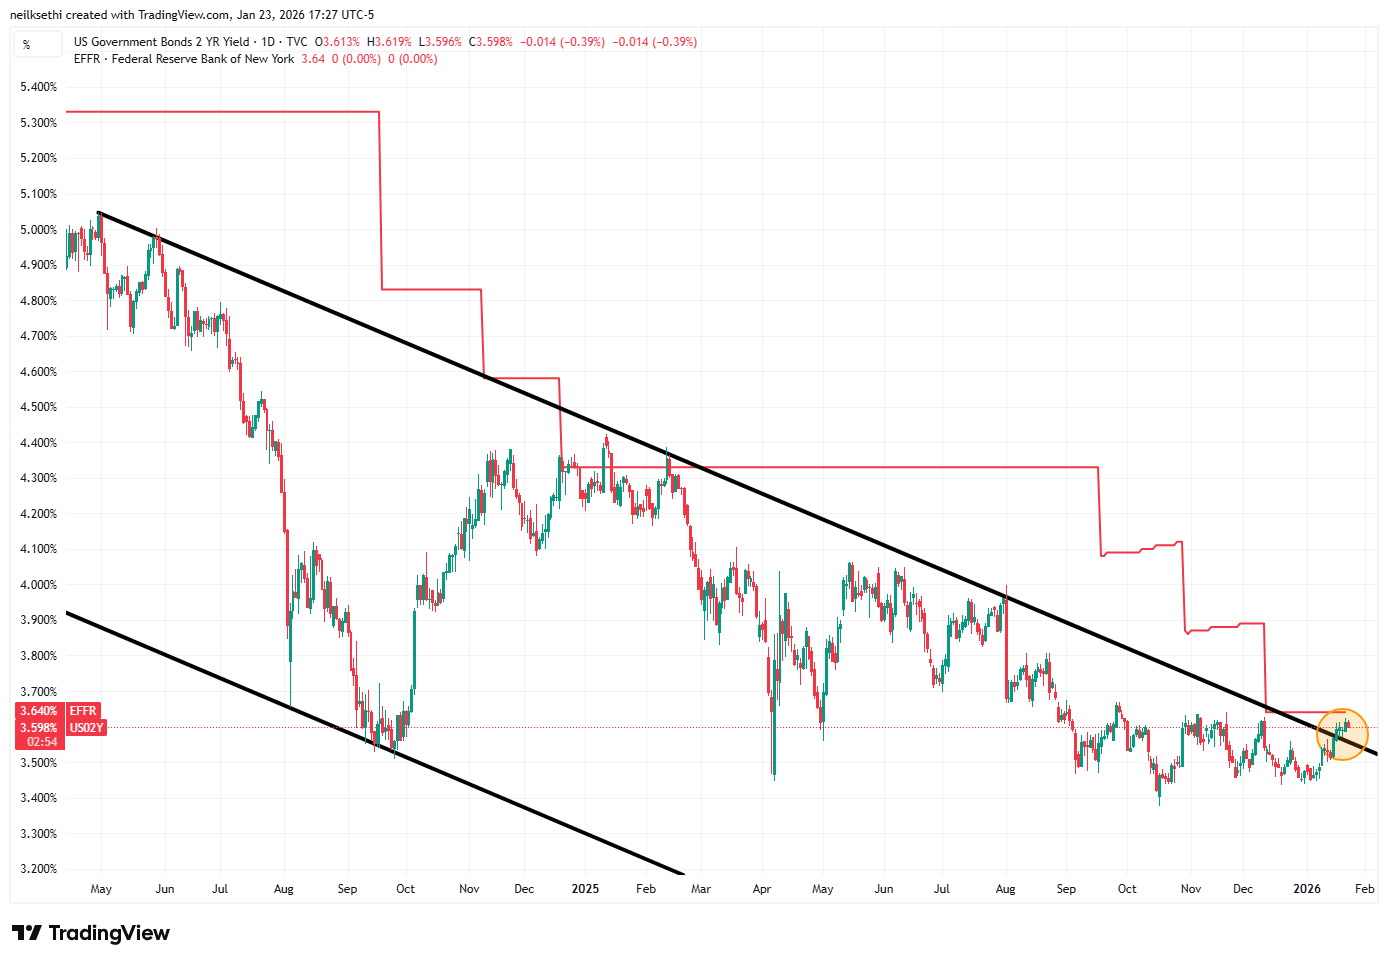
For the week it was +1bps.
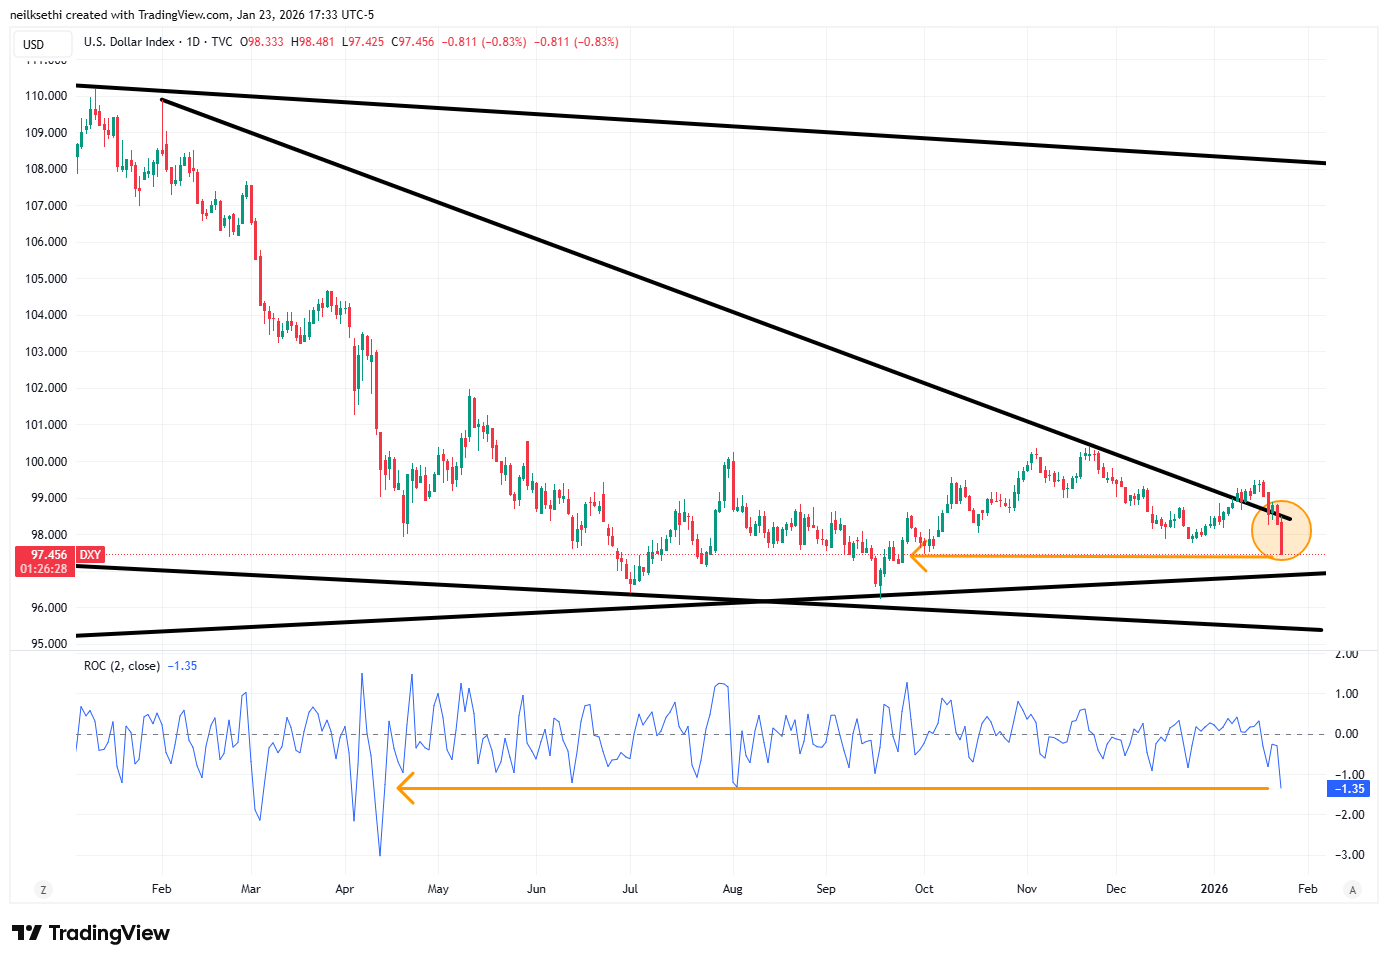
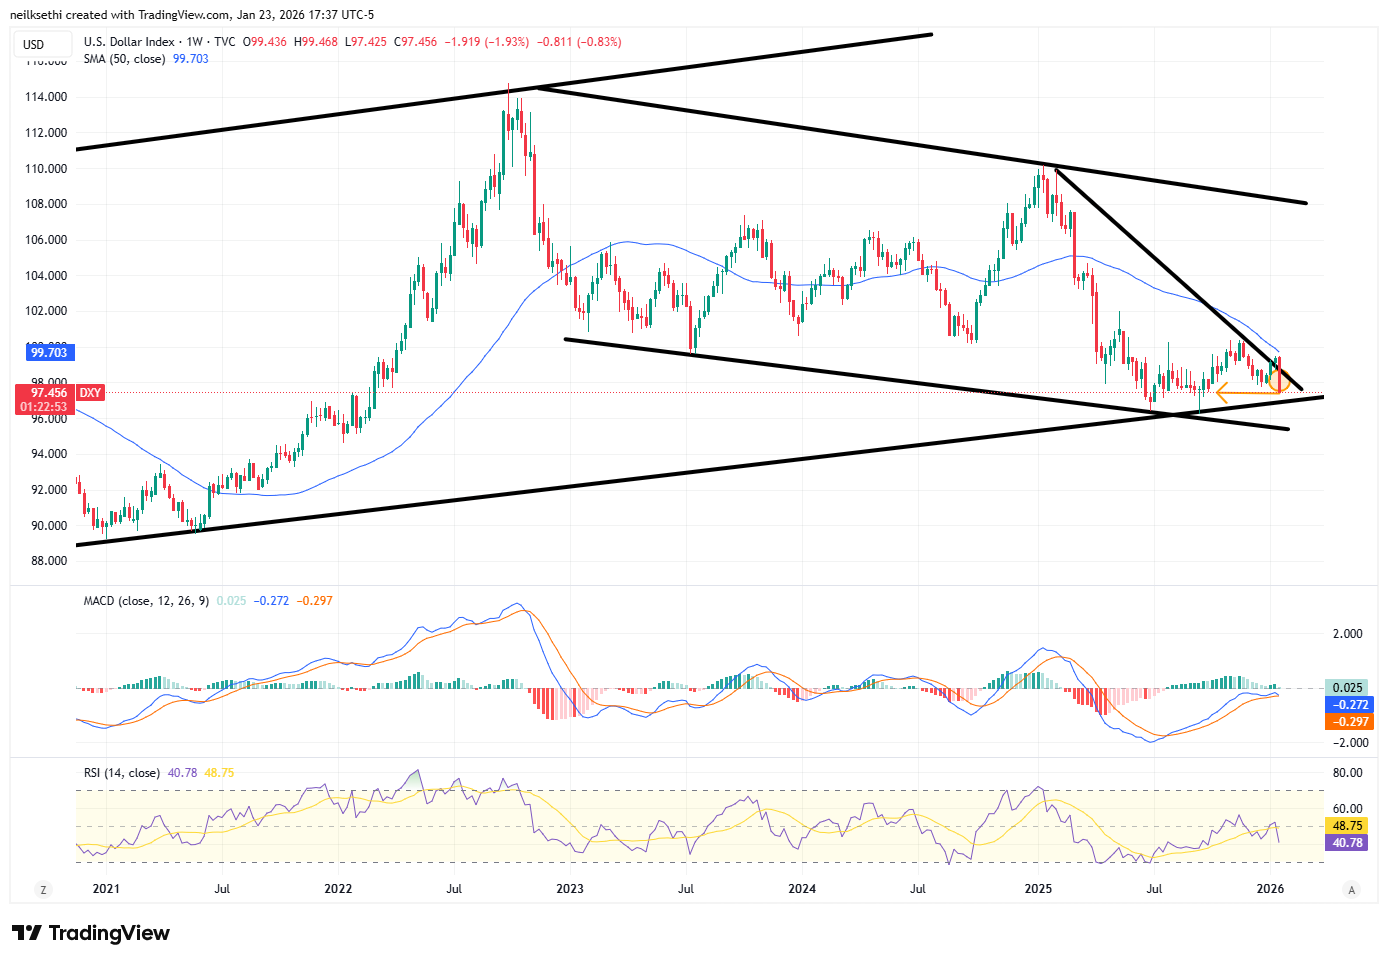
I had noted the weakening in the technicals Wednesday, and they bore out with the $DXY dollar index (which as a reminder is very euro heavy (57%) and not trade weighted) dropping -0.8% Friday, the largest drop since Aug, and -1.35% since Wed, the largest 2-day drop since April, to the lowest close since Sept.
As noted Wed, “the daily MACD has crossed to ‘sell longs’ positioning and the RSI is under 50.” Test of the uptrend line coming?
Weekly chart deteriorating as well.
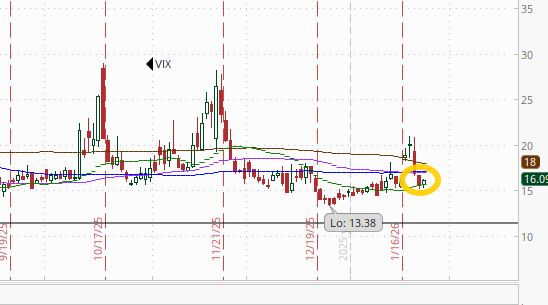
VIX edged a little higher ending at 16.1. That level is consistent w/~1.01% average daily moves in the SPX over the next 30 days.
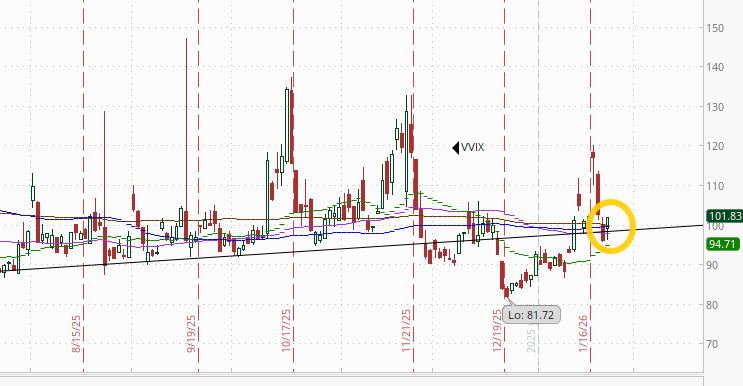
The VVIX (VIX of the VIX) also edged up in its case to 101.8.
The current level is consistent with “moderately elevated” daily moves in the VIX over the next 30 days (historically normal is 80-100, but we’ve been above 90 almost the entire time since July ‘24)). 100 is the level flagged by Charlie McElligott as one to watch.
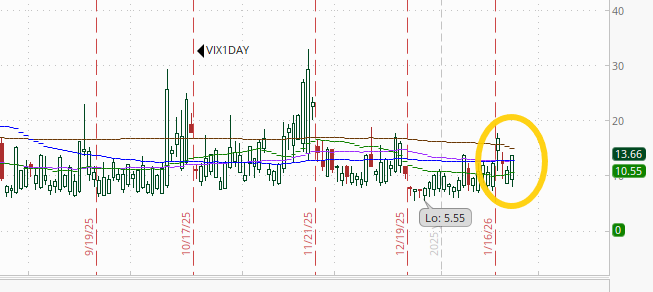
After the events of last weekend, the weekend premium is back and the 1-Day VIX moved to 13.7. That reading implies a ~0.86% move in the SPX next session.
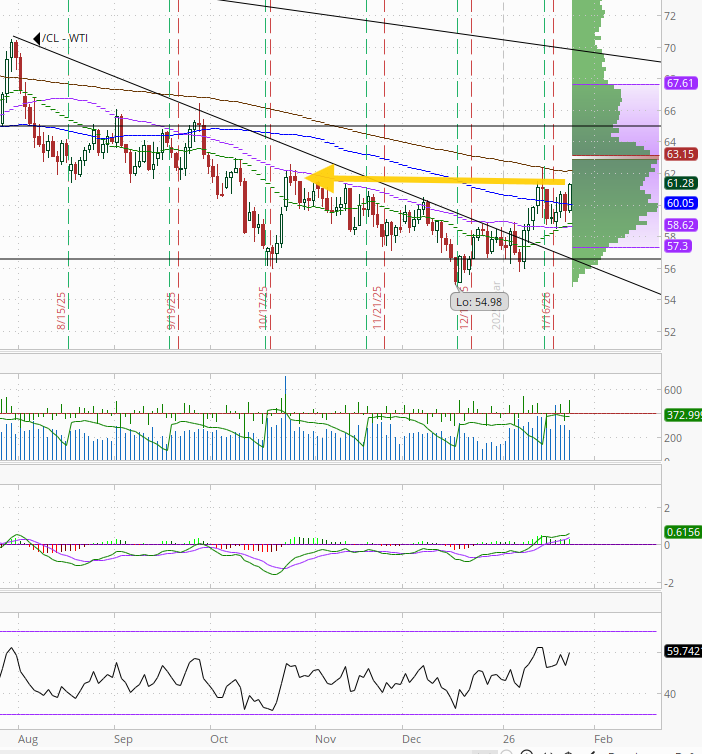
WTI futures u +2.7% Fri to the highest close since Oct 27th edging just out of the range of the past week. Daily MACD remains in “go long” positioning while the RSI is now close to 60. Still lots of resistance overhead though.
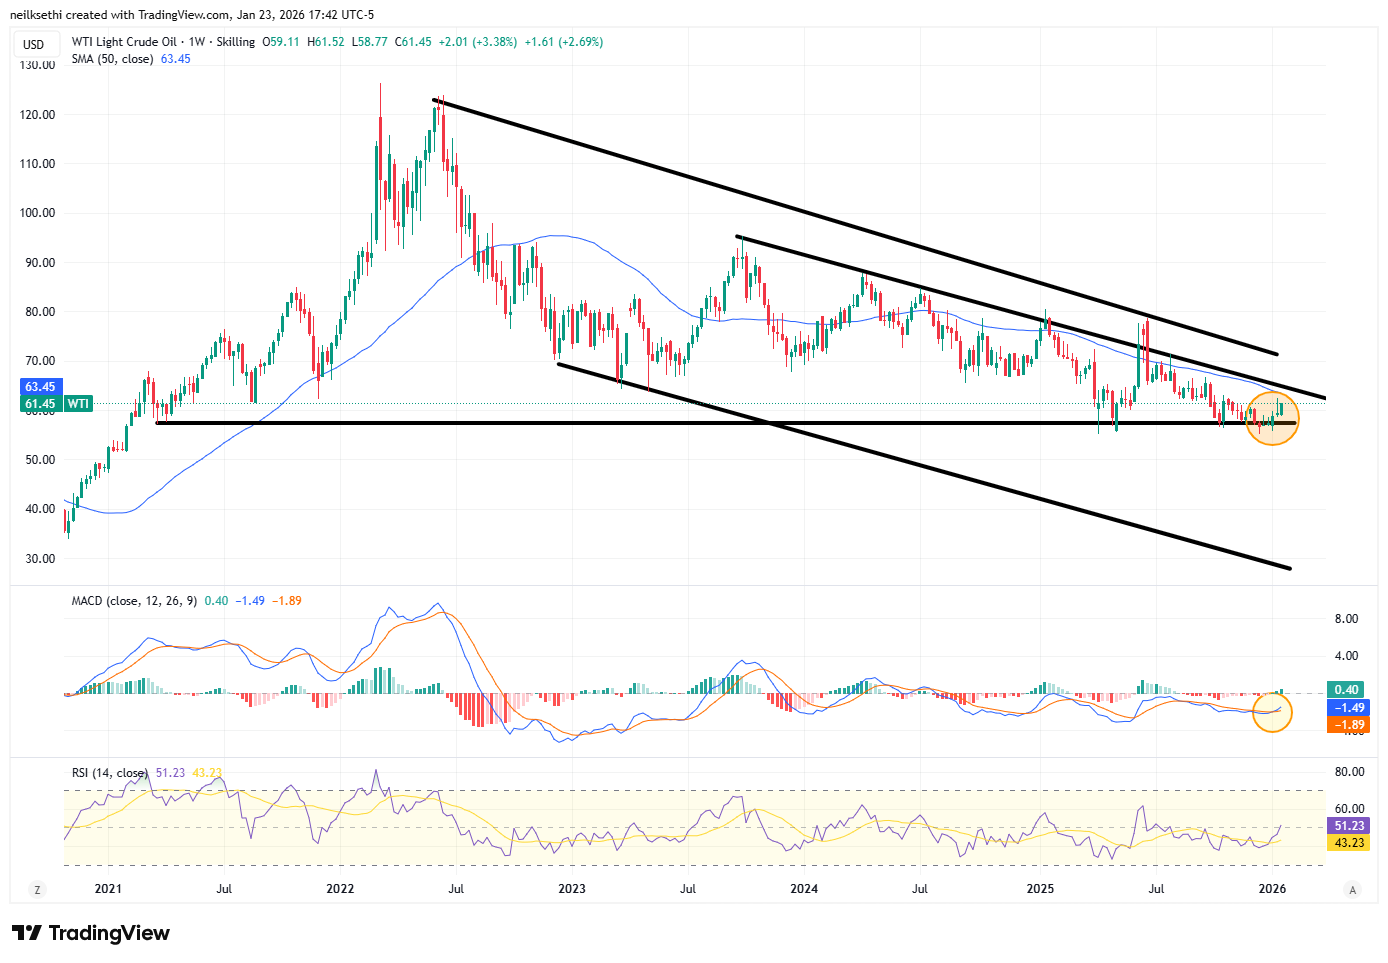
Weekly chart similar with the MACD crossing to “cover shorts” and RSI moving over 50. Again, though, resistance looms.
v
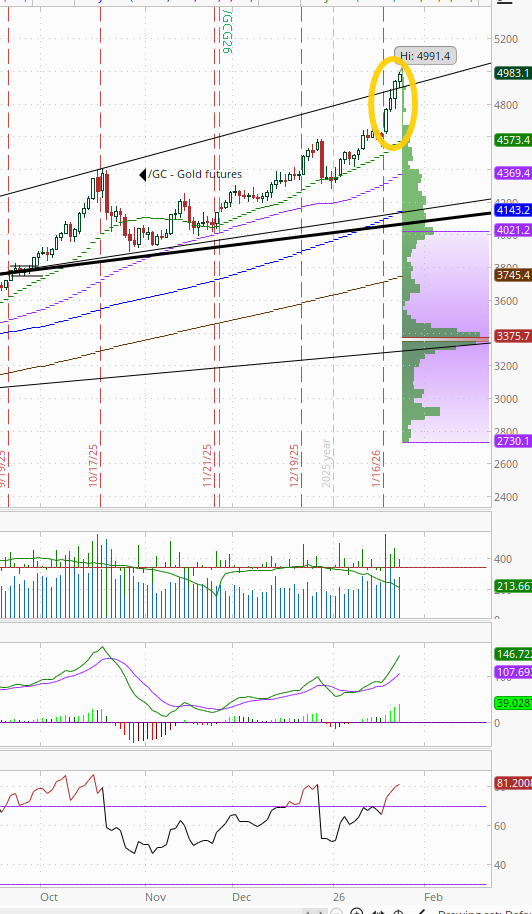
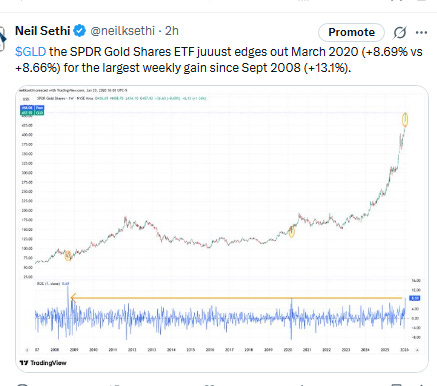
Another day another record high for gold futures (/GC), the fourth straight, taking their gains to the week to +8.1%, one of the best weekly performances since the GFC (it was the best for the GLD gold ETF), now through the trendline from April where the October rally petered out (not so here). Daily MACD remains in “go long” positioning, but the RSI is now over 80.
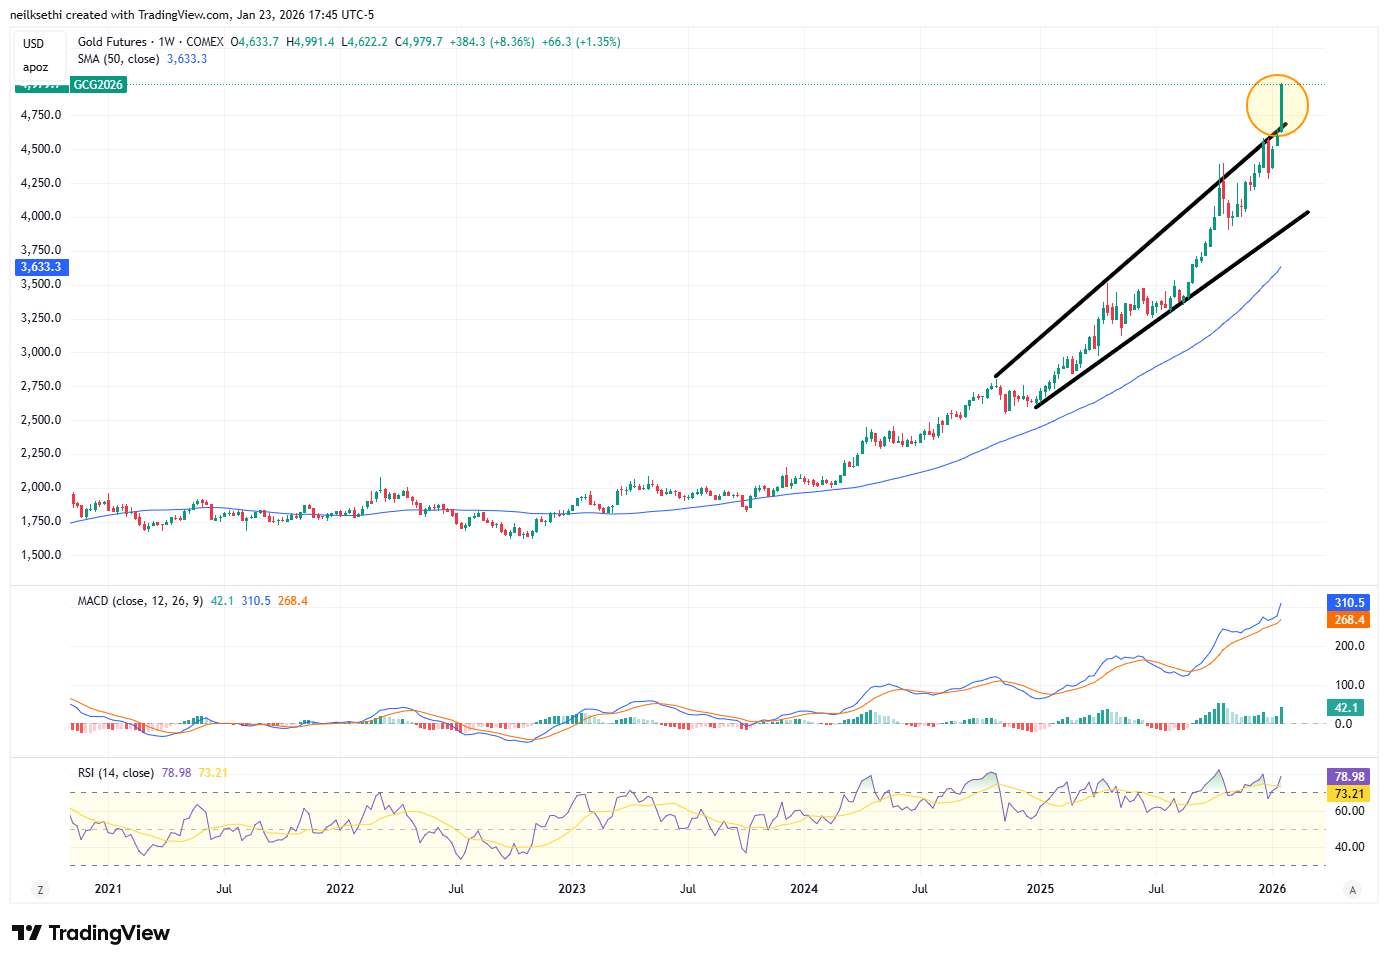
The weekly chart is just ridiculous. Congrats goldbugs.
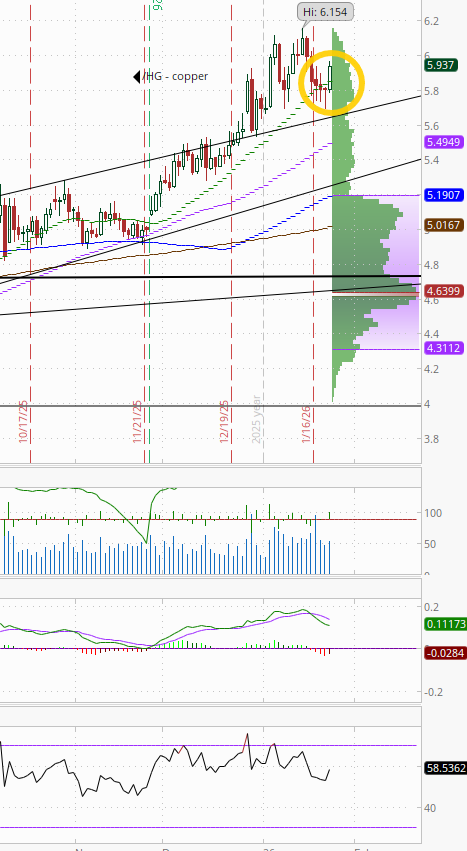
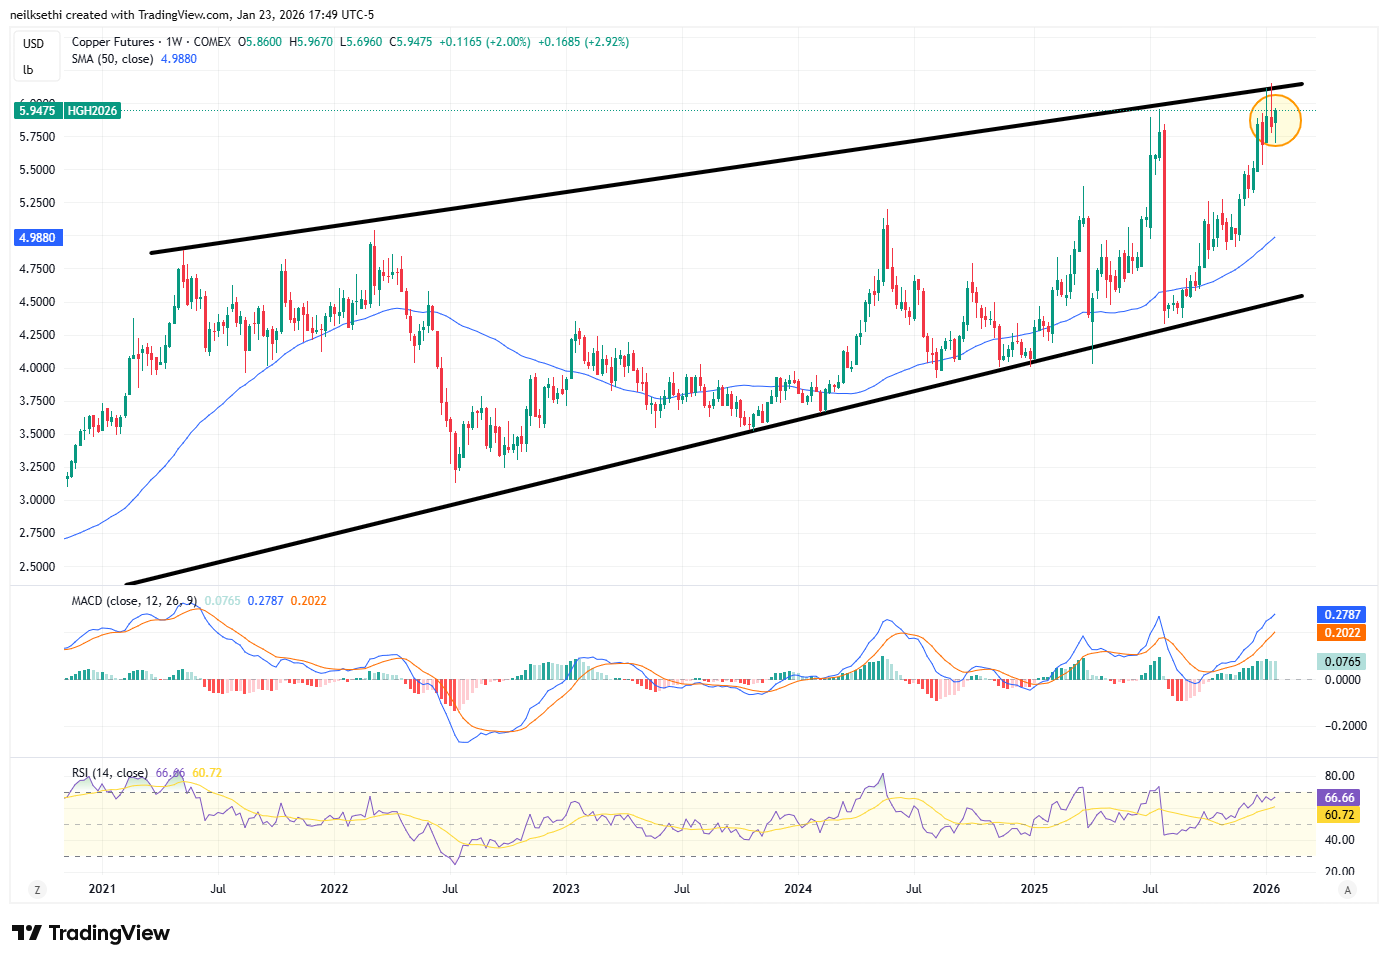
US copper futures (/HG) after steadily deteriorating for five sessions finally got going up +2.3% and actually finishing with a positive week. In fact, as you can see in the second chart, it was an all-time high weekly close. On the daily though, as noted Friday, “the daily MACD has crossed to ‘sell longs’ positioning while the RSI has fallen to the least since Nov, so we’ll see if a deeper pullback is in the cards.” Those remain issues for now, so jury is still out.
Longer term, copper futures remain in the grinding uptrend since August (and longer than that in the uptrend started in March 2020).
Weekly chart.
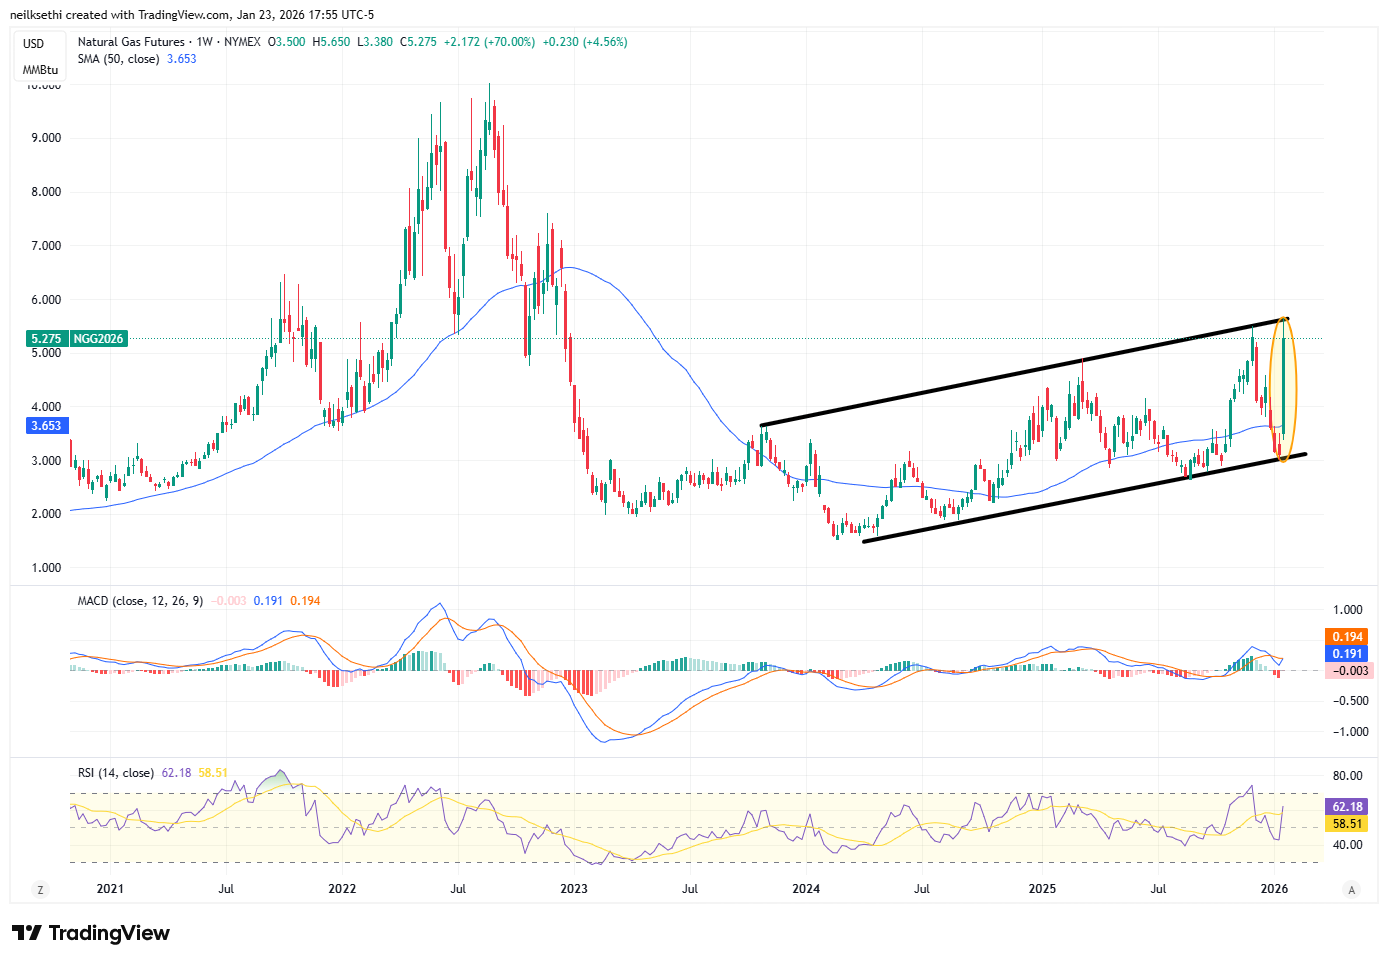
I asked Wed whether natgas futures (/NG) might “take a stab at the $5.50 highs from 2025,” and they did just that Thurs, jumping over +10% after their best two-day gain on record to a new 3-year intraday high before reversing sharply to finish lower on the day. I said it “sounds a lot like a potential ‘blow off top’”
If so, not yet, as they followed that up with another +10% day taking them just far enough to set a new 3-year closing high as worries about a “freeze off” (production shut in due to cold temperatures) mounted. But as BoA notes in the post below, the current pricing is likely more about supply disruptions then something that might be expected to be maintained in the long-run given the huge amount of natgas expected on the market later this year.
The daily MACD as noted Tues flipped to ‘cover shorts’ positioning, and RSI is near 70.
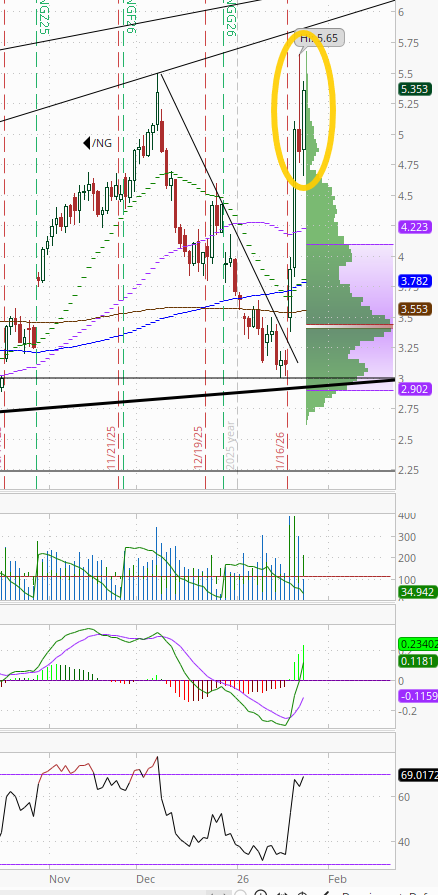
Weekly chart went from one end of the $2.60 channel to the other.
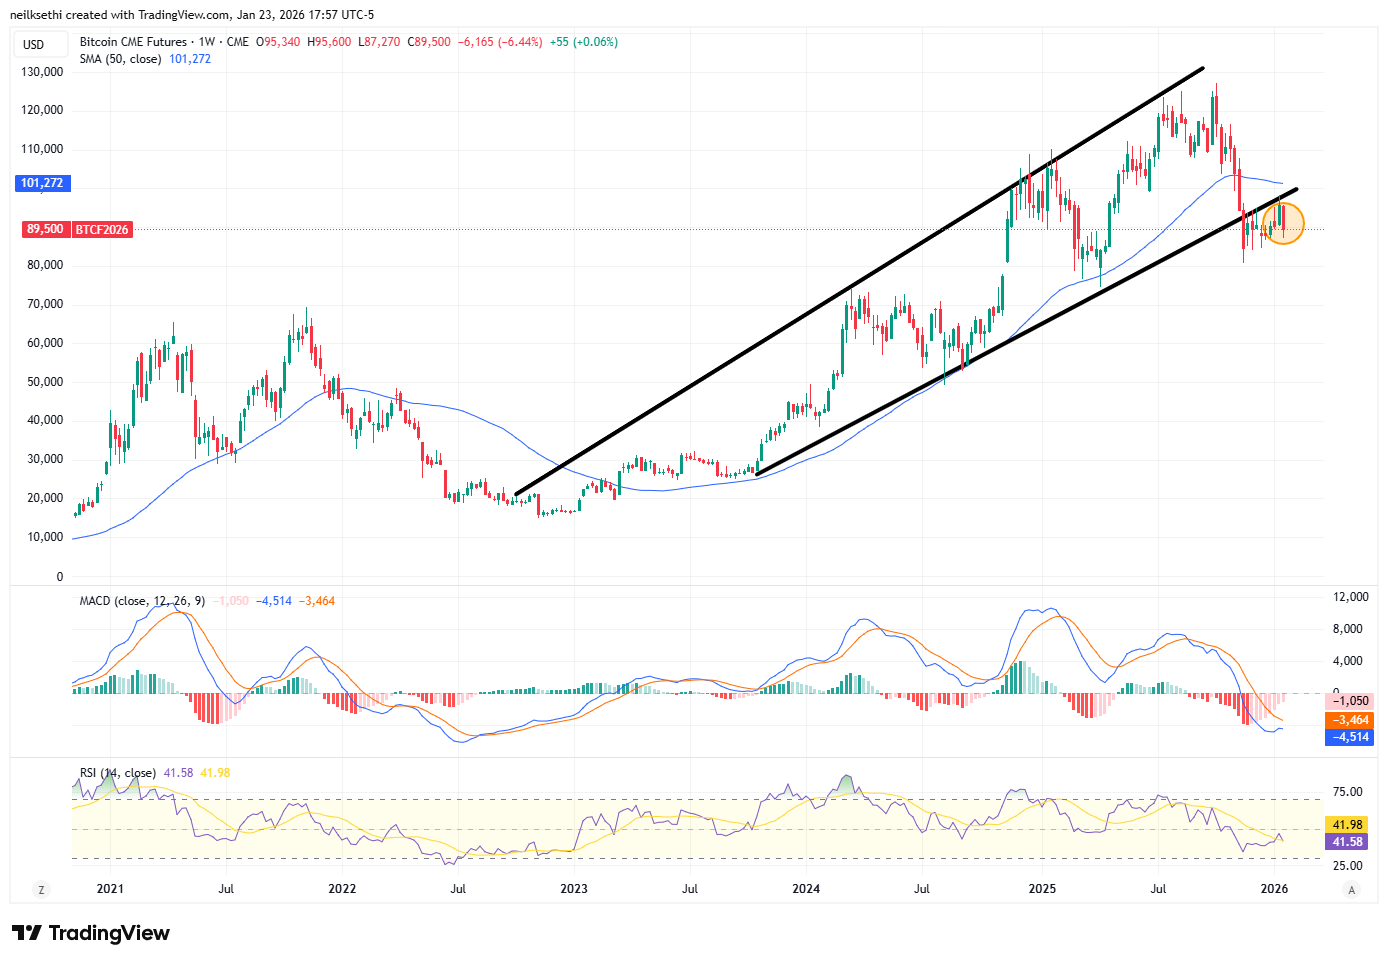
Bitcoin futures continue to sit out the party, little changed just under the $90k level and 50-DMA. I noted Wed “has a good deal of resistance above.”
The daily MACD as mentioned Tues flipped to “sell longs” positioning, while the RSI fell back under 50.
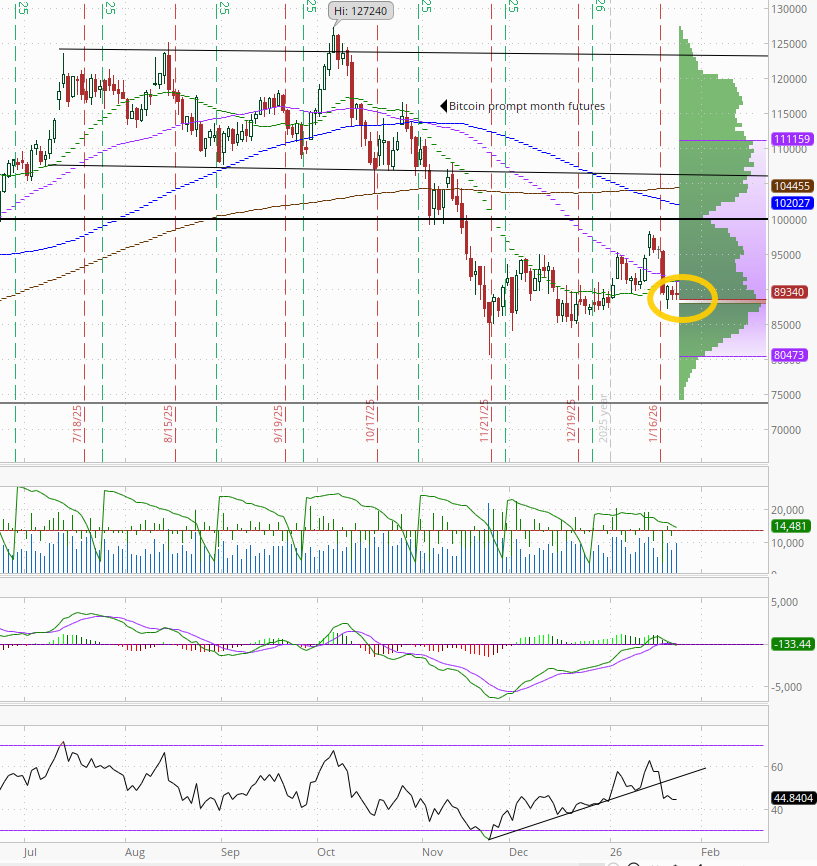
Weekly chart nothing to get excited about in either direction.
The Week Ahead
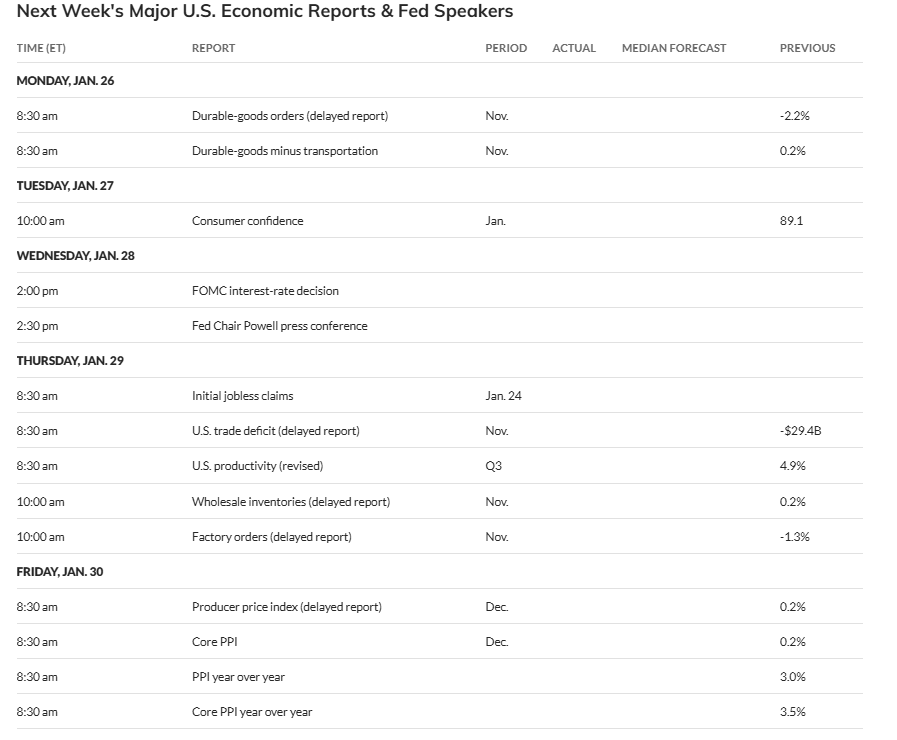
US economic data relatively light next week with mostly just a bunch of delayed reports in Dec PPI, Nov durable goods, factory orders, trade balance, and wholesale inventories along with the Conference Board Jan consumer confidence report and the normal weekly reports (ADP, jobless claims, mortgage applications, petroleum inventories).
But the Fed kicks back into the spotlight with the Jan FOMC decision, although this will be the least exciting (if you’re interested in the path of interest rates) since last summer with a hold a lock, no updated SEP or dot plot, and Jerome Powell likely to get as many questions about Trump, his future, Fed independence, etc., as he is about the economy and monetary policy. That said, it will at least be interesting and hopefully he’ll give some clues on what the core of the Fed is looking for in order to cut again, and perhaps even push back against market expectations that we’ve seen the last cut under his term.
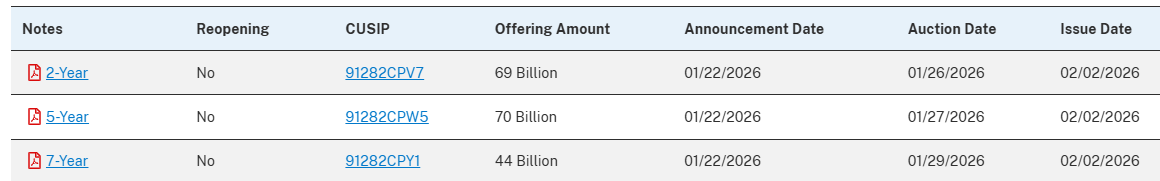
We’ll also wrap up Treasury auctions for the month with 2, 5, and 7-yrs on Mon, Tues, and Thurs respectively.
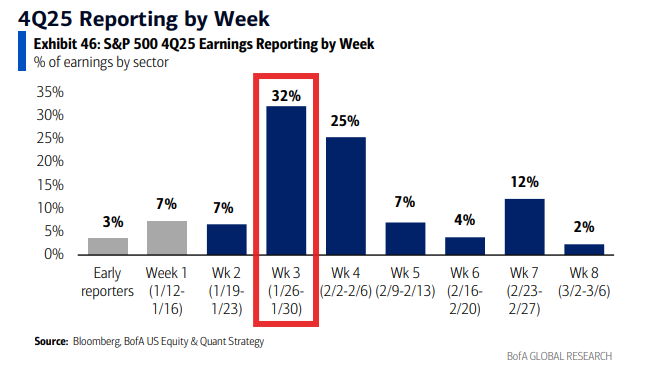
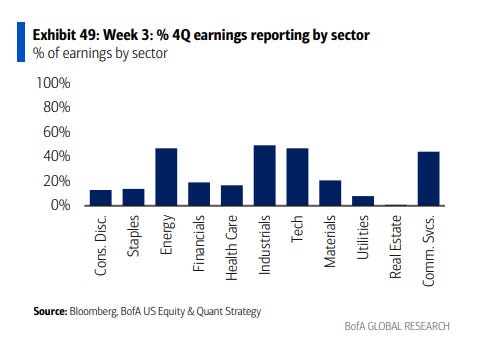
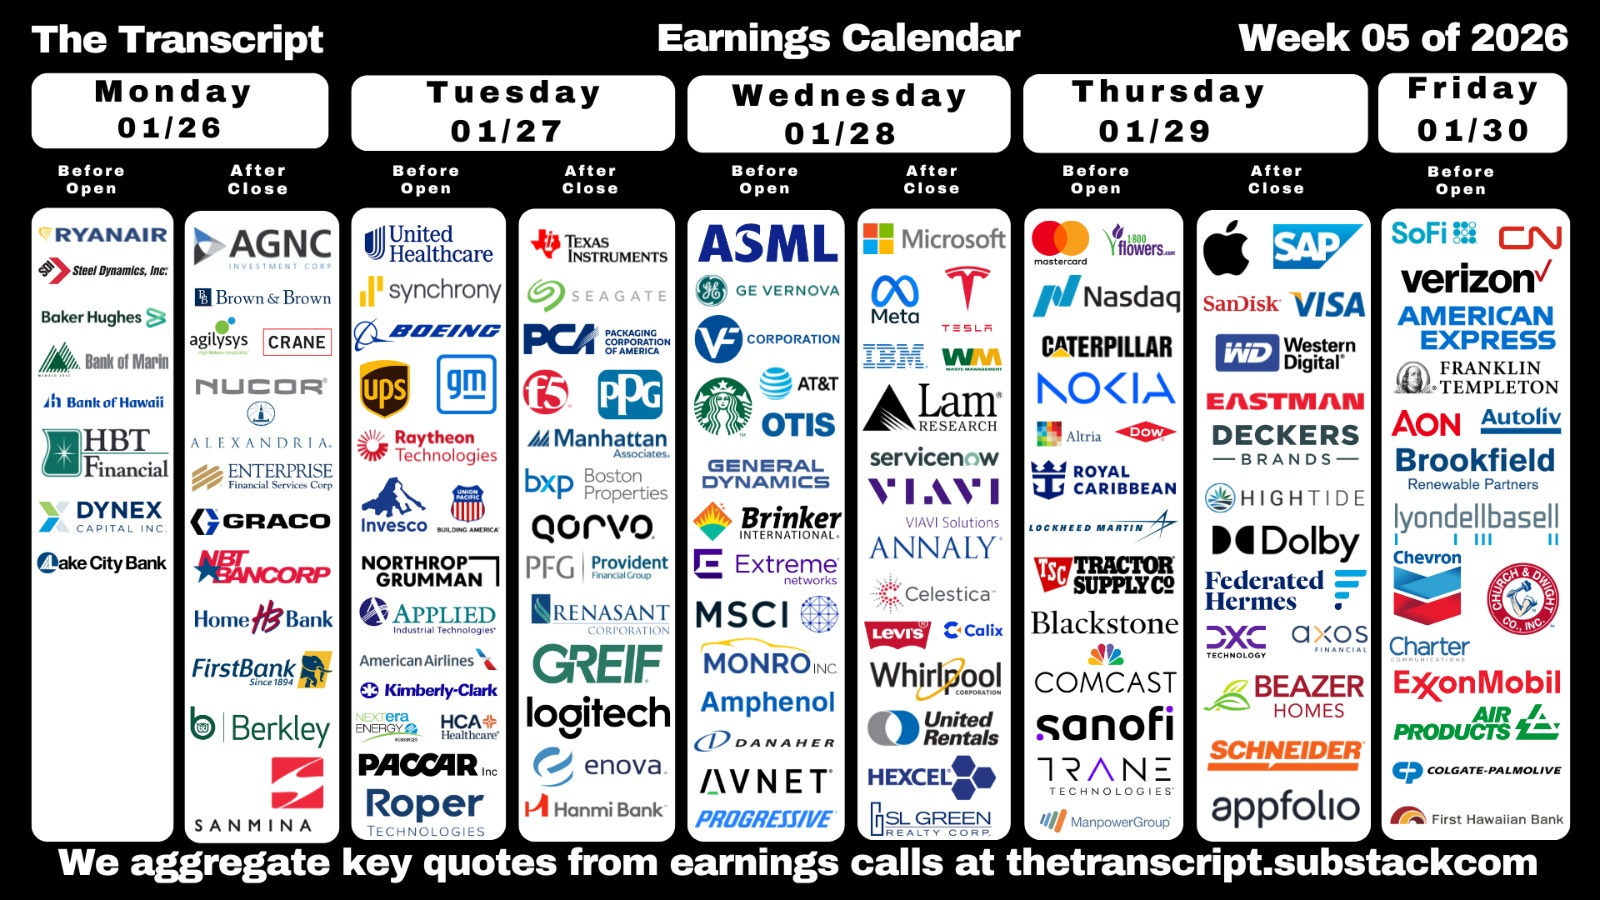
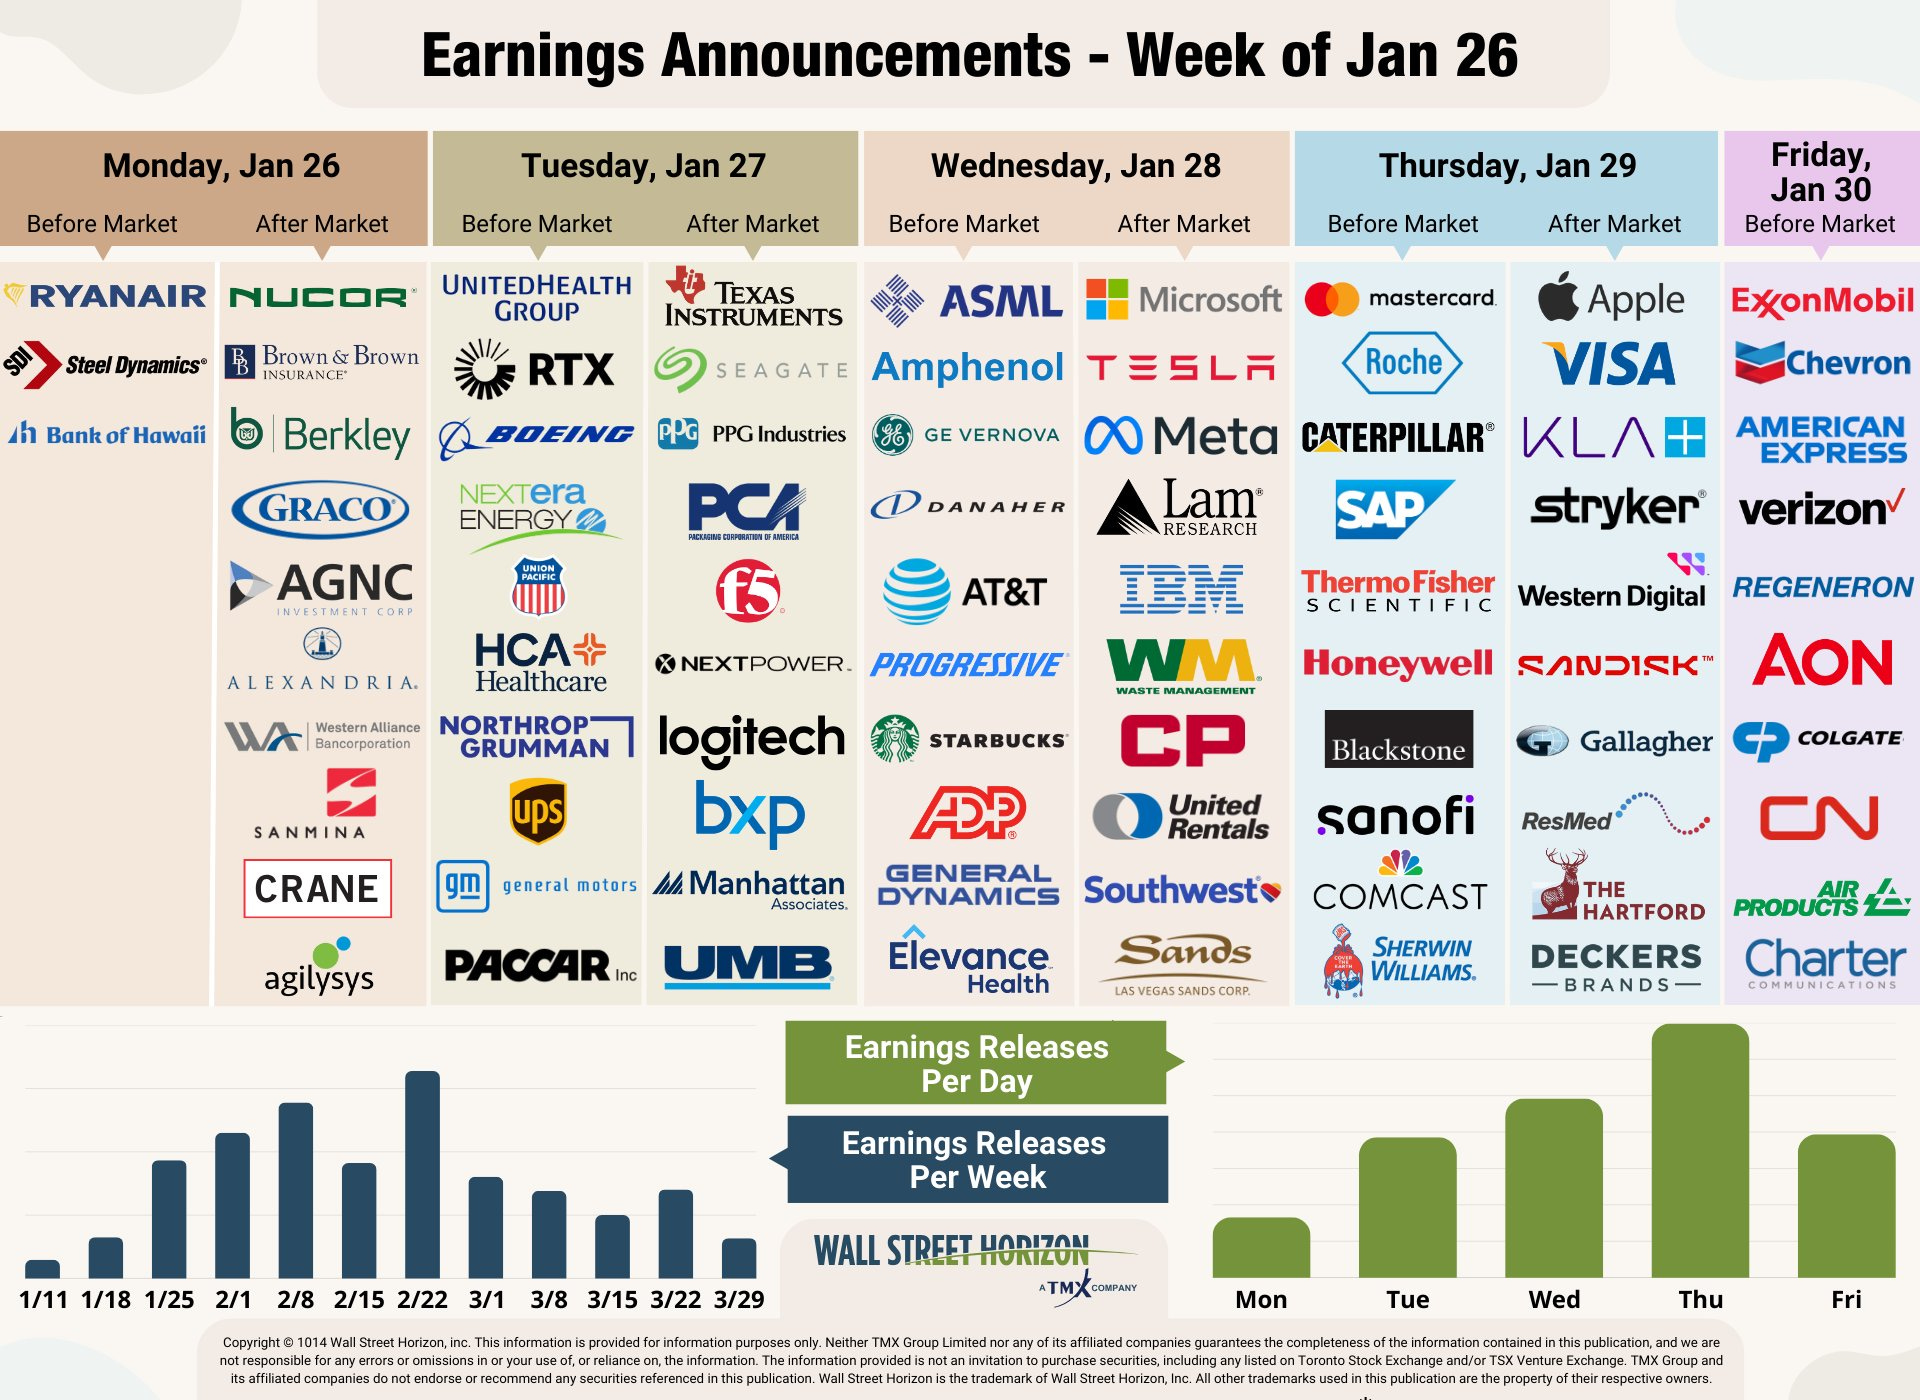
SPX earnings also kick up notch, in fact going all the way to top gear with 32% of the SPX reporting (by earnings weight). I’ll have a full list Sunday, but it includes five >$1tn market caps in AAPL, MSFT, AMZN, META, and TSLA.
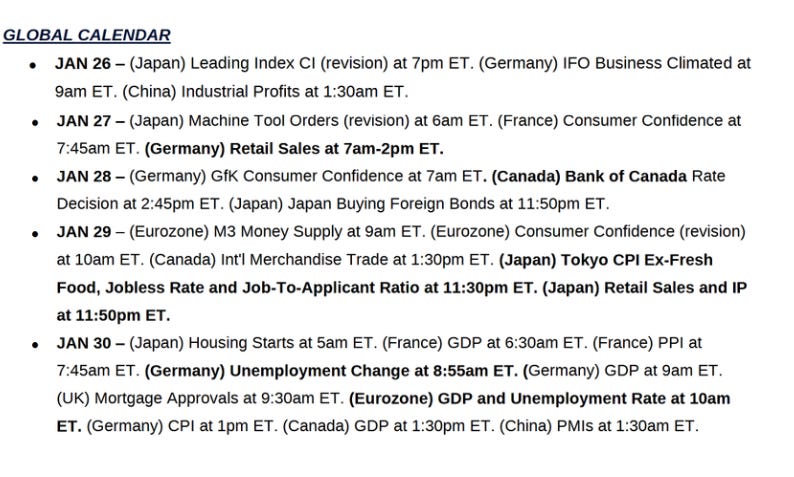
Ex-US highlights (from JPM): Policy decision from Bank of Canada, EU GDP, employment, Germany CPI, GDP, IFO, retail sales, GfK, unemployment, Japan Tokyo CPI, jobless rate, retail sales, industrial production Canada GDP, China industrial profits.
Link to X posts - Neil Sethi (@nelksethi) / X
To subscribe to these summaries, click below (it’s free!).
To invite others to check it out,