Markets Update - 12/6/24
Update on US equity and bond markets, US economic reports, the Fed, and select commodities with charts!
To subscribe to these summaries, click below (it’s free!).
To invite others to check it out (sharing is caring!),
Link to posts - Neil Sethi (@neilksethi) / X (twitter.com)
Note: links are to outside sources like Bloomberg, CNBC, etc., unless it specifically says they’re to the blog.
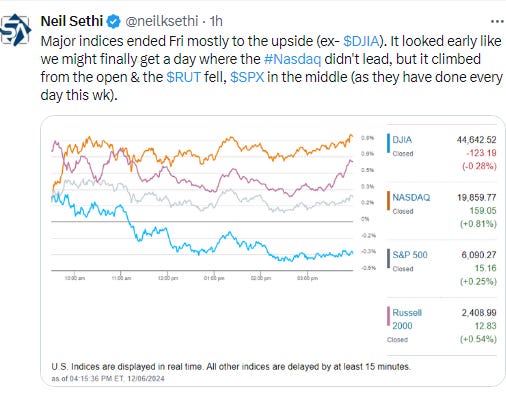
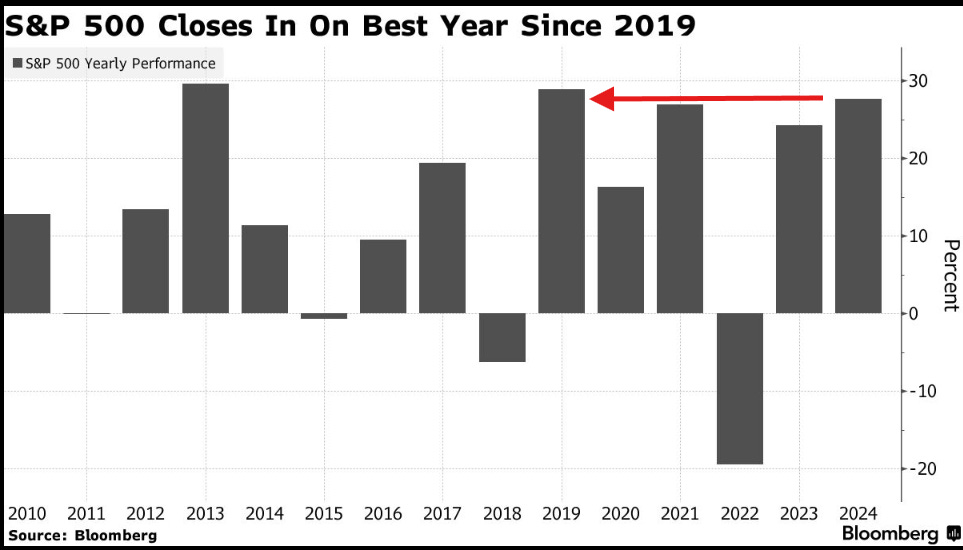
US equity indices returned to previous form on Friday with the S&P 500 and Nasdaq pushing again to all-time highs following a mixed Nonfarm Payrolls report that had enough weakness to firm up bets for a December rate cut to 90% even as Fed members preached a cautious approach to rate cuts. Smaller stocks continued to lag larger ones with the Russell 2000 index finishing solidly lower for the week in contrast to the Nasdaq’s over 3% gain. While the SPX was up a more modest 1% it’s closing in on a 30% gain, currently the best since 2019 (and not far from the best since 1997).
Bond yields fell to the least since October while the dollar curiously edged higher. Gold, copper, and nat gas all saw modest gains and bitcoin futures closed at an ATH above $100k. Crude in contrast fell to near the lowest close in 18 months.
The market-cap weighted S&P 500 was +0.3%, the equal weighted S&P 500 index (SPXEW) -0.1%, Nasdaq Composite +0.8% (and the top 100 Nasdaq stocks (NDX) +0.9%), the SOX semiconductor index +0.7%, and the Russell 2000 +0.5%.
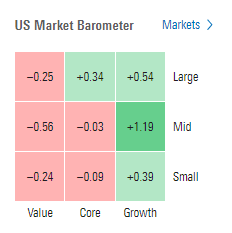
Morningstar style box consistent although it was mid-cap growth the leader Fri. Value back to the laggard.
Market commentary:
“You’re seeing a labor market that is not weak but is definitely softening, and that is more than anything else what is giving traders more confidence in the 25 basis-point rate cut here at the upcoming meeting,” said Luke O’Neill, portfolio manager at Catalyst Funds. “It’s not gangbusters, but we’re doing reasonably solid from an economic perspective and yet there is enough of a softening on the labor side to give plenty of air cover for the Fed to lower rates here.”
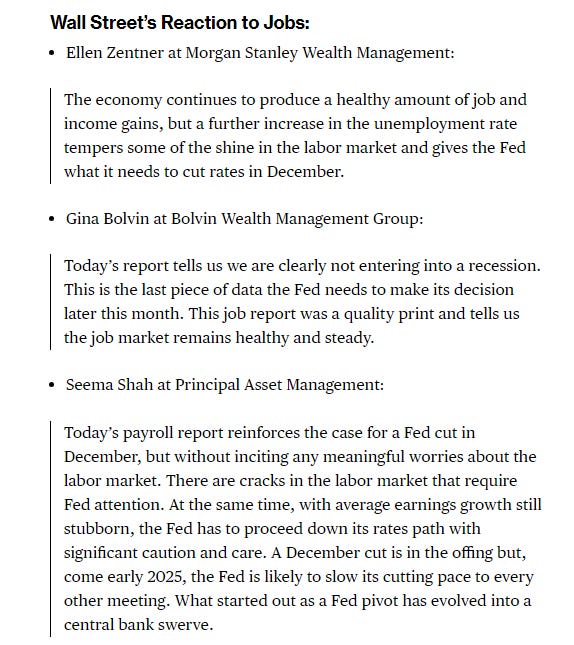
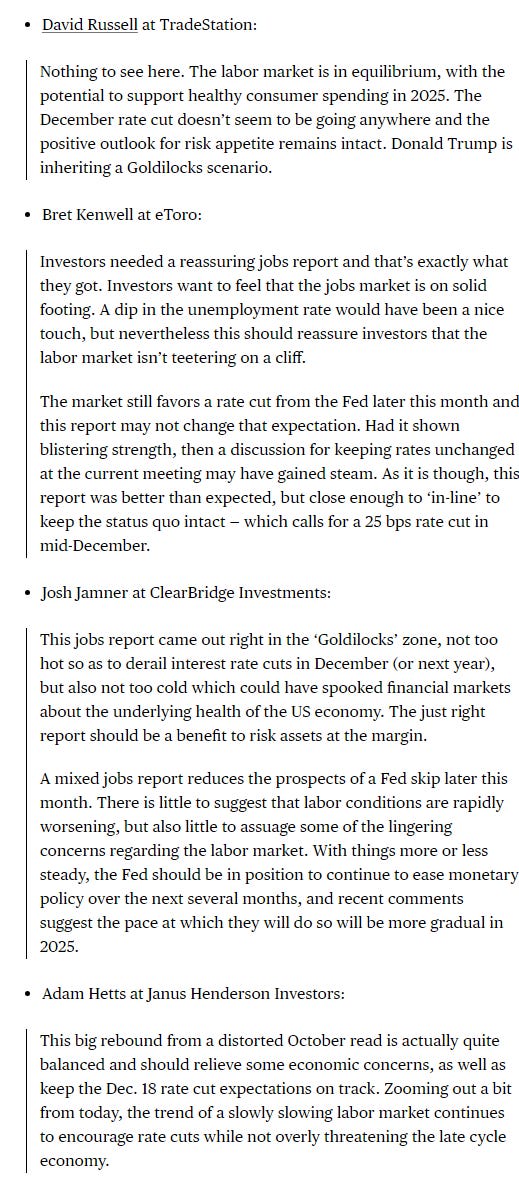
To Bret Kenwell at eToro, traders needed a reassuring jobs report — and that’s essentially what they’ve got. “Investors want to feel that the jobs market is on solid footing,” he said. “A dip in the unemployment rate would have been a nice touch, but nevertheless this should reassure investors that the labor market isn’t teetering on a cliff. The market still favors a rate cut from the Fed later this month, and this report may not change that expectation.”
While the snapshot of the labor market nudged the Fed closer to lowering rates, it didn’t quite seal the deal — with key inflation data due next week.
“We still need to pass the ‘inflation check’ before we can be confident December is close to a lock,” said Krishna Guha at Evercore.
To Josh Jamner at ClearBridge Investments, the “just right” labor-market report should be a benefit to risk assets at the margin. “This jobs report came out right in the ‘Goldilocks’ zone,” he said. “With things more or less steady, the Fed should be in a position to continue to ease monetary policy over the next several months, and recent comments suggest the pace at which they will do so will be more gradual in 2025.”
The rise in the unemployment rate should give the Fed opportunity to cut in December, but if they do, the Fed will likely pause in January unless inflation stats decelerate meaningfully, according to Jeffrey Roach at LPL Financial.
“U-rate gives no cause for a pause,” said Michael Feroli at JPMorgan Chase & Co. “While there is still another CPI report next week, we think it would need to be a very large surprise to change the Committee’s thinking.”
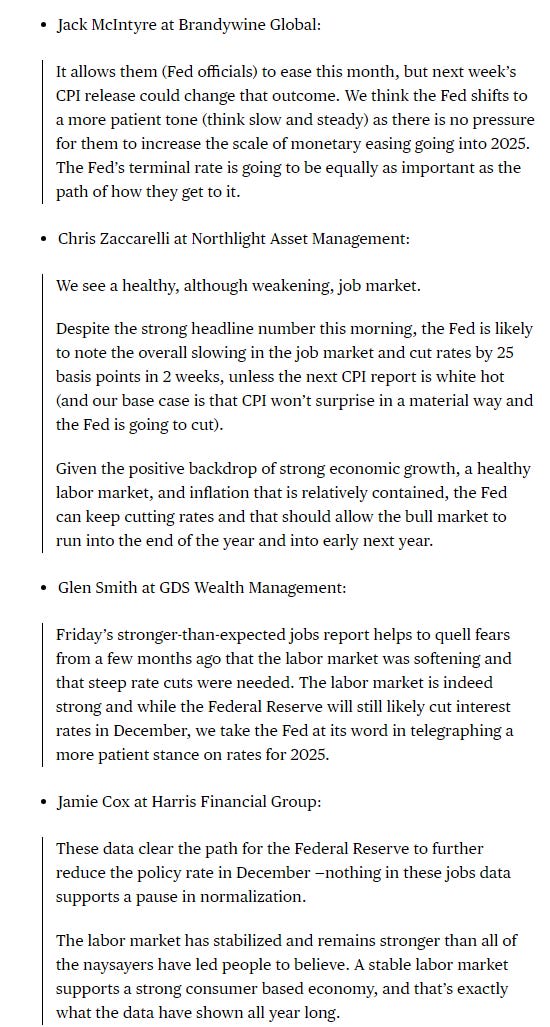
“Given the positive backdrop of strong economic growth, a healthy labor market, and inflation that is relatively contained, the Fed can keep cutting rates and that should allow the bull market to run into the end of the year and into early next year, noted Chris Zaccarelli at Northlight Asset Management.
Continued and broadening profit growth and a strong economy can keep driving US equities higher in 2025 despite lofty valuations after two banner years for the S&P 500, according to strategists at HSBC Holdings Plc led by Nicole Inui. The firm set a target for US equity benchmark at 6,700 for next year. “Consecutive years of double-digit returns is not unusual especially in times with steady macro conditions,” she wrote.
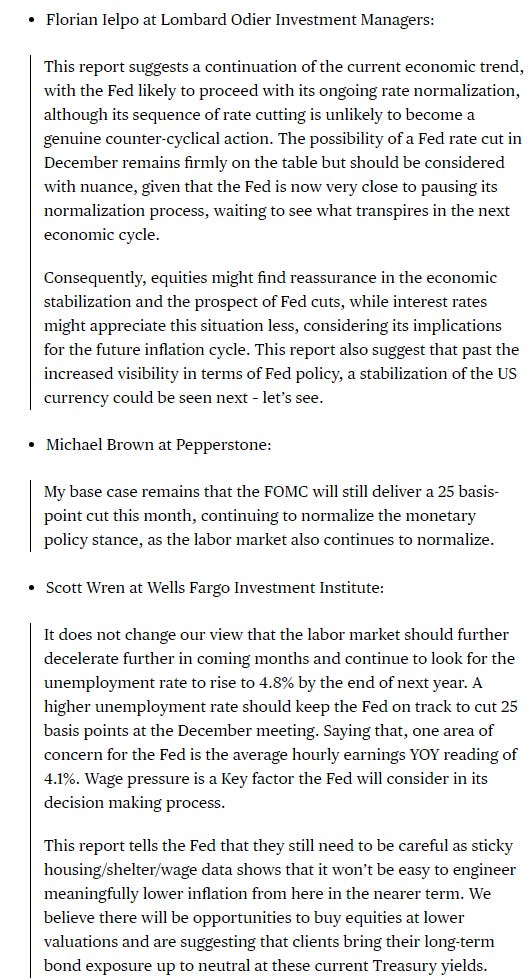
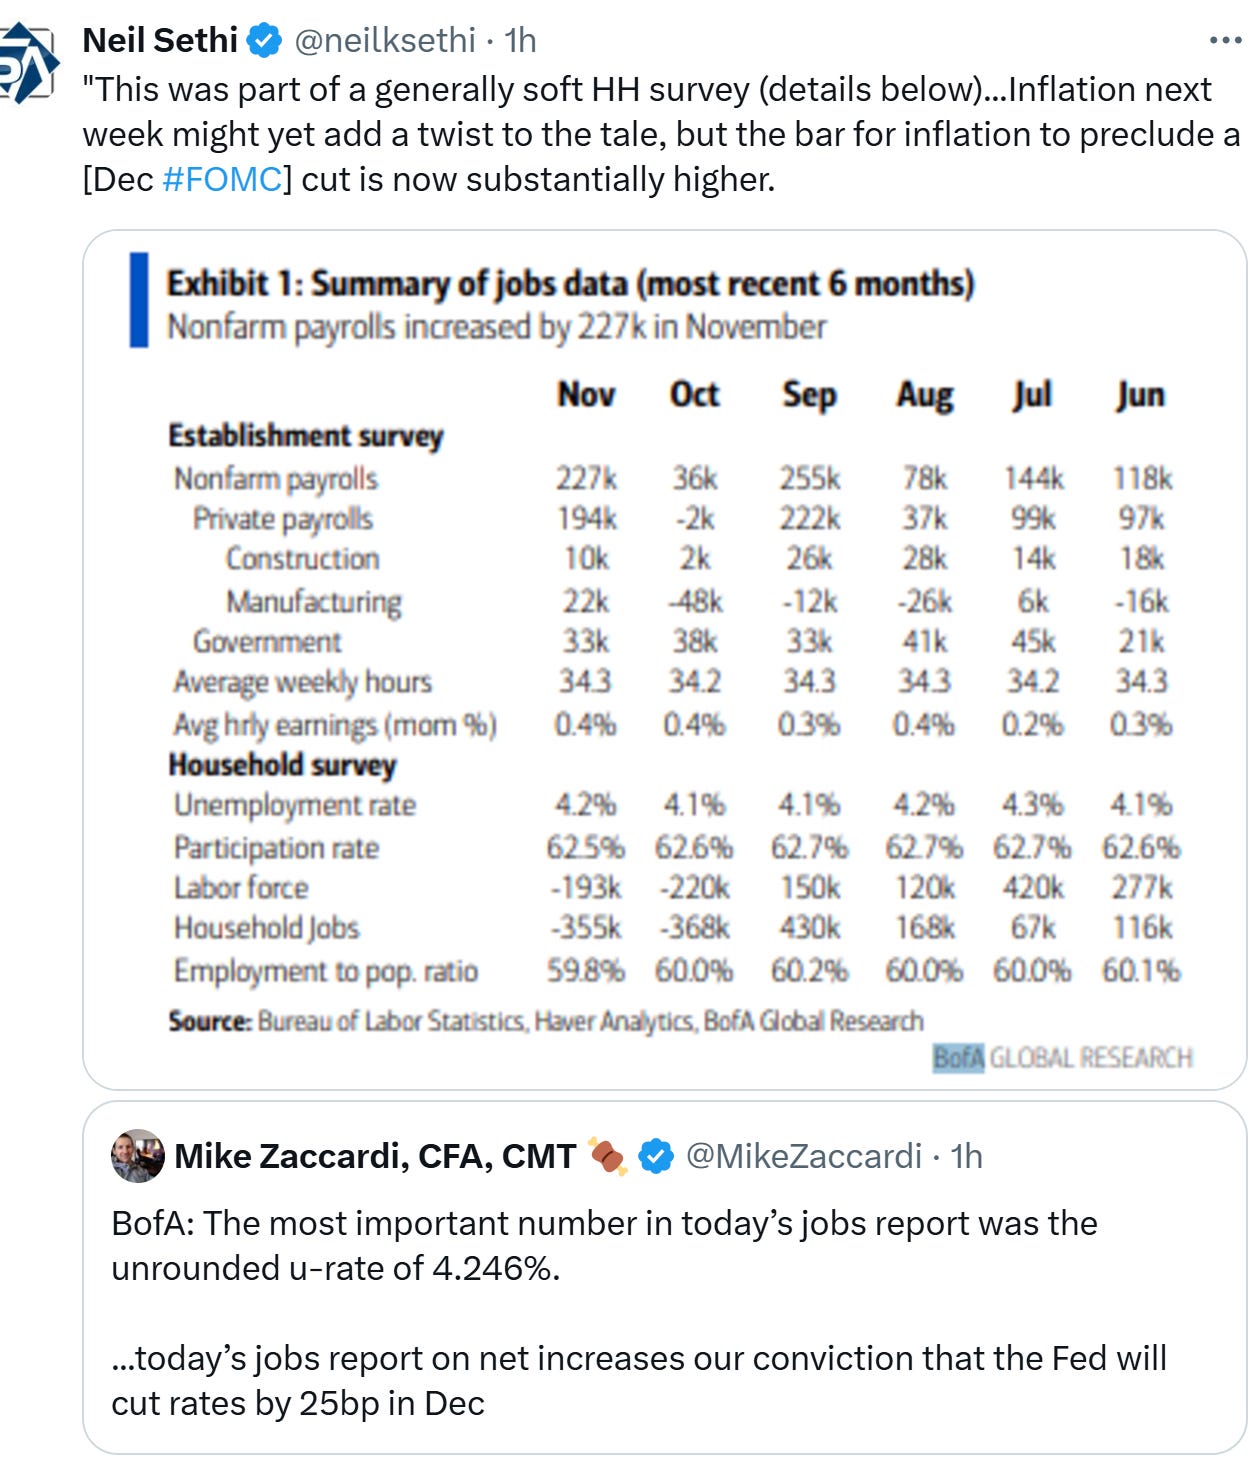
Here’s more reaction to the jobs report:
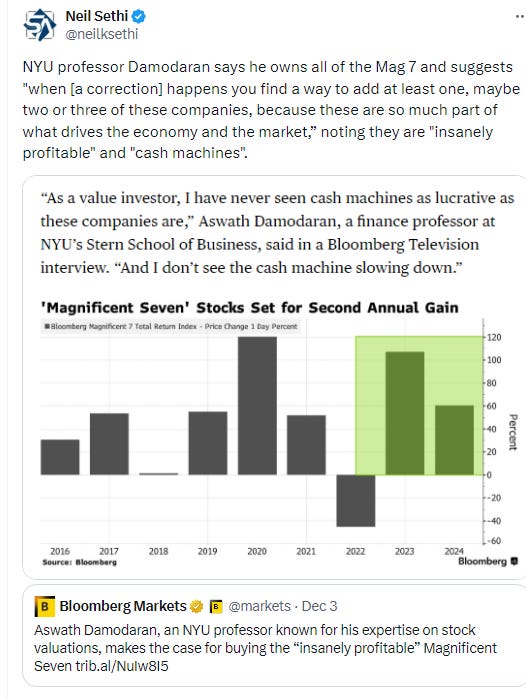
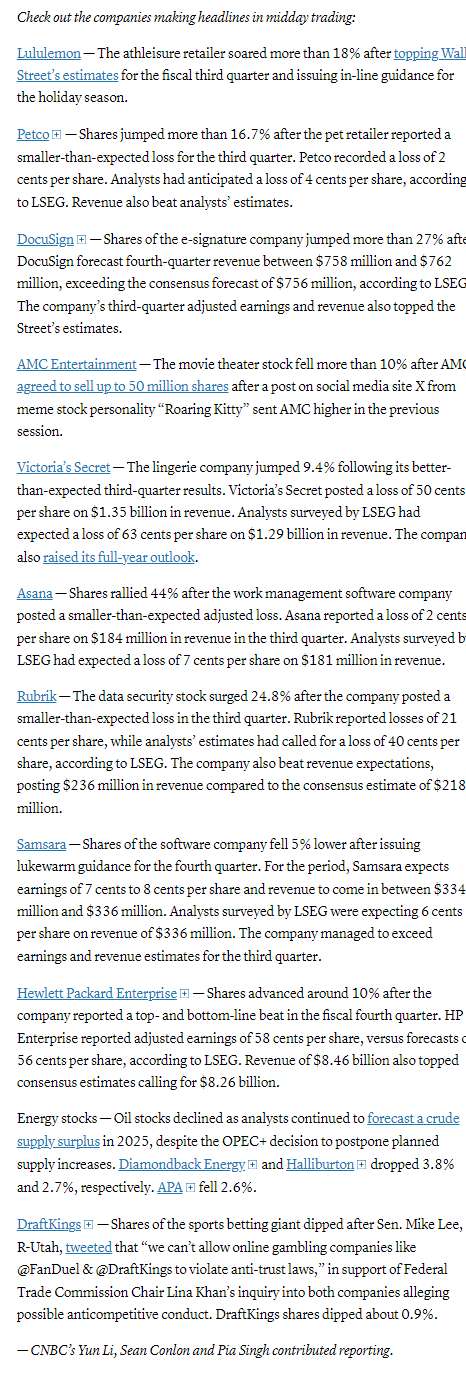
In individual stock action, the market benefited from leadership from the mega-cap stocks (the BBG Mag 7 index was +1.9% today), a rare (for this week) positive showing from the small-cap stocks, and enthusiasm following the earnings results and guidance from the likes of lululemon athletica (LULU 399.60, +54.79, +15.9%), DocuSign (DOCU 106.99, +23.31, +27.9%), and Ulta Beauty (ULTA 428.17, +35.30, +9.0%). Meta Platforms Inc. and Alphabet Inc. climbed as TikTok’s Chinese parent company faces a ban in the US if it doesn’t meet a deadline to sell the app. Nvidia Corp. weighed on chipmakers though, with Qualcomm Inc. also down as Apple Inc. prepares a modem rollout that will replace components from its longtime partner.
Corp Highlights from BBG:
Federal Trade Commission Chair Lina Khan and Assistant Attorney General Jonathan Kanter should look into allegations around FanDuel Inc. and DraftKings Inc.’s conduct related to competition, senators say, according to a letter posted on X.
Lululemon Athletica Inc. posted its biggest one-day gain since 2018 on optimism the upscale activewear brand is overcoming competition and cautious consumers
DocuSign Inc., a maker of electronic-signature software, boosted its revenue forecast for the full year. Analysts were positive about the early contract renewals.
Victoria’s Secret & Co. raised its outlook after reporting third-quarter sales that topped Wall Street expectations, saying shoppers had an early positive response to its holiday merchandise.
Aviva Plc reached a preliminary agreement to buy Direct Line Insurance Group Plc for £3.6 billion ($4.6 billion) in a deal that would create the UK’s largest motor insurer.
Some tickers making moves at mid-day from CNBC.
In US economic data we had
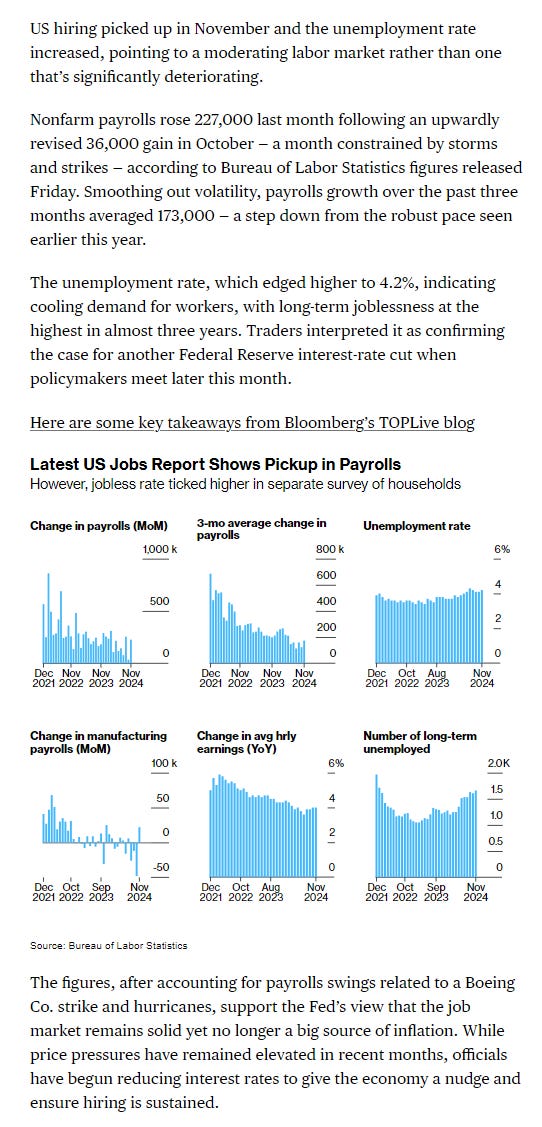
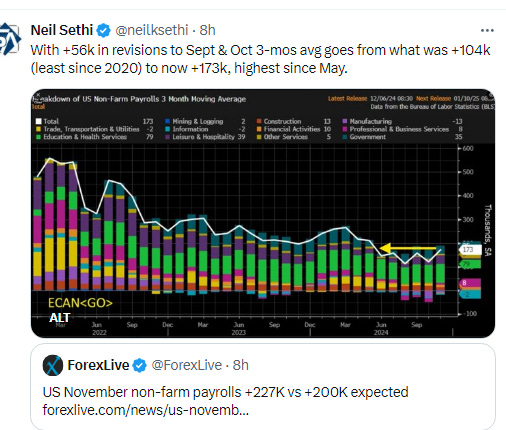
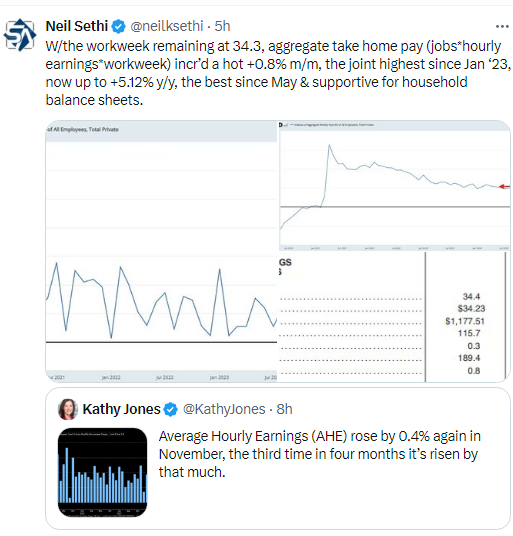
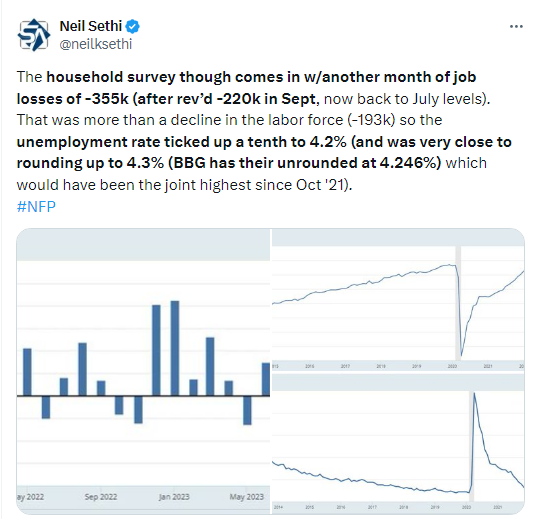
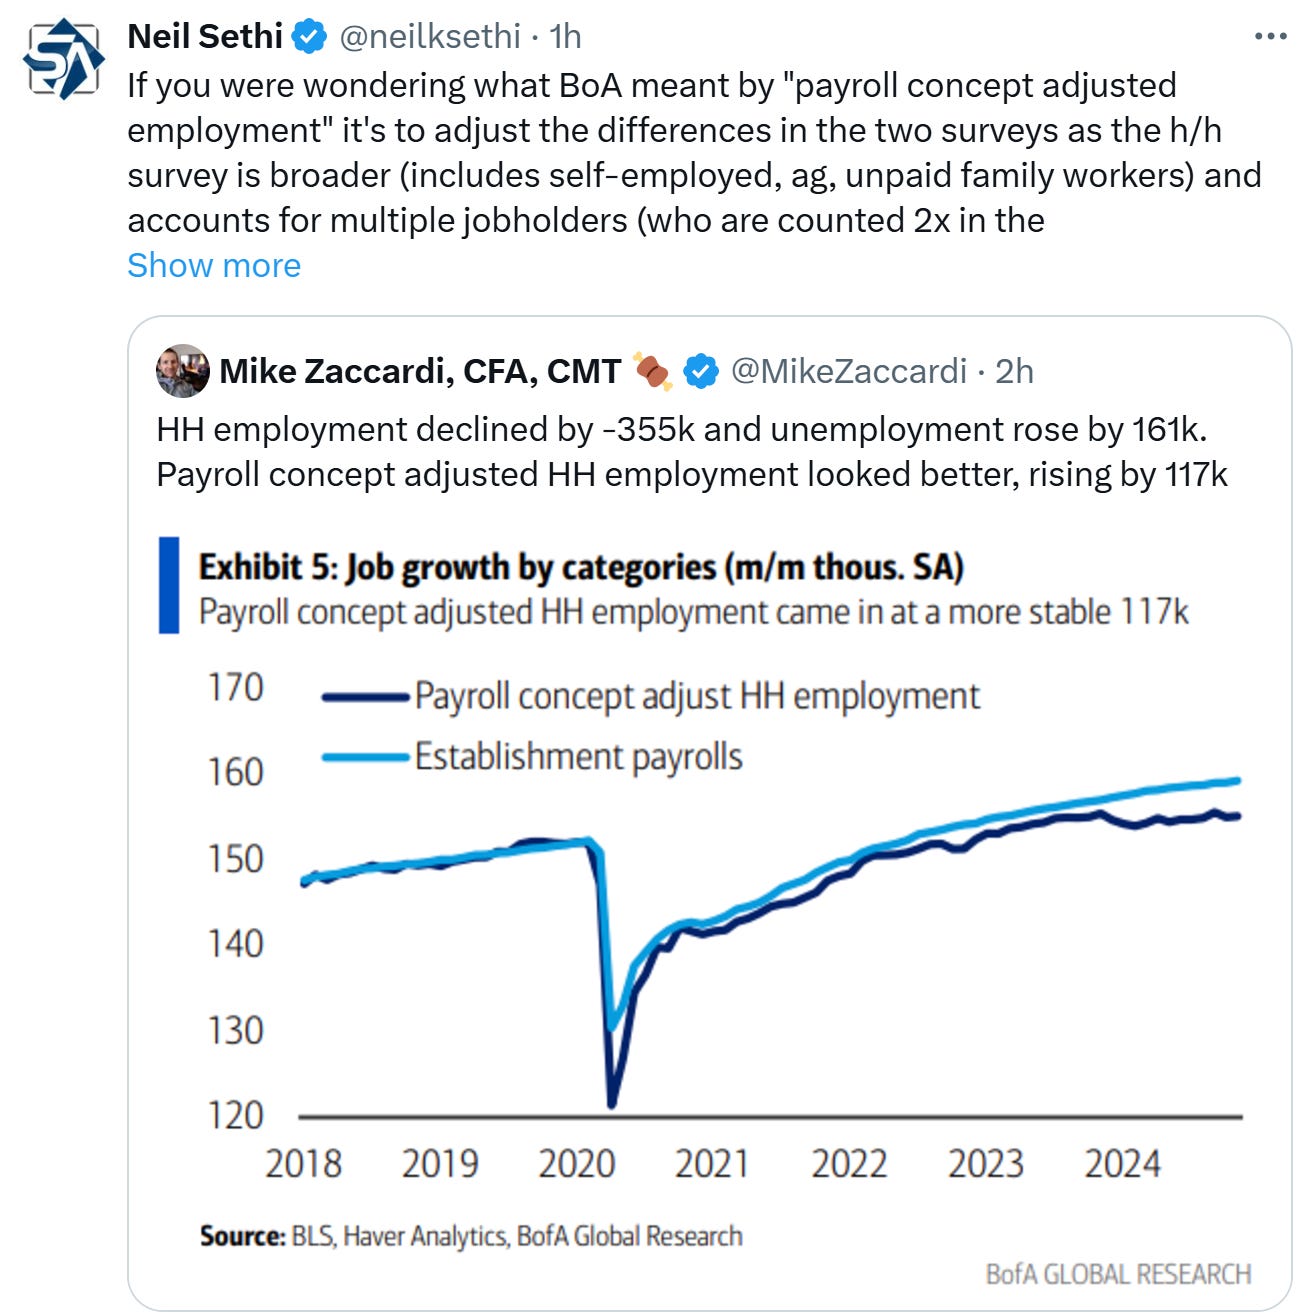
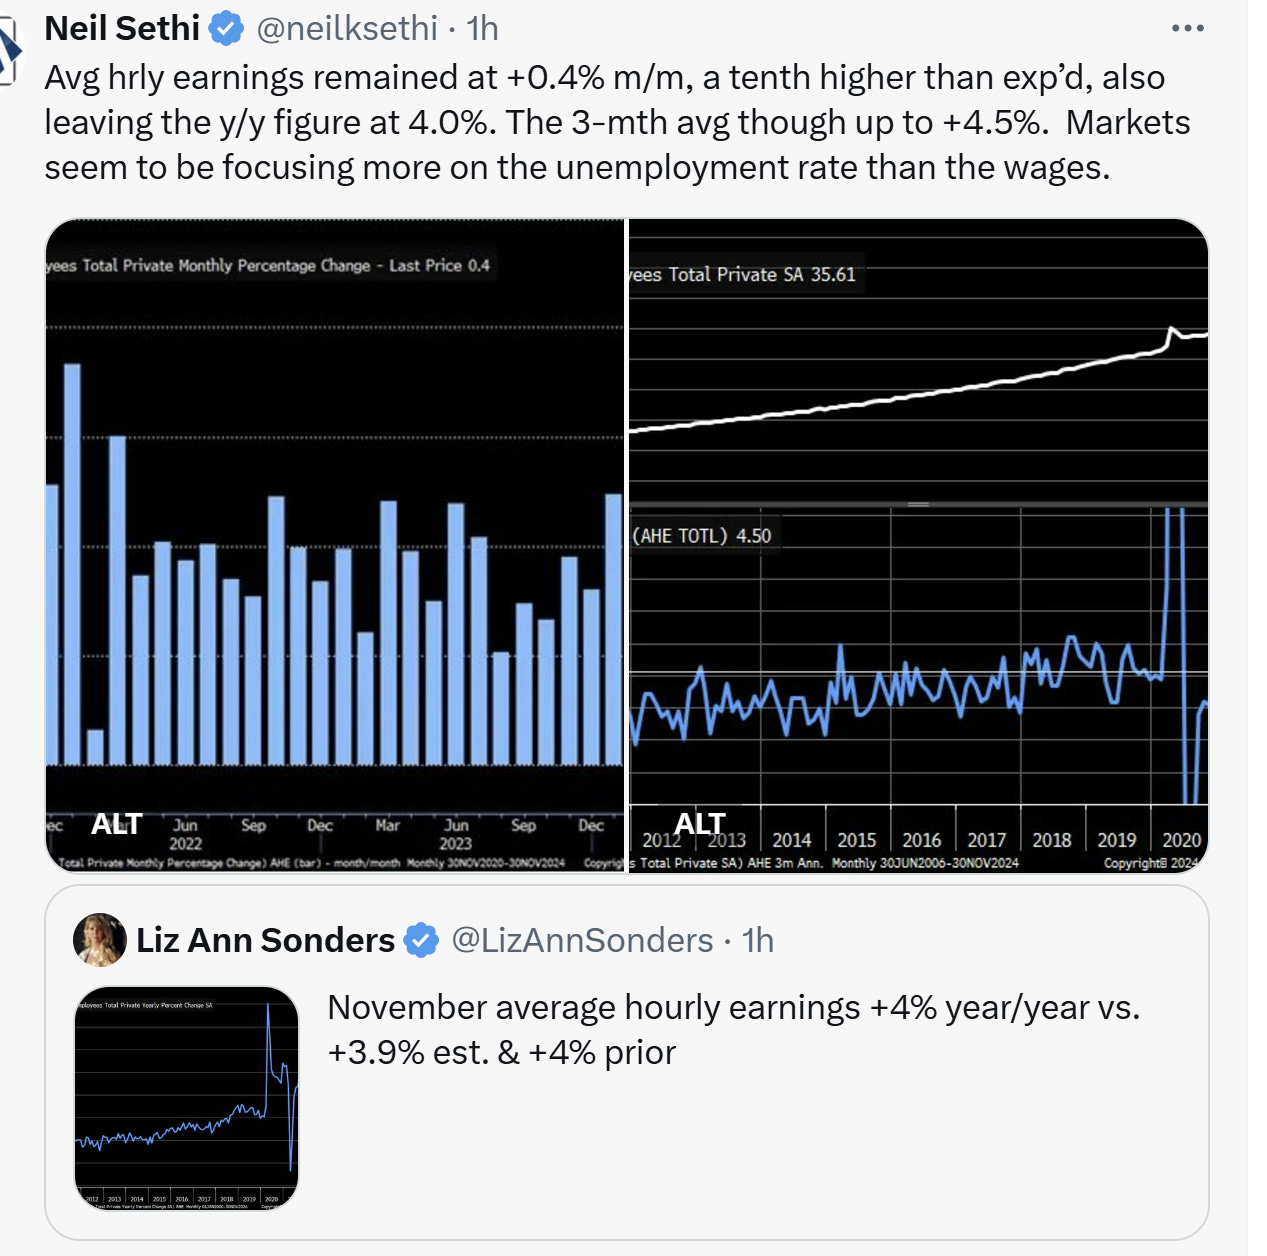
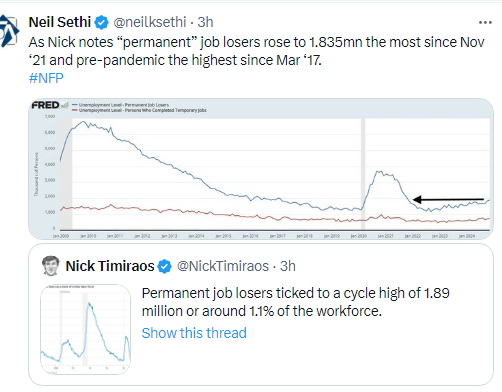
The Nonfarm Payrolls report which was a mixed bag with slightly better than expected employer payrolls growth along with strong earnings growth paired with the household survey showing job losses which pushed the unemployment rate higher. Lots of other puts and takes but that was the meat of it.
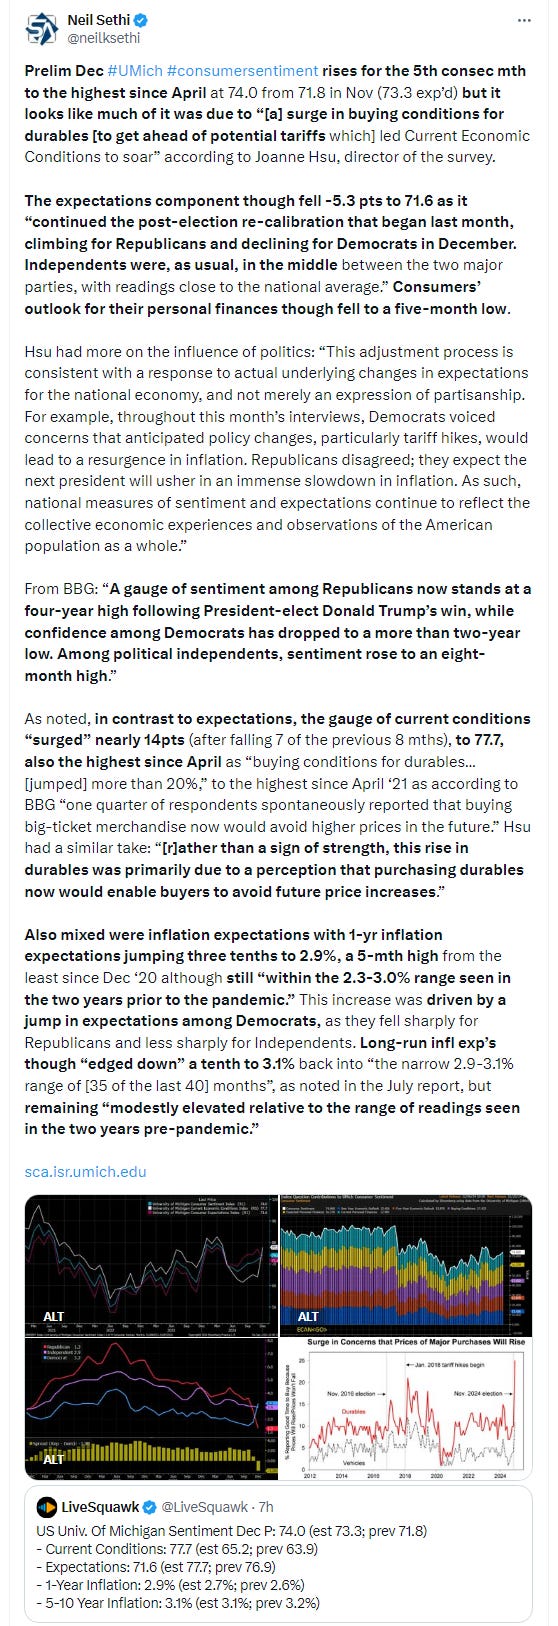
Prelim Dec U of Mich consumer sentiment which rose for the 5th consec mth to the highest since April but it was largely due to a surge in buying for durables to get ahead of potential tariffs. Expectations on the economy and personal finances fell and inflation expectations were mixed. All of this was largely a result of changes in those who identified as Democrats with Republicans and Independents little changed with much higher confidence levels (which is typical post-elections).
Link to posts - Neil Sethi (@neilksethi) / X (twitter.com) for more details.
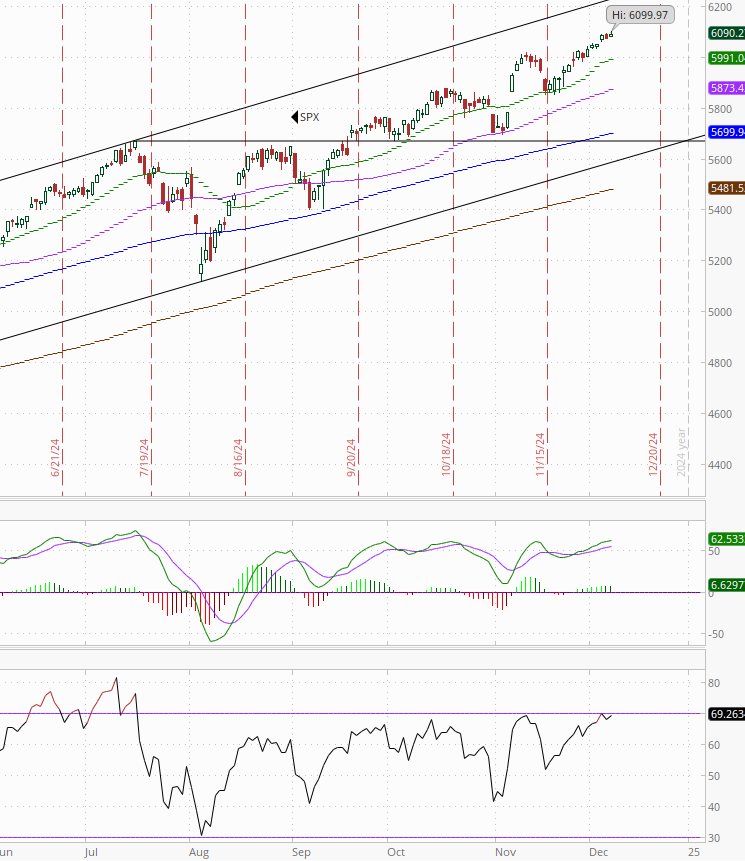
The SPX another ATH (its 57th), up for the 12th session in 14. Its daily MACD & RSI remain positive.
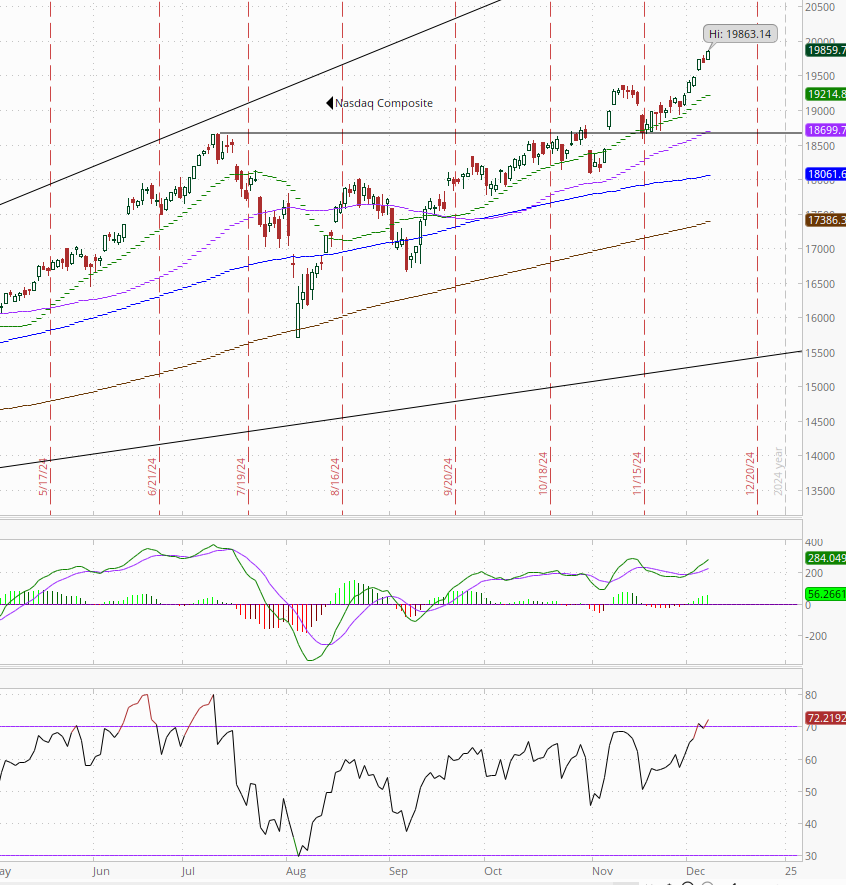
The Nasdaq Composite similarly moved to another ATH. Its daily MACD & RSI also remain positive.
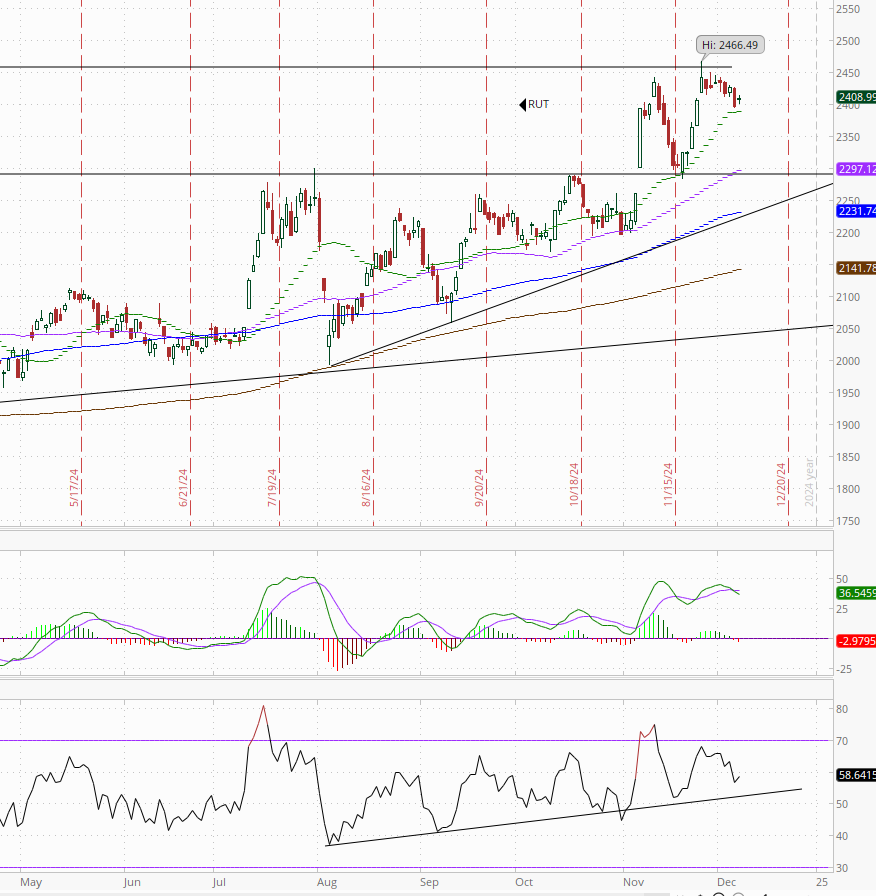
RUT (Russell 2000) edged off the lowest close in 2 weeks remaining above its 20-DMA. Its daily MACD & RSI remain have turned more neutral as noted Thursday.
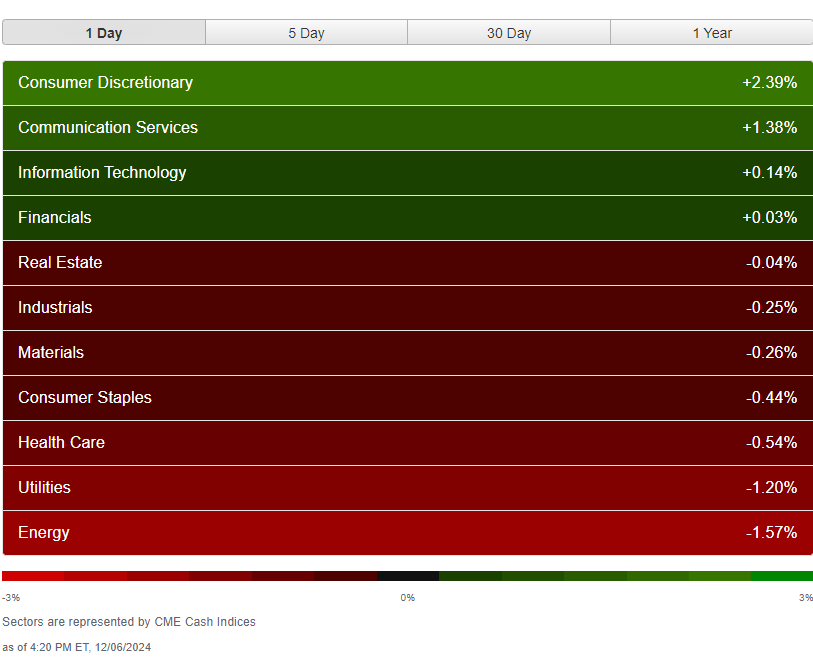
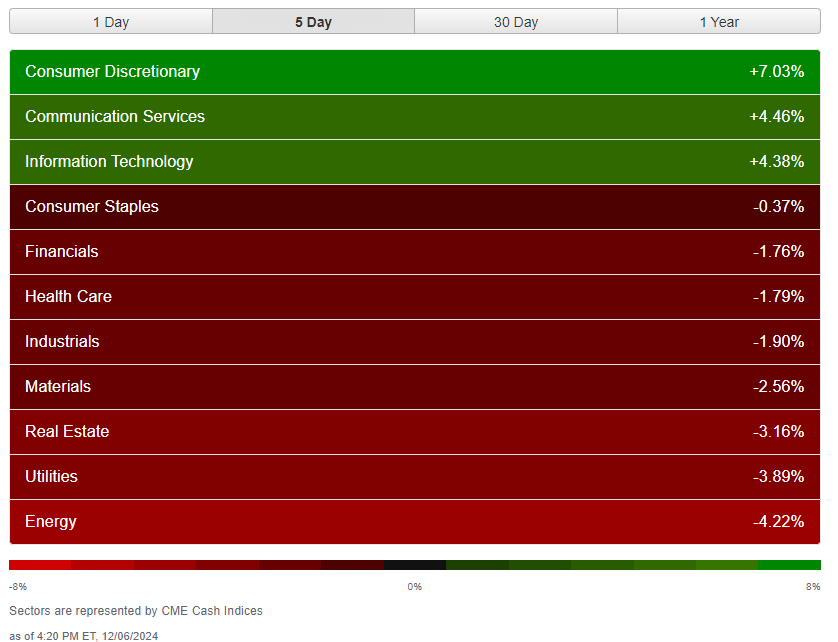
Equity sector breadth from CME Indices down to four green sectors (really just three w/financials effectively flat) from five the past 3 days and for the 4th session in 5 it was all a megacap growth story with those sectors taking the top 3 spots. Two of them up over 1% seeing all three of them gain at least 4% on the week. Every other sector down for the week with utilities and energy lagging both today (only 2 sectors down more than -1%) and for the week (both down around -4%).
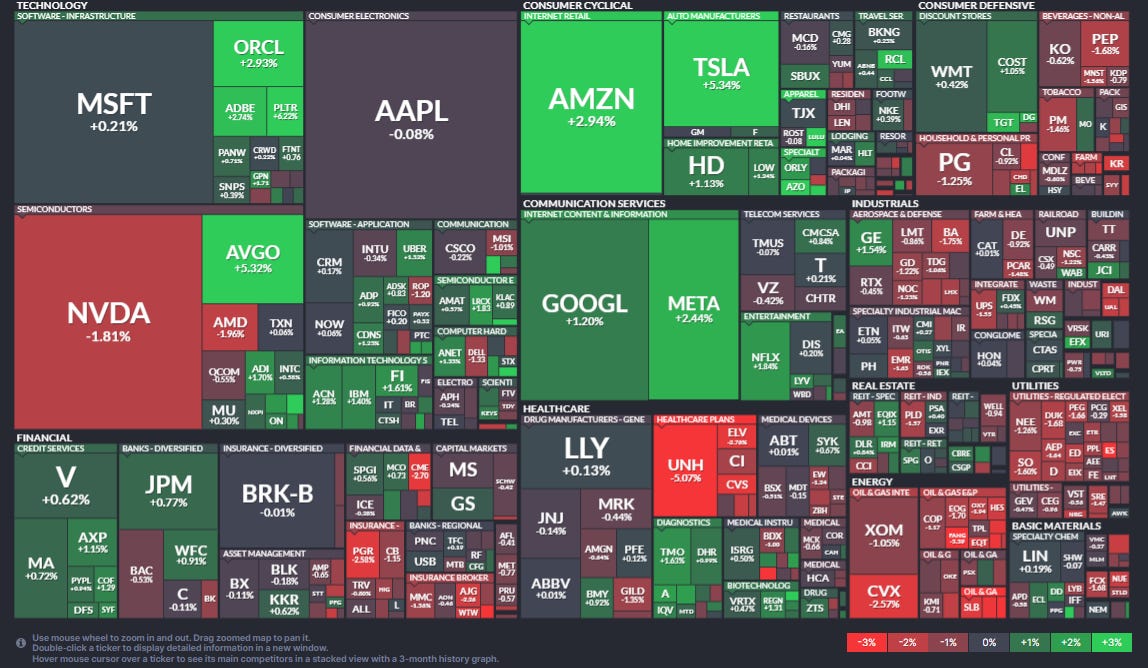
Stock-by-stock SPX chart from Finviz fairly consistent with a huge day in the consumer discretionary (“cyclical”) zone, but much more mixed action elsewhere. Every utilities component was down, all but 1 in energy, defense, insurance, and a few other areas.
Positive volume remained “ok” on the NYSE on Friday in line with the negative day in the NYSE Composite index, remaining at 48% despite the slightly larger index loss. The Nasdaq bounced back to 71% from 50% almost as good as Wed’s 73% even though it had a smaller gain. Issues were weaker again though at 44 & 60%.
New highs-new lows saw a similar mixed performance with the NYSE falling to 70 the weakest since 11/20 while the Nasdaq improved to 140 from the least since 11/26. Both remain below the respective 10-DMAs and the NYSE’s has now turned lower (more bearish).
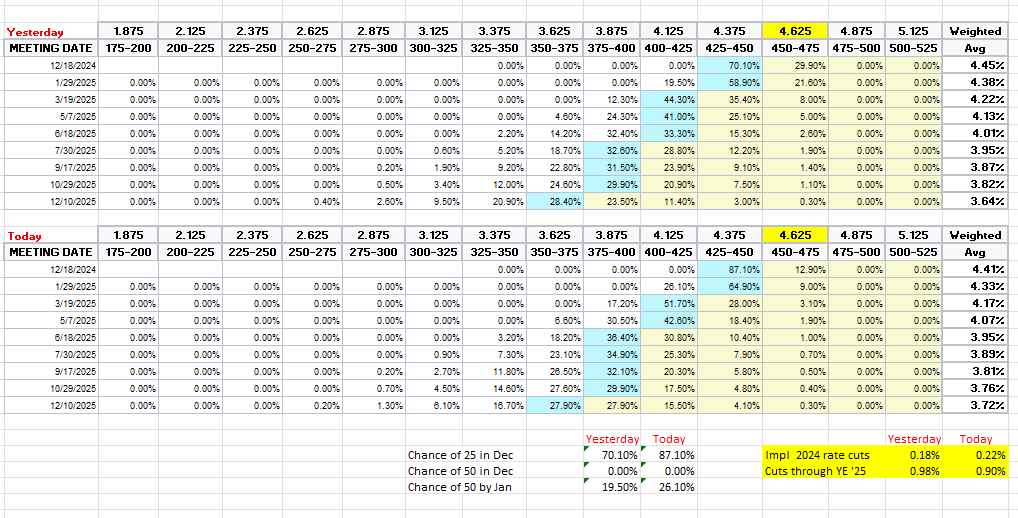
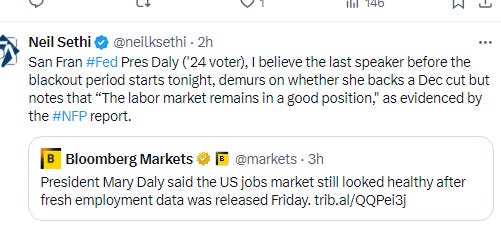
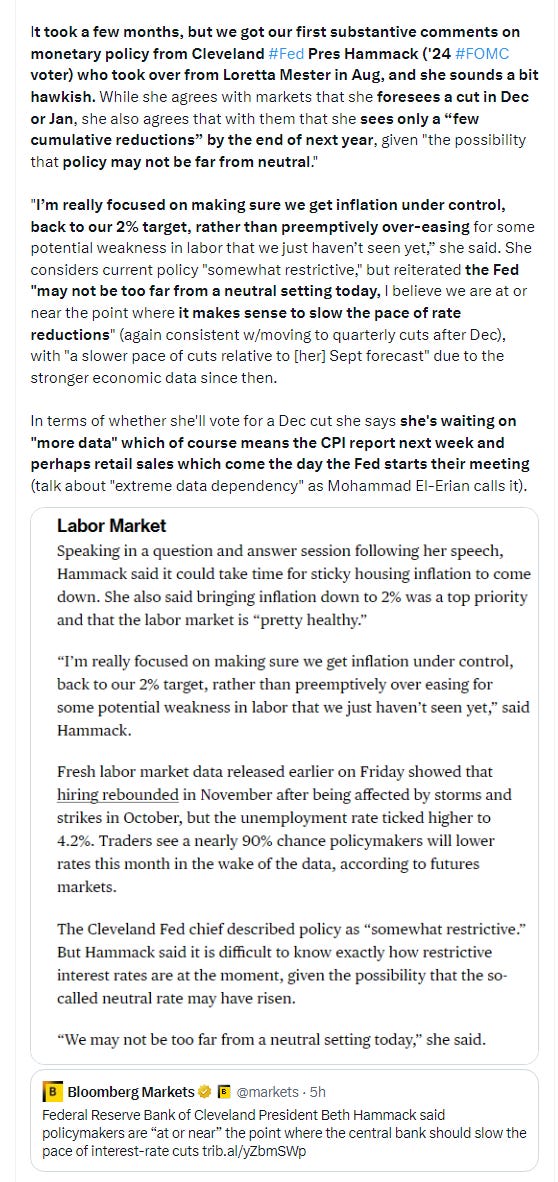
FOMC rate cut probabilities from CME’s #Fedwatch tool seemed to focus on the weak parts of the NFP report (Fed speakers weren’t particularly helpful although Beth Hammack did indicate she thought a cut was coming either Dec or Jan) with bets on a December cut firming to 87% Fri from 70% Thurs (now the highest since before the July FOMC meeting (when they held rates steady)). Total cuts through YE 2025 fell back to 90bps as that data error in Dec ‘25 was corrected. Ignoring that it’s also the highest since July and keeps us closer to 4 cuts than 3.
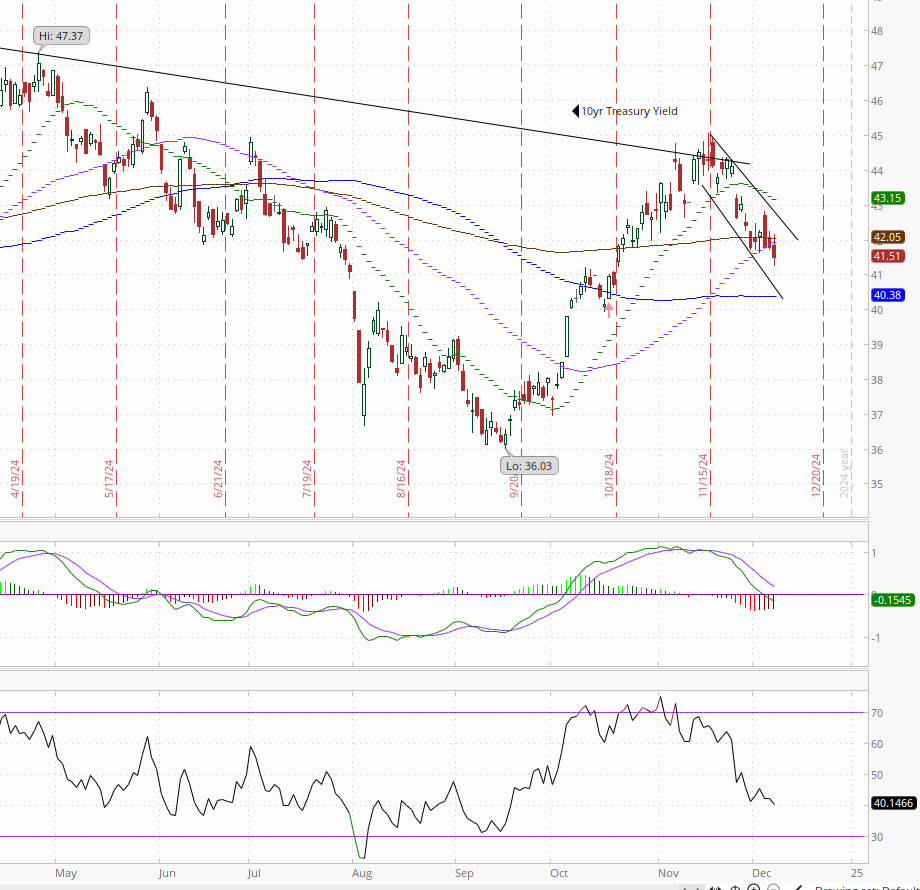
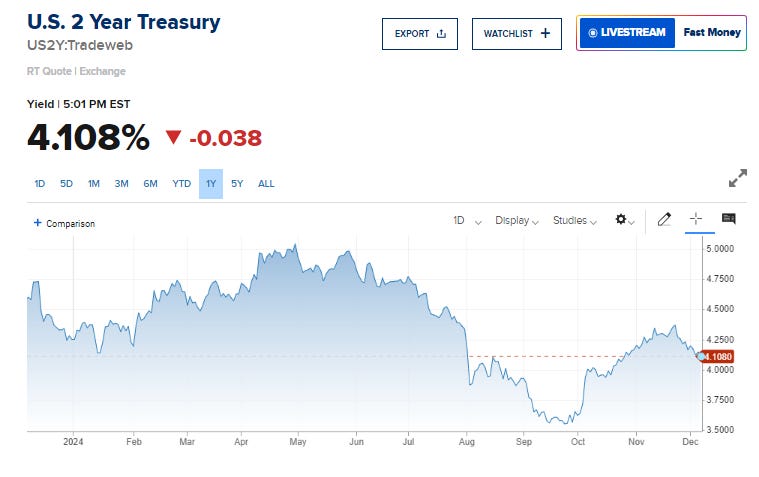
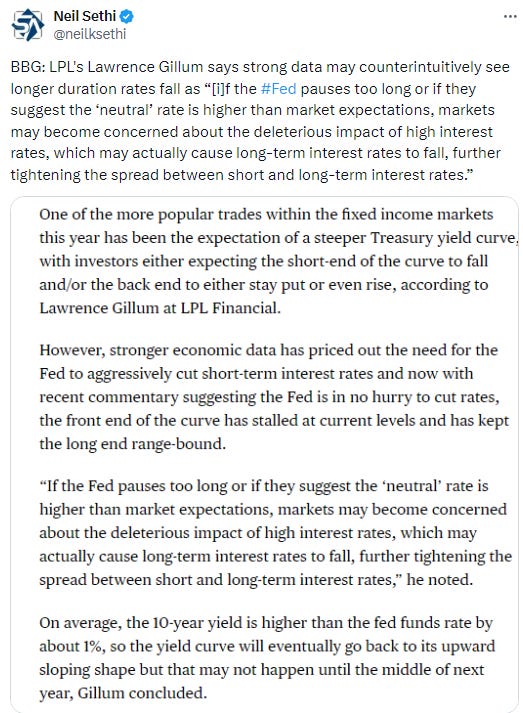
Treasury yields fell in line with the increased bets on a Dec cut with the 10yr yield, more sensitive to economic growth and long-term inflation, down -3bps to 4.15%, the lowest close since Oct 18th, -27bps since the election and breaking under the 50-DMA setting up a test of the 4-4.1% area, and the 2yr yield, more sensitive to Fed policy, fell -4bp to 4.11% down -16bps since the day after the election (and -25bps since last Monday) to the lowest close since Oct 25th.
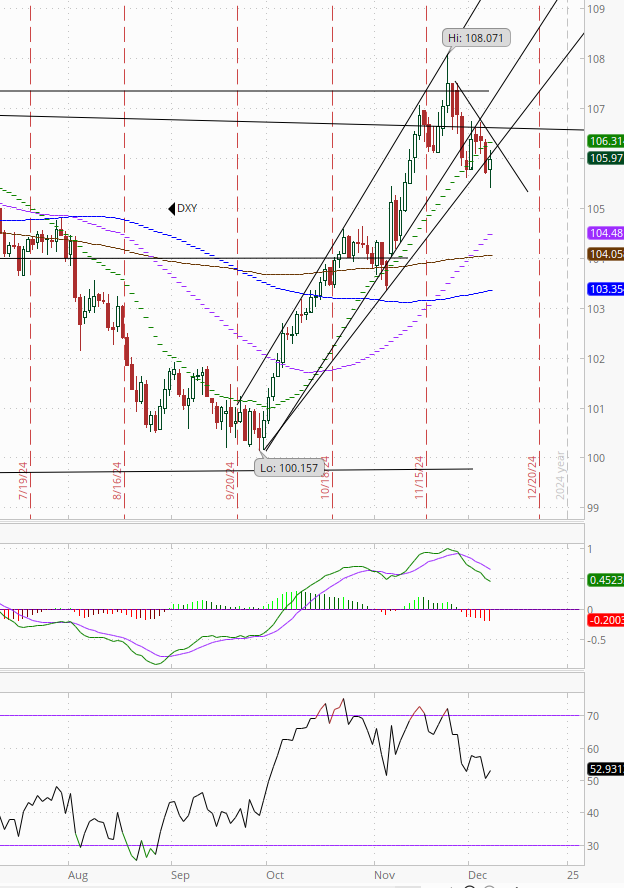
Dollar ($DXY) fell to the lowest in nearly a month before recovering to finish up for the day, but remaining under the 2nd fan line from the Sept lows, consistent w/last week’s note that its daily MACD & RSI had moved negative. The RSI bounced from the weakest since Oct 1st but not yet under 50. As noted earlier this week “not much support until around the $104 area, and we may start to see some real CTA selling soon.”
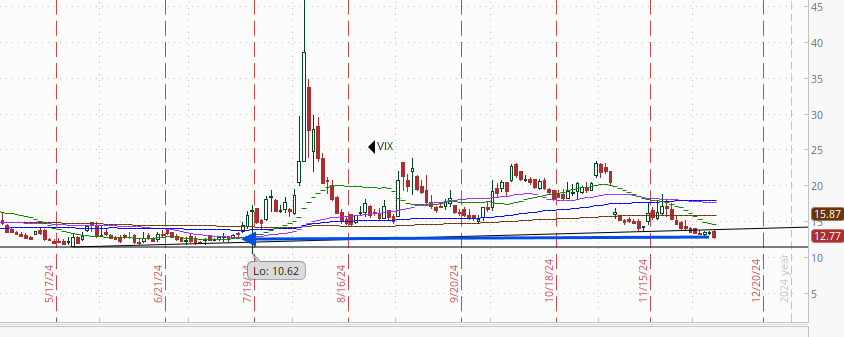
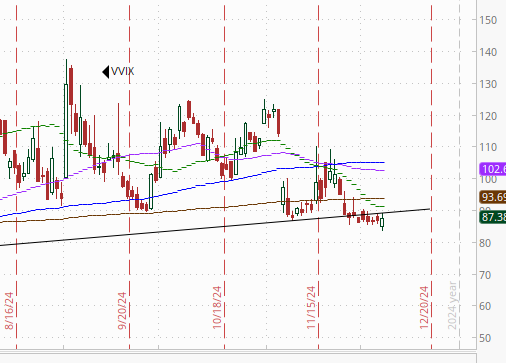
The VIX fell to the least since July at 12.7 (consistent w/0.87% daily moves over the next 30 days) while the VVIX (VIX of the VIX) was little changed at 87 (consistent with “moderate” daily moves in the VIX over the next 30 days).
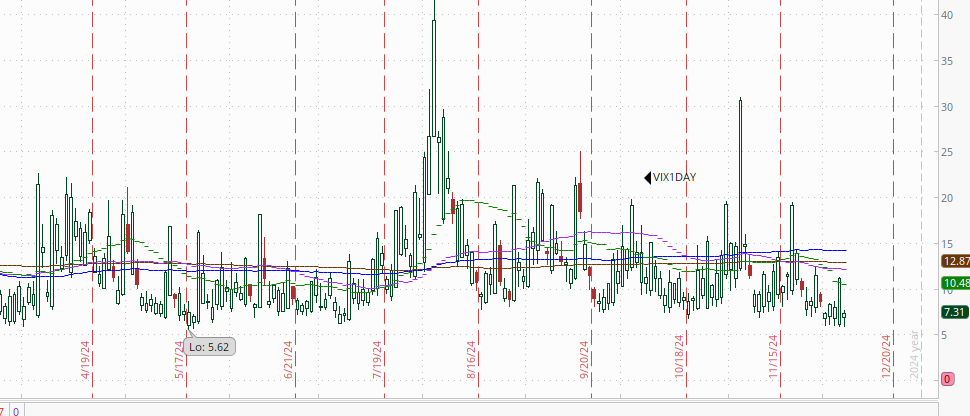
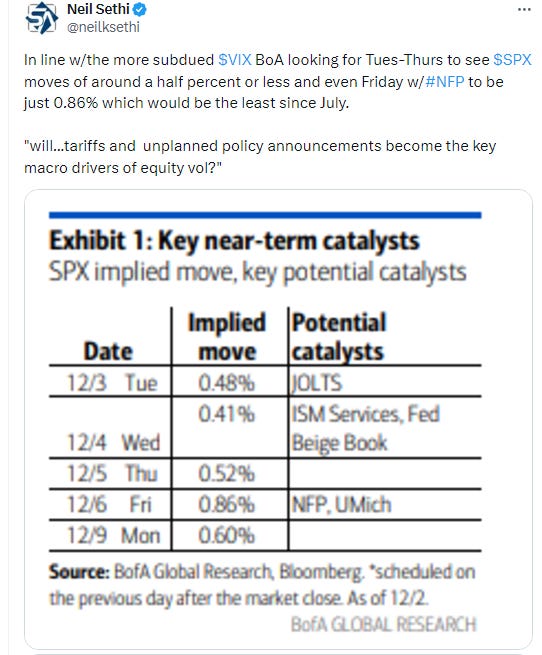
1-Day VIX dropped back with NFP in the rearview window to a 7.3, the 2nd lowest close (after Monday) since May, looking for a move of +0.46% Monday, less than the +0.60% BoA said was implied by options coming into the week.
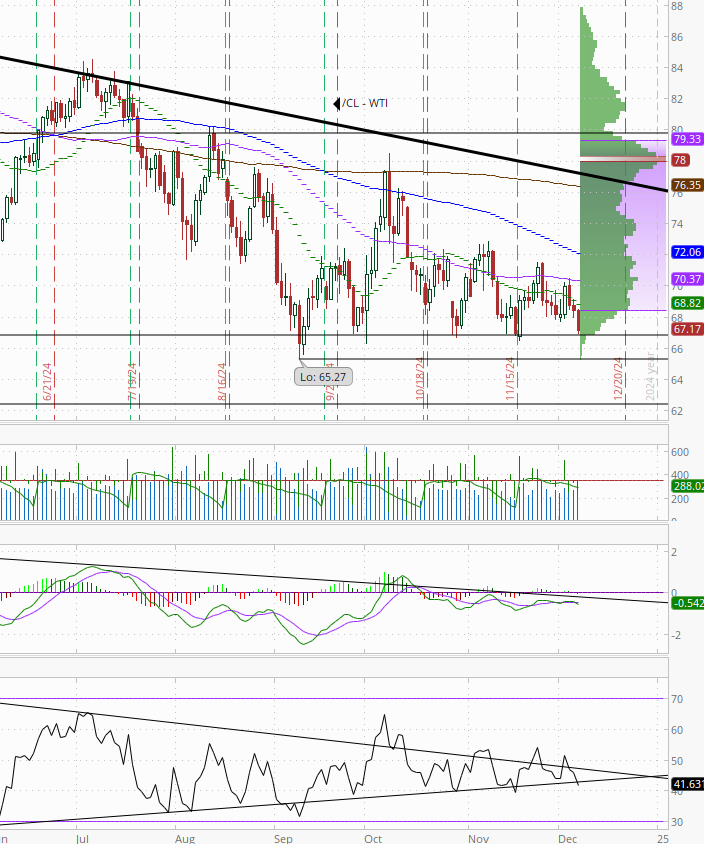
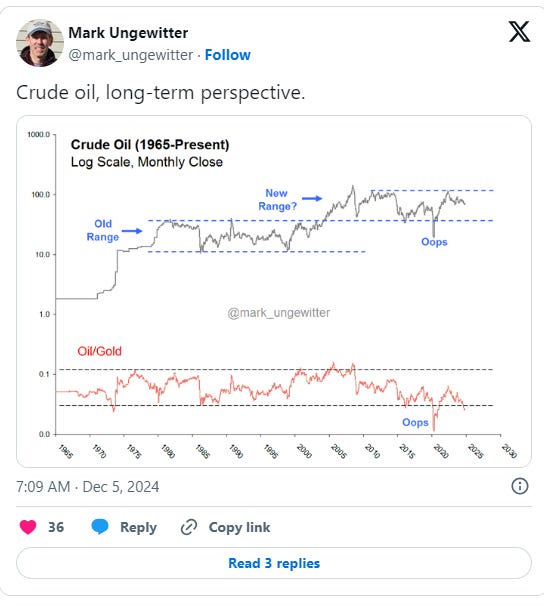
WTI finally made it down to the $67 target I put on it when it reversed lower Nov 25th. This was the 3rd lowest close since Mar ‘23. It’s been able to bottom in this area every previous time this year. We’ll see if it can do it again. Daily MACD & RSI are weak but surprisingly not terrible (yet).
Gold as predicted (sort of) in Thursday’s update changed the 6-day pattern and didn’t test the resistance of the 50-DMA, instead falling back. As noted when that pattern started, “until it gets over that, we have to look lower not higher,” and that’s still the case. The daily MACD remains relatively positive, but the RSI has fallen off so the technical picture is also starting to deteriorate. As I mentioned Thursday “seems like bitcoin has stolen some of gold’s thunder.”
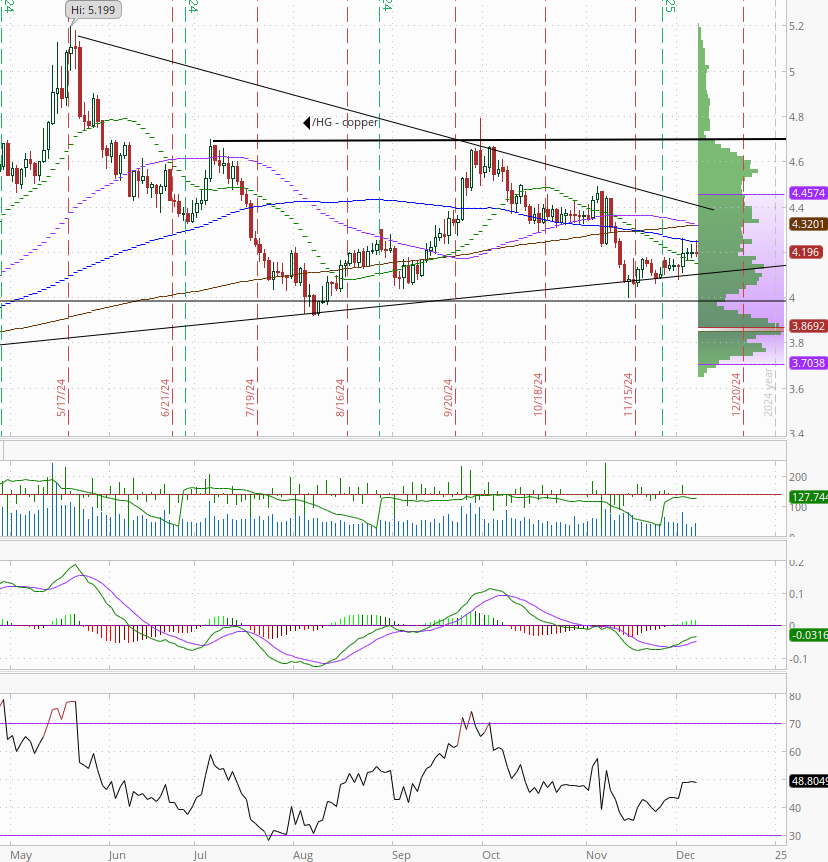
Copper (/HG) little changed for a 3rd day remaining near 3-week highs. As noted Tues, “not much resistance if it wants to take a run at the 50-DMA (purple line), although it seems to have found some in the 100-DMA (dark blue line). The congestion zone runs through the $4.50 level.”
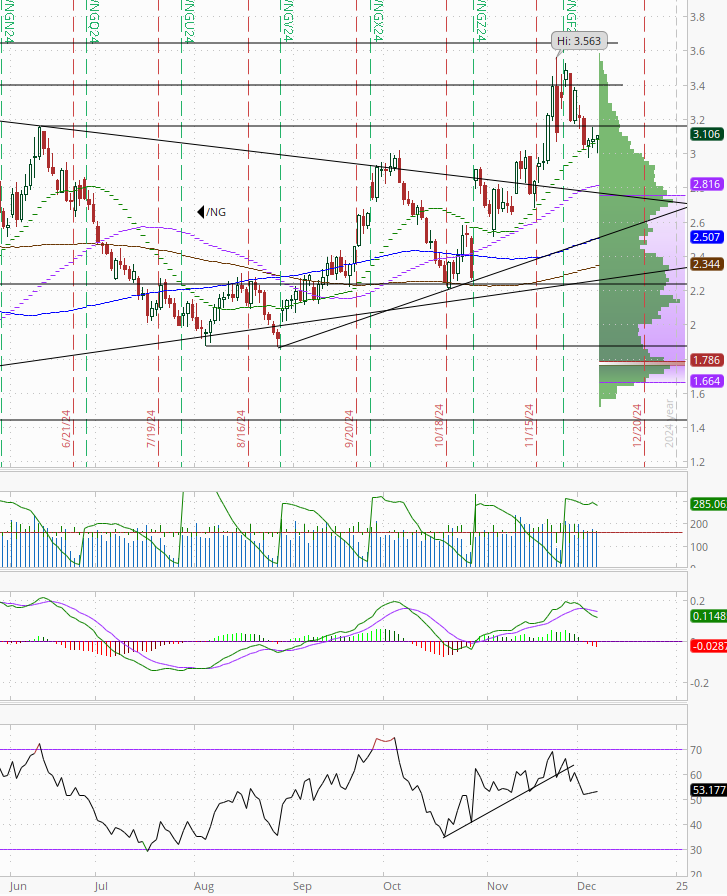
Nat gas (/NG) again fell under its 20-DMA but again recovered remaining below the $3.17 resistance level of the June highs. As mentioned Wednesday “the daily MACD has turned more bearish, but the RSI is more neutral, so we’ll see if it can clear that $3.17 level or if we’re looking at a deeper correction.”
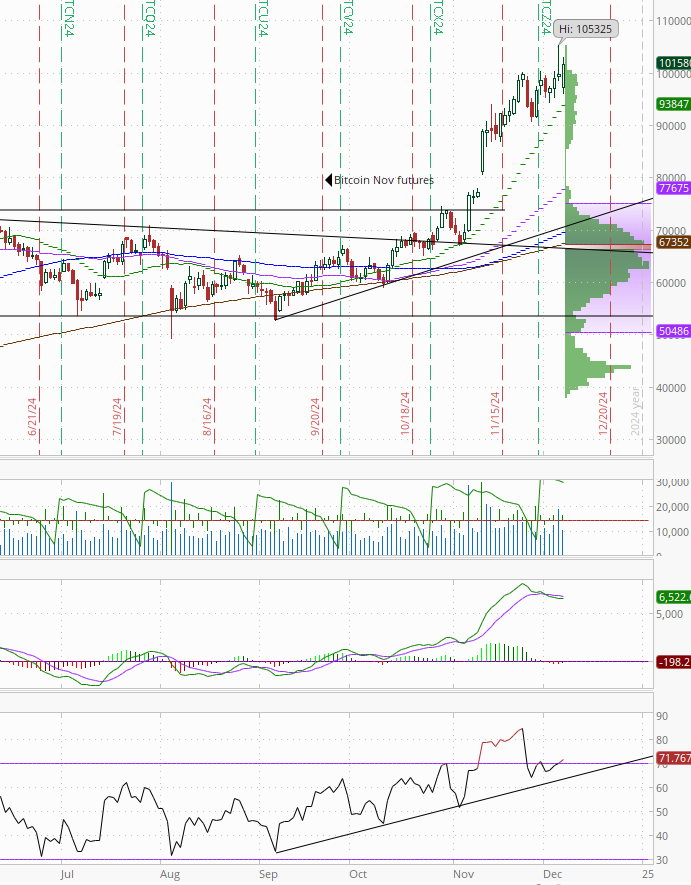
Bitcoin futures extended to new all time closing highs above the $100k level negating the potential “shooting star” reversal pattern. The daily MACD & RSI as noted Monday “have turned more negative again but that has actually been a contrary indicator with Bitcoin for the most part this year. I continue to see it equally likely to break either way from this $90-100k range.” I think we can probably say it appears that breakout is to the upside. I’m starting to get a little FOMO given my relatively small position (was waiting for a pullback to test the breakout which might take longer than I thought).
The Day Ahead
Enjoy the weekend!e
Link to X posts - Neil Sethi (@neilksethi) / X (twitter.com)
To subscribe to these summaries, click below (it’s free!).
To invite others to check it out,


