
Markets Update - 1/9/26
Update on US equity and bond markets, US economic data, the Fed, and select commodities with charts!

To subscribe to these summaries, click below (it’s free!).
To invite others to check it out (sharing is caring!),
Link to posts - Neil Sethi (@neilksethi) / X
Note: links are to outside sources like Bloomberg, CNBC, etc., unless it specifically says they’re to the blog. Also please note that I do often add to or tweak items after first publishing, so it’s always safest to read it from the website where it will have any updates.
Finally, if you see an error (a chart or text wasn’t updated, etc.), PLEASE put a note in the comments section so I can fix it.
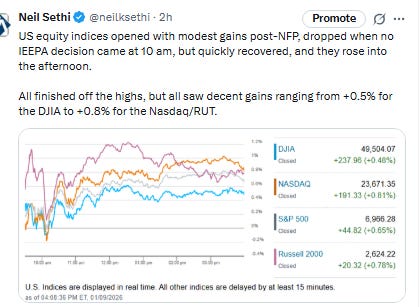
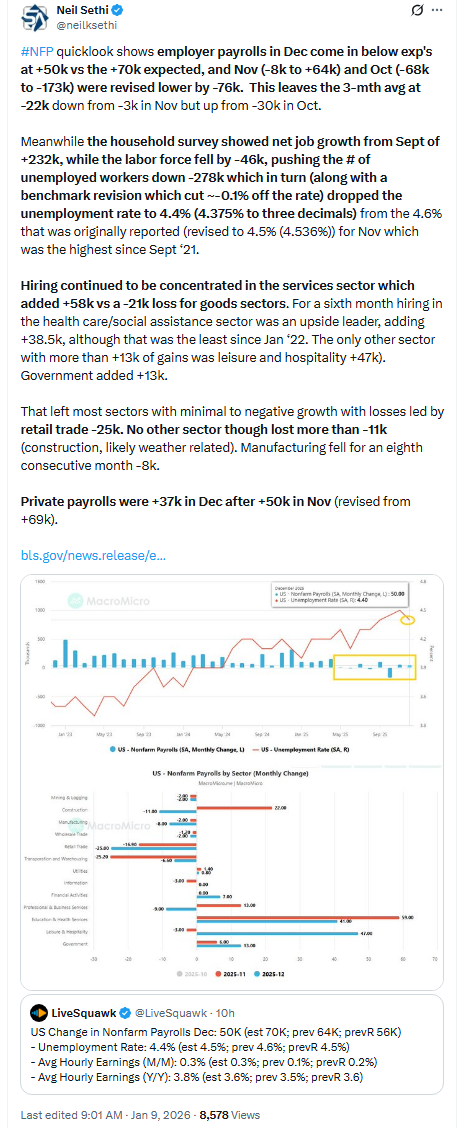
US equity indices started Friday’s session with modest gains as they digested a mixed NonFarm Payrolls report which saw employer payrolls come in below expectations, with what hiring there was concentrated in the health care and leisure/hospitality industries, but a stronger reading from the household report that saw the unemployment rate fall back. The latter saw FOMC rate cut bets pared back with a first cut now not priced until June (and then just at 50%).
Following the open stocks meandered as they awaited the 10.00 ET release of Supreme Court opinions which contained only a single opinion, and not the one markets were waiting for - a ruling on the legality of the broad tariffs imposed by President Donald Trump (the next release will be Wednesday). Indices initially dropped to the lows of the day but quickly recovered, and they rose into the afternoon ending clustered together with decent gains ranging from +0.5% for the DJIA to +0.8% for the Nasdaq/Russell 2000 (RUT). All but the Nasdaq set all-time closing highs.
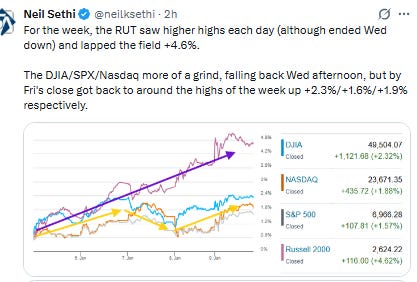
For the week, the RUT saw higher highs each day (although ended Wednesday lower) and lapped the field +4.6%. The DJIA/SPX/Nasdaq all saw more of a grind this week, most notably falling back Wednesday afternoon, but by Friday’s close they had gotten back to around the highs of the week ending up +2.3%/+1.6%/+1.9% respectively.
Elsewhere, bond yields edged higher, and the dollar rose to a 1-month high. Commodities were mixed with crude, gold, and copper higher, bitcoin and natgas lower.
The market-cap weighted S&P 500 (SPX) was +0.7%, the equal weighted S&P 500 index (SPXEW) +0.6%, Nasdaq Composite +0.8% (and the top 100 Nasdaq stocks (NDX) +0.8%), the SOXX semiconductor index +2.7%, and the Russell 2000 (RUT) +0.8%.
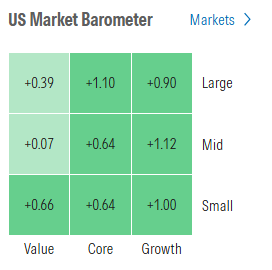
Morningstar style box all green for the first time since Tuesday.
Market commentary:
“The jobs report is a mixed bag,” said Art Hogan, B. Riley Wealth chief market strategist. “We continue to see an environment where companies are slow to hire and slow to fire. The overarching takeaway in today’s report is that there is more good news than bad in the first on time Jobs report in three months.”
"The good news is that the economy only needs 50K jobs/month to keep the labor market stable — the better news is that incomes are up and growing. Lower rates are coming from the Federal Reserve," said Jamie Cox, managing partner at Harris Financial Group, in commentary shared with MarketWatch.
Friday’s release of the December jobs report revealed that the U.S. labor market is holding up “reasonably well” and “finding a tenuous equilibrium marked by light hiring and firing in parallel,” said Jason Pride, chief of investment strategy and research at Glenmede. “The November employment report was taken through a fog of shutdown-related distortions; this month’s release offers a clearer view of the labor market’s underlying condition,” Pride said in an email. “Many investors were careful not to read too much into the prior figures ... In comparison, today’s release is the first taken under clearer skies and more reliable visibility.”
Considering the latest payrolls data alongside the JOLTS and ADP reports released this week, Anthony Saglimbene of Ameriprise Financial believes the consensus around the U.S. employment backdrop is that it has “softened” but is also “remaining firm.” This reflects a “low-hire, low-fire” environment, he added. “What could have been a risk is that you could have seen employment fall off a little bit more than expected, and I think that would have maybe kind of concerned investors,” the chief market strategist said. “We get through the week on the employment side with mostly as-expected numbers, which I think is a positive.”
“This nonfarm payrolls report is the first report in a couple months that the data is clean,” Saglimbene said. “Looking at these numbers, it suggests that the Fed probably doesn’t need to cut in January, and maybe they don’t need to cut in March as well.”“You had a data print that was slightly below expectations, you had the unemployment rate go down. That’s helping the cyclical corners of the market outperform,” said Jose Torres, senior economist at Interactive Brokers.
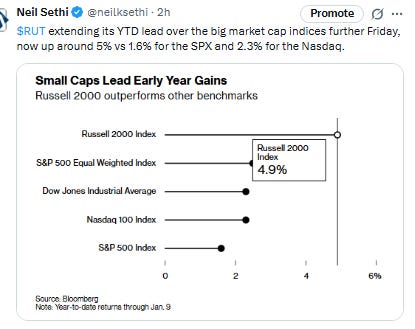
Torres pointed out that the Russell 2000, an index of small-cap stocks, was headed for a fresh record high on Friday. “Interest-rate cuts are getting pushed back a bit, but traders are still expecting two cuts in 2026,” he said. “Stocks are happy because the unemployment rate is going down, a sign we’re still seeing a healthy amount of jobs gains without putting too much pressure on the Fed to hold back on rate cuts. That’s great for equities.”
All eyes will be on the labor market, according to David Lebovitz of JPMorgan Asset Management, he has a more sanguine view of the year to come. “A stable market should allow forecasts for above trend growth to materialize and further disinflation. Not too hot, not too cold, just right,” he said. “We don’t think AI is a bubble, and expect that the application of this technology – and the associated profits – will broaden over the course of 2026.”
“The December jobs release provided the first clean read on the labor market since the government shutdown ended but did little to provide clarity about the state of the labor market given its mixed reading,” said Jeff Schulze, head of economic and market strategy at ClearBridge Investments. “On the positive side, the unemployment rate dropped to 4.4%, a positive given its rise had been a key concern and marker of labor weakness over the past year. On the negative side, revisions revealed fewer jobs created than previously believed with private payrolls bearing the brunt of the downgrade. This outcome should keep the Fed on hold for now, although the committee will remain vigilant for signs of further labor softening.”
Friday’s December jobs report revealed “a cooling labor market that isn’t yet cold” and is good enough to keep investors happy, according to strategist Matt Mena at 21shares, a Switzerland-based financial services company. The combination of a softer-than-expected nonfarm payrolls number and a slight decline in the U.S. unemployment rate hits the “sweet spot” for markets, Mena said in an email. “It shows a labor market that is softening enough to keep the Federal Reserve on a path toward rate cuts, yet resilient enough to avoid recessionary fears.”
To Karen Georges, a fund manager at Ecofi Investissements in Paris, the readout was “not catastrophic and the market is taking the view that the Fed will be content with these mediocre numbers for now.”
“While U.S. growth is solid, broad-based labor is not really participating in this economic vitality,” said Rick Rieder, BlackRock’s chief investment officer of global fixed income and head of the firm’s global allocation investment team, in emailed comments on Friday's jobs report. “The market pricing of two more policy rate cuts in 2026 at least is appropriate for this labor condition,” he said.
“The labor market has reached an equilibrium after a year of policy shocks. There are no red flags compelling the Fed to cut now. Inflation is a bigger factor on rates than employment, which focuses attention on next week’s CPI,” said David Russell, global head of market strategy at TradeStation. “Investors may see less impact from macro-level data in the next few months and more impact from company-level events like earnings.”
The U.S. stock market is set up for a “good year,” said Jack Janasiewicz, portfolio manager and lead portfolio strategist at Natixis Investment Managers, who is expecting S&P 500 earnings growth of around 10%, even as he anticipates the U.S. economy will slow in 2026. He said he expects 2.25% real growth in U.S. gross domestic product this year, which is around trend.
U.S. stocks briefly dipped into the red on Friday after the Supreme Court said it wouldn’t release its ruling on President Donald Trump’s tariffs. “The market wanted clarity one way or the other. Looks like it’s going to drag out. Market will deal with either outcome but dragging this out creates less certainty,” said George Cipolloni, a veteran portfolio manager, in comments shared with MarketWatch.
Mark Malek, Chief Investment Officer at Siebert Financial said Friday’s move higher in stocks was unsurprising. “This morning many folks became hyper focused on the SCOTUS ruling and perhaps quickly dismissed the jobs data with a ‘meh,’” he said. “Once we learned that there would be no ruling, many may have circled back to the employment numbers and viewed them as being slightly positive. Not bad, not good either, but slightly positive.”
Malek expects any relief rally to be short-lived once investors turn their focus back to the deficit.
“With jobs data and SCOTUS/tariff angst out of the way, the focus will shift to the return of supply next week. This advances the prospect of higher yields in the coming week.” —Alyce Andres, Macro Strategist, Markets Live
Link to X posts - Neil Sethi (@neilksethi) / X for full posts/access to charts (all free).
In individual stock action:
Shares of homebuilders supported the broader market Friday after President Donald Trump directed “representatives” to buy mortgage bonds as a way to drive rates down for homebuyers. D.R. Horton jumped nearly 8%, while PulteGroup traded up more than 7%. Lennar advanced more than 8%. Home improvement stocks such as Home Depot also gained.
But after the Supreme Court failed to weigh in on the fate of President Donald Trump’s import levies with consumer names, like Mattel Inc. and Deckers Outdoor Corp., left out of the rally.
Corporate Highlights from BBG:
Meta Platforms Inc. agreed to a series of electricity deals for its data centers that will make it the biggest buyer of nuclear power among its hyperscaler peers.
Rio Tinto Group is in talks to buy Glencore Plc to create the world’s biggest mining company with a combined market value of more than $200 billion, a little over a year after earlier talks between the two collapsed.
China Vanke Co. is preparing a debt restructuring plan at the request of authorities, people familiar with the matter said, pushing one of the country’s largest real estate developers closer to default.
Dutch telecommunications group Odido is considering launching an initial public offering as soon as this month that could raise about €1 billion ($1.2 billion) or more, according to people familiar with the matter.
General Motors Co. will take another $6 billion in charges tied to production cutbacks in its electric vehicle and battery operations as the financial fallout spreads from the weakening US market for EVs.
Mid-day movers from CNBC:
In US economic data:
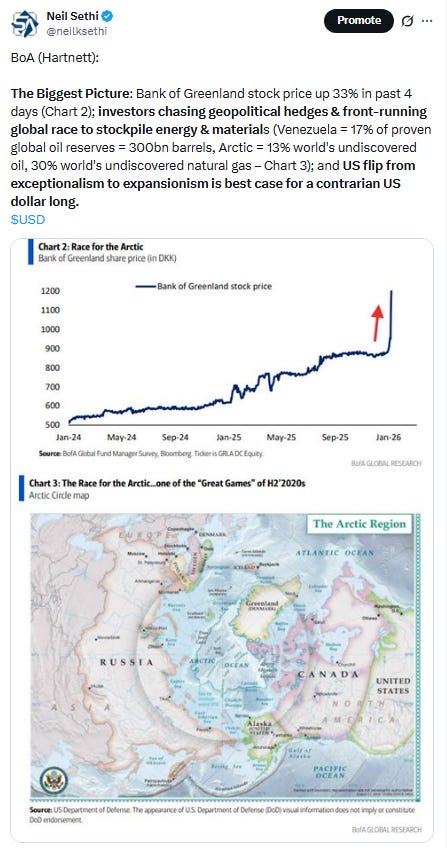
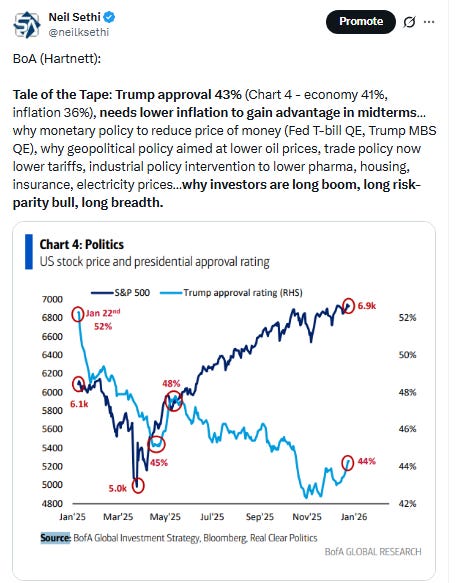
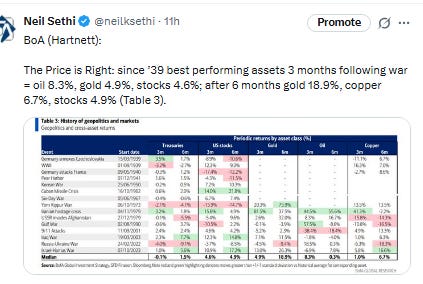
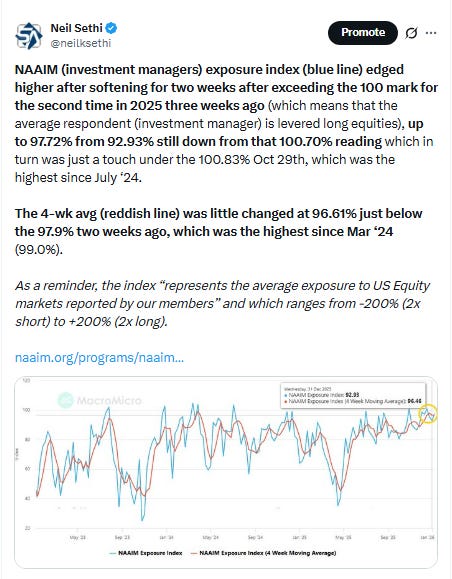
Link to posts for more details/access to charts (all free) - Neil Sethi (@neilksethi) / X
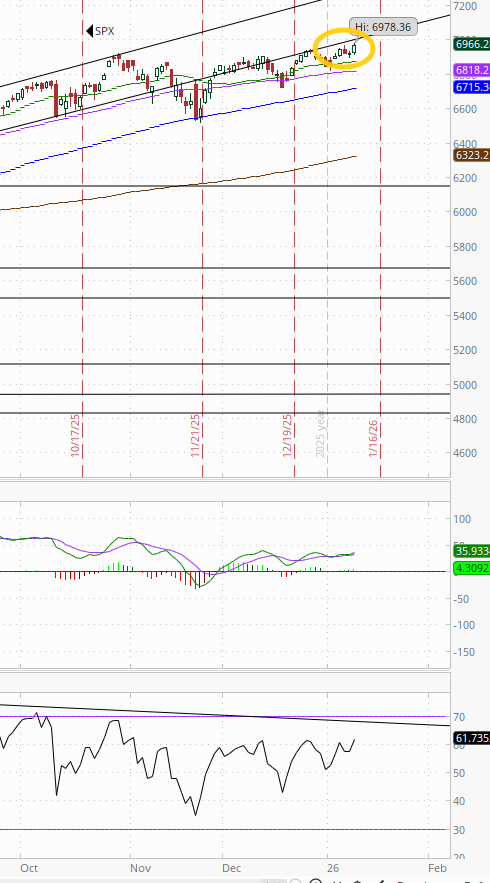
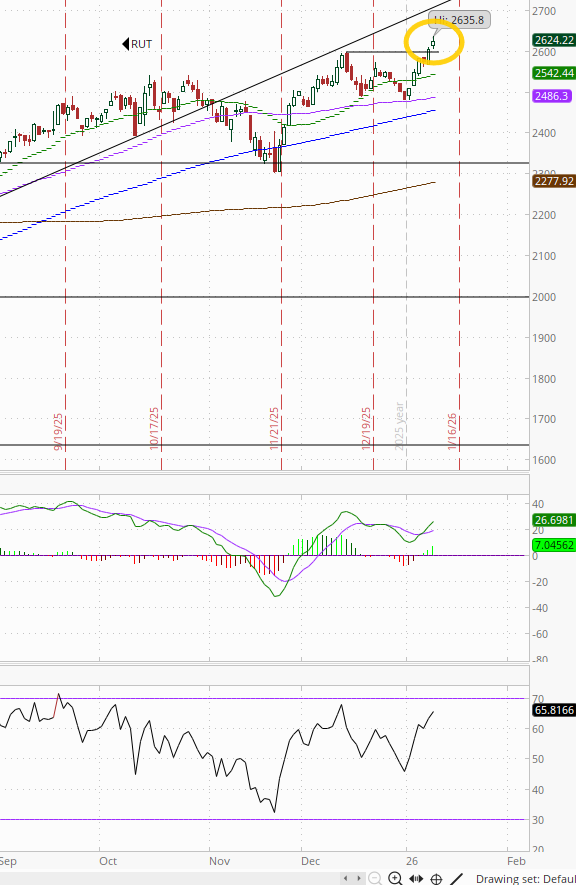
The SPX made it back to an ATH. The daily MACD and RSI are both neutral with a negative divergence.
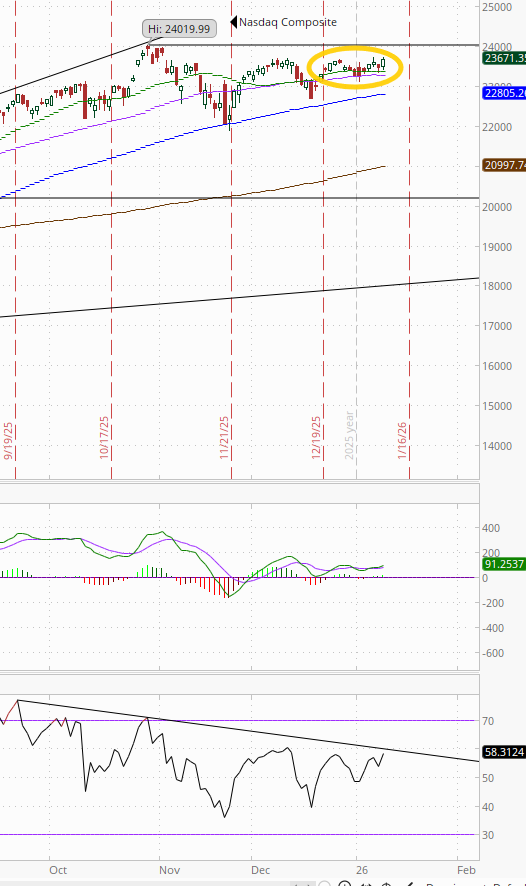
The Nasdaq Composite remains below its ATH.
RUT (Russell 2000) remains the best chart of the bunch continuing its rebound from its 50-DMA hit Thursday and making another ATH. Its MACD as noted Wed did cross to a “go long signal” and the RSI is now over 60.
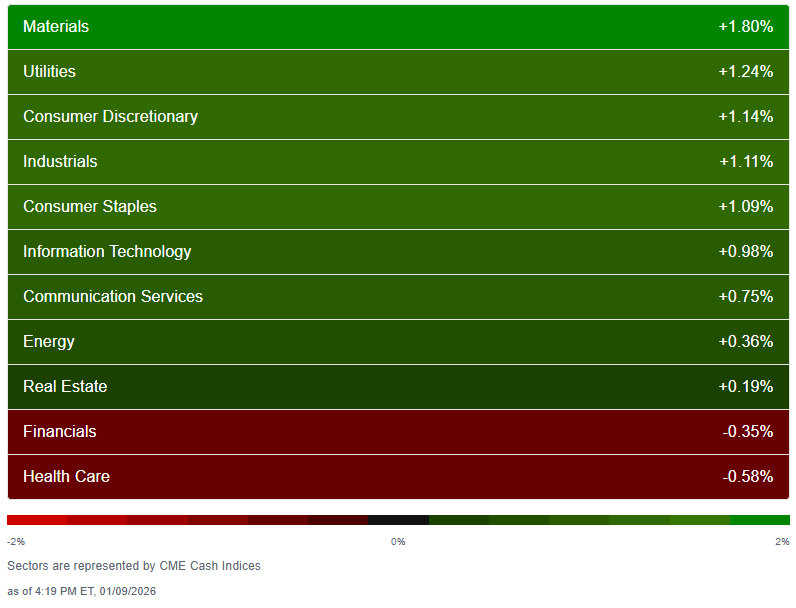
Sector breadth according to CME Cash Indices (uses futures prices) remained very solid (as its been all year ex-Wed) with again 9 of 11 sectors higher (up from 3 Wed, matching Tues, after 7 Mon, 8 last week), with seven up over +0.7% (vs six Thurs, two Wed, four Tues, six Mon) and five at least +1% (vs four, one, three, five) led by Materials +1.8%.
Helping today was the megacap growth sectors all rowing in the same direction for a change, all up at least +0.7%.
No sector down more than -0.6% (Health Care). Financials was the other sector closing lower (-0.4%).
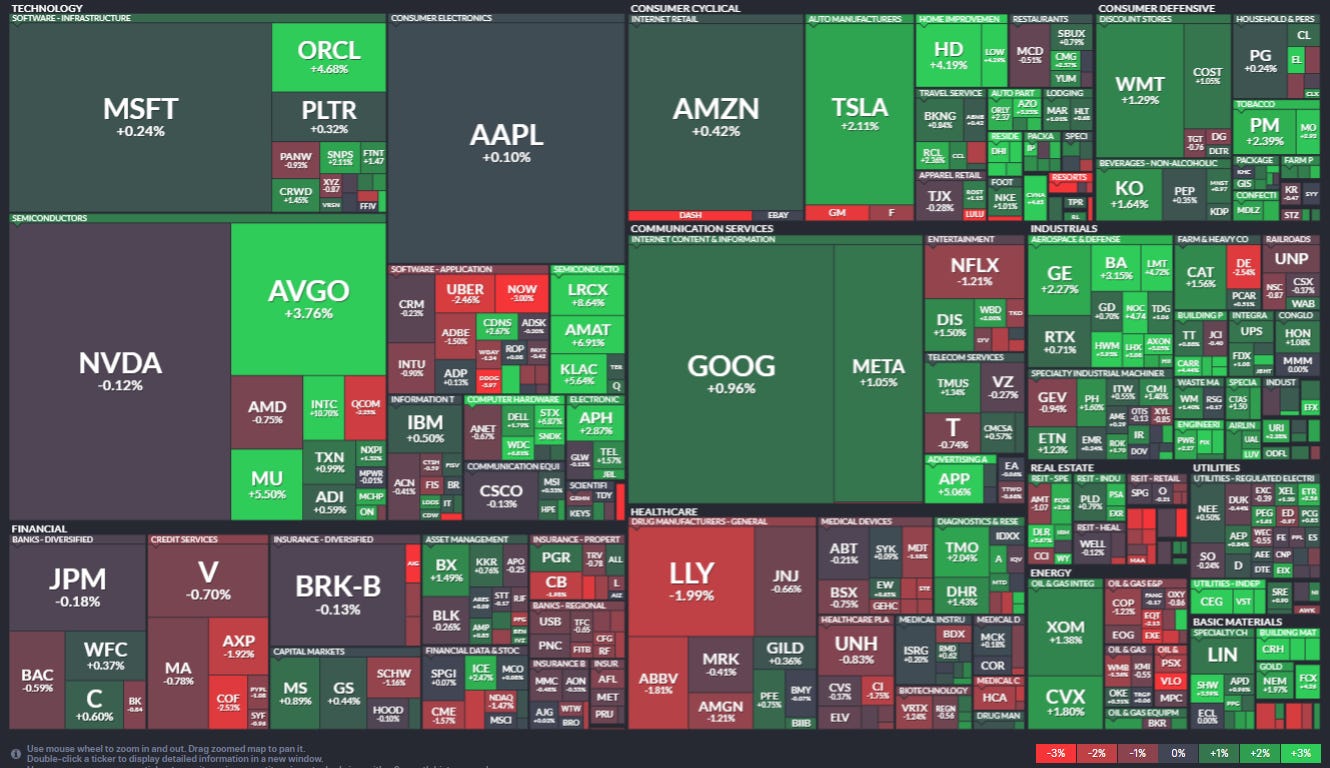
SPX stock-by-stock flag from @finviz_com saw some weakness shift from Tech to Financials but overall more green than red and the biggest difference was a lot fewer big moves.
3 of the top 11 were lower (the least this year). LLY led to the downside -2.0% the only member of the group down over -0.2%. Leading to the upside was AVGO +3.8%. Mag-7 +0.7%, which also was its gain for the week.
~45 SPX components were up 3% or more (after 70 Thurs, 12 Wed, 75 Tues, 50 Mon, 68 last week) led (for the second time this week) by Sandisk SNDK +12.8% edging out Builders Firstsource BLDR +12.8%. INTC and VST also up over 10%. Fifteen of those 45 were >$100bn in market cap (after seven of 70 Thurs but eight of twelve Wed) in INTC, LRCX, AMAT, CEG, KLAC, MU, APP, LMT, ORCL, LMT (again), CVNA, LOW (again), HD (again), AVGO, BA (in descending order of percentage gains).
12 SPX components down -3% or more (down from 25 Thurs, 65 Wed 14 Tues) led by Las Vegas Sands LVS -4.8%. Just one >$100bn in market cap down -3% or more (down from seven Thurs, twelve Wed, five Tues) in NOW (and it was exactly -3.00%).
NYSE positive volume (percent of total volume that was in advancing stocks (these also use futures)) fell back from Thurs’ very impressive 70.8% given the +0.65% index gain to a less impressive 57.3% on a +0.47% index gain.
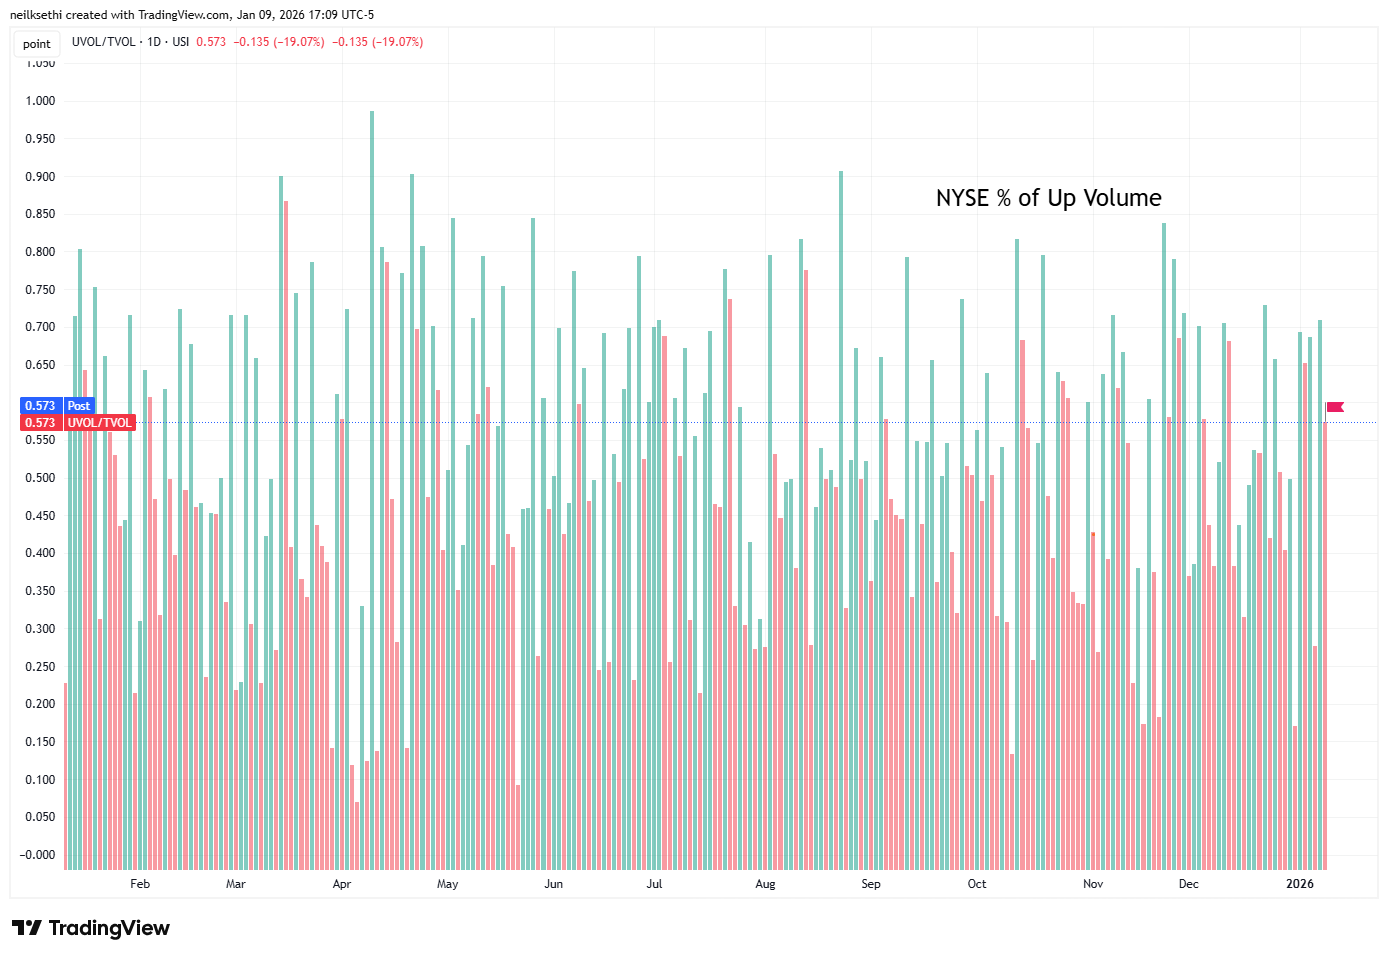
Nasdaq positive volume (% of total volume that was in advancing stocks) Friday was quite weak falling back to 49.3% from 51.4% Thursday even as the index saw a +0.81% gain versus Thursday’s -0.44% loss.
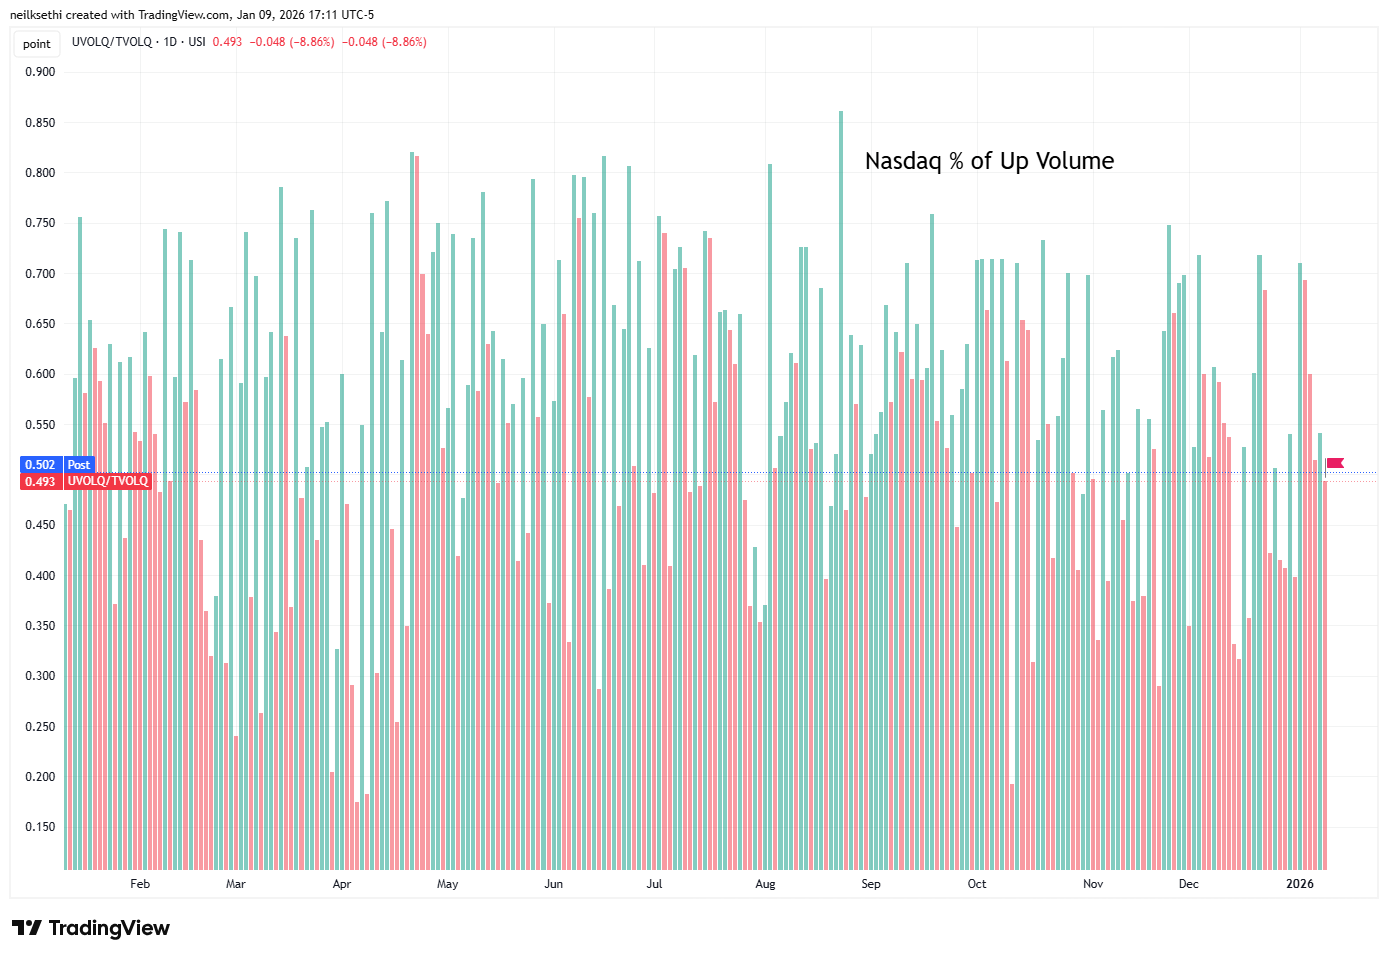
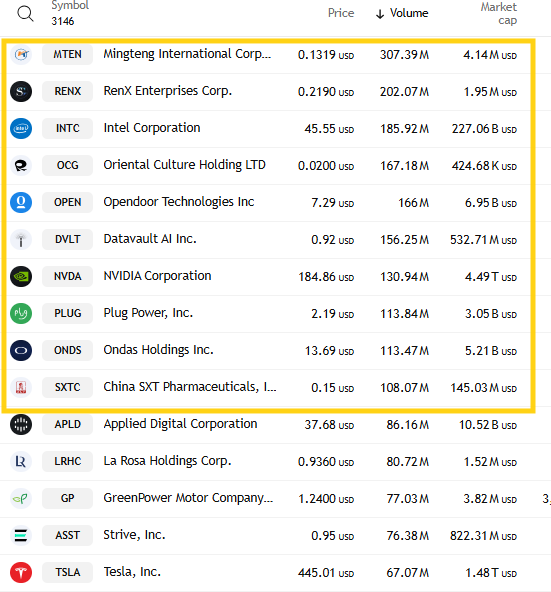
And the weaker positive volume was despite a pickup in speculative volumes on the Nasdaq. The top three stocks by volume collectively traded ~700mn shares up from ~640mn Thurs (although down from over ~1bn shares Tues/Wed). And 10 companies had volumes over 100mn shares vs 5 Thurs, 7 Wed, 10 on Tues.
Positive issues (percent of stocks trading higher for the day), which are not inflated by high speculative volumes, though continued to remain not far off, as has been the case for the most part the past few weeks were a little higher on the Nasdaq at 52.9% and the NYSE at 62.0%.
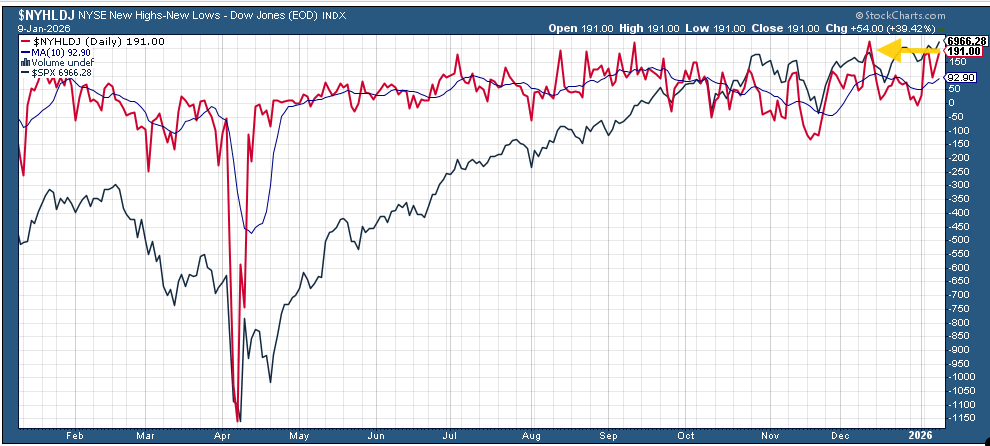
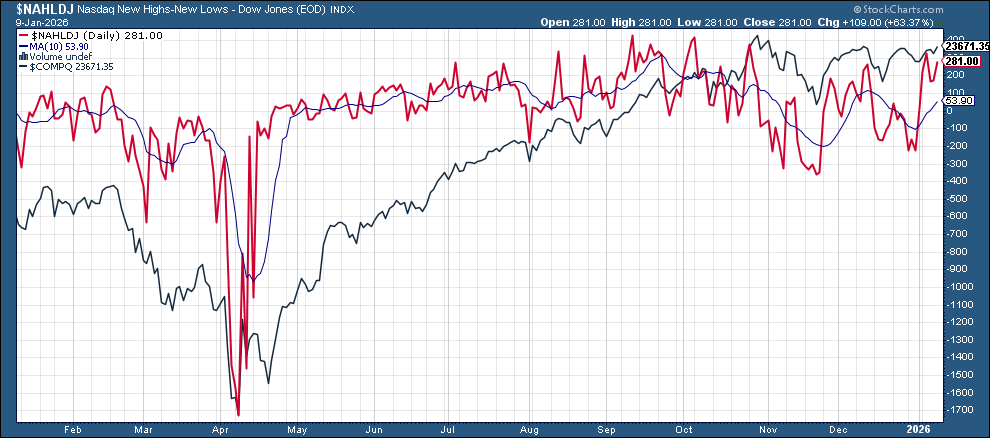
New 52-wk highs minus new 52-wk lows (red lines) improved on the NYSE to 191 the second highest since Aug, while the Nasdaq jumped to 281 a little below the 326 on Tues (which was the best since Oct).
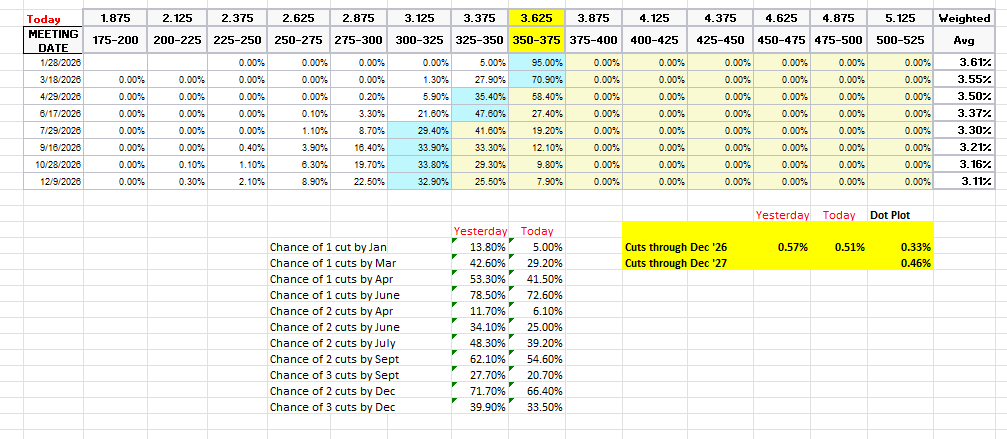
#FOMC rate cut pricing for 2026 dropped to the least (fewest cuts) since the Dec FOMC according to the CME’s Fedwatch tool. January is now off the table unless the Fed chooses to revive it (which would require a very cool CPI print next week) at just 5%. March is now just 29% (from 51% to start the week), April 42% (from 63%), meaning the first cut has now been pushed to June (73%). A second cut is not until Sept (55%) with July now 39% (from 55% at the start of the week).
Pricing for 2026 overall down to 51bps (-7bps this week), with pricing for two cuts 66% and three cuts 34%, down from 68bps Dec 3rd (and 80bps mid-Nov which was highest we’d been for 2026 cuts)).
The dot plot as a reminder has 33bps for the average dot for 2026.
Remember that these are the construct of probabilities. While some are bets on exactly one, two, etc., cuts some of it is bets on a lot of cuts (3+) or none (and may include a hike at some point).
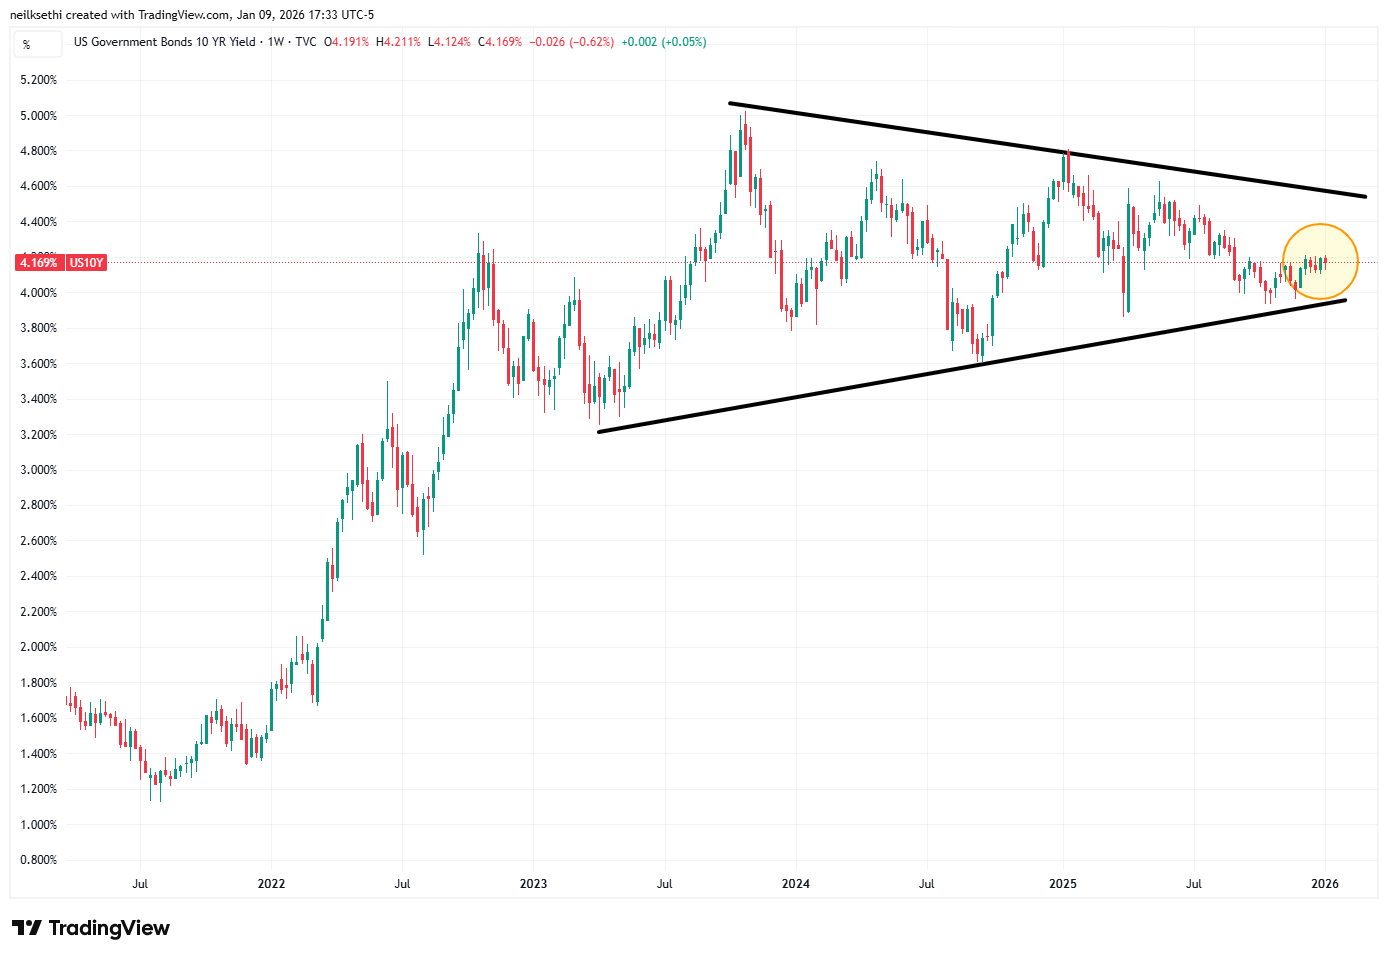
The 10yr #UST yield remained little changed as has been the case all year at 4.17%, remaining at the top of its range since the start of December.
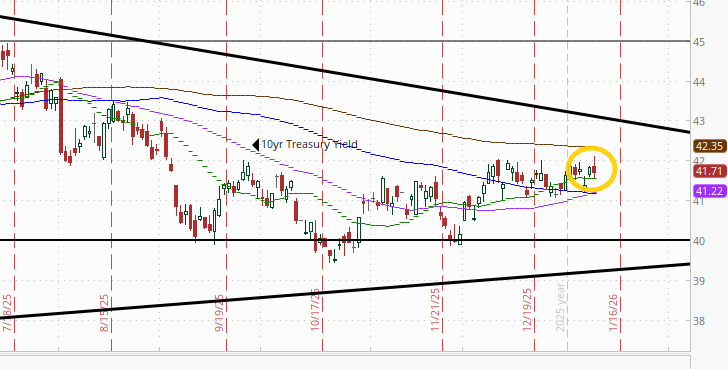
It was -3bps on the week, and has traded in a 10bps range since the start of December, remaining in its wedge over the past two years.
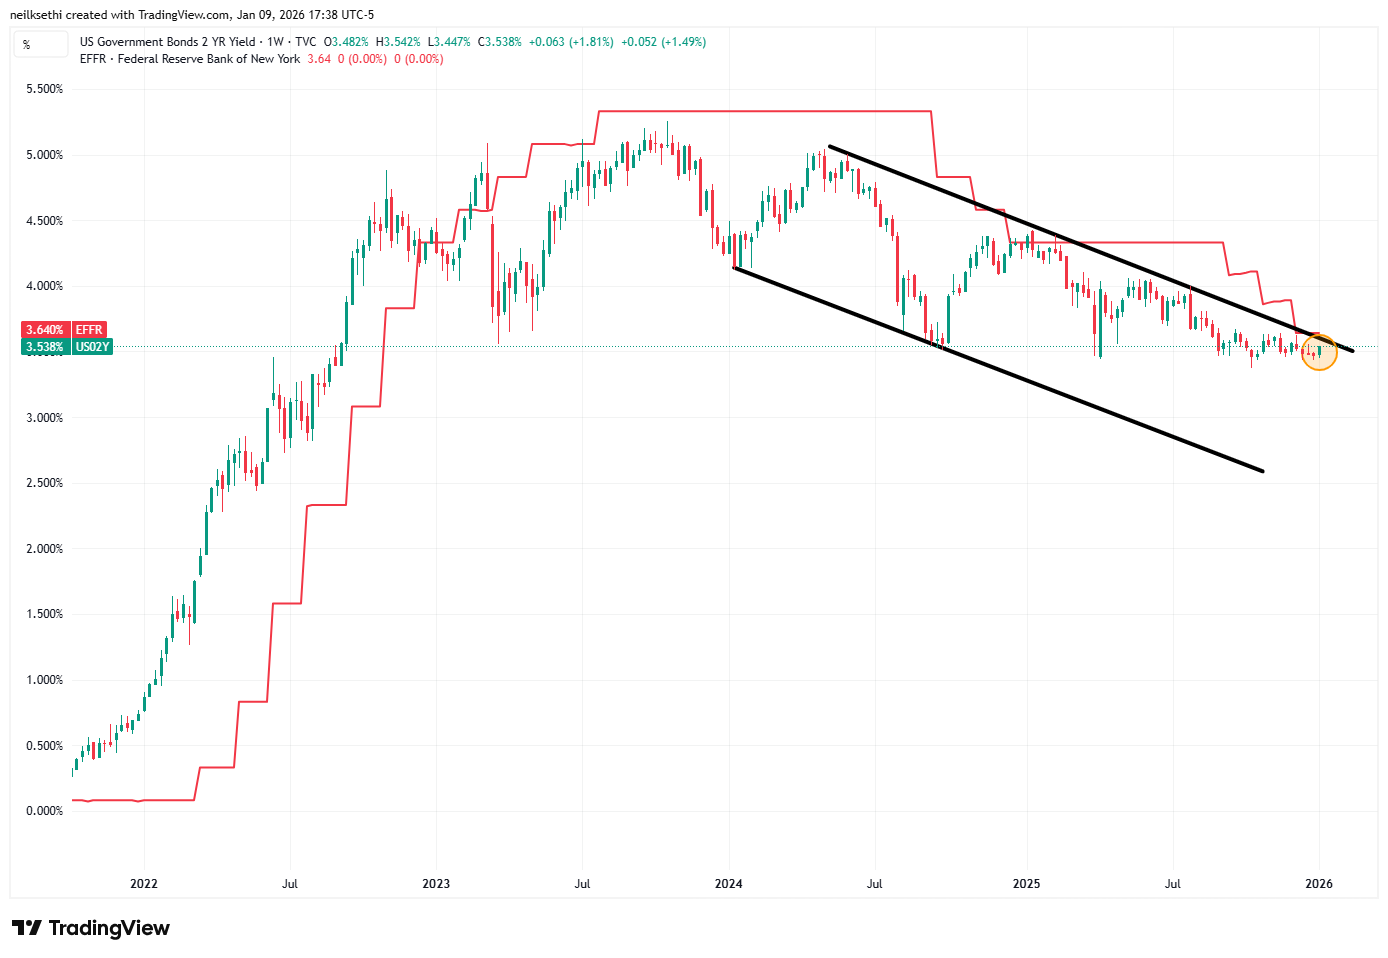
The 2yr yield, more sensitive to FOMC rate cut pricing, pushed to the highs of the year at 3.54% now 12bps above the least since 2022, now though again moving closer to the top of the channel it’s been in since the start of 2024, -9bps below the Fed Funds midpoint. Outside of recessions it is normally above by around +50bps on average, so still calling for at least a couple more rate cuts.
The Effective Fed Funds Rate (red line) remained at 3.64%.
This seems like a fairly rich yield at these levels unless we really aren’t going to get any more rate cuts (then it’s a bit expensive (i.e., yield should be higher)). That said I just don’t know that I want to buy 2-years at what is basically the 1-month yield.
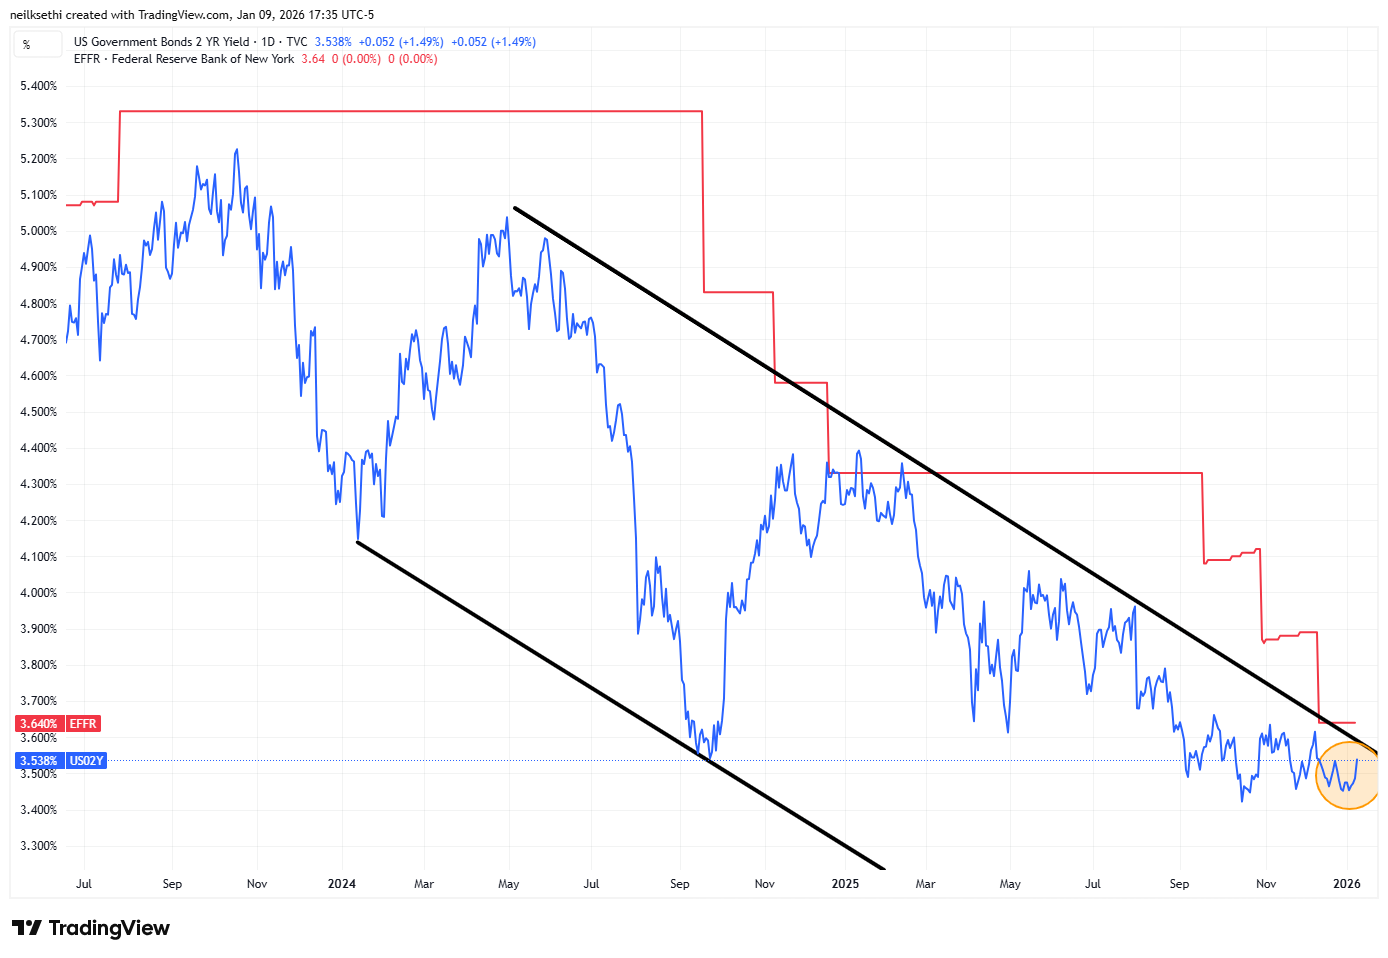
It was +6bps on the week.
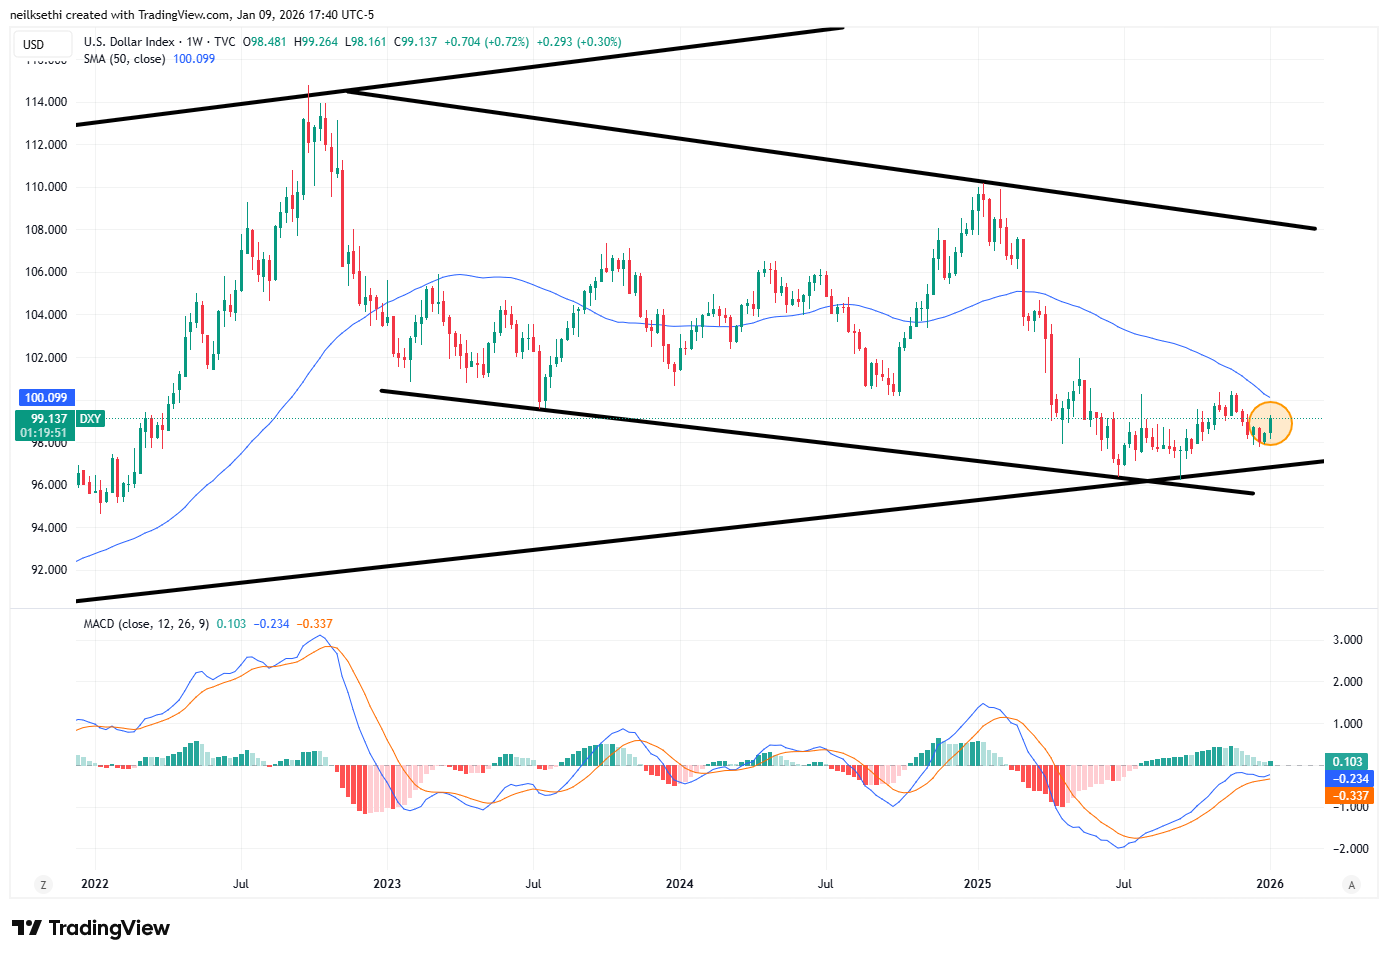
The $DXY dollar index (which as a reminder is very euro heavy (57%) and not trade weighted) was up for the seventh session in eight Fri to the highest close since Dec 9th, and starting to push through the 50 and 200-DMAs as well as a trendline running back to the start of last year.
It has not sustained a breakout above the 200-DMA since it fell under last February. As noted Fri, the daily MACD has now crossed to “cover shorts” positioning and the RSI is the best since Nov (and now over 60) giving some technical support to a breakout.
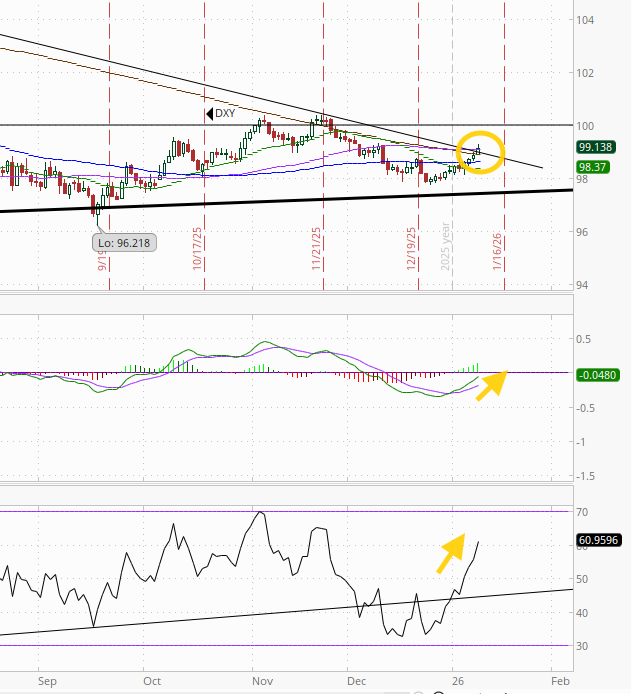
Weekly chart is indecisive.
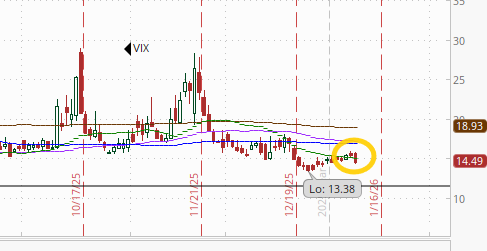
VIX fell back after having to slowly edged since Christmas Eve falling back to 14.5, remaining around the lows of 2025 but still up from 13.4. The current level is consistent w/~0.90% average daily moves in the SPX over the next 30 days.
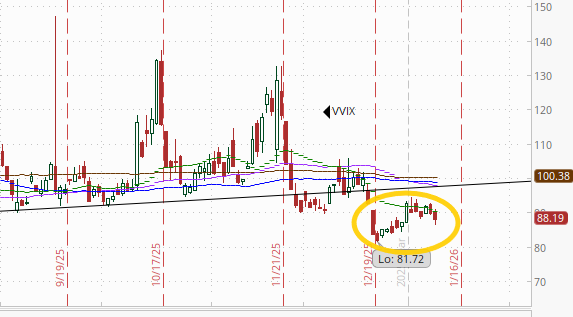
The VVIX (VIX of the VIX) similarly fell back to the lows of the week at 88.2 but up from 81.7. The current level remains consistent with “moderate” daily moves in the VIX over the next 30 days (historically normal is 80-100, but we’ve been above 90 almost the entire time since July ‘24)).
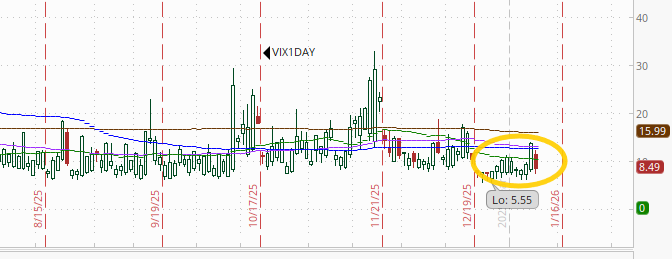
With NFP and “opinion day” behind us, despite the upcoming weekend, the 1-Day VIX like the VIX and VVIX fell back, in its case to 8.5. The current reading implies a ~0.53% move in the SPX next session.
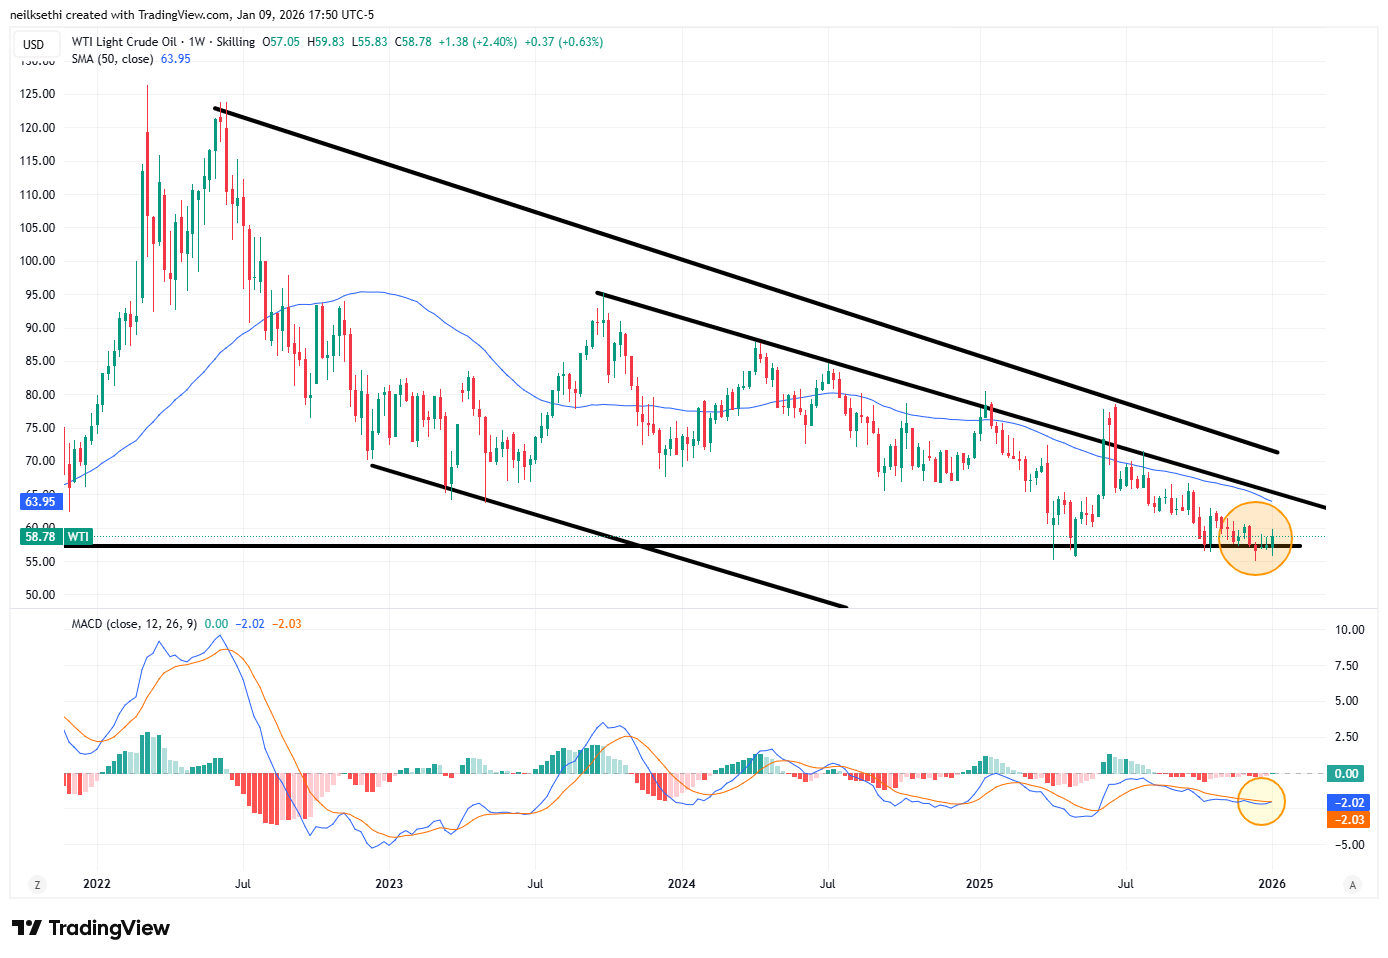
And we finally have a tentative breakthrough, as #WTI futures closed Friday for the first time above both the 50-DMA and downtrend line from the July highs since that time. While it’s much too early to call a breakout, a green day on Monday would have me looking at the $62.50 level (200-DMA).
Daily MACD remains supportive (cover shorts) and RSI is strongest since October.
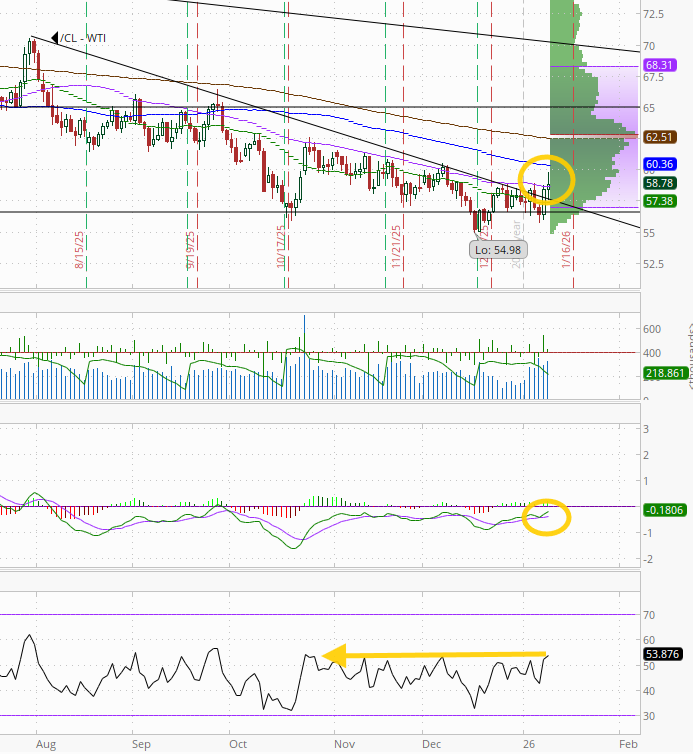
Weekly chart not very constructive but it has held that $55-60 level and the weekly MACD did cross over (barely) to “cover shorts” for the first time since June. It also was green for three straight weeks (barely for two of them) for the first time since then as well.
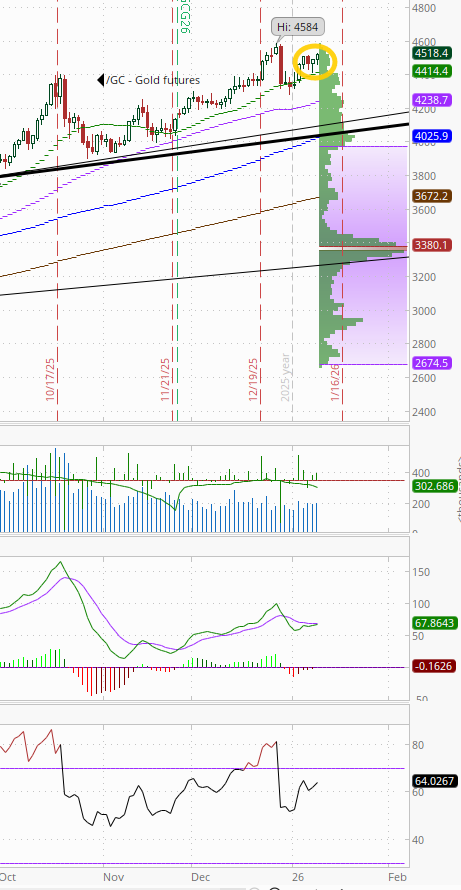
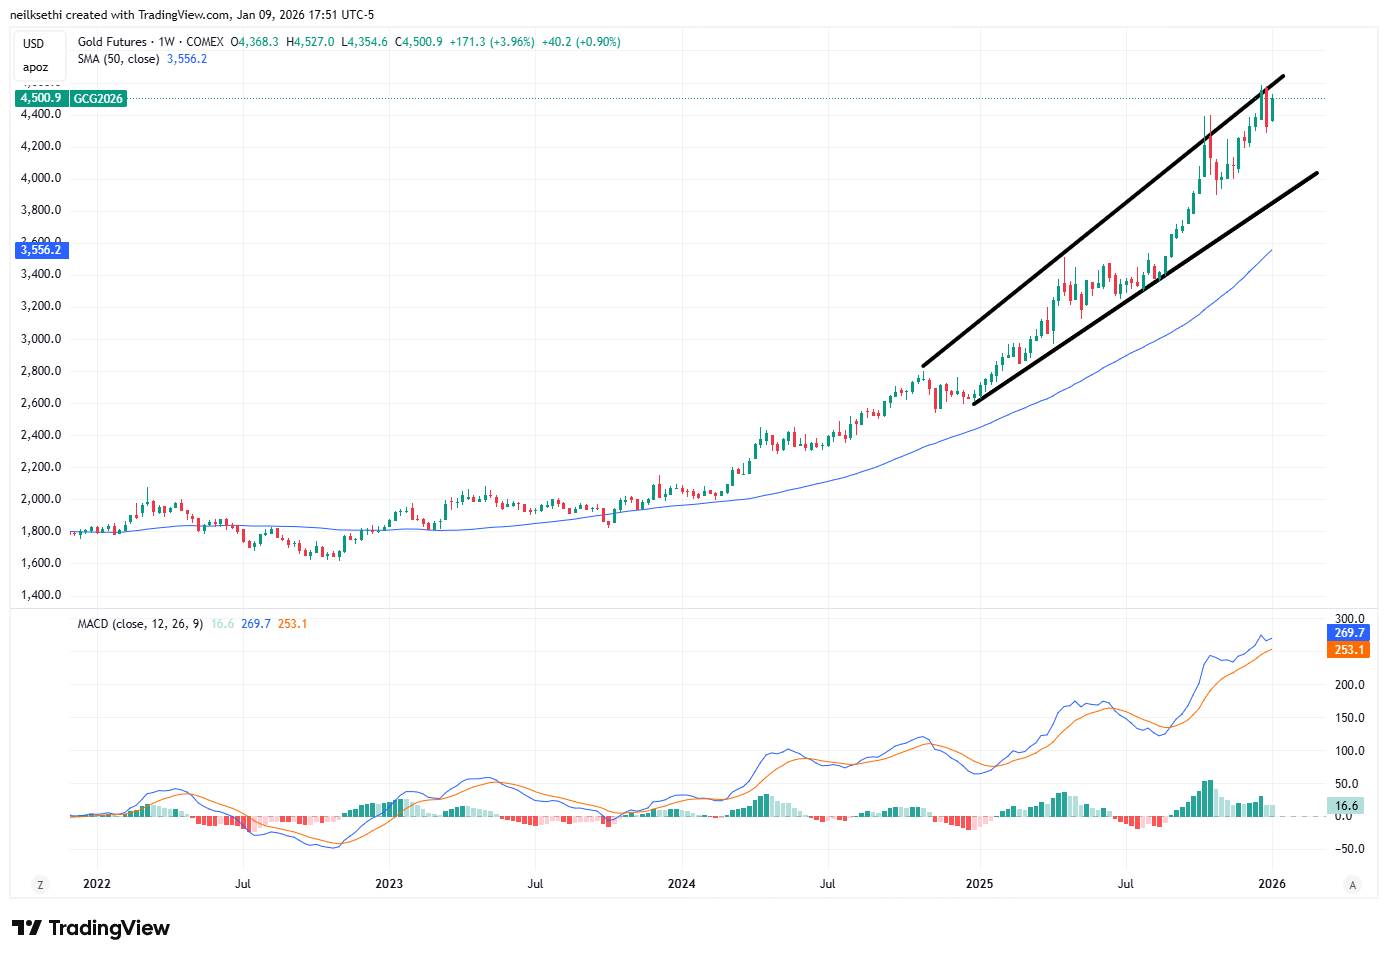
Gold futures (/GC) higher again remaining not far from their all-time highs. Daily MACD remains negative but close to turning positive while the RSI is over 60.
Weekly chart remains very strong but also extended.
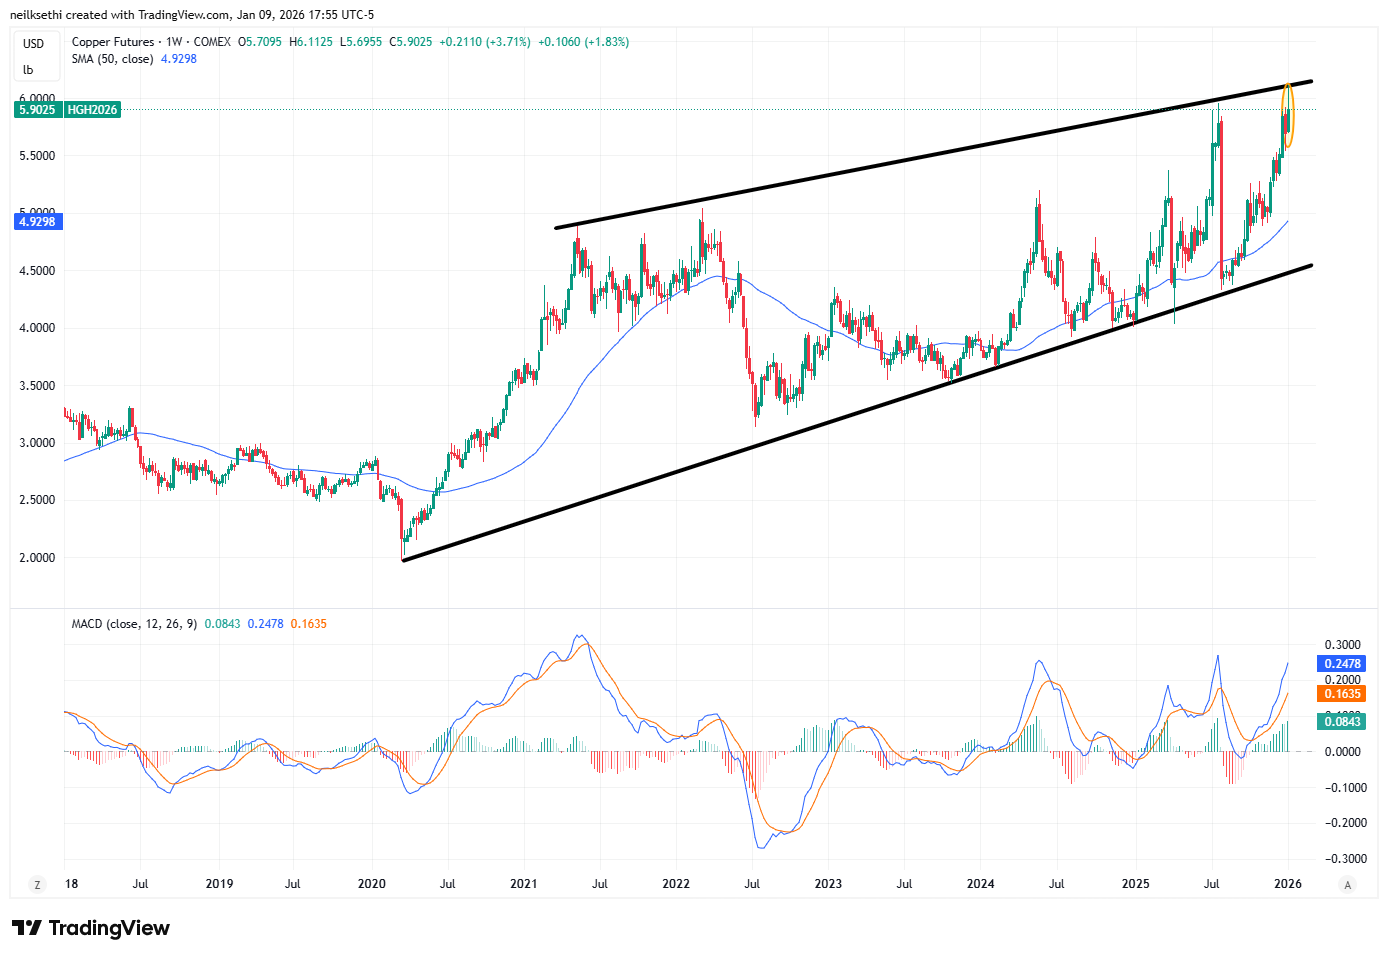
US copper futures (/HG) remained relatively volatile bouncing back +1.5% after a -4.2% two-day drawdown from all-time high territory. Daily MACD remains in “go long” positioning while the RSI still has a negative divergence (lower high).
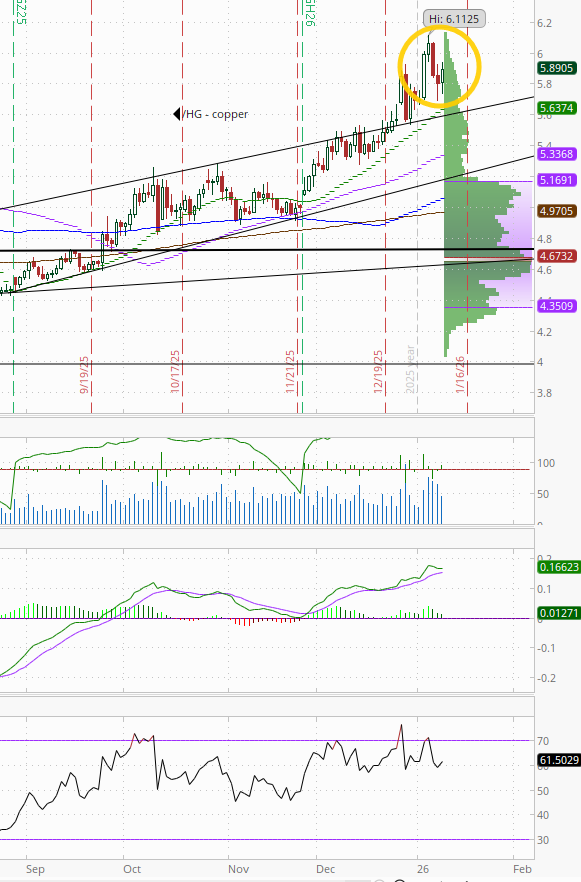
Longer term, copper futures remain in the grinding uptrend since August (and longer than that in the uptrend started in March 2020). Note though it fell back this week from a very natural point - the top of the channel running back to the 2020 lows. Like gold it is quite extended.
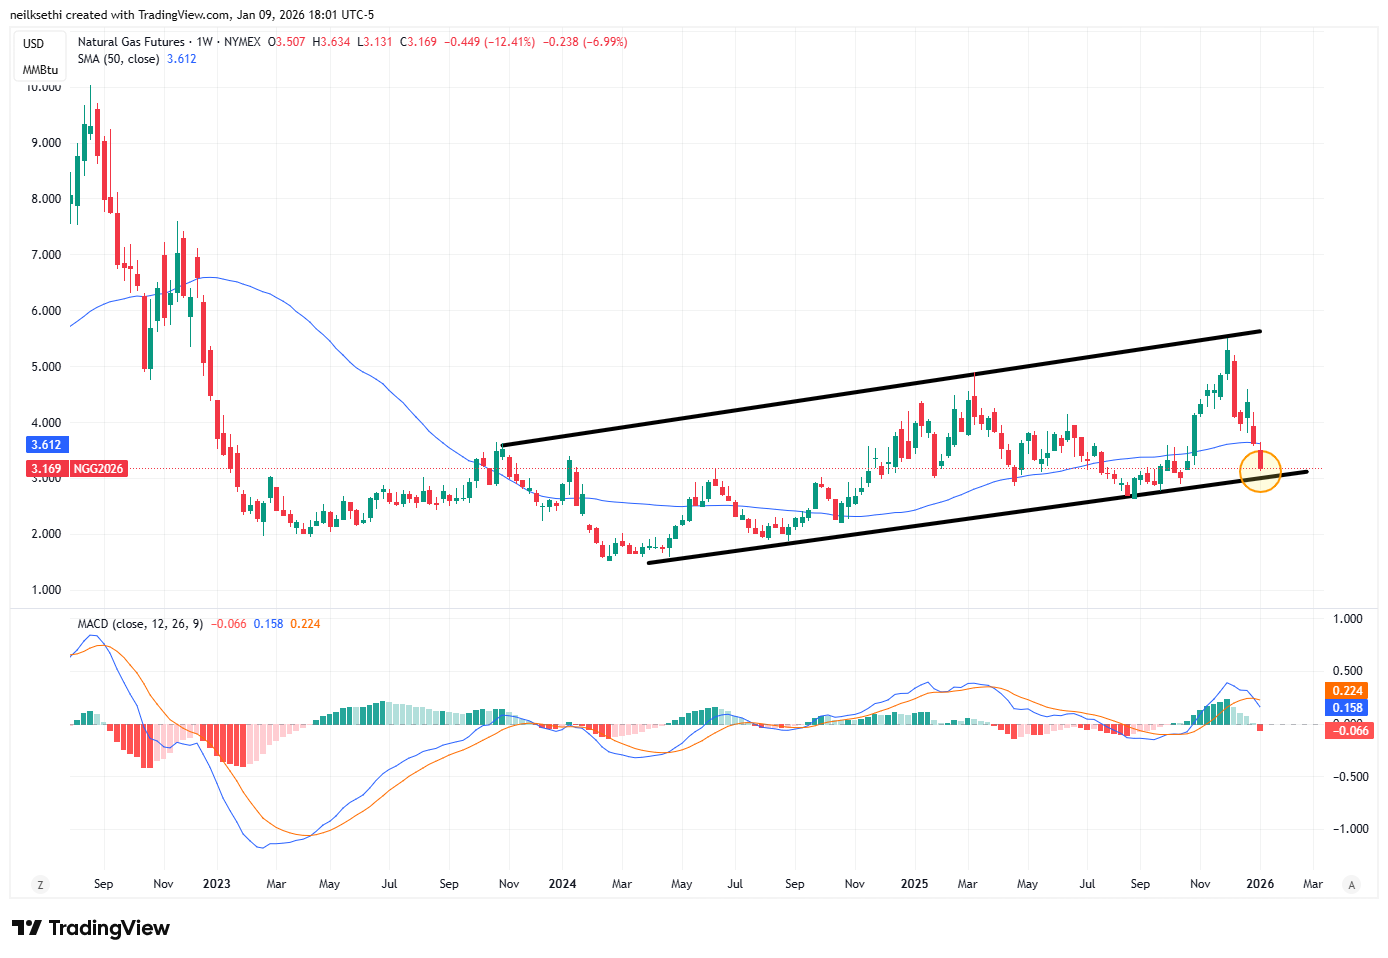
Natgas futures (/NG) fell another -7.7% Friday, as it appears traders are giving up on enough cold this winter to make a sufficient dent in inventories to support higher prices, falling to the lowest close since mid-October, and now down around -45% from the peak Dec 5th. The daily MACD remains firmly in ‘go short’ positioning, and RSI is now the weakest since April.
The good news is it is coming up on some support at the $3 level.
Weekly chart shows the same support, but the MACD has crossed to “sell longs”.
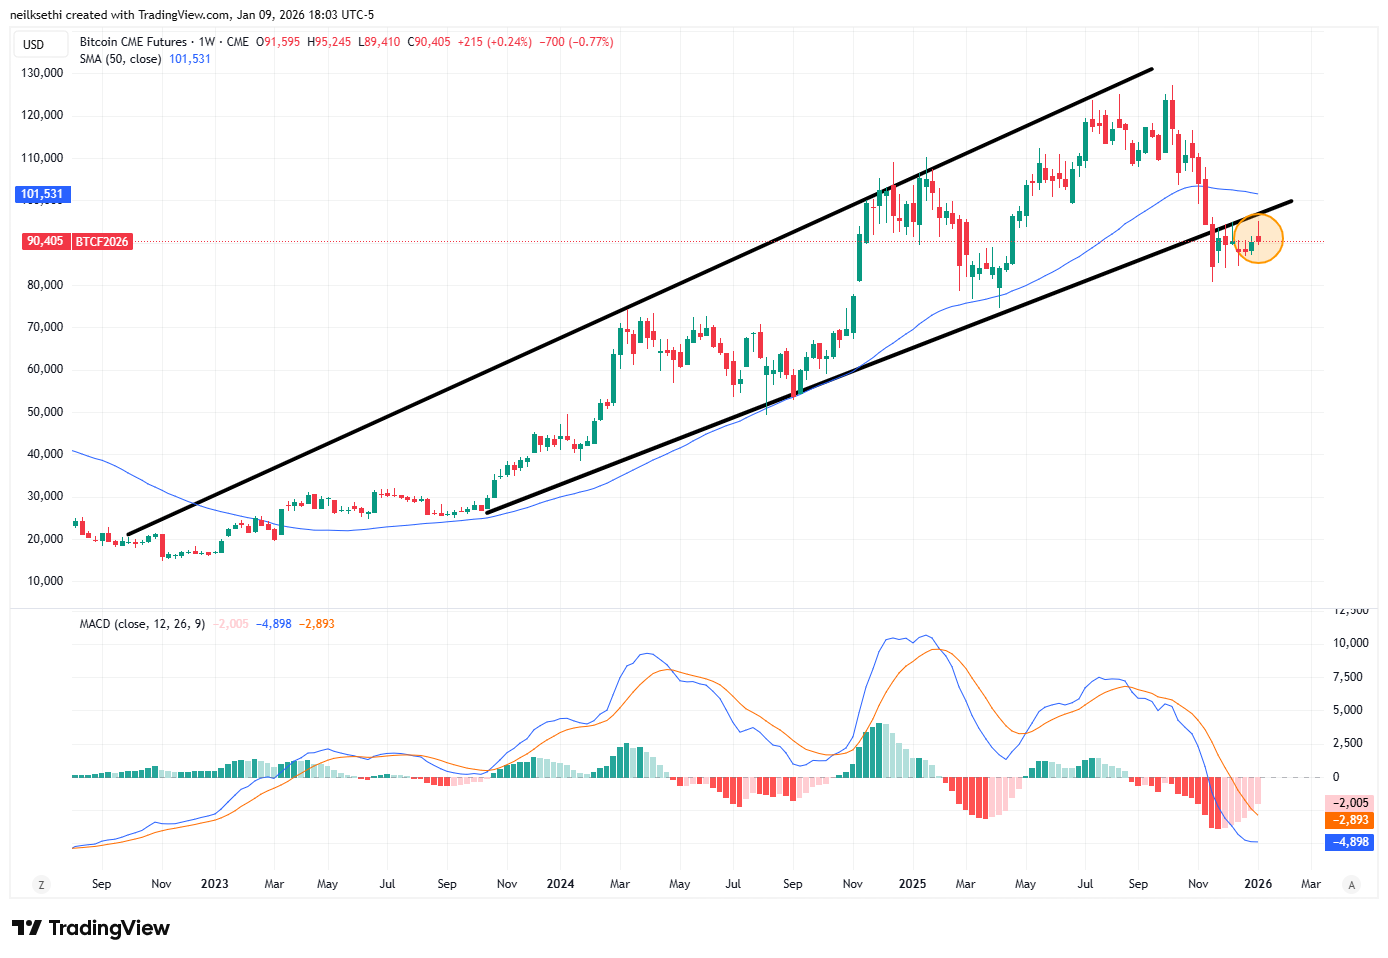
Bitcoin futures down for the third session in four since having tested the $95k level and 50-DMA. The daily MACD still remains in “cover shorts” positioning, but the RSI is now below 50.
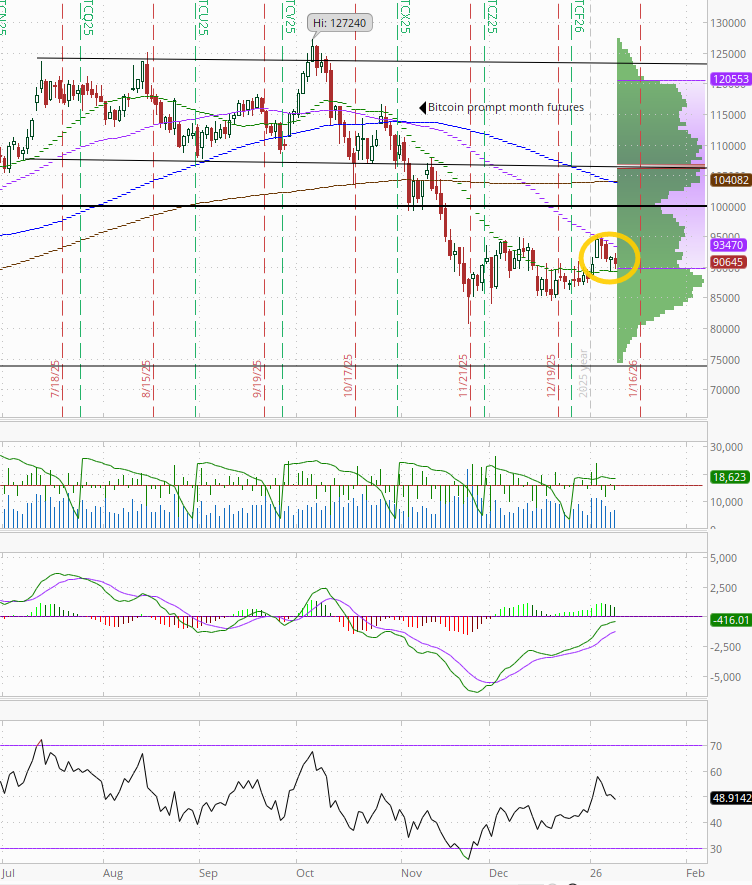
Weekly chart remains weak.
The Week Ahead
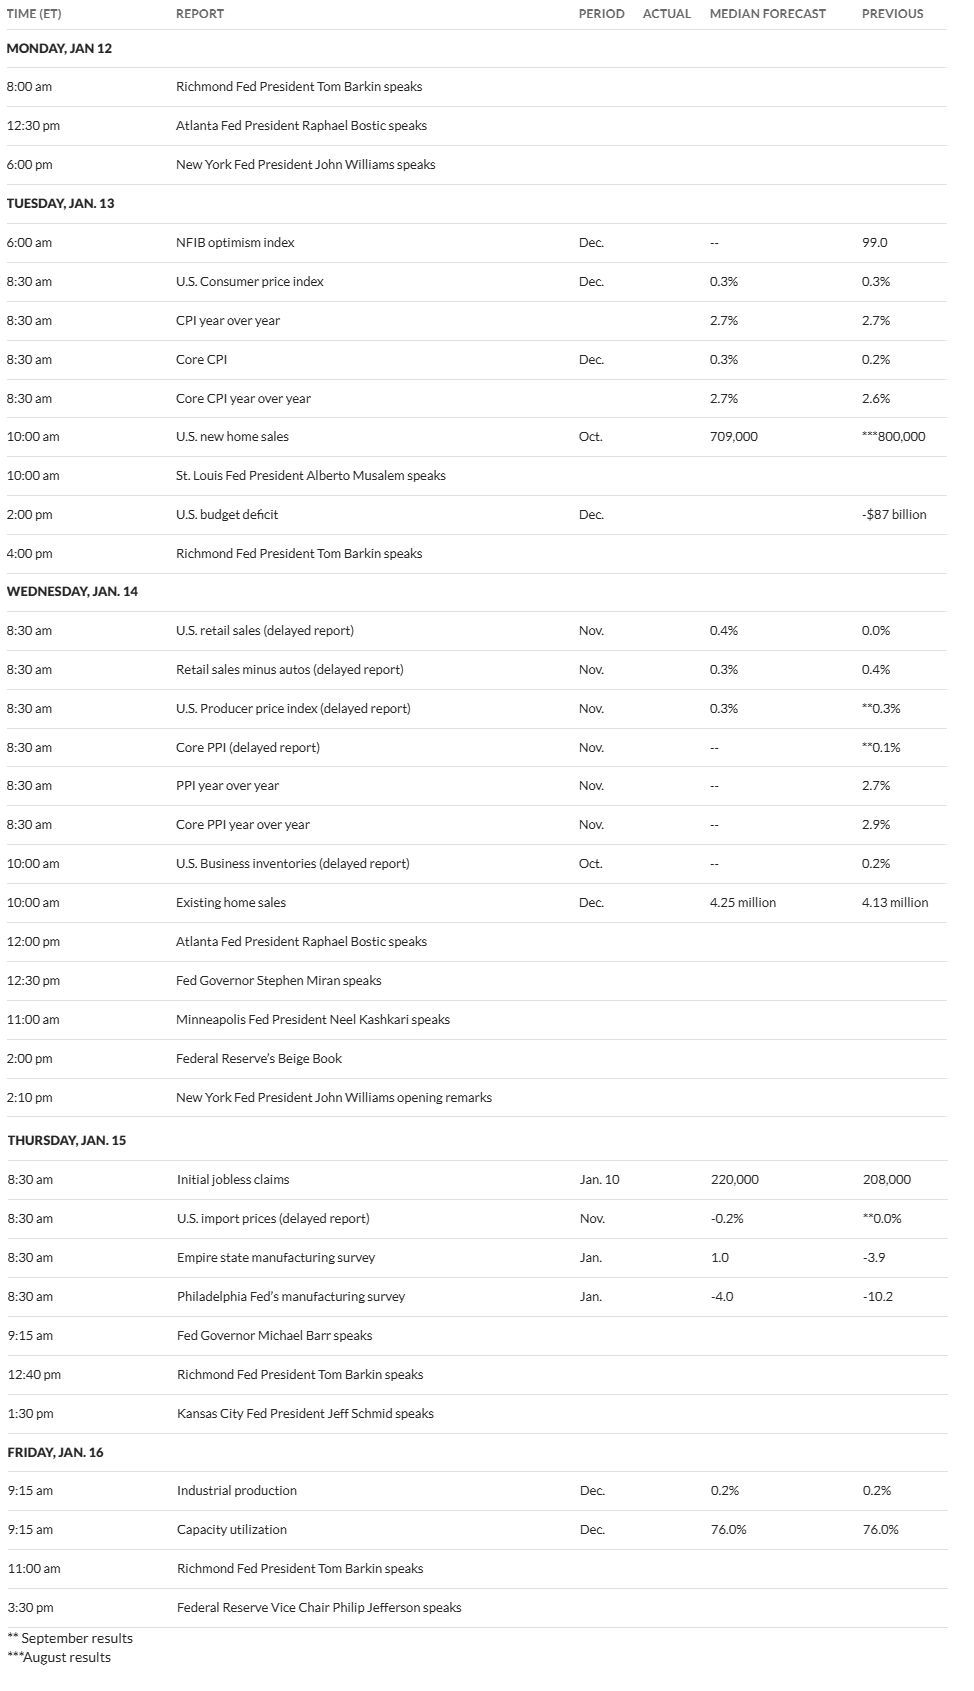
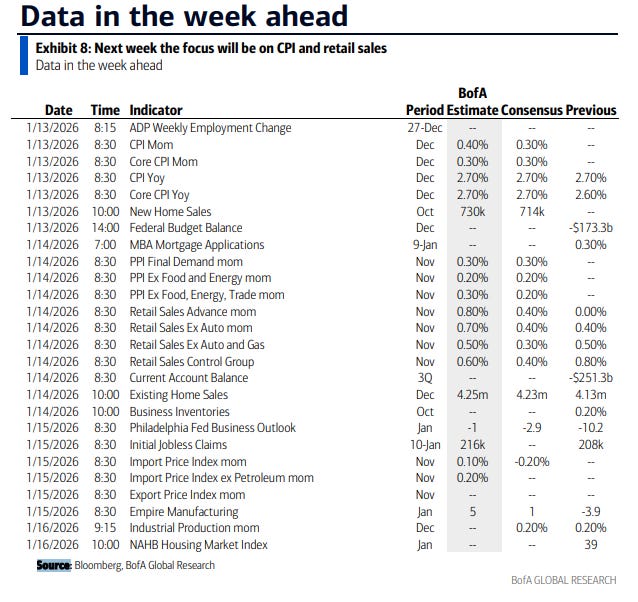
US economic data remains heavy next week with a shift, as is normal for the week including the 10th, to inflation with a (finally) on schedule Dec CPI, but delayed (Nov) PPI and import prices. We’ll also get delayed (Nov) retail sales, new home sales and (Oct) biz inventories reports, and on-time (Dec) industrial production, existing home sales, NFIB small biz sentiment, and (Jan) NAHB home builder sentiment reports along with the normal weekly reports (ADP employment update, jobless claims, mortgage applications, and EIA petroleum inventories). There are also a couple of regional Fed PMIs.
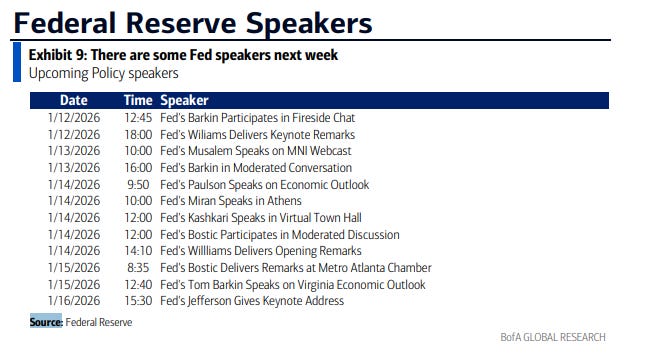
Plenty of Fed speakers on the calendar, with highlights NY Fed Pres Williams (who as a reminder tipped the markets ahead of the FOMC cut, Fed Vice-Chair Jefferson (who along with Powell and Williams form the “core” of the committee), and Gov Barr (who had been aligned with the core but has split off in a more hawkish direction of late). We’ll also hear from Gov Miran (who speaks quite frequently) along with regional bank presidents Barkin (several times after 2x this week), Bostic (retiring in Feb), Musalem, Paulson, Kashkari, and Schmid, but of those just Kashkari and Paulson vote in 2026.
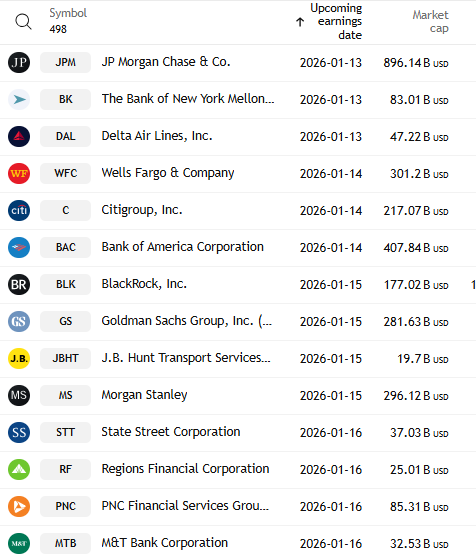
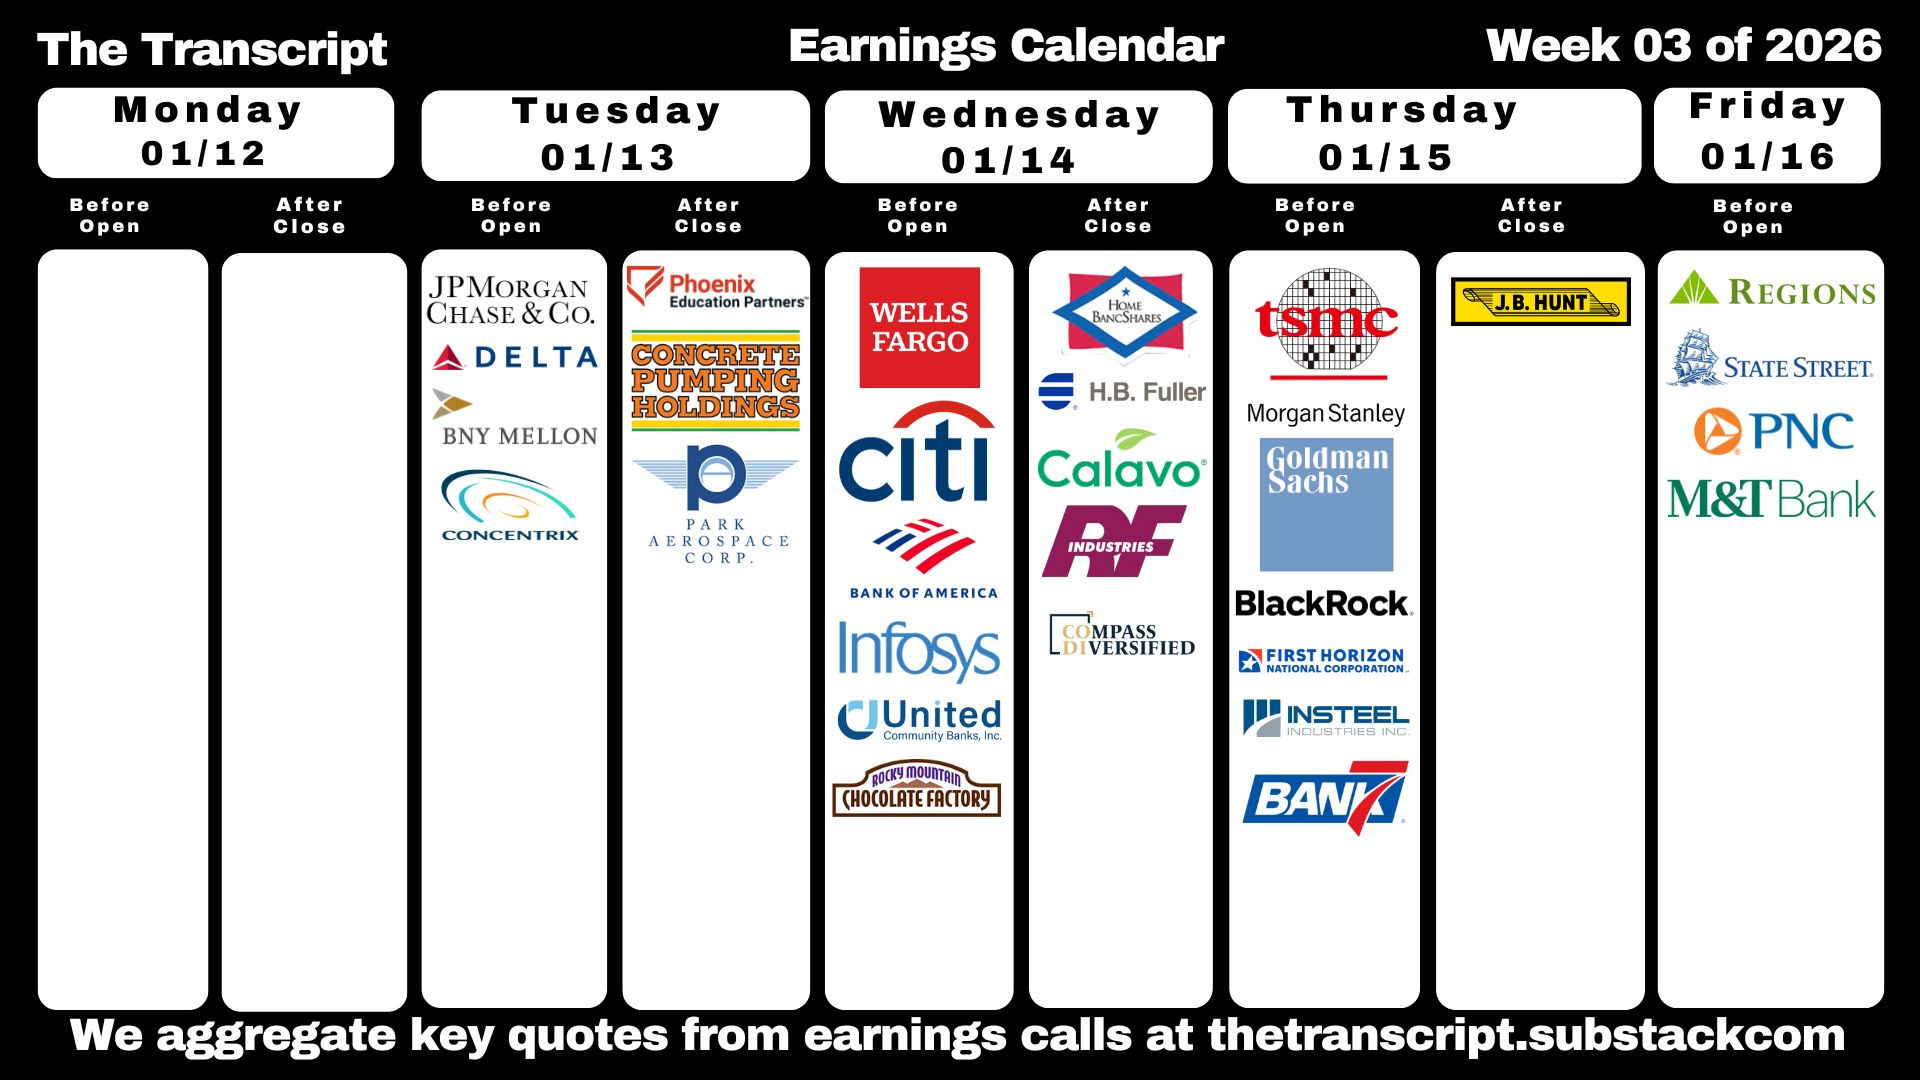
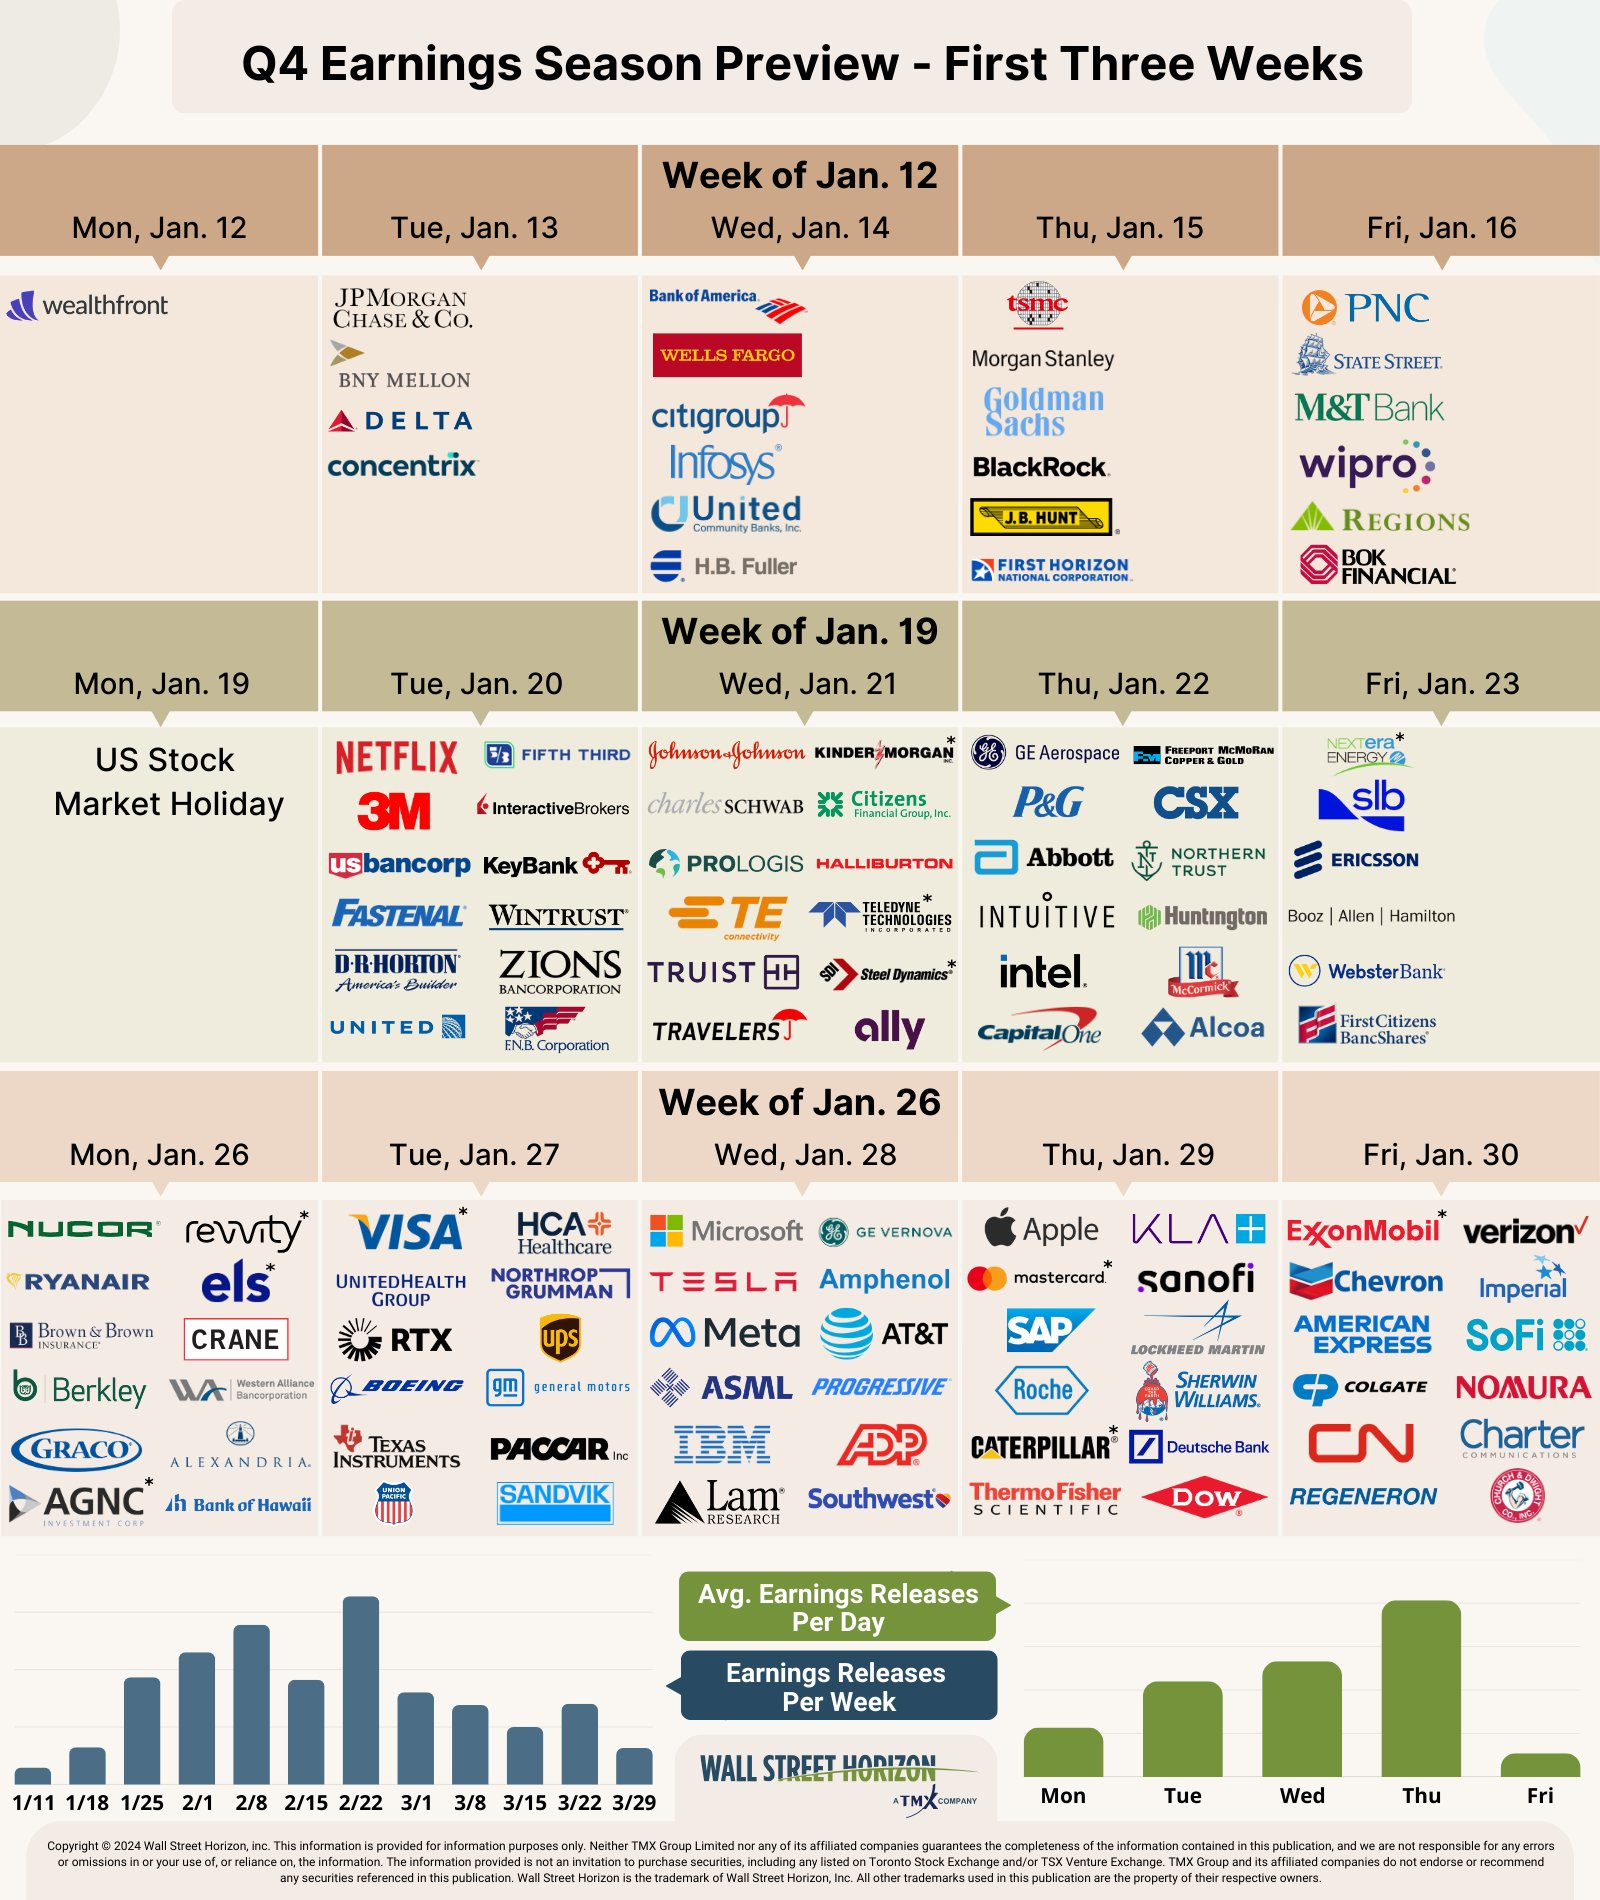
SPX earnings also come back into focus as we unofficially kick off Q4 earnings season on Tuesday with JPM. They are one of 14 SPX reporters next week, half of which though are >$100bn in market cap in JPM, WFC, C, BAC, BLK, GS, MS (in order of reporting date).
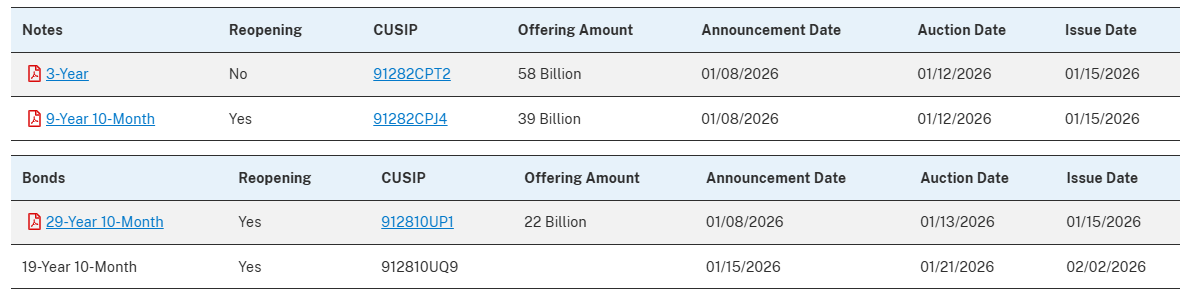
And Treasury auctions also pick back up with 3, 10, and 30yr auctions (the latter two reopenings) but for some reason they’re on a compressed schedule next week with the former two on Monday and the latter on Tuesday (no idea why as there’s no holiday, month-end, Fed meeting, etc.).
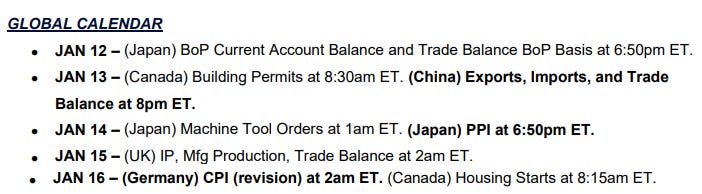
Ex-US a little lighter next week according to JPM’s calendar (I should have the normal full preview on Sunday) with no major market-moving releases (attached).
We’ll also get another “opinion day” from the Supreme Court Wednesday. As with Friday, there’s no indication on what will be released, but expect another big leadup to that release.
Link to X posts - Neil Sethi (@nelksethi) / X
To subscribe to these summaries, click below (it’s free!).
To invite others to check it out,