


Markets Update - 3/10/25
Update on US equity and bond markets, US economic reports, the Fed, and select commodities with charts!

To subscribe to these summaries, click below (it’s free!).
To invite others to check it out (sharing is caring!),
Link to posts - Neil Sethi (@neilksethi) / X
Note: links are to outside sources like Bloomberg, CNBC, etc., unless it specifically says they’re to the blog. Also please note that I do often add to or tweak items after first publishing, so it’s always safest to read it from the website where it will have any updates.
Major US equity indices started the day solidly lower after more dour economic comments from President Trump where he indicated in a Sunday interview higher prices and a recession were both possible outcomes during “a period of transition” due to the administration’s policies. “You can’t really watch the stock market,” he said. Also not helping were a flurry of more cautious notes from equity strategists over the weekend.
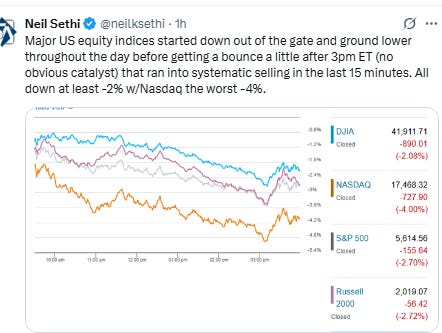
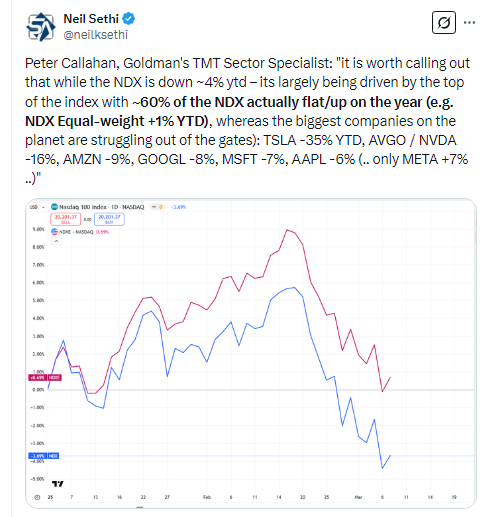
The selling carried through the open with a fairly constant grind lower throughout the session taking the SPX at one point to -3.6%, the lowest since September, and the NDX (Nasdaq-100) to -4.5% before they bounced a bit on no news a little after 3pm ET. That took the indices a bit off the lows but all major US ones settled down by -2% or more led by the Nasdaq’s -4%, its worst day since 2022. It was the 7th session in 8 with a daily close in excess of 1%, and the volatility indices predict more of the same in coming sessions as noted below. The S&P 500 is off -8.7% from its all-time high reached Feb. 19, and the Nasdaq Composite is off nearly -14% from its recent high.
Treasury yields fell back as Fed rate cut bets pushed to the highs of the year. The dollar though was able to stabilize after its worst week since Nov ‘22. Gold, copper, crude, and bitcoin also fell back while nat gas was higher.
The market-cap weighted S&P 500 (SPX) was -2.7%, the equal weighted S&P 500 index (SPXEW) -1.4%, Nasdaq Composite -4.0% (and the top 100 Nasdaq stocks (NDX) -3.8%), the SOX semiconductor index -4.9%, and the Russell 2000 (RUT) -2.7%.
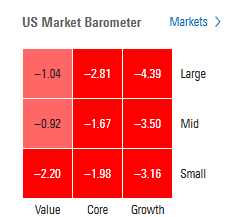
Morningstar style box saw broad losses led again by growth stocks.
Market commentary:
“We’ve gone from animal spirits to what are the odds of a recession,” said Gina Bolvin, president of Bolvin Wealth Management Group. “This is a headline-driven market; one that could change in an hour. Sit tight. Buckle up. We finally have the correction we were waiting for, and long-term investors will be rewarded again.”
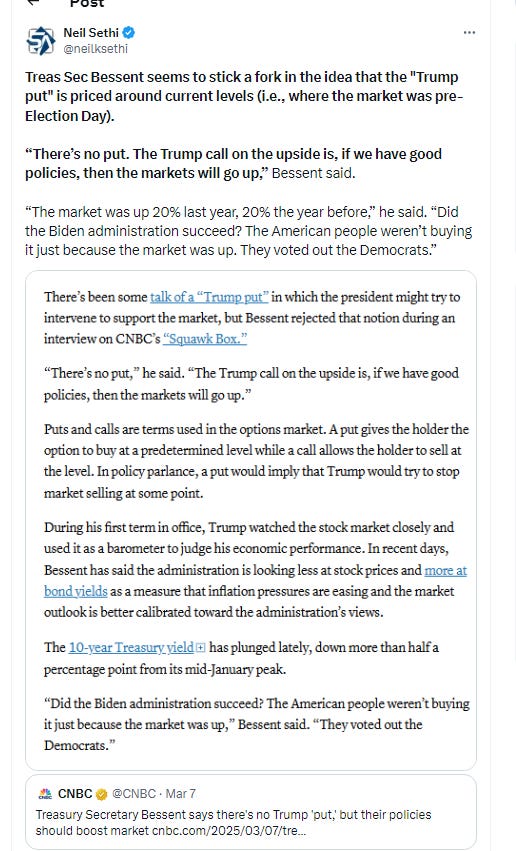
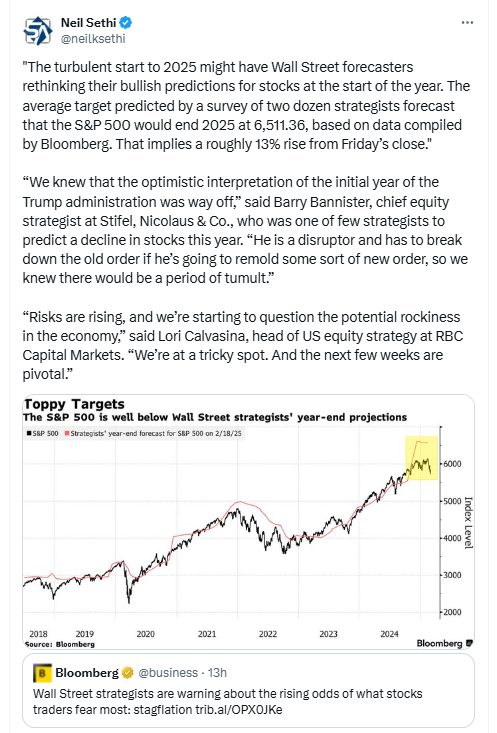
“Much has been said regarding the ‘Trump put’ and the potential for the President’s apparent sensitivity to the stock market to temper a more dramatic trade war,” BMO’s Ian Lyngen and Vail Hartman remarked. “There is some evidence that this dynamic remains in place [but] the equity market is vulnerable to the swift shifts in Trump’s policies and there is nothing to point toward stability in the near-term.”
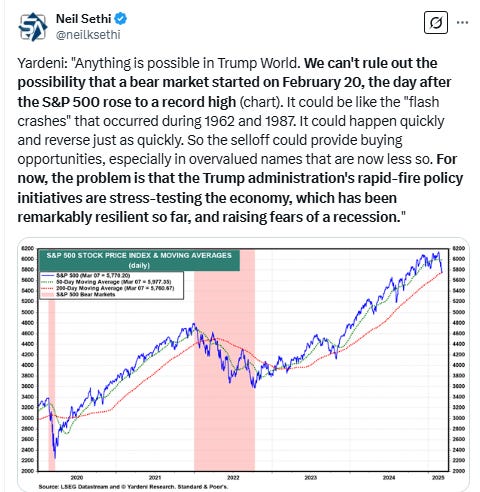
“There’s a saying on Wall Street about how nothing good happens below the 200-day moving average,” said Callie Cox at Ritholtz Wealth Management. “Honestly, out of all the crazy sayings that come out of this industry, it’s one you should take seriously. Selloffs accelerate and swings get dramatically bigger in the danger zone – or the space below the 200-day moving average.”
“I’ll also note that many of the biggest selloffs we’ve seen in the stock market have started with growth scares and job market worries,” said Cox. “Considering the disappointing data we’ve seen over the past few days, I’d be a little more cautious here if your timeframe is a matter of days, weeks or months. Get defensive and hug your value stocks. Prioritize portfolio balance.”
“This is a period of high uncertainty on a global macro scale - and as a result, we continue to see de-risking in US stocks,” said Dan Wantrobski at Janney Montgomery Scott. “Added to the potential geopolitical disruptors are the ongoing narratives of inflation, growth, and now potential recession (exacerbated by tariff wars) in the US.”
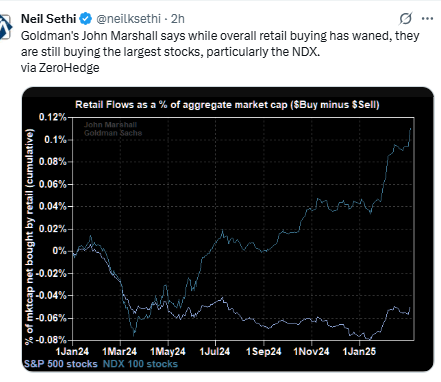
Also, '“we would reiterate that despite sentiment indicators like the AAII bull/bears numbers showing excessive bearishness from retail (newsletter writers), actual positioning of both Main Street and institutional investors remains skewed toward long equities,” said Wantrobski. “ This implies that there could be more firepower to unwind if our unstable macro landscape persists in the coming weeks/months.”
“Just a couple of weeks ago we were getting questions about whether we think the US economy’s re-accelerating —- and now all of a sudden the R word is being brought up repeatedly,” said Gennadiy Goldberg, head of US interest rate strategy at TD Securities, referring to the risk of a recession. “The market’s gone from exuberance about growth to absolute despair.”
Mark Hackett at Nationwide says he has greater confidence that we are near a bottom rather than on the cusp of a new wave of selling. “We do need to keep an eye on the pessimistic scenario though, where labor market fears and consumer pullbacks could lead to stagflation, but the proof will be in the datapoints that come out over the next few weeks,” he noted. “If key risks like the debt ceiling, government shutdown, and tariffs resolve in a better-than-worst-case scenario, and economic data remains stable, we could see a recovery follow this selloff.”
“We are in the throes of a manufactured correction,” said Sam Stovall, chief investment strategist at CFRA Research. “I say manufactured because it’s really based in response to the new administration’s tariff programs, or at least threats of tariffs, and what kind of an impact that will have on the economy.”
The talk of tariffs is in a lot of ways worse than the implementation of them, according to David Bahnsen, chief investment officer at The Bahnsen Group,
“I do not believe the administration knows how the tariff situation will play out, but if I were a betting man, I would say that it will persist long enough to do damage to economic activity for at least a quarter or two, and ultimately result in a deal with different countries that make everyone wonder why we went through all the fuss,” Bahnsen said. He also noted that if a tax cut extension and further tax reform bill is passed through budget reconciliation sooner than later, that will help “offset the damage.”
“Markets continue to prove sensitive to trade policy, as considerable uncertainty remains over the size and scope of tariffs to be implemented,” said Jason Pride and Michael Reynolds at Glenmede. “Just as important may be how long the tariffs stay on. Are they temporary in order to extract concessions, or are they a new permanent fixture of US trade policy?”
“There are always multiple forces at work in the market, but right now, almost all of them are taking a back seat to tariffs,” said Chris Larkin at E*Trade from Morgan Stanley. “Until there’s more clarity on trade policy, traders and investors should anticipate continued volatility. This week’s inflation numbers will provide another test.”
“Inflation data will dominate the economic calendar this week. The total and core Consumer Price Indexes (CPI) likely rose at a more moderate pace in February after sharp increases in the prior month, resulting in annual increases holding roughly steady,” Comerica Bank chief economist Bill Adams said in a statement. “Pushed higher by tariffs and tariff threats, producer prices probably rose faster than consumer prices for a second month running, keeping annual PPI elevated.”
In a note to clients on Monday, Deutsche Bank’s Jim Reid described last week in financial markets as “one of the more dramatic weeks in living memory,” pointing to the major sell-off of Germany’s 10-year government bonds — known as bunds — as well as big moves in other asset classes.
“The euro saw its biggest weekly gain since March 2009 while the S&P 500 saw its largest weekly fall in six months,” he said. “As we continue to catch our breath, this week is relatively quiet for data even if I suspect it won’t be for news flow. The data highlight is U.S. [Consumer Price Index] on Wednesday, but the reality is that there are bigger fish for the market to fry at the moment than a monthly inflation report. How times are changing.”
“All in all, February’s jobs report doesn’t give the Federal Reserve any reason to lower interest rates further at its upcoming March 18-19 policy meeting. The odds of a rate cut at the March meeting were only 3% on Friday morning following the release of the employment data, according to the CME FedWatch. But the report does show the labor market’s cooling trend continues—and doesn’t rule out an assist from the central bank in the coming months.” - Megan Leonhardt, Barrons
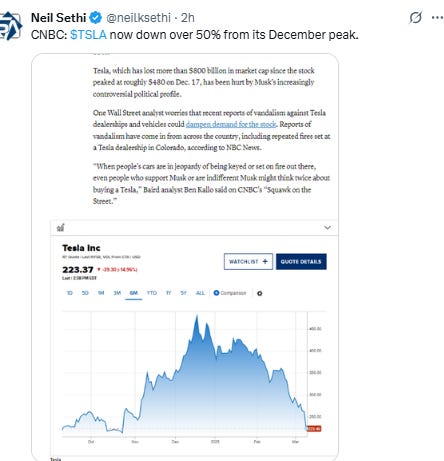
In individual stock action, The “Magnificent Seven” cohort, once the stars of this bull market, led the declines Monday as investors dumped the group for perceived safer plays. Tesla tumbled 15% for its worst day since 2020, while Alphabet and Meta fell more than 4%. Artificial intelligence darling Nvidia lost 5%. Palantir, another once-loved stock by retail traders, was down 10%. A gauge of the Magnificent Seven megacaps tumbled 5.4%.
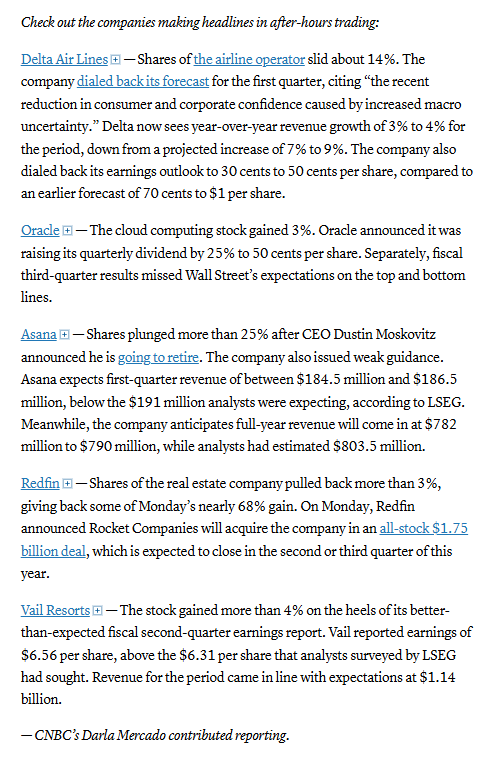
After-hour movers from CNBC:
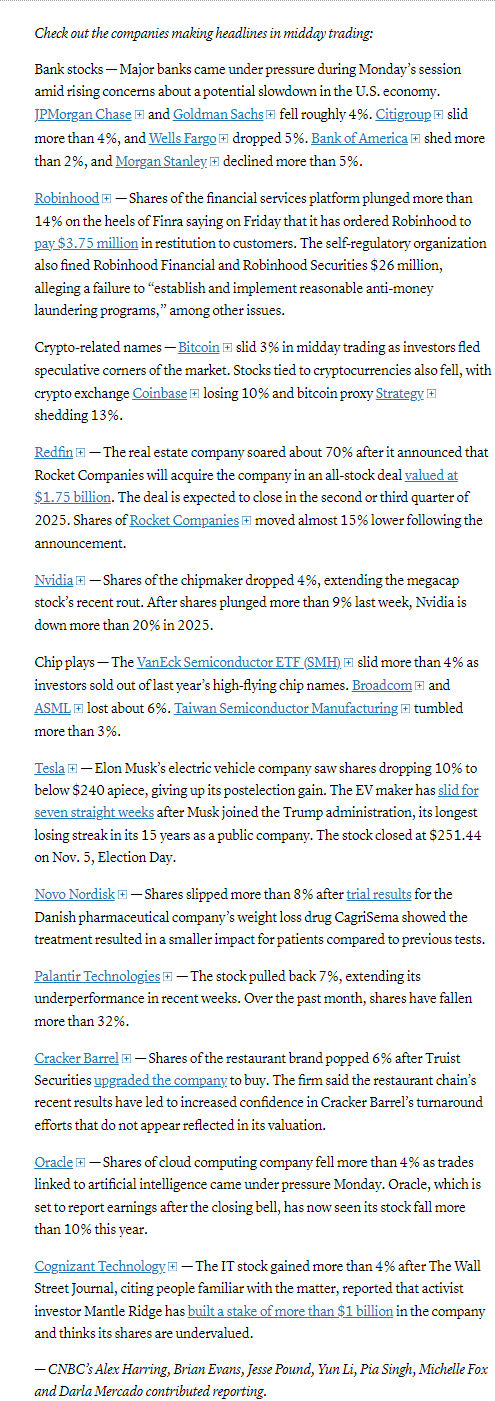
Some tickers making moves at mid-day from CNBC.
In US economic data:
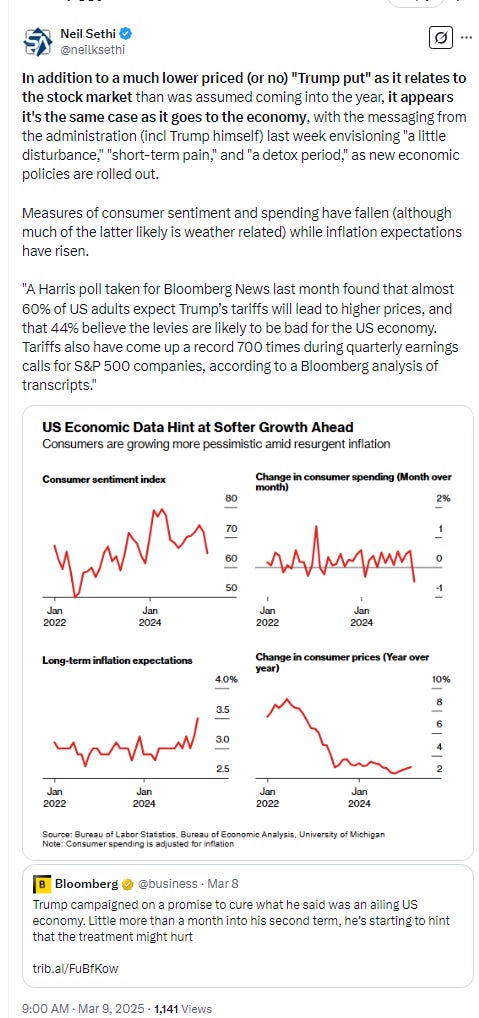
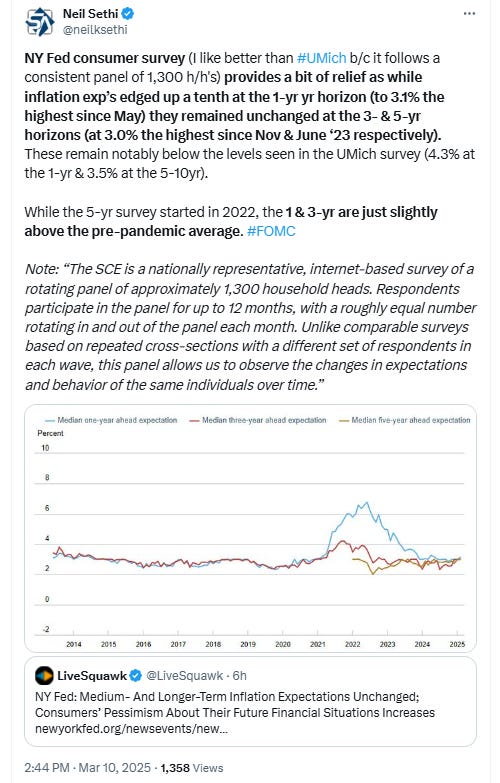
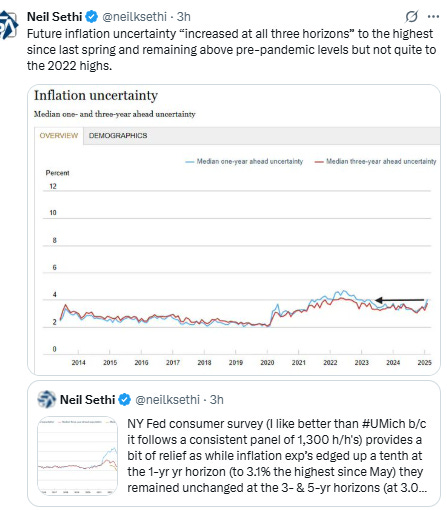
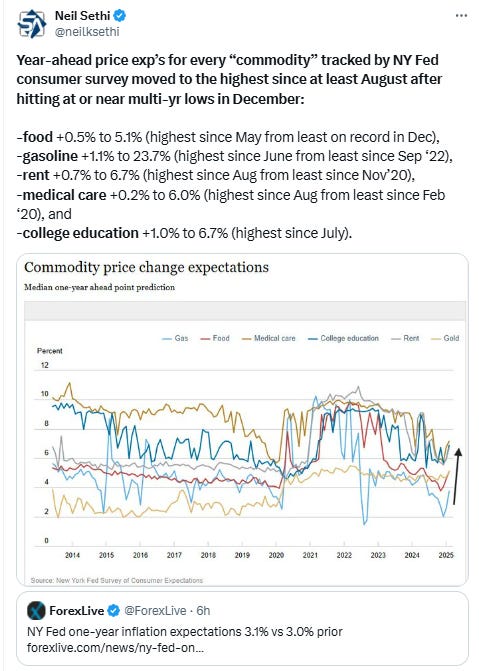
We got the NY Fed consumer survey (I like better than UMich b/c it follows a consistent panel of 1,300 h/h's) which provided a bit of relief as while inflation exp’s edged up a tenth at the 1-yr yr horizon (to 3.1% the highest since May) they remained unchanged at the 3- & 5-yr horizons (at 3.0% the highest since Nov & June ‘23 respectively). These remain notably below the levels seen in the UMich survey (4.3% at the 1-yr & 3.5% at the 5-10yr).
Link to posts - Neil Sethi (@neilksethi) / X for more details/access to charts.
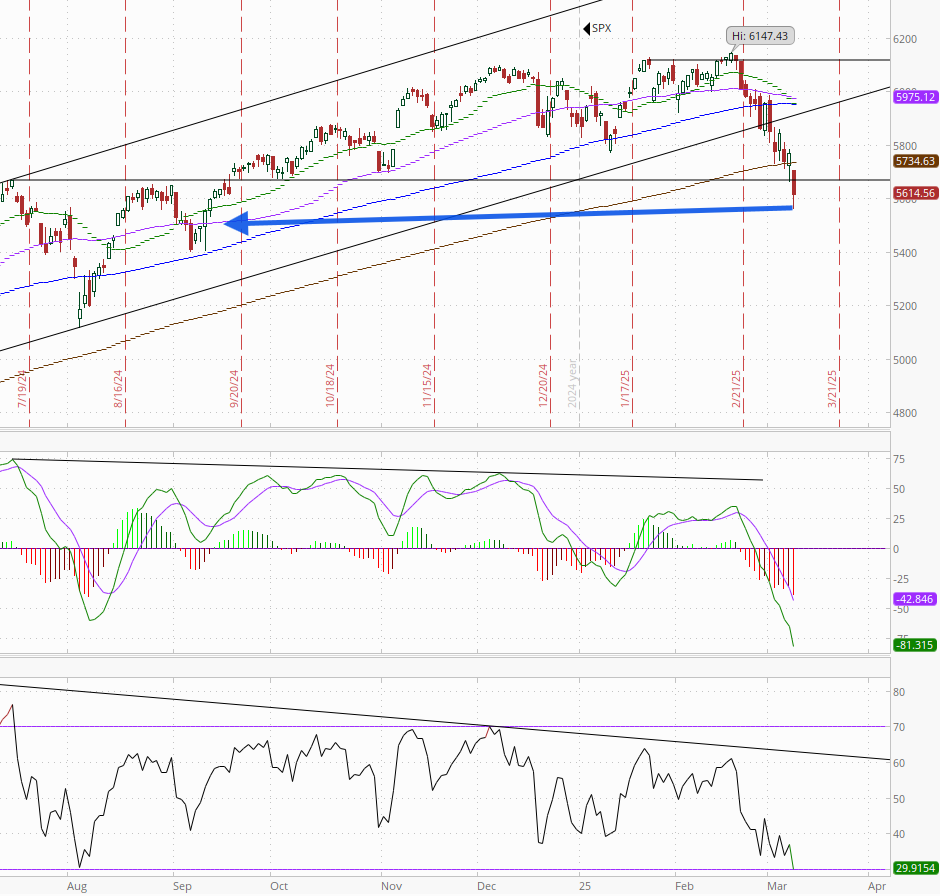
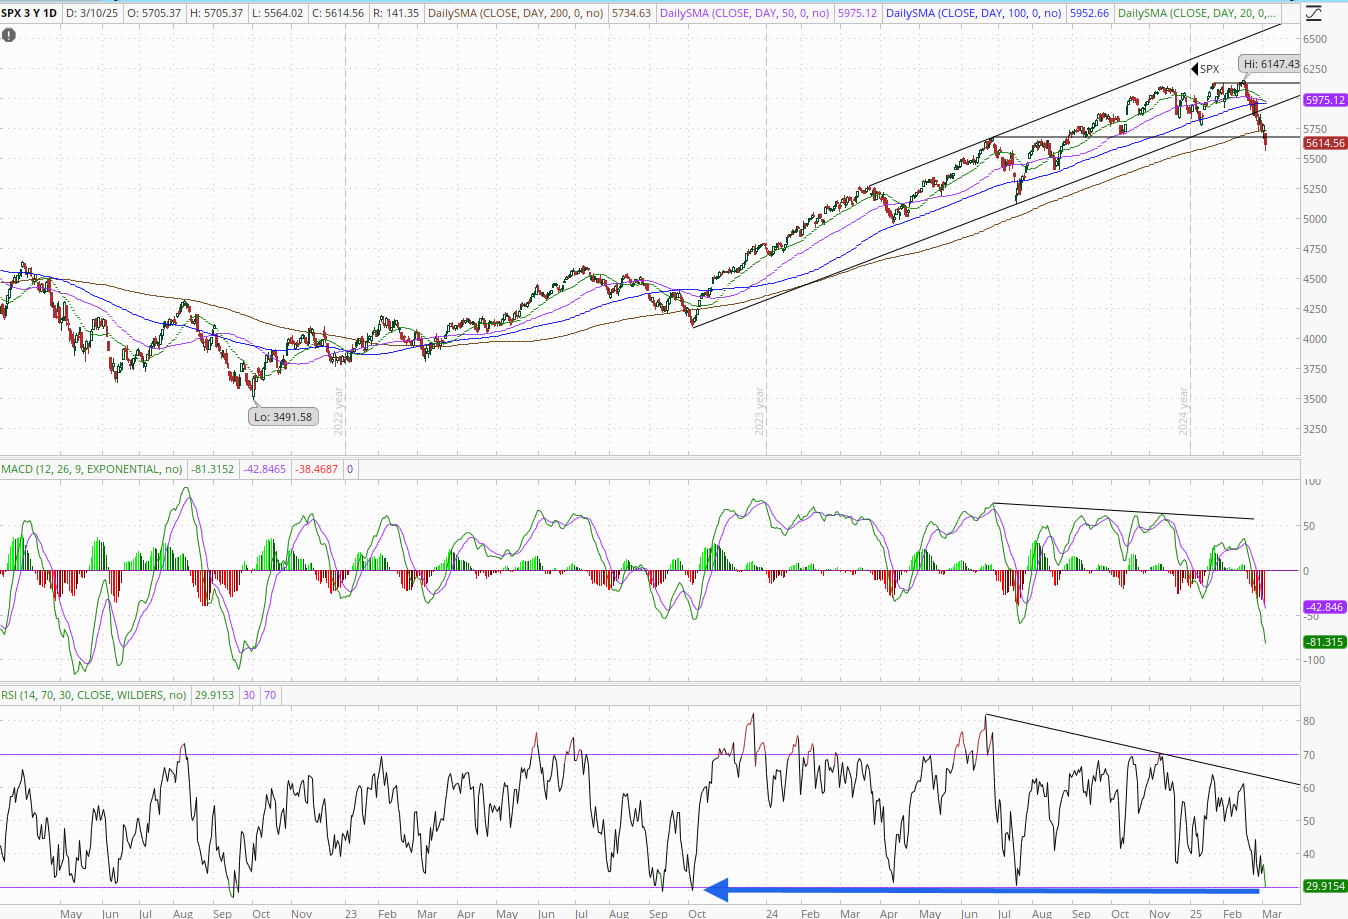
The SPX as noted fell to the least since Sept during the session before getting a small rebound, well under its 200-DMA though. It is also below the 5666 level noted Friday which was an important level in 2024 representing the July peak, September breakout, and October low. I noted breaching that significantly would see more selling, and that is what we saw.
The daily MACD remains firmly in “sell longs” positioning, and RSI is now the weakest since Oct ‘23. As I said Friday, “this would be a ‘natural’ place for a bottom, but that certainly doesn’t mean it will be the bottom.”
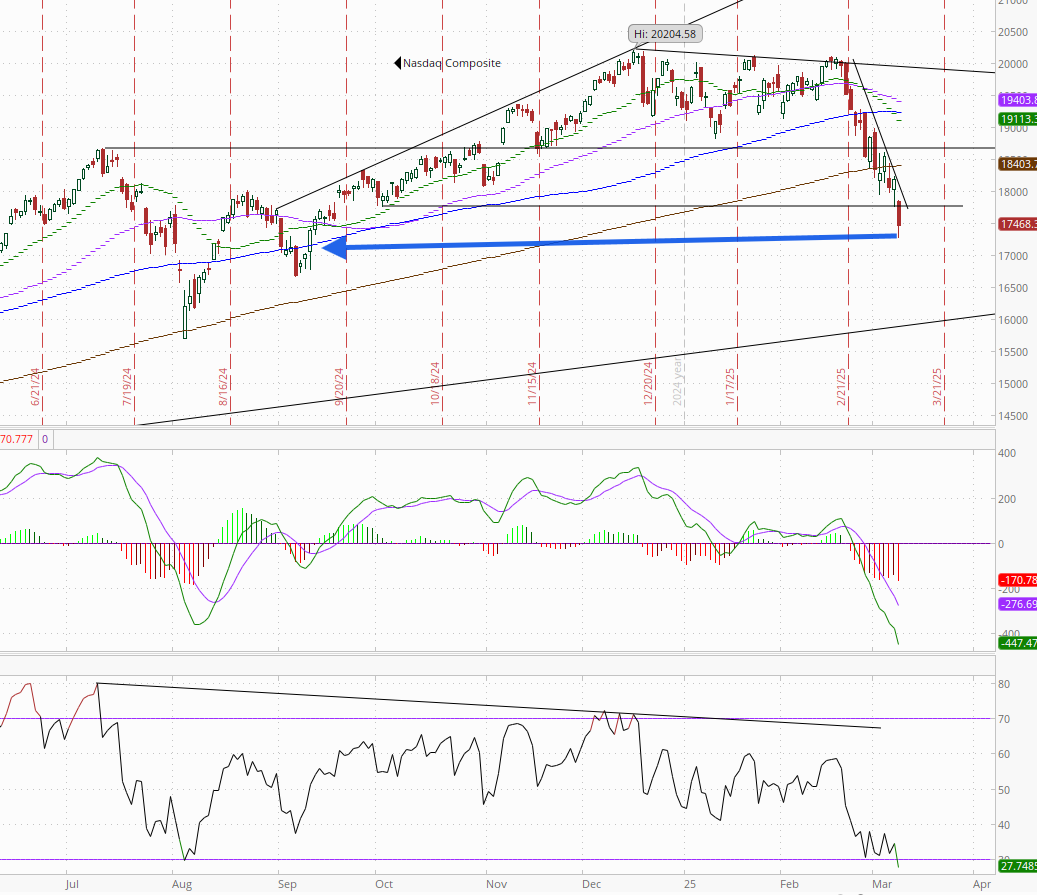
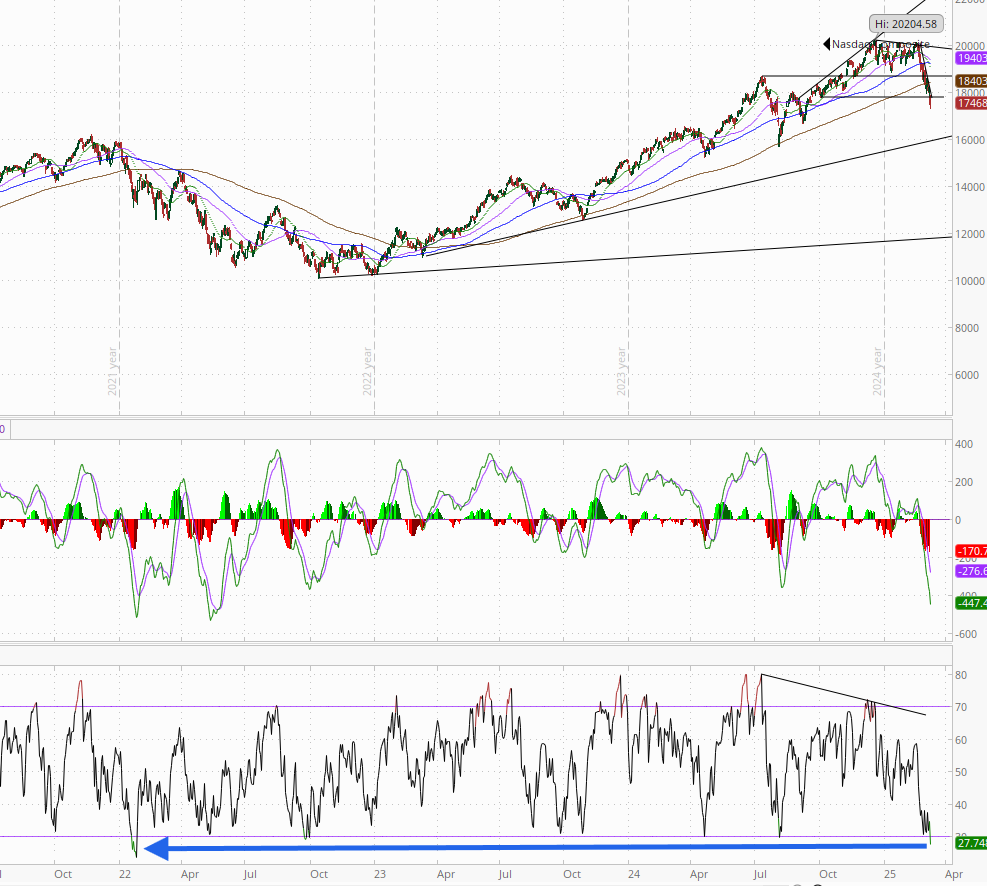
The Nasdaq Composite like the SPX fell to the lowest since Sept, even further below its 200-DMA. Its daily MACD also remains firmly in “go short” positioning, and its RSI is the weakest since Jan 2022(!).
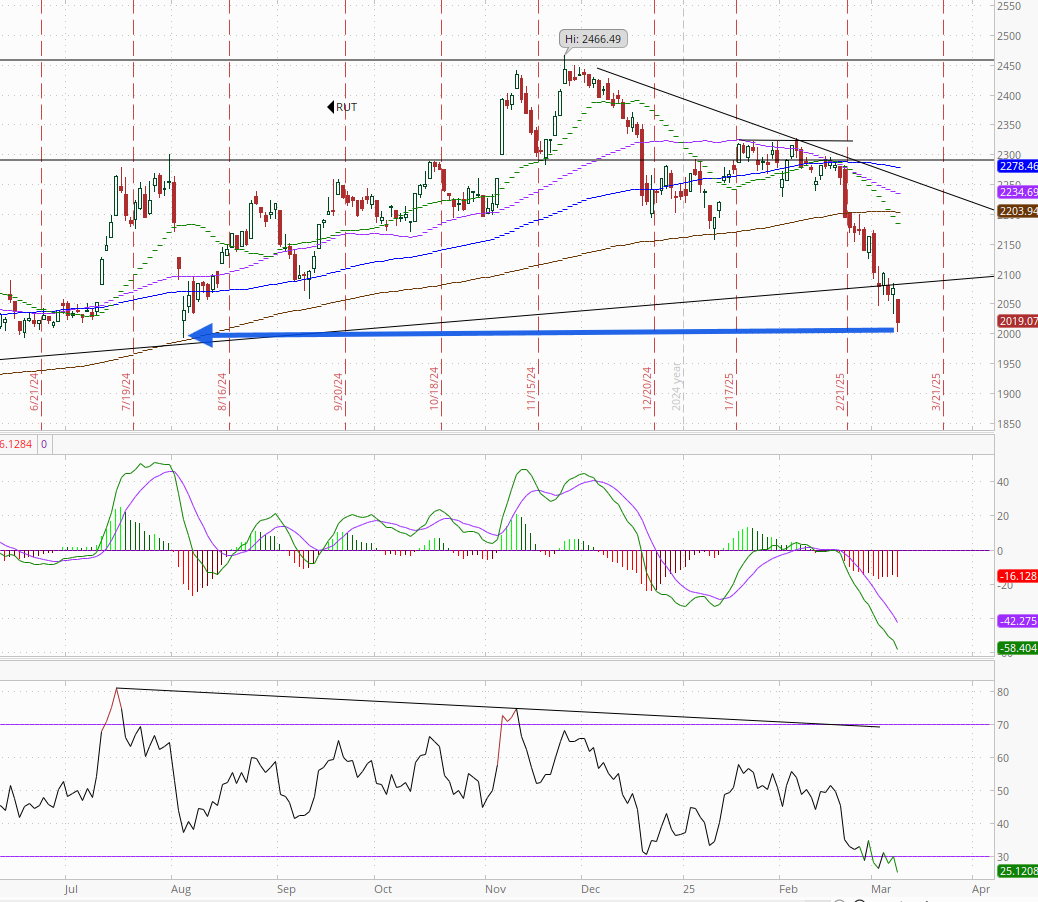
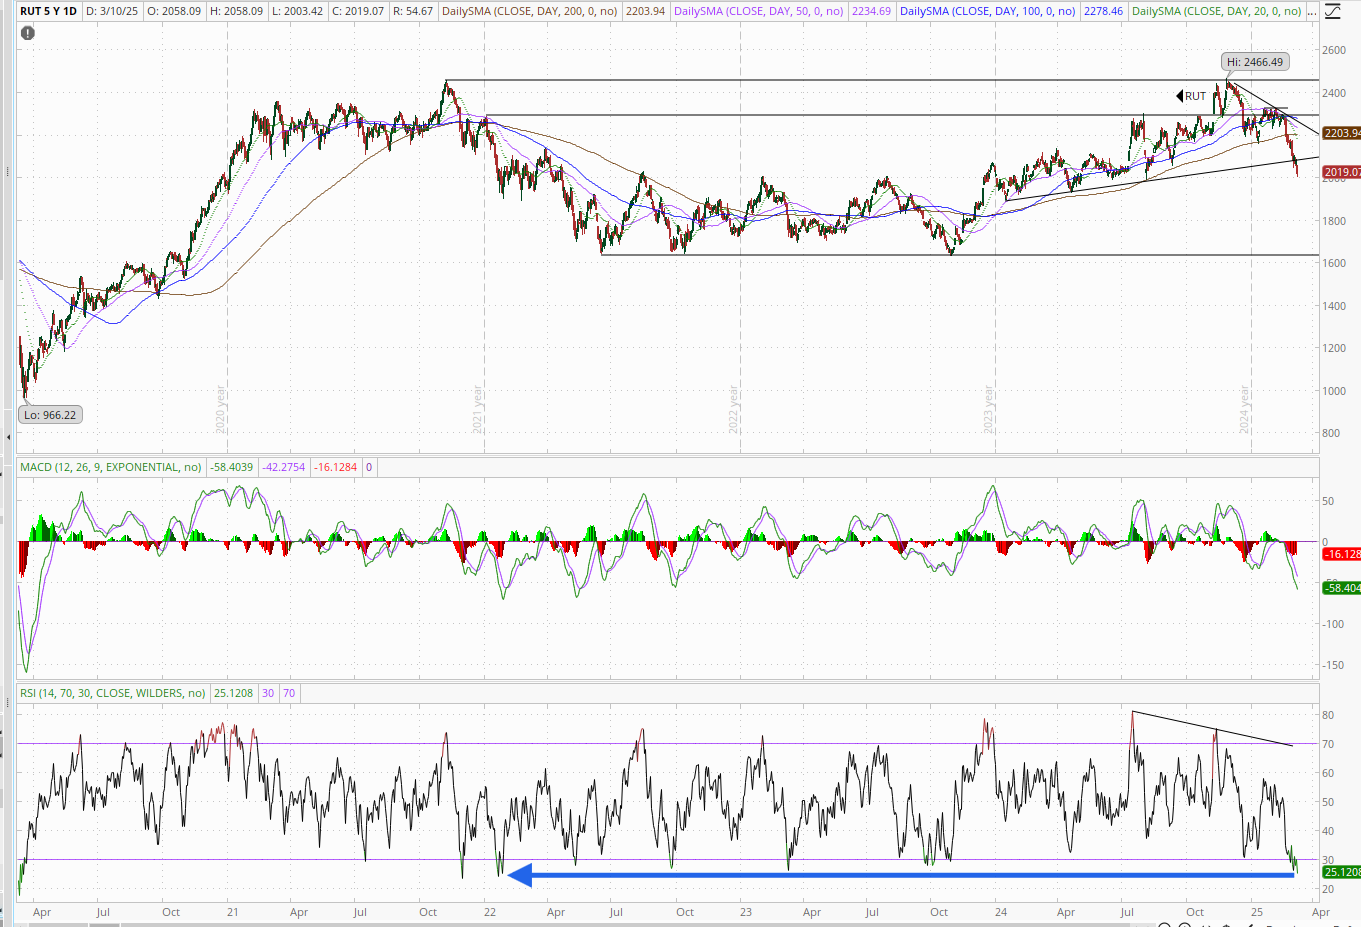
RUT (Russell 2000) fell to the lowest since August intraday and the lowest close since June. It seemed to find some support at the 2000 level. Its daily MACD remains firmly in “go short” positioning, and its RSI is also the weakest since Jan 2022.
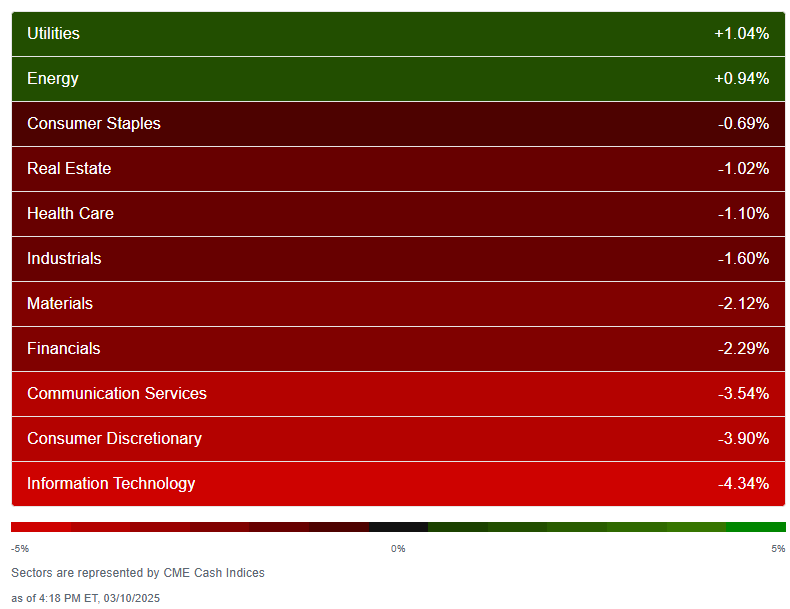
Equity sector breadth according to CME Cash Indices actually had two green sectors and both were up around 1% (Utilities & Energy). Every other sector down at least -0.7%, and 8 of 11 down over -1%. Megacap growth sectors hammered all down at least -3.5%. Defensives outperformed taking four of the top five spots.
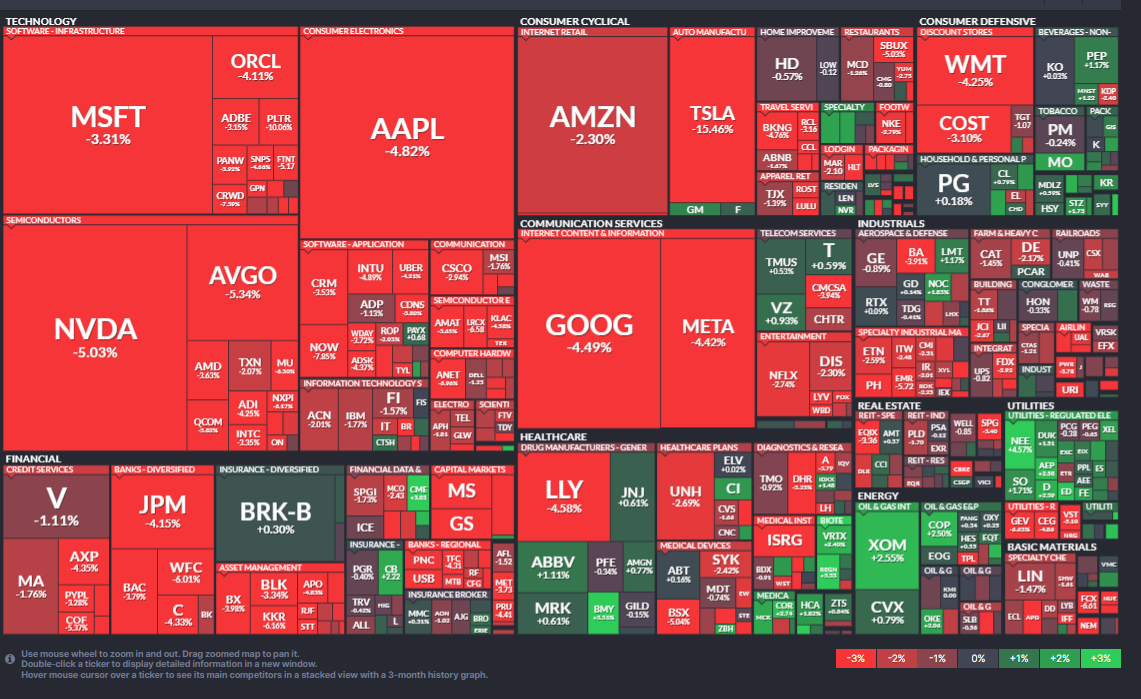
SPX stock-by-stock flag from Finviz consistent with that with more green than I expected to see but lots of “bright” red meaning losses over -3%.
Tech was sold aggressively with just about every stock down over -3% as were WMT, COST & LLY for a second session. TSLA -15%, has been cut in half since mid-December. Financials hit hard again with JPM, AXP, EFC, BAC, C, BLK, MS, GS, APO all down over -4%.
Positive volume (percent of total volume that was in advancing stocks) was weak as you might expect at 23% on the NYSE, 25% on the Nasdaq, around what we saw last Monday.
Positive issues (percent of stocks trading higher for the day) again weaker as it’s mostly been during those couple of weeks at 20 & 18% respectively meaning the buying was concentrated in fewer names).
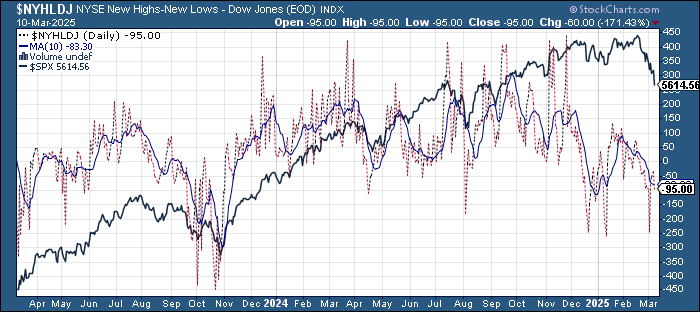
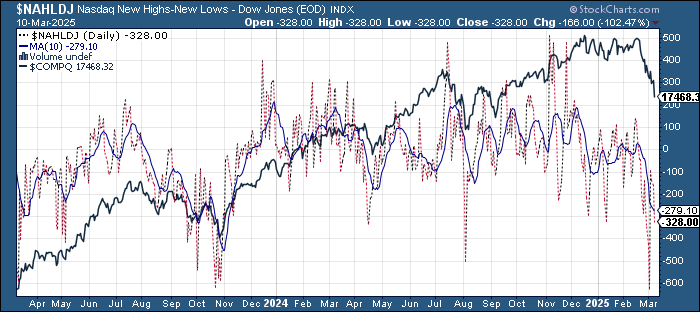
New highs-new lows (charts) fell on the NYSE to -93 still better than the -247 last Tuesday (almost the worst since Oct ‘23) while the Nasdaq deteriorated to -323 from still up from -629 Tuesday (which was the least since 2022) but otherwise the weakest since August. They are now back below the 10-DMAs (less bullish) which continue to fall.
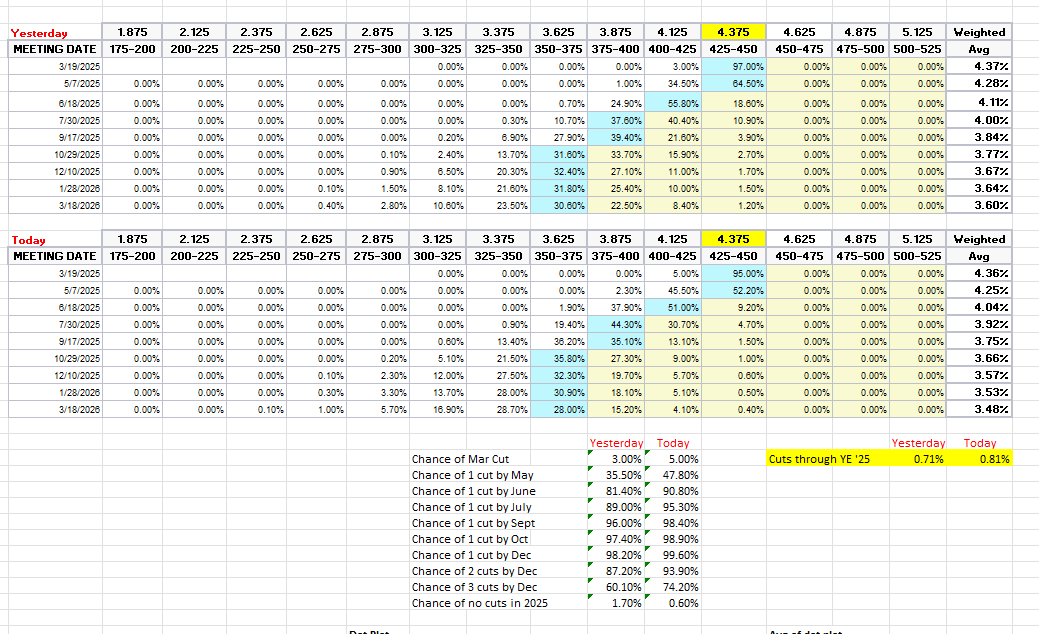
#FOMC rate cut probabilities from CME’s #Fedwatch tool pushed to the highs of the year.
Even a cut by March edged to 5% even though there’s realistically no chance of one, but one by May up to 48% from 36% Friday, and one by June to 91% (from 81%). Chance of two 2025 cuts at 94% (vs 87%), three cuts at 74% (from 60%), and no cuts down to 0.6% (vs 2% and 29% on CPI Day last month) with 81bps of cuts priced (+10bps from Friday & up from 28bps last CPI Day).
I said after the big repricing in December (and again earlier this month) that the market seemed too aggressively priced to me, and that I continued to think cuts were more likely than no cuts, and as I said when they hit 60 bps “I think we’re getting back to fairly priced (and at 70 “maybe actually going a little too far”). But as I said then “It’s a long time until December.”
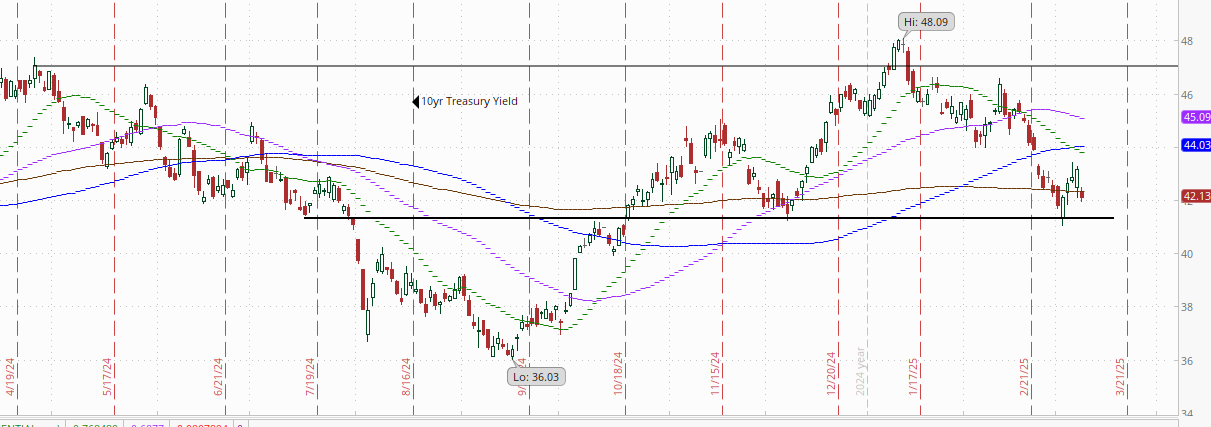
10yr #UST yield gave back half of last week’s gains -11bps to 4.21%. Now down -45bps since CPI day (Feb 12th). I still think it’s more likely than not that it holds the 4.13% level, but if the equity selloff continues through this week, that definitely becomes less likely.
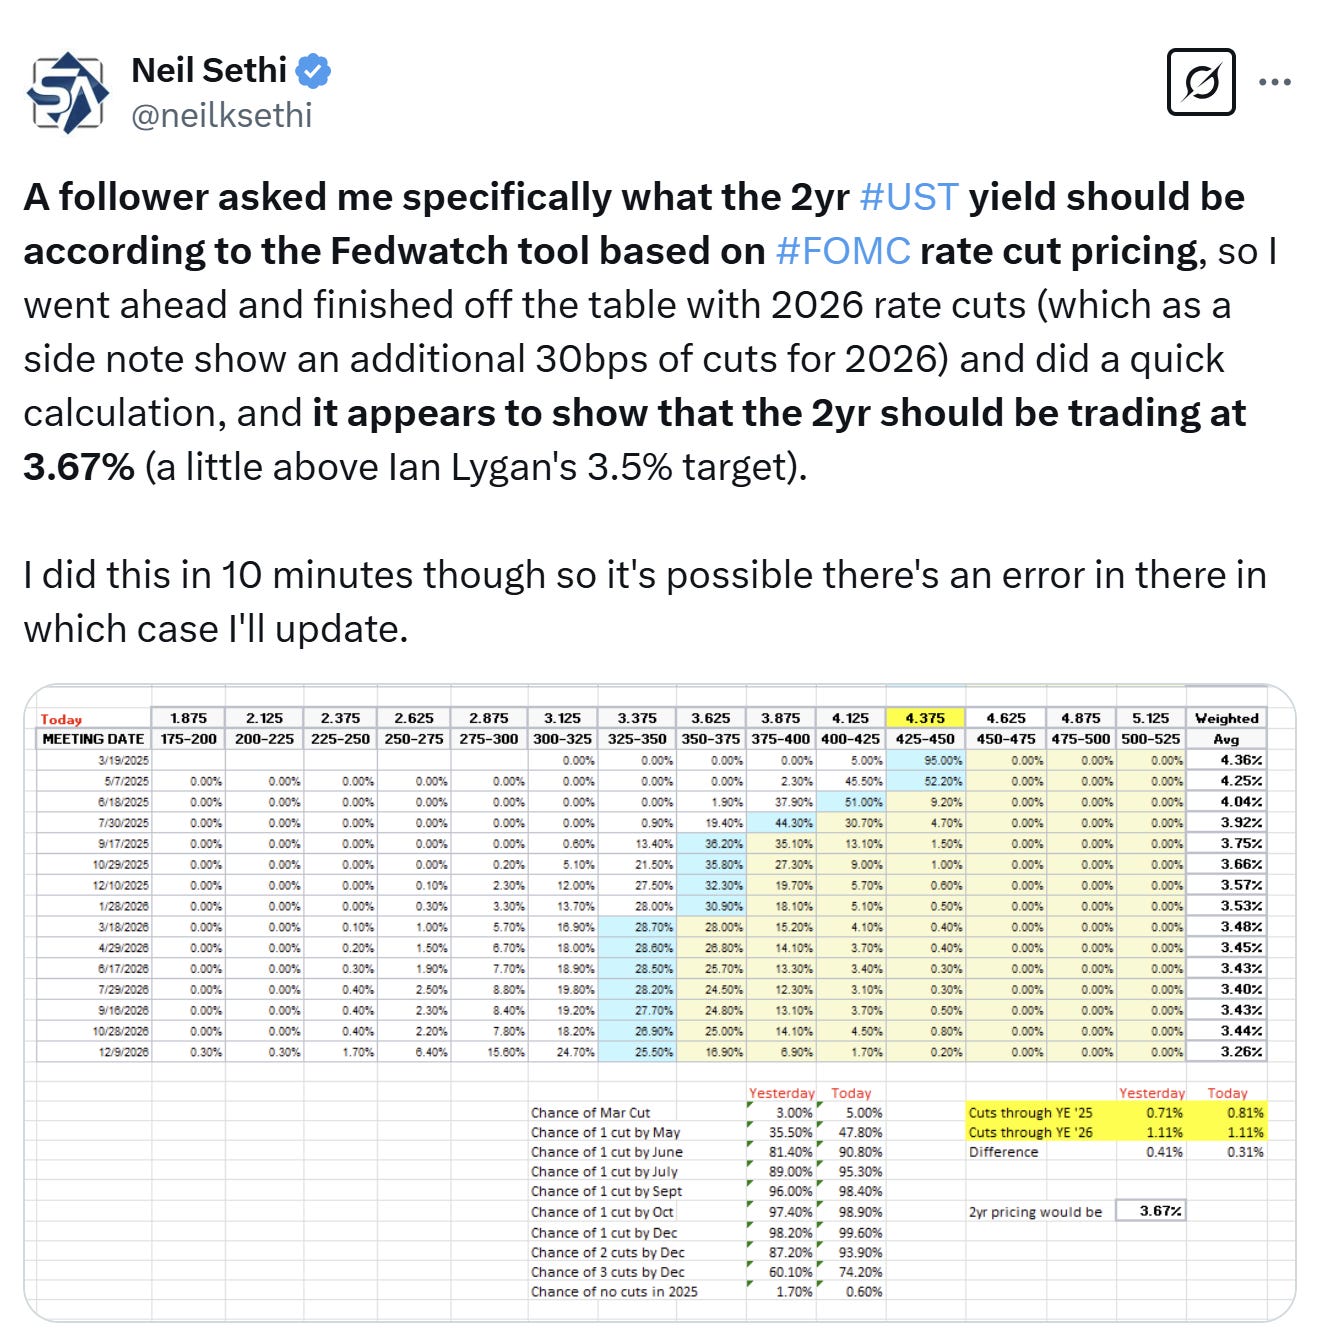
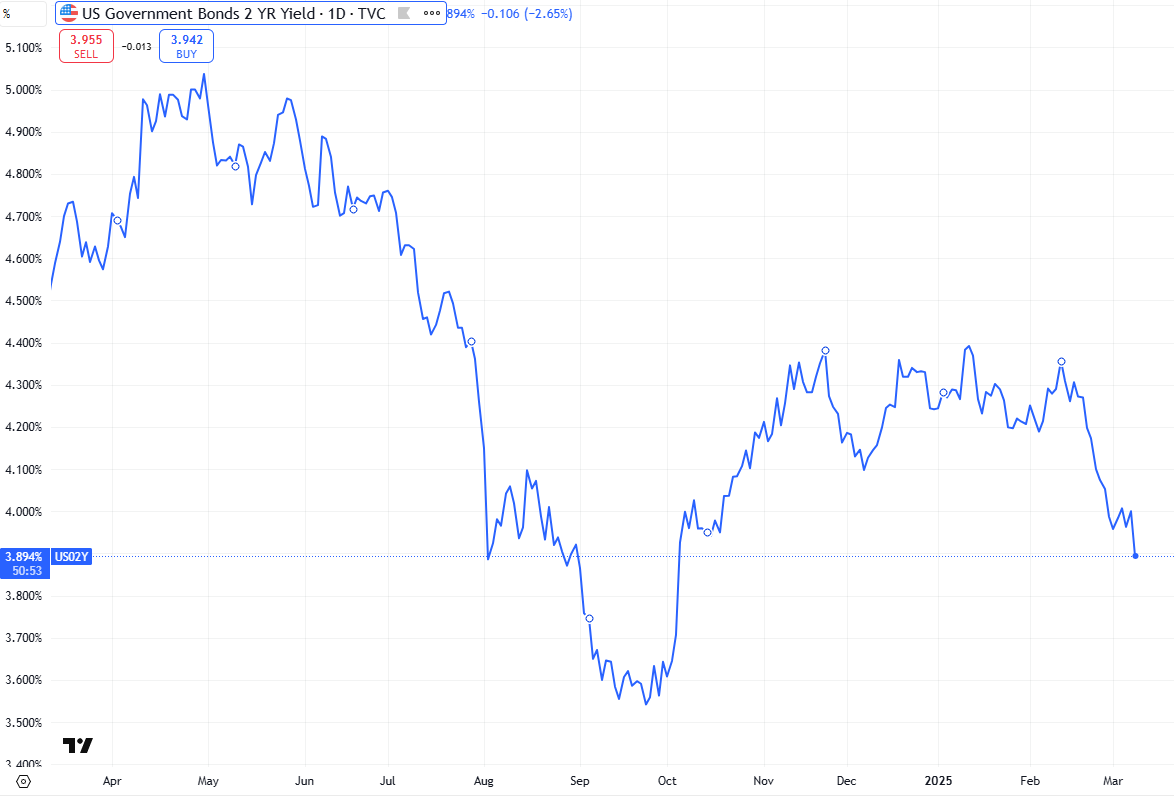
The 2yr yield, more sensitive to Fed policy, moved along with rate cut bets falling -11bps to 3.89%, the least since early Oct, now -43bps below the Fed Funds midpoint so continues to price far fewer cuts than SOFR markets but now moving closer to two full cuts.
I had said when it was 45-55bps higher (in Jan & again early Feb) that I found the 2-yr trading rich as it was reflecting as much or more chance of rate hikes as cuts while I thought it was too early to take rate cuts off the table (and too early to put hikes in the next two years on), and the market has continued to move in that direction, now definitely closer to where I think fair value is but, there could be a little more to go. Ian Lygan of BMO sees it going to 3.5% by year’s end.
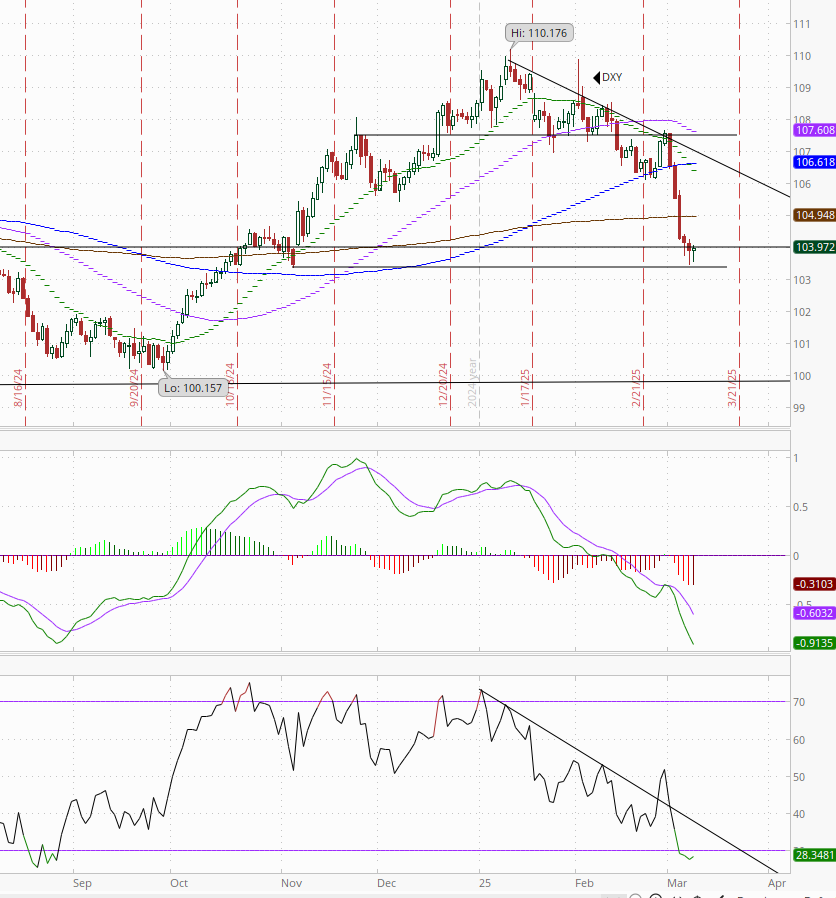
Despite the selloff in yields, dollar $DXY able to break its 5-day losing streak (the worst week since Nov ’22) with a marginal gain, stabilizing above the Election Day lows it bounced from on Friday. Daily MACD remains firmly in “go short” positioning while the RSI remains in oversold territory on the daily RSI so it continuing to hold that seems far from certain. But as I noted Friday “seems this new support level really needs to hold, as not much under that until around 100.”
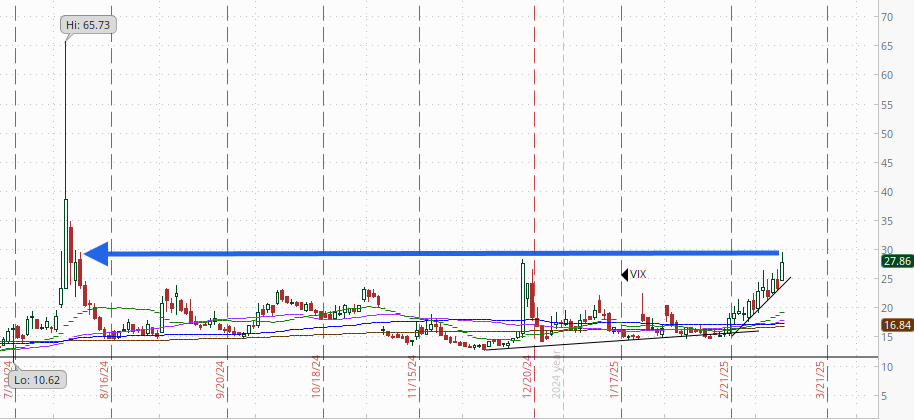
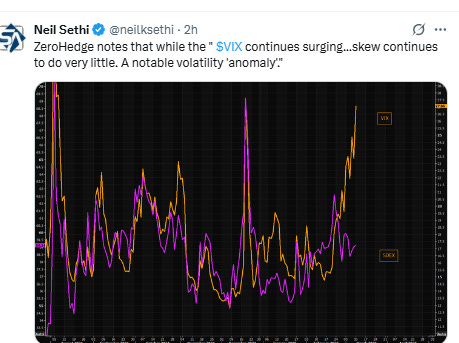
The VIX continued its textbook uptrend at one point hitting the highest since the Aug panic before settling just below the Dec high at 27.9 consistent w/~1.74% daily moves in the SPX over the next 30 days.
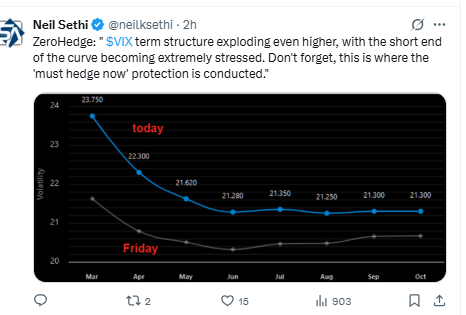
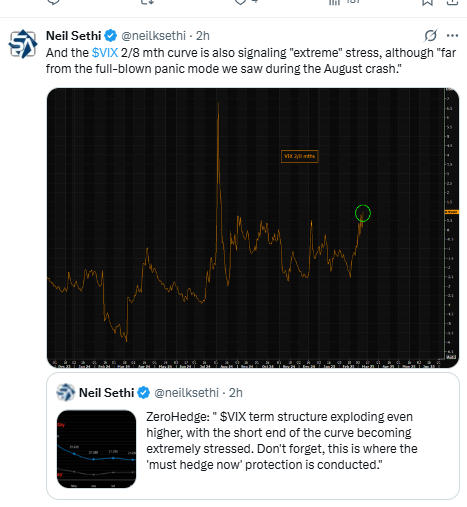
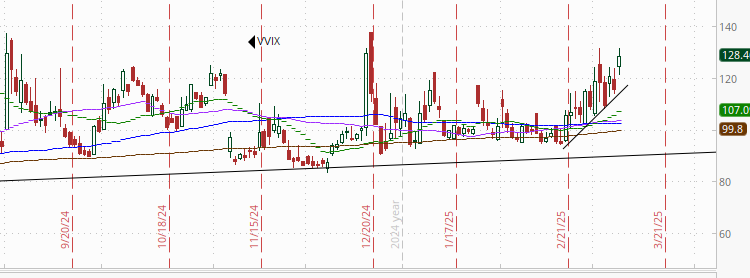
The VVIX (VIX of the VIX) also continued higher although didn’t get over the December highs but remains well over the 100 “stress level” identified by Nomura’s Charlie McElligott (consistent with “elevated” daily moves in the VIX over the next 30 days (normal is 80-100)) with an uptrend in place.
1-Day $VIX ended up at 28.7, the 4th highest close since inception (in Apr ‘21)). It’s looking for a move of 1.79% Tuesday.

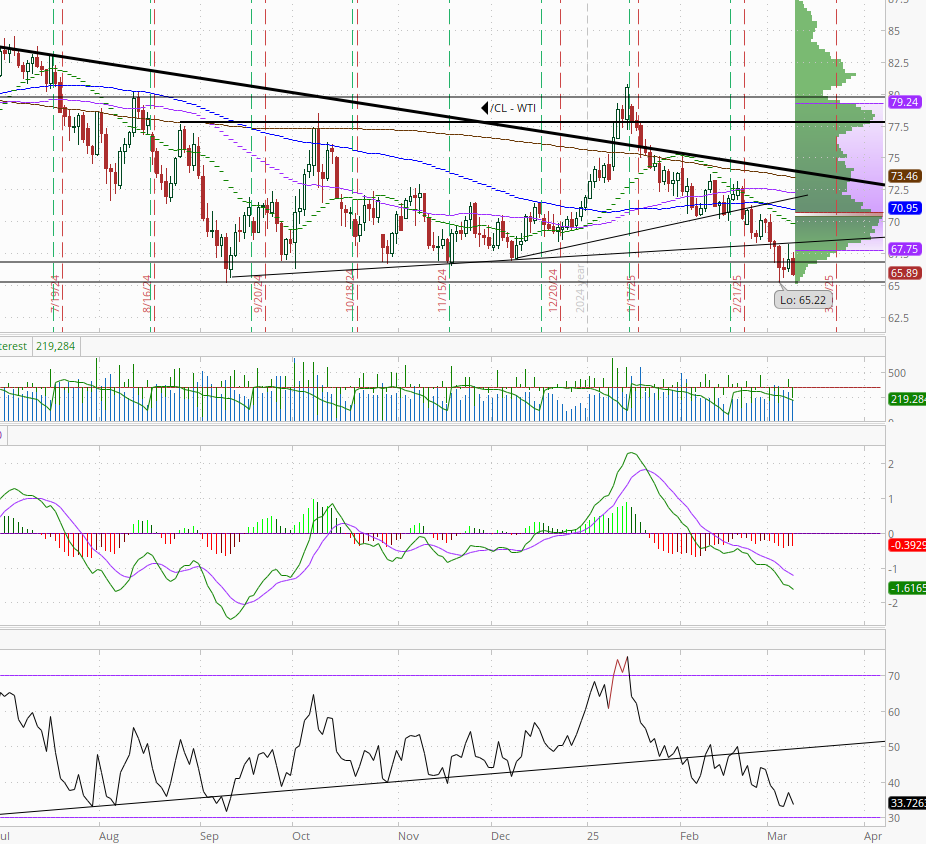
#WTI futures tried to stabilize but ended up falling back in the equity rout, their 6th down session in 7 after they finished an 8th straight down week, although (for now) continuing to hold the 2024 low of $65.27 which as I noted last week is the key level for me. Daily MACD remains in “go short” positioning, while the RSI is just off the weakest since Sept.

Gold futures fell back after their 11th up week in 12 last week. The daily MACD remaining in “sell longs” positioning, and the RSI continues to show a clear negative divergence (as I’ve noted for two weeks now), so as I said last week, not giving up on my target of $2800 quite yet.

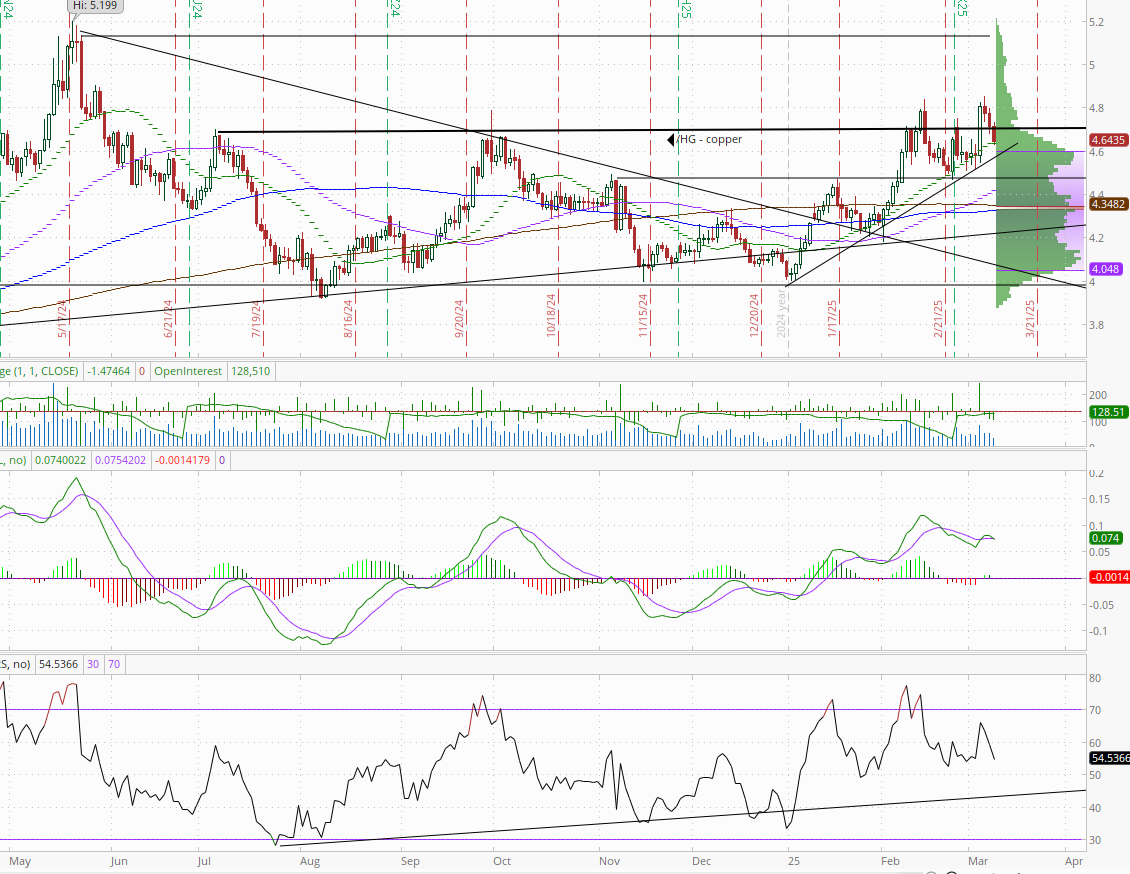
Copper (/HG) fell through the new $4.70 support level, but now has a couple of layers of close support below that and stopped at the first (the 20-DMA). An uptrend line from the Dec lows is just below that. Daily RSI and MACD have turned more neutral though (from supportive) and continue to have lower highs (negative divergence).
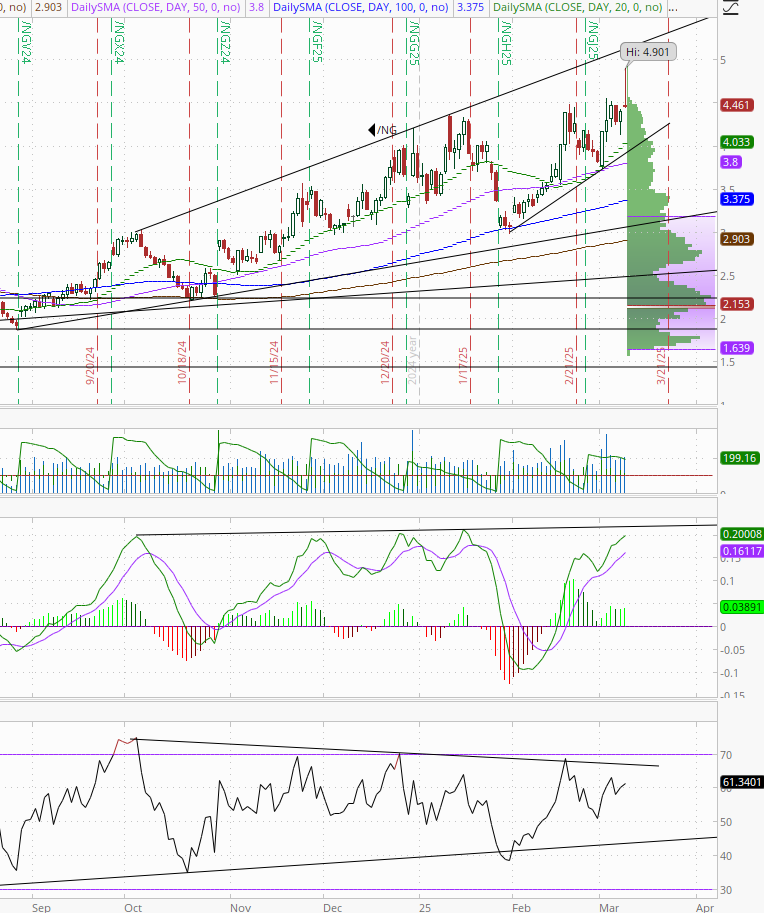
Nat gas futures (/NG) shot higher overnight coming within ten cents of $5, the highest since Dec ‘22, before giving back most of the jump, but still closing at the highest since then following the 4th weekly gain in 5 last week. Daily MACD remains in “go long” positioning while the RSI remains over 50 although both with lower highs (negative divergence).
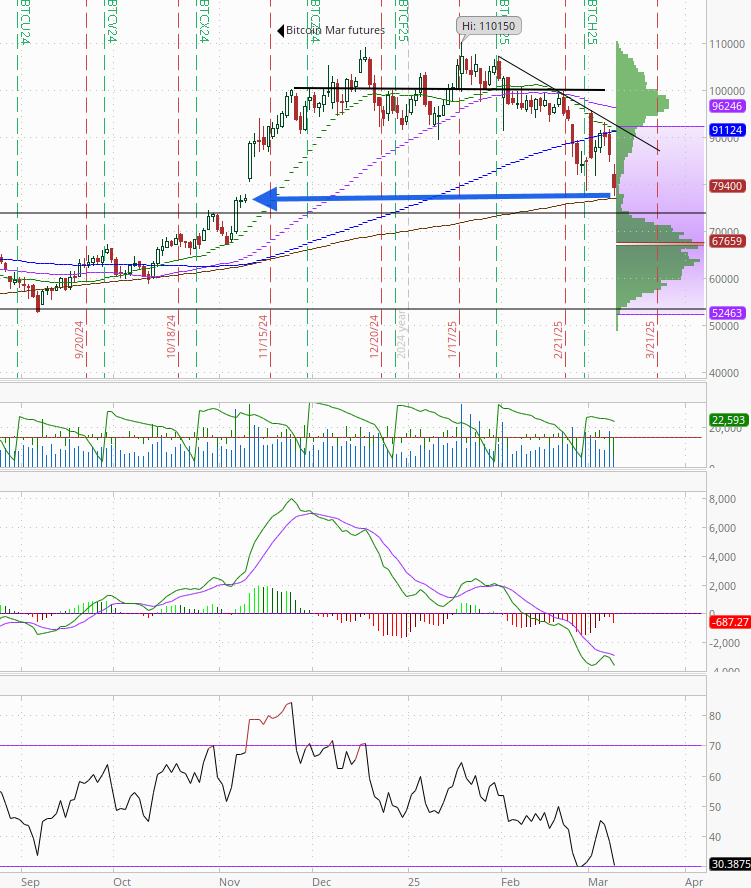
Bitcoin futures continued to track loosely with tech stocks falling -8% and through $80k (after -4% Friday, now down -12% since the establishment of the “Bitcoin reserve”), and finally filling the gap in the futures chart (which isn’t 24/7 like the underlying) from the “Bitcoin weekend” following the election. It also coincides with the 200-DMA where it found some support, so this seems like a key level. Relative strength back towards the lowest since July ‘23 while the daily MACD remains in “go short” territory.
The Day Ahead
US economic data tomorrow picks up with JOLTS (although it’s for January, so won’t incorporate much of the DOGE or tariff issues) and the Feb NFIB small biz sentiment survey.
No Fed speakers with the blackout, but we will get our first Treasury auction in $58bn in 3-yr notes.
No SPX components reporting Tuesday (see the full earnings calendar from Seeking Alpha).
Ex-US the highlight is Japan GDP and UK BRC retail sales overnight. In EM we’ll get industrial production from Brazil. We’ll also get the EIA’s monthly outlook.


Link to X posts - Neil Sethi (@neilksethi) / X
To subscribe to these summaries, click below (it’s free!).
To invite others to check it out,
Thanks