
Markets Update - 4/10/26
Update on US equity and Treasury markets, US economic data, the Fed, select commodities and a look at the upcoming day with charts!

Similar to the Week Ahead, I am reworking the nightly Markets Update to make it more streamlined and hopefully more useful. I made this week open to all subscribers so you can see the format and give it a try. Hopefully you liked it. As always, feedback is welcome.
Quick Summary:
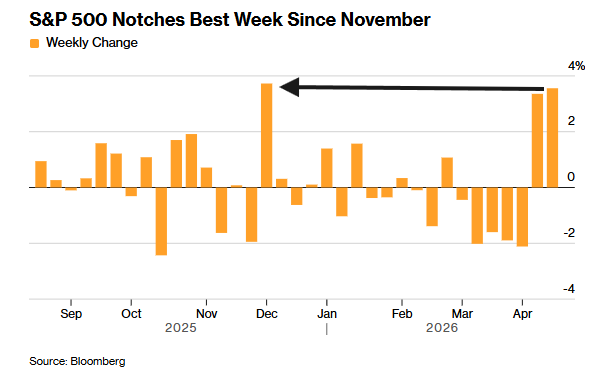
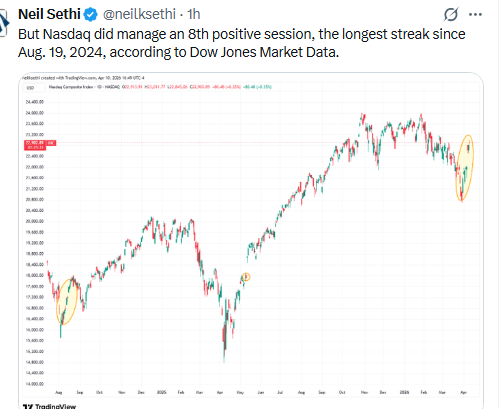
Equities started the day higher but fell back on continued cross-threats between President Trump and Iranian leaders ahead of weekend talks with just the Nasdaq ending higher (its 8th straight positive session) fueled by strong gains in semiconductors even as software stocks were sold one again. Still the S&P 500, Nasdaq, and Dow Jones Industrial Average would all clock their best weeks since November.
Crude oil would finish lower capping what was its largest weekly decline since the early days of the pandemic.
In US economic data:
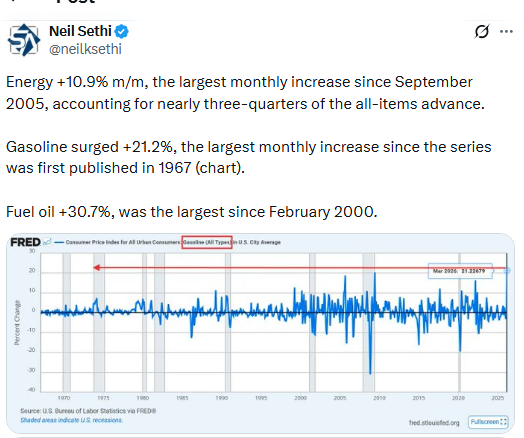
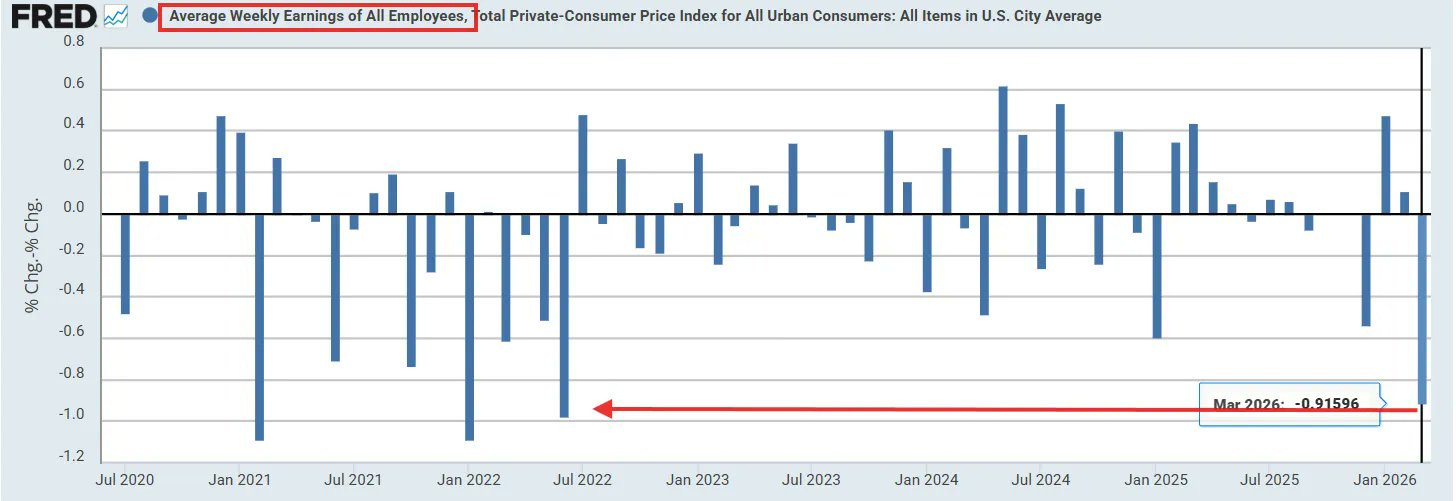
A jump in energy prices saw the largest m/m increase in headline CPI since June 2022 on the back of a record increase in gasoline prices, but core (ex-food & energy) remained more subdued. Y/Y real weekly earnings through saw the smallest increase since April 2024.
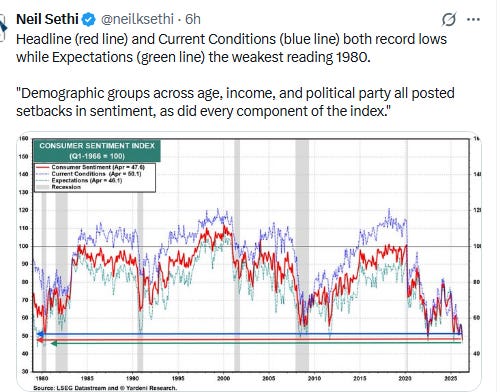
Consumer sentiment continued to deteriorate into early April hitting a record low as 1-yr inflation expectations jumped, but long-run expectations were more contained.
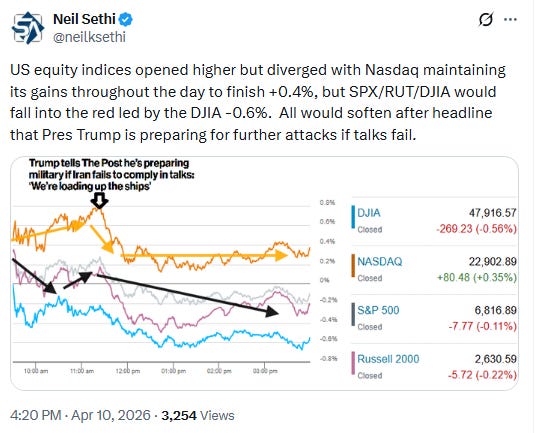
US equity indices opened trading Friday modestly higher as developments in the Mid-East continued to unfold as detailed in the morning post, led by the Nasdaq Composite on strength in Technology stocks outside of software (which continued to be pressured by concerns about AI displacement) after after Taiwan Semiconductor Manufacturing (TSM 370.60, +5.11, +1.40%) reported robust Q1 revenues.
Indices would see relatively small changes until a headline hit that President Trump told the New York Post in an exclusive interview that the U.S. was “loading up the ships” in case this weekend’s talks with Iran didn’t lead to a workable resolution. “We have a reset going. We’re loading up the ships with the best ammunition, the best weapons ever made — even better than what we did previously and we blew them apart,” he said.
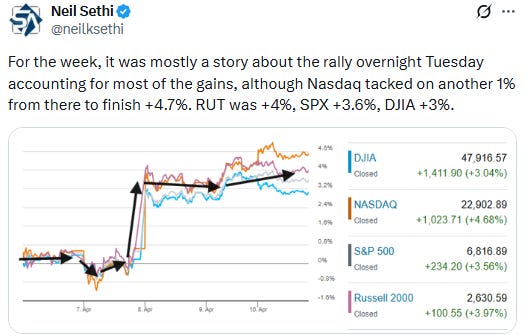
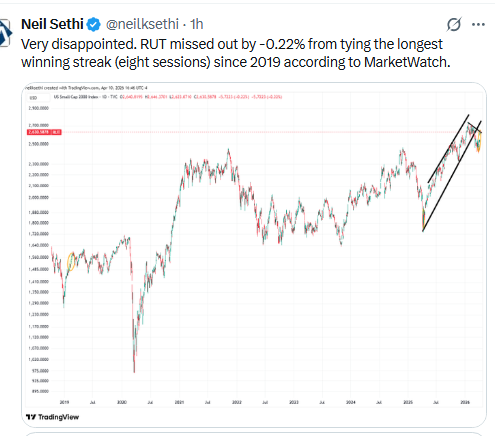
Indices would fall back, and while the Nasdaq would recover, the S&P 500 (SPX), Russell 2000 (RUT), and Dow Jones Industrial Average (DJIA) would all fall into the red. For the week, though, all saw solid gains with the SPX, DJIA, and Nasdaq all seeing their best weeks since November at +3.6%, +3%, and +4.7% respectively. The RUT was the best since early January +4%.
Elsewhere, bond yields edged higher despite crude prices going the opposite direction, while the dollar was little changed. Copper and bitcoin saw solid gains while gold and US natural gas were lower with the latter at the least since Nov 2024 (all covered in the subscriber section with charts).
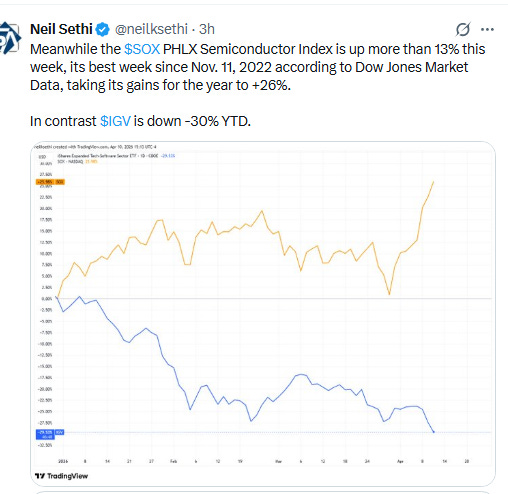
The market-cap weighted S&P 500 (SPX) was -0.1%, the equal weighted S&P 500 index (SPXEW) -0.8%, Nasdaq Composite +0.4% (and the top 100 Nasdaq stocks (NDX) +0.1%, the SOXX semiconductor index +2.3% (up over 20% the last seven sessions to an ATH), and the Russell 2000 (RUT) -0.2%.
Some market commentary:
“If you stayed long though this whole thing, you are good,” said Mark Malek, chief investment officer at Muriel Siebert & Co. “But my fear is that people are coming in here thinking this is the slingshot,” he added. “Something tells me this market is getting ahead of itself.”
“Investors are hoping for fruitful negotiations,” said Guillermo Hernandez Sampere, head of trading at asset manager MPPM. Still, “a swift conclusion will be difficult to achieve, as economic interests prevail on all sides and no one wants to be disadvantaged,” he said.
Stephen Parker, co-head of global investment strategy at J.P. Morgan Private Bank, believes that the relief rally has sustainable legs going forward.
“The size of the drawdown that we’ve seen in equity markets, particularly in the U.S., probably doesn’t feel big enough relative to the move and the shock that we saw in energy markets, but I think that’s reflective of a view that energy prices are likely to come down,” he said on CNBC’s “Closing Bell: Overtime” on Thursday afternoon.
“Our base case is one where energy prices continue to gradually move lower over the next three to six months,” he added. “We take a little bit of a hit to growth, a little bit of a pickup in inflation, but overall, that’s still a very constructive environment for equities, particularly as we get into earnings season, which we think will be really positive.”
“There are no signs, yet, that high energy prices are seeping into core inflation,” said Brian Jacobsen at Annex Wealth Management. “That could be a process that plays out over time as companies absorb the brunt of the blow, at least initially.”
Alexandra Wilson-Elizondo, global co-CIO of multi-asset solutions at Goldman Sachs Asset Management “The market was braced for a hot print, so today’s inline number is a slight relief,” she said. Upcoming reports might not be so encouraging for investors and the Federal Reserve.“However, it may be the best headline inflation number we see for a while as it may only partially capture the full force of the Iran conflict, which sent U.S. crude and U.S. gas up 70% at peak,” Wilson-Elizondo said. “The Fed has room to be patient, and every reason to do so. Today’s number buys the Fed time, but the real test lies ahead,” she added later.
Vail Hartman at BMO Capital Markets believes the latest inflation data offers only partial reassurance for policymakers. “Overall, the Fed can take some solace in the tameness of core and supercore inflation despite the sharp increase in headline CPI. That being said, if the shock to energy prices turns out to be more persistent, then we’re likely to see some upward pressure on core prices in future CPI reports,” he said in a note. Hartman warns that if the recent oil price shock persists, it could begin to filter through more broadly into the economy, putting upward pressure on core inflation in coming months.
“The Fed will do everything in its power to look past whatever data points it gets for March and April,” said Tim Holland, chief investment officer at Orion. That’s assuming “there is an off-ramp between the U.S., Israel and Iran,” he added. While Holland does believe the Iran war will “wind down” from here — and that oil prices will reset, by extension — he cautioned that investors should get more concerned about its inflationary impacts if the price of WTI crude is still trading around $100 a barrel by early to mid-June. “You’ve got this potential toxic cocktail of already depressed consumer sentiment and a real re-rating of inflation expectations higher,” he said. “That’s just that’s going to be a tough spot for the economy and put the Fed in a bit of a pickle.”
Some posts from today:
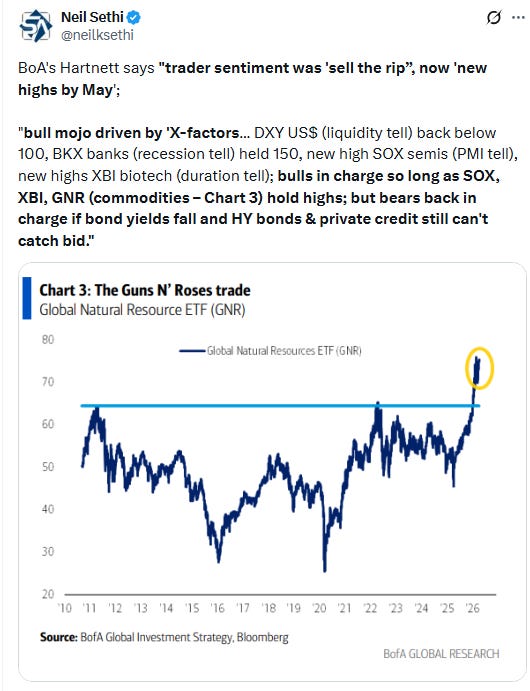
BoA’s Hartnett says traders are looking for more gains, he says watch the “X-factors”
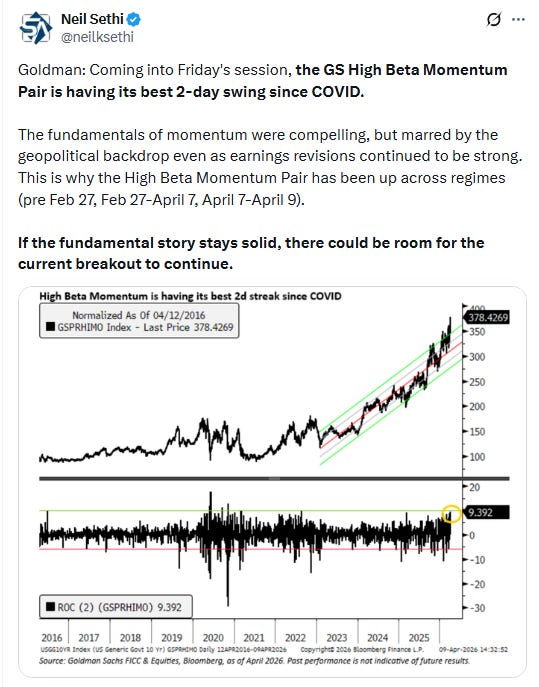
Goldman sees potential for momentum to continue its gains:
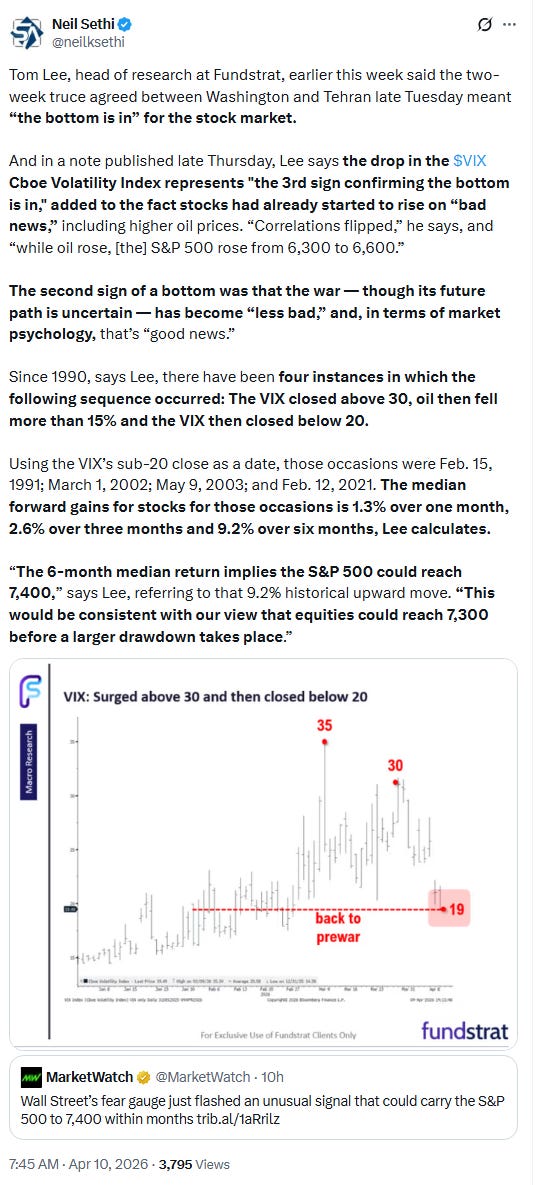
Tom Lee is unsurprisingly bullish:
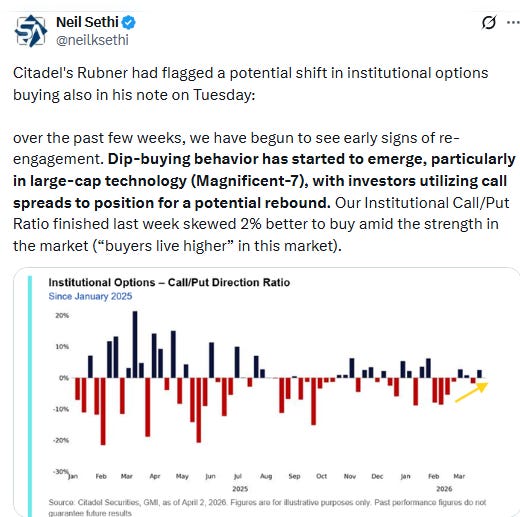
Citadel’s Rubner sees a potential shift in institutions turning more bullish:
Link to X posts - Neil Sethi (@neilksethi) / X for full posts/access to charts.
In individual stock action:
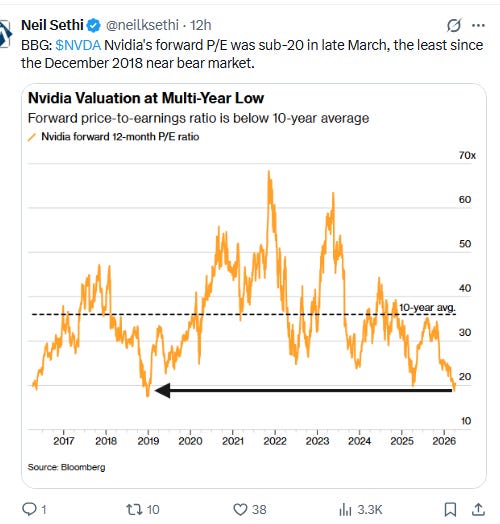
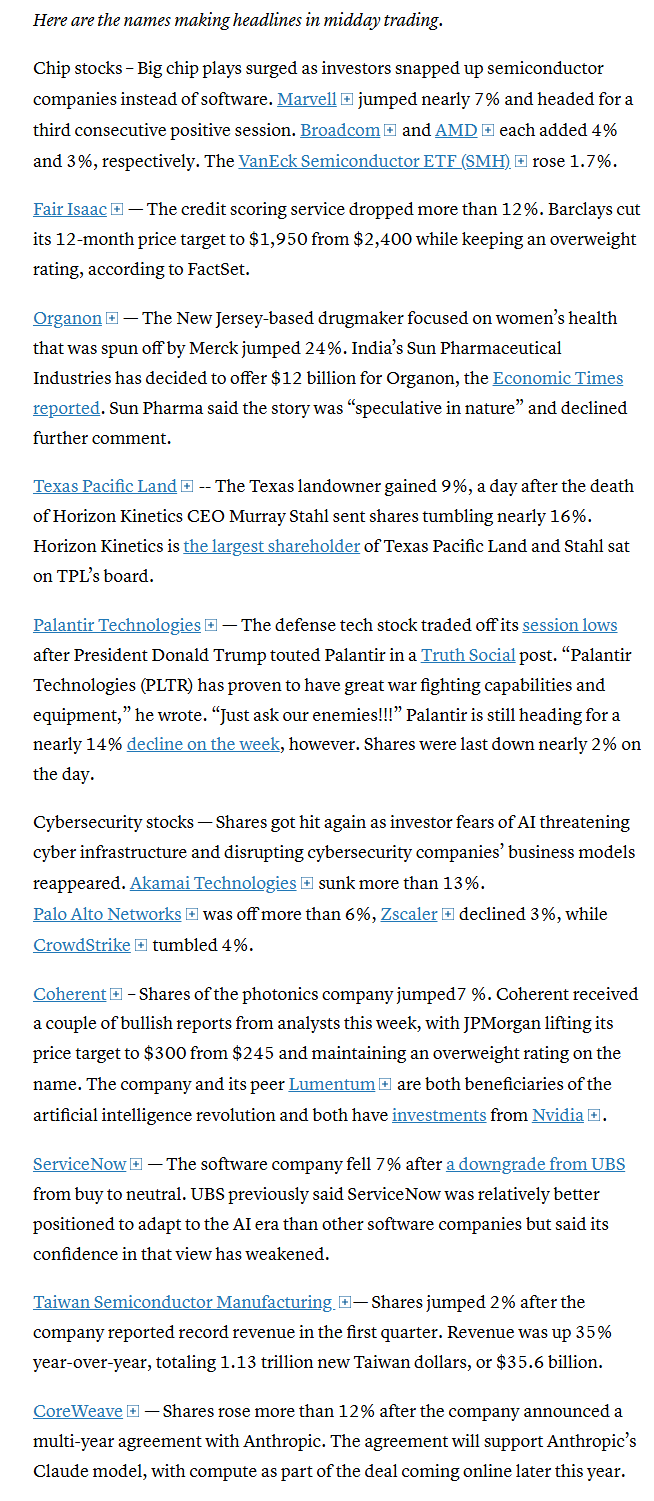
Semiconductor stocks put together another strong showing with solid gains across large chipmakers such as Advanced Micro Devices (AMD 245.04, +8.40, +3.55%) and NVIDIA (NVDA 188.74, +4.84, +2.63%). Super Micro Computer (SMCI 25.26, +2.04, +8.79%) and Coherent (COHR 307.50, +23.33, +8.21%) captured even wider gains, and the PHLX Semiconductor Index finished 2.3% higher.
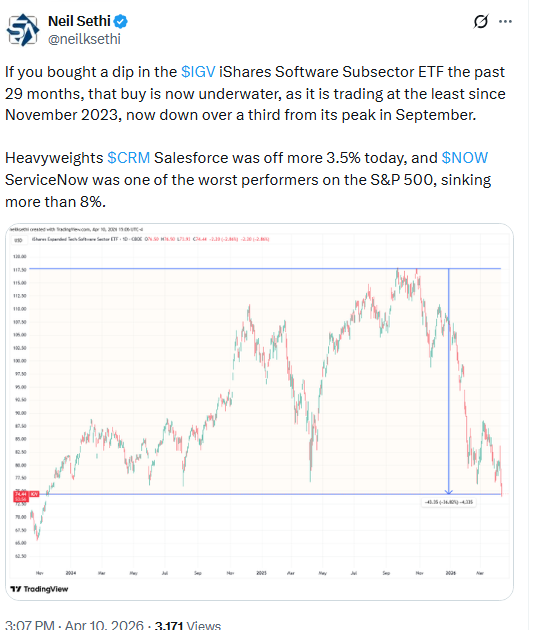
Though not a component of the S&P 500, CoreWeave (CRWV 102.00, +10.00, +10.87%) posted another double-digit gain after announcing a multi-year agreement with Anthropic to support the development and training of its Claude family of AI models. Conversely, Anthropic’s launch of its Managed Agents platform weighed heavily on Akamai Tech (AKAM 91.35, -18.26, -16.66%) amid intensifying fears around AI-driven disruption of traditional SaaS and cloud workflows. The broader software space lagged again today, with the iShares GS Software ETF finishing 2.6% lower.
Elsewhere, solid gains in Amazon (AMZN 238.38, +4.73, +2.02%) and Tesla (TSLA 349.00, +3.38, +0.98%) helped the consumer discretionary sector (+0.6%) finish near the top of the leaderboard. The Vanguard Mega Cap Growth ETF finished 0.4% higher, contributing to the outperformance of the market-weighted S&P 500 (-0.1%) relative to the S&P 500 Equal Weighted Index (-0.8%).
The materials (+0.6%) and real estate (+0.2%) sectors also captured gains, while the other seven S&P 500 sectors finished lower including the financials sector (-1.1%), but major banking names such as Goldman Sachs (GS 907.80, +4.08, +0.45%) and Citigroup (C 124.36, -0.56, -0.45%) were among the more resilient components ahead of their earnings releases next week.
BBG notes that NVDA’s forward P/E has rarely been this low:
Corporate news from BBG:
Treasury Secretary Scott Bessent and Federal Reserve Chair Jerome Powell summoned Wall Street leaders to an urgent meeting on concerns that the latest artificial intelligence model from Anthropic PBC will usher in an era of greater cyber risk.
Anthropic agreed to tap data center capacity from CoreWeave Inc. as part of efforts to handle increasing demand for its artificial intelligence services.
Ares Management Corp. is planning a significantly smaller flagship US direct lending fund than its previous record-breaking vehicle of $33.6 billion to speed up the deployment of capital amid broader dislocations in private markets.
Berkshire Hathaway Inc. sold ¥272.3 billion ($1.7 billion) of yen-denominated bonds, marking its first such deal since Warren Buffett stepped down as chief executive officer.
US regulators denied Replimune Group Inc.’s skin cancer treatment for a second time, a sign that they are maintaining their tough stance on drug reviews.
Mid-day movers from CNBC:
In US economic data:
A jump in energy prices saw the largest m/m increase in headline CPI since June 2022 on the back of a record increase in gasoline prices, but core (ex-food & energy) remained more subdued. Y/Y real weekly earnings through saw the smallest increase since April 2024.
Consumer sentiment continued to deteriorate into early April hitting a record low as 1-yr inflation expectations jumped, but long-run expectations were more contained.
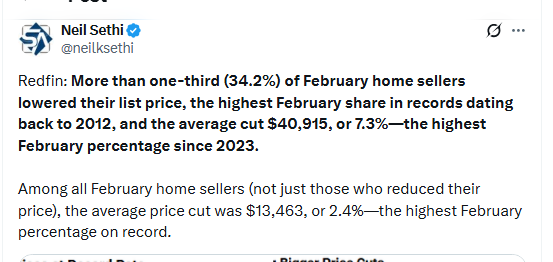
Redfin says they’re seeing more and larger cuts to home prices:
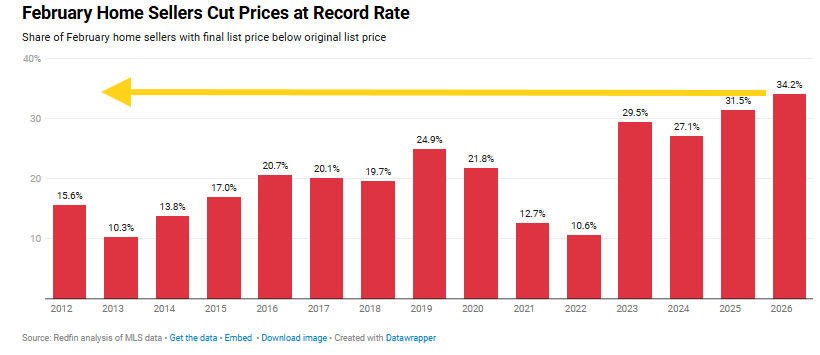
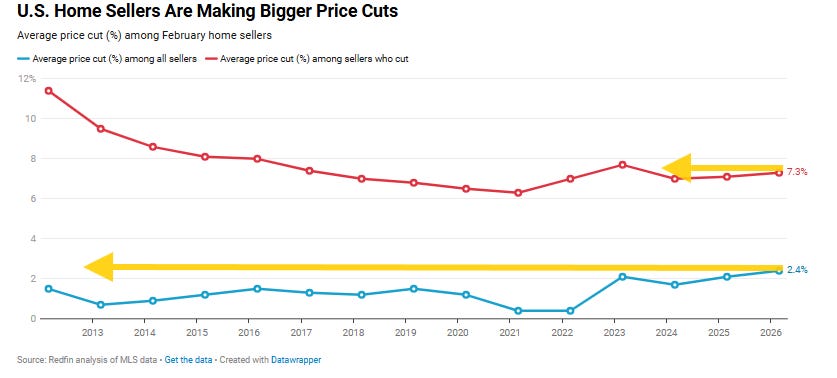
Link to posts for more details/access to charts - Neil Sethi (@neilksethi) / X
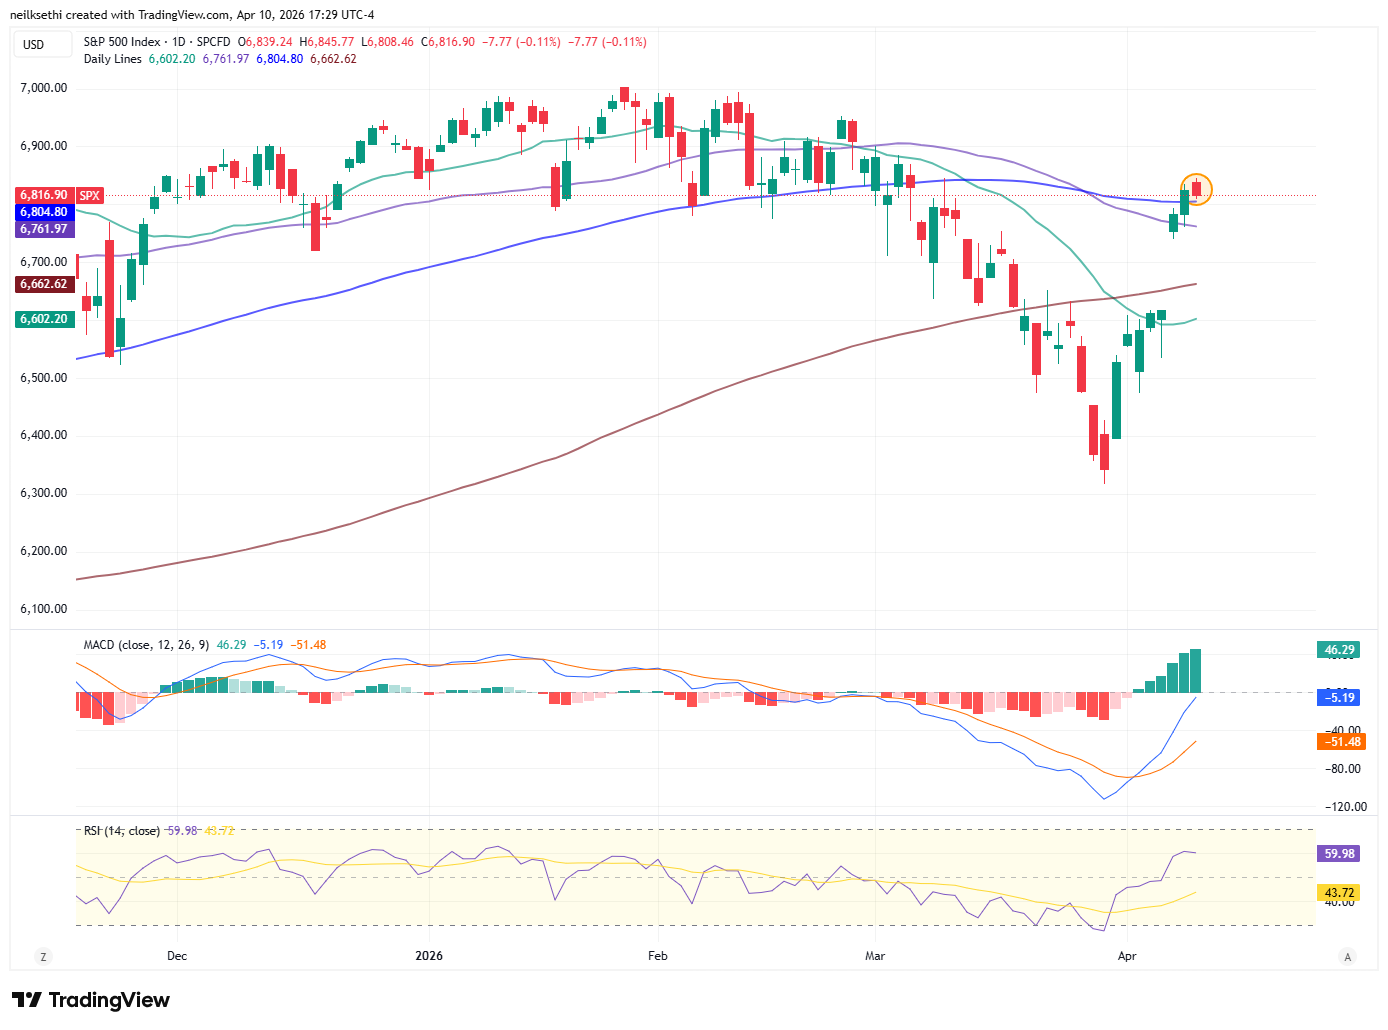
Note on all charts the lines are moving averages (the average price over various lookback periods (days on the daily charts, weeks on the weekly charts, etc.))”
20 = green
50 = purple
100 day = blue
200 day = brownMACD = Moving average convergence/divergence line, a measure of a momentum that compares longer term and shorter term momentum to gauge if a move is strengthening or weakening,
RSI = Relative Strength Index (basically what it sounds like) = measures the strength of the move comparing gains to losses over the given lookback window (I use the standard 14-periods)
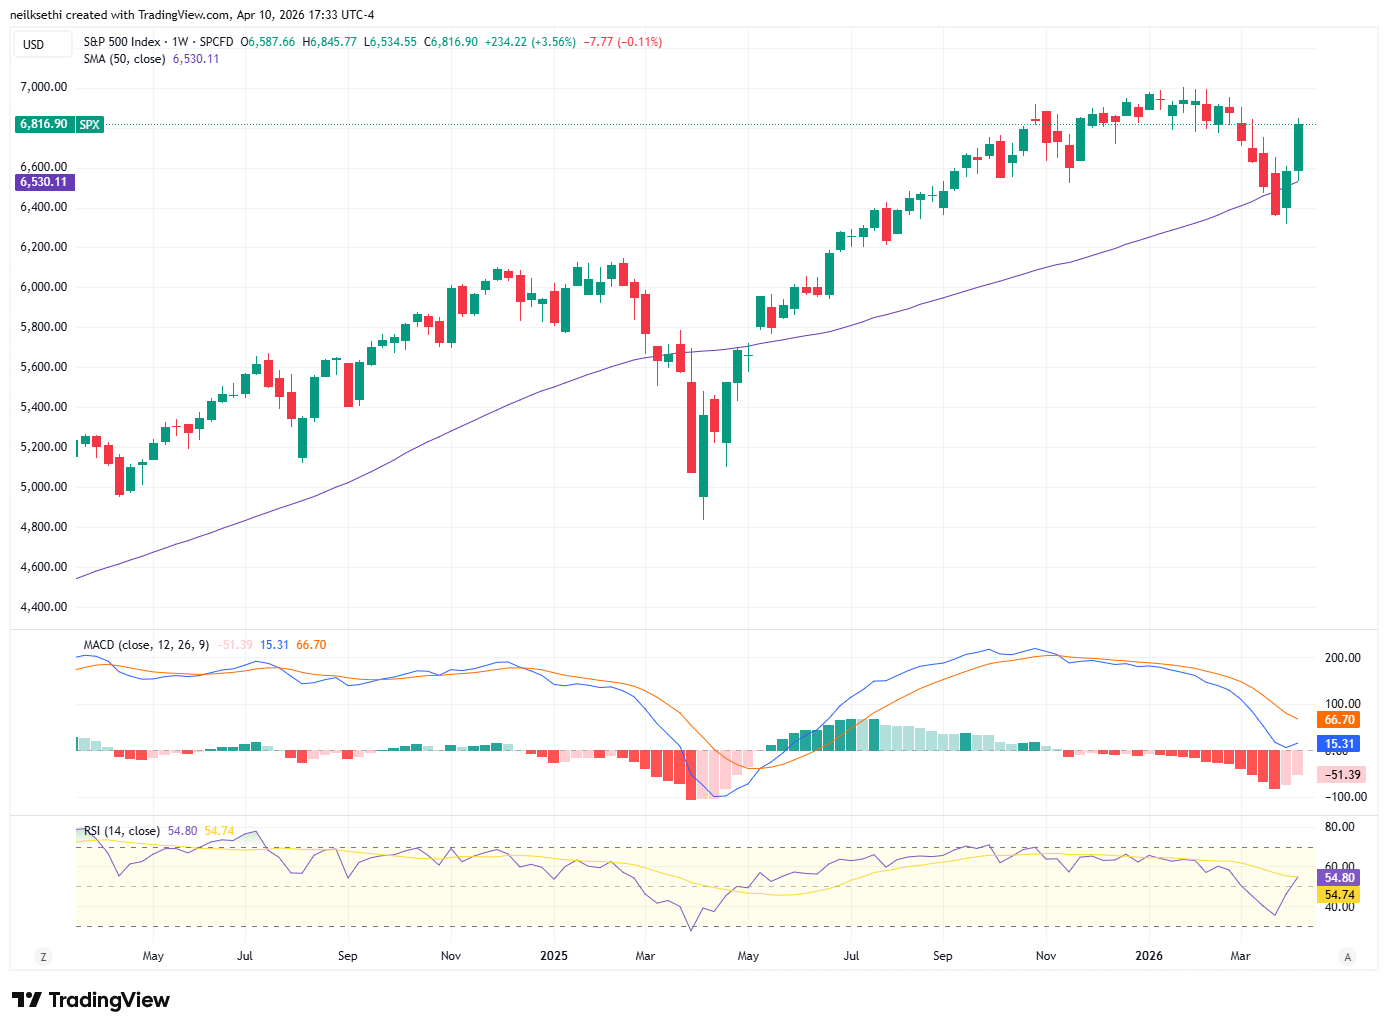
SPX broke its 7 session winning streak, not through its 100-DMA and also stayed above the 6800 level flagged Tuesday. As noted Thursday if it were to break under that level though I would trim what I added. Daily MACD and RSI remain strongly positive.
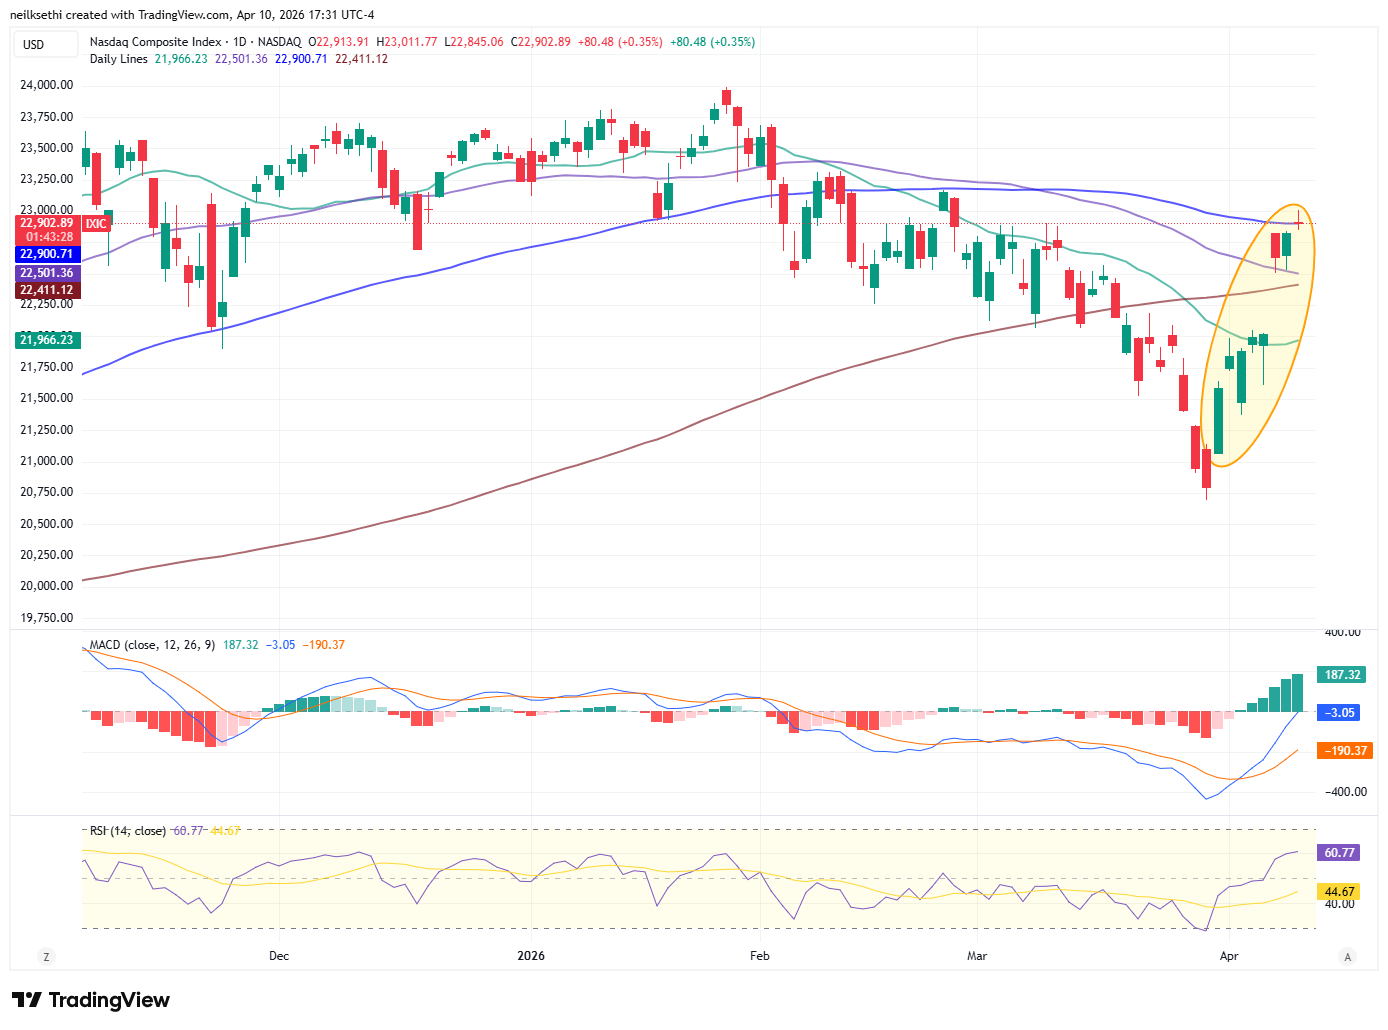
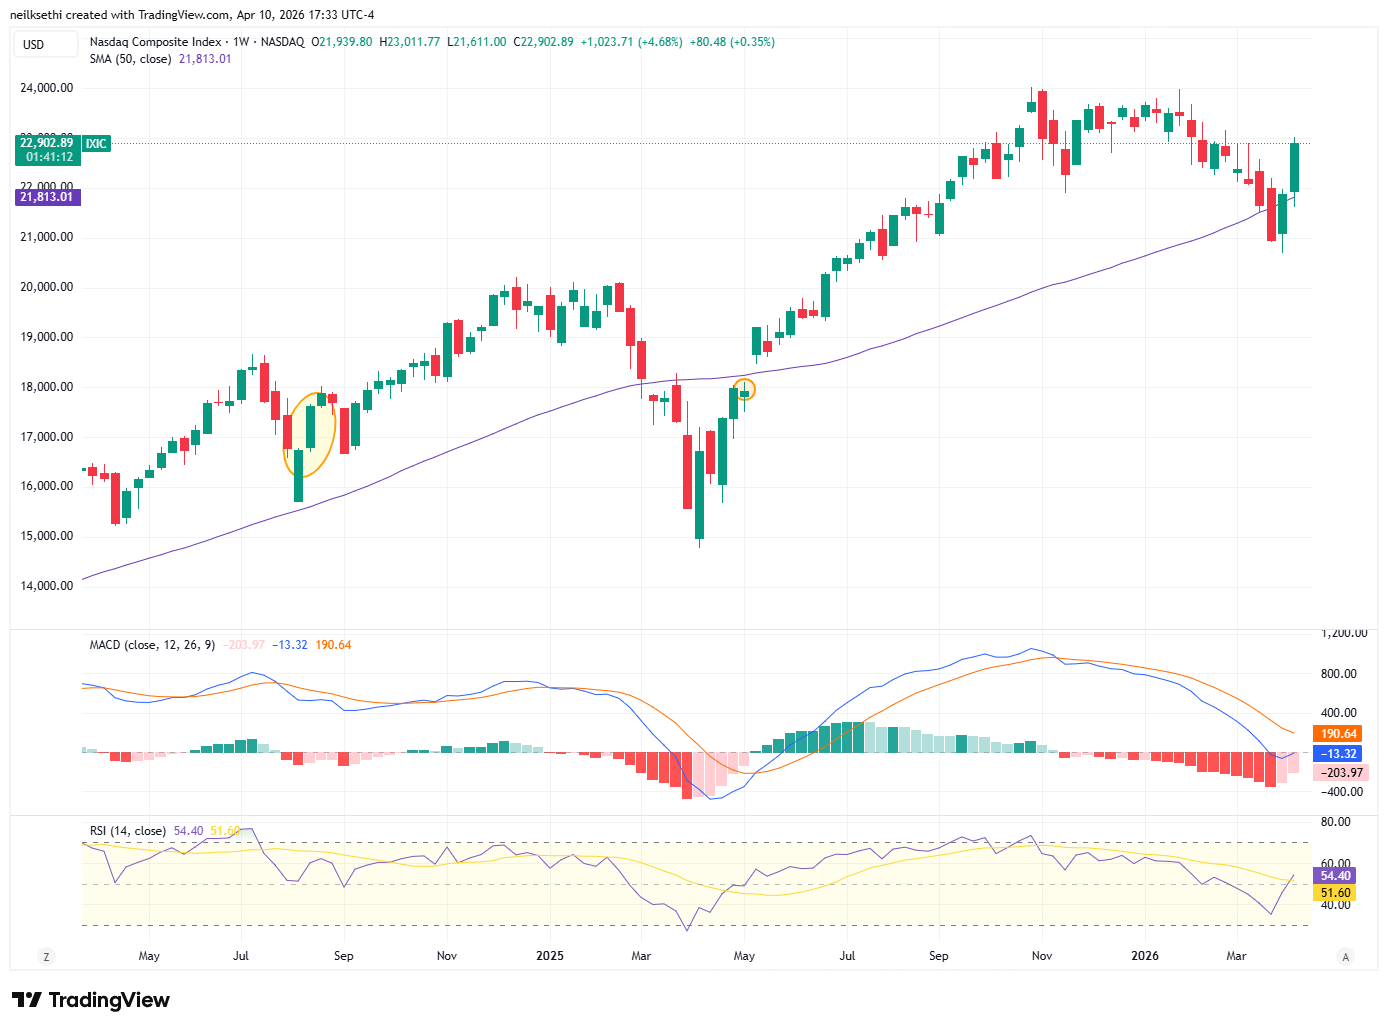
The Nasdaq Composite did get its 8th strait session which took it over its 100-DMA but not quite the 23,000 level noted Wed, so not yet pulling the trigger there.
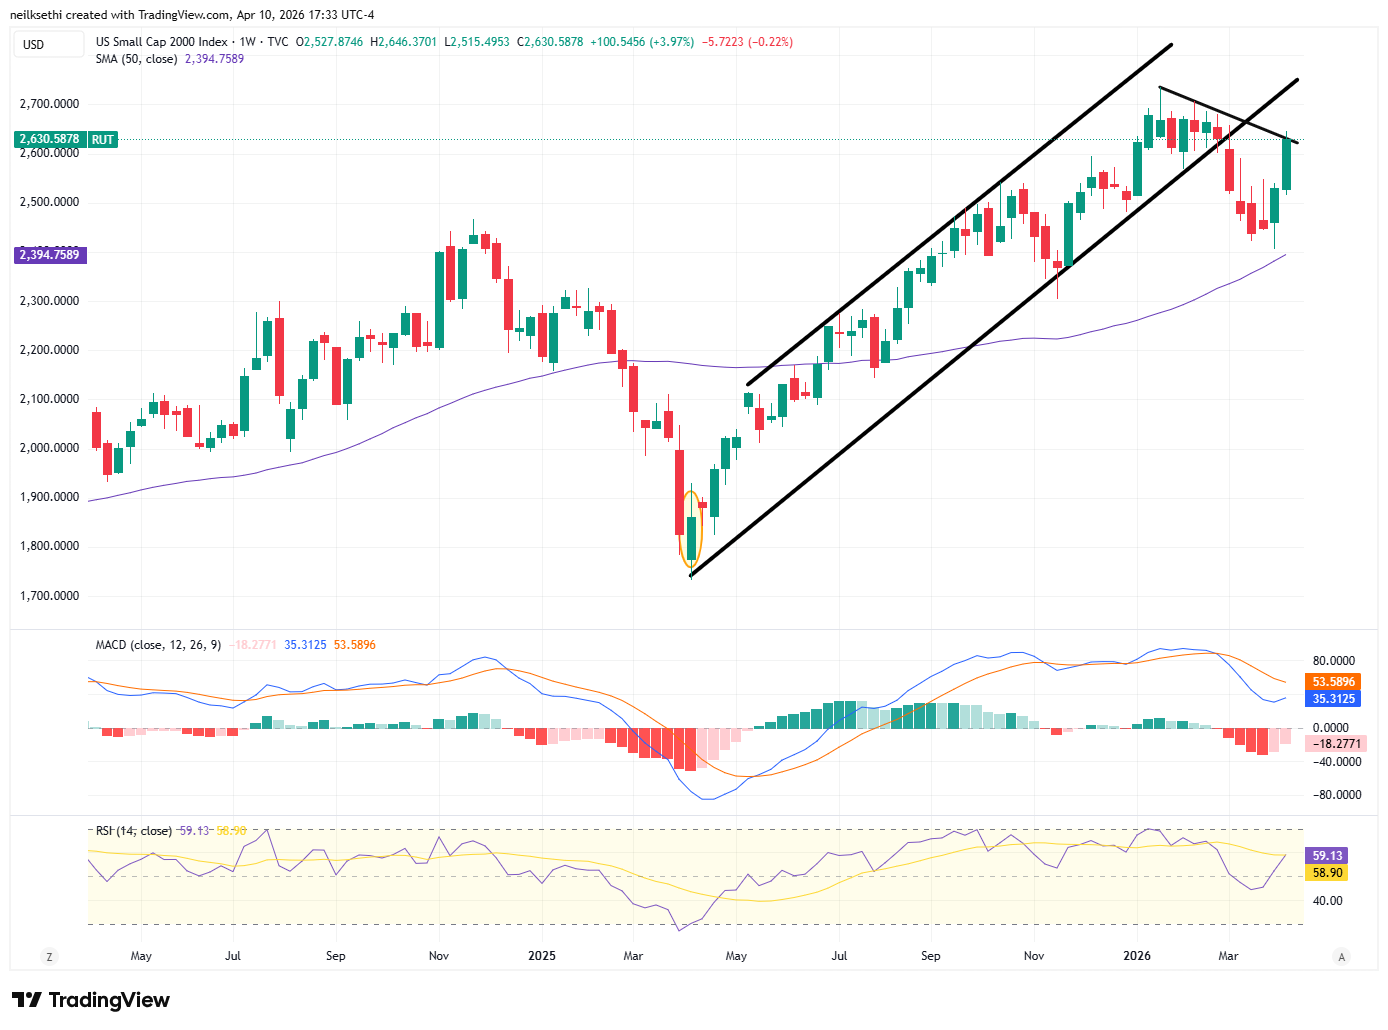
RUT (Russell 2000) I have described the past few weeks as “easily the best looking chart of the three,” and one that as I mentioned Wednesday “I should have bought when it broke over its downtrend line, but I didn’t want the headline risk pre-ceasefire (as fragile as it remains).” As noted then, “now through all of the major moving averages but getting stopped at one last trendline (from the all-time highs) that it needs to clear.” It seems to be moving through it now.
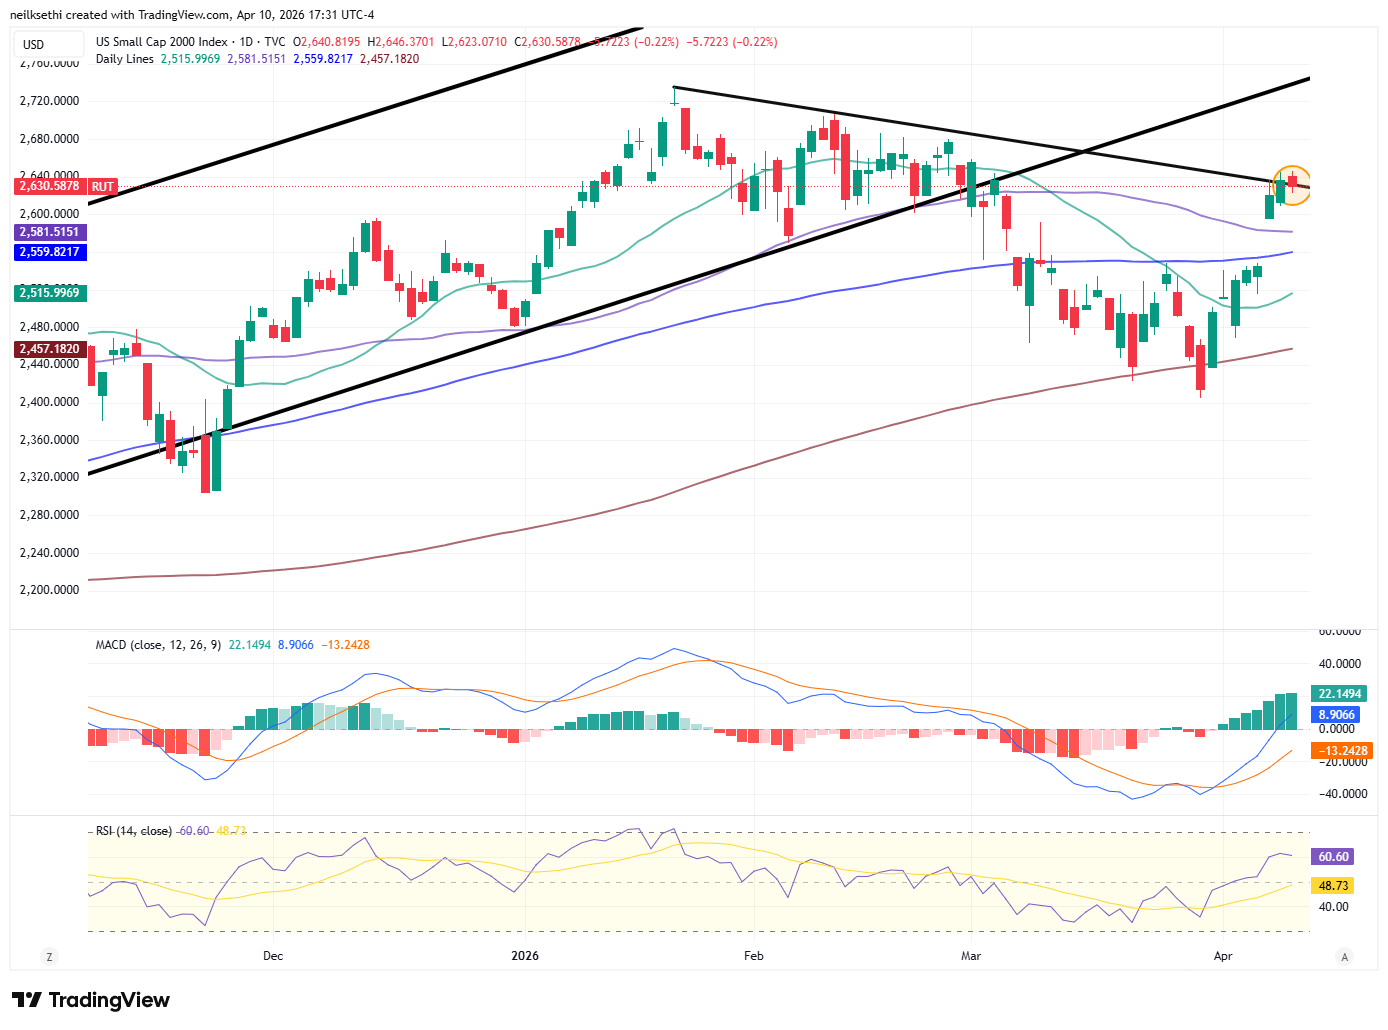
Weekly charts look much better now although the MACD hasn’t yet confirmed the uptrend.
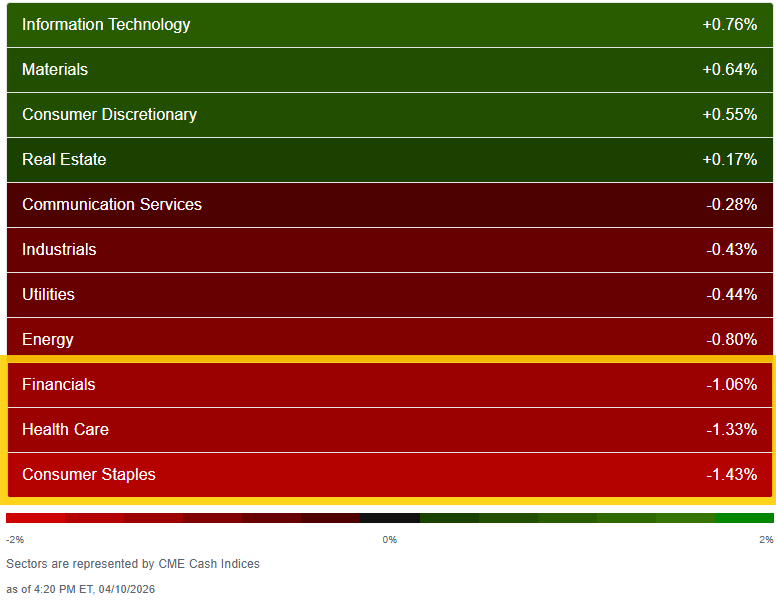
Sector breadth fell below six green sectors for the first time since March 27th with just 4 of 11 sectors higher and no sectors up over 1% led by Tech +0.8%. In contrast four sectors down more than Tech was up with three over -1% in Staples, Health Care, and Financials.
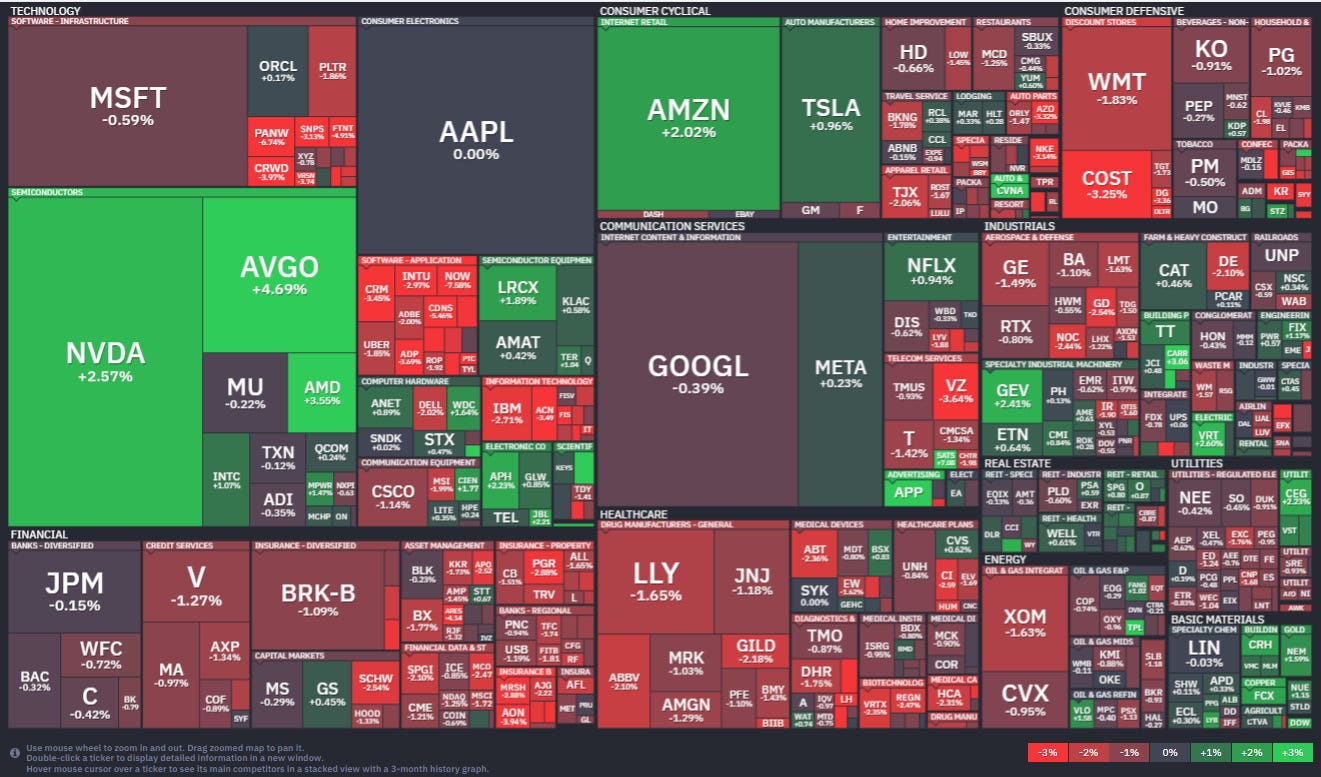
Stock-by-stock SPX flag from finviz_com consistent with the green dialing back and the red increasing further and dominating those sectors down over -1% as well as Utilities. Software also very ugly.
Still there were only around 40 SPX components down more than -3% a relatively subdued number.
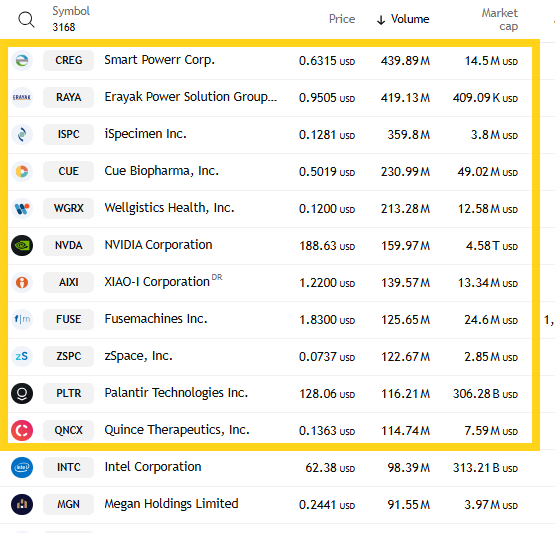
As a side note, speculation remains active on the Nasdaq although not quite at the fever pitch we saw earlier this month. Still there were five stocks on the Nasdaq trading over 200mn shares and another six over 100mn (and another at 98mn).
The CME FedWatch tool continues to be screwy so I am pausing FOMC updates on that until they fix it (and I will likely move this to the Week Ahead unless there’s something really notable).
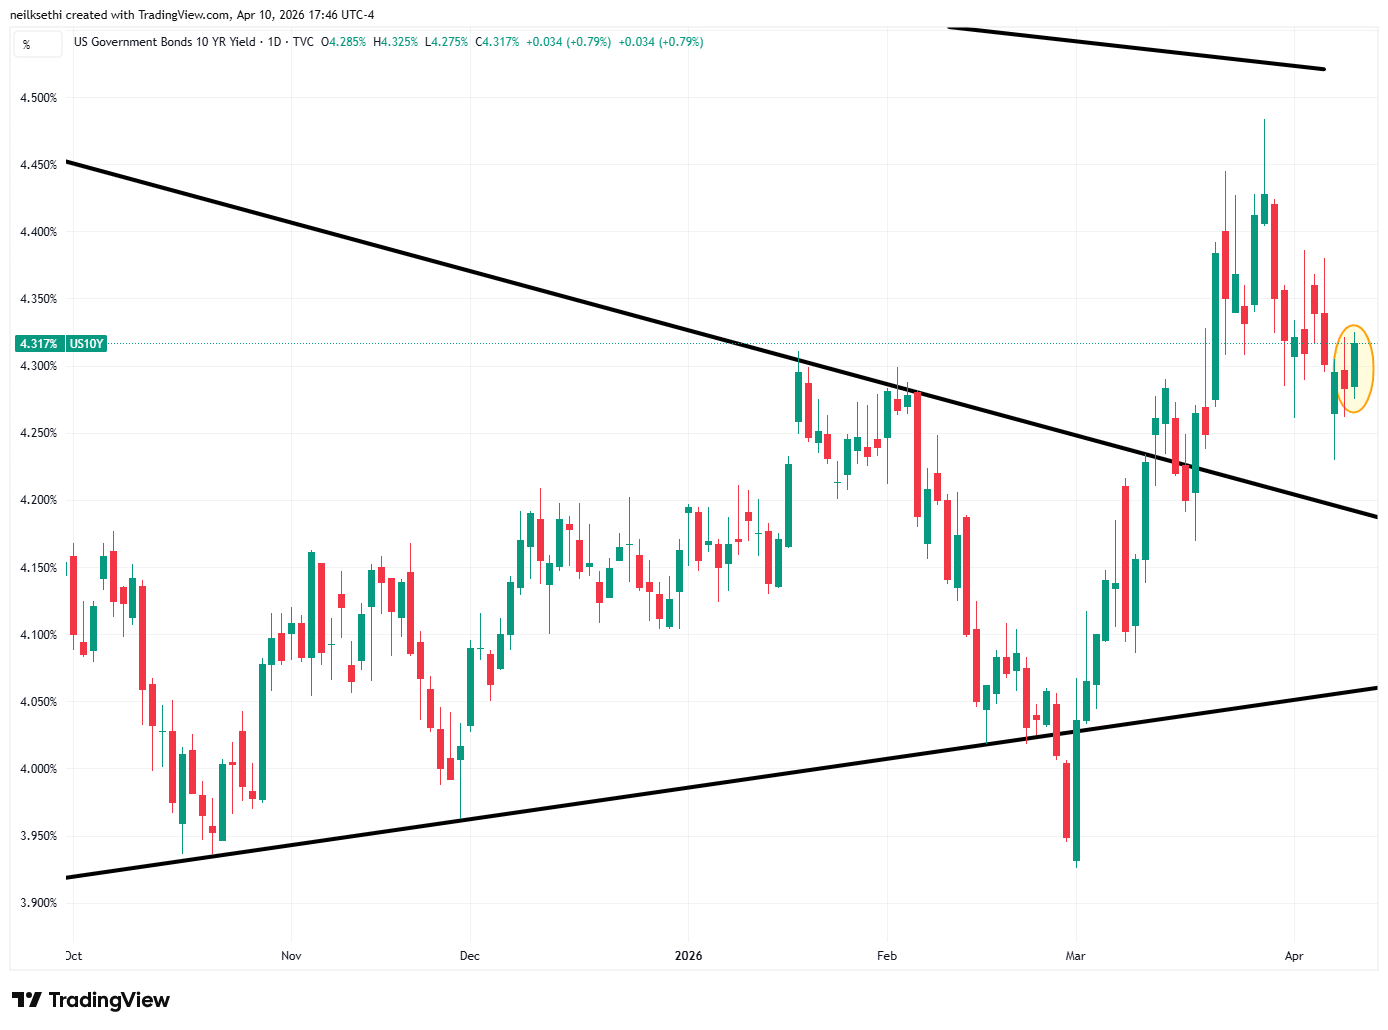
The 10yr UST yield up four basis points to 4.32%, still down -11bps from the highest since July hit at the end of March.
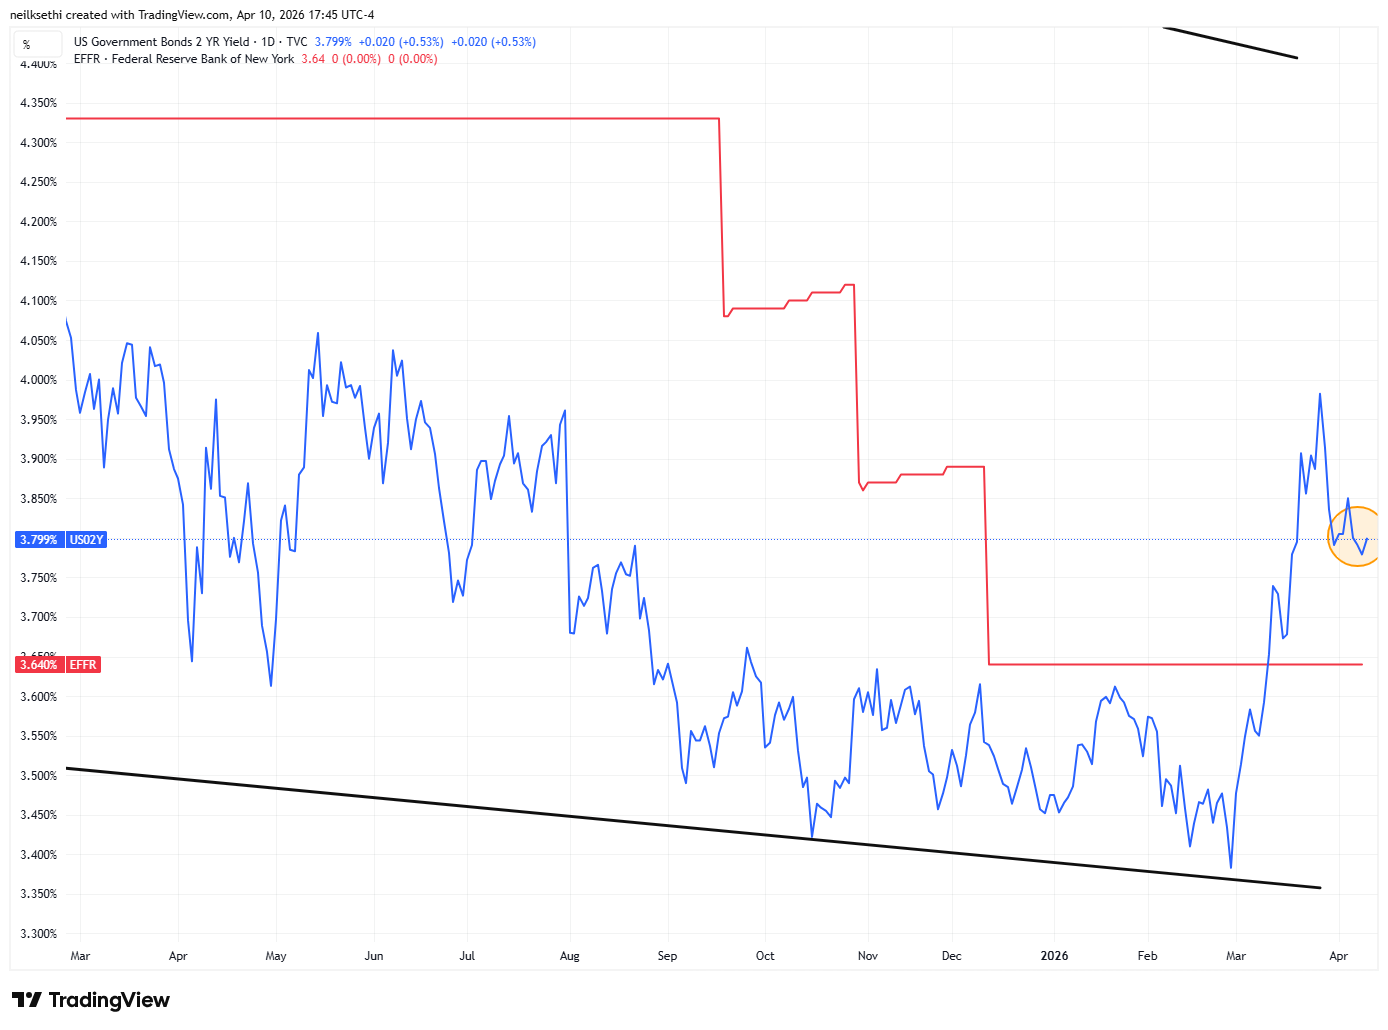
The 2yr yield, more sensitive to FOMC rate cut pricing, also edged up to 3.80% from a three week low, down -6bps on the week but +18bps above the Effective Fed Funds rate (red line), consistent with perhaps one Fed cut over the 2-year window.
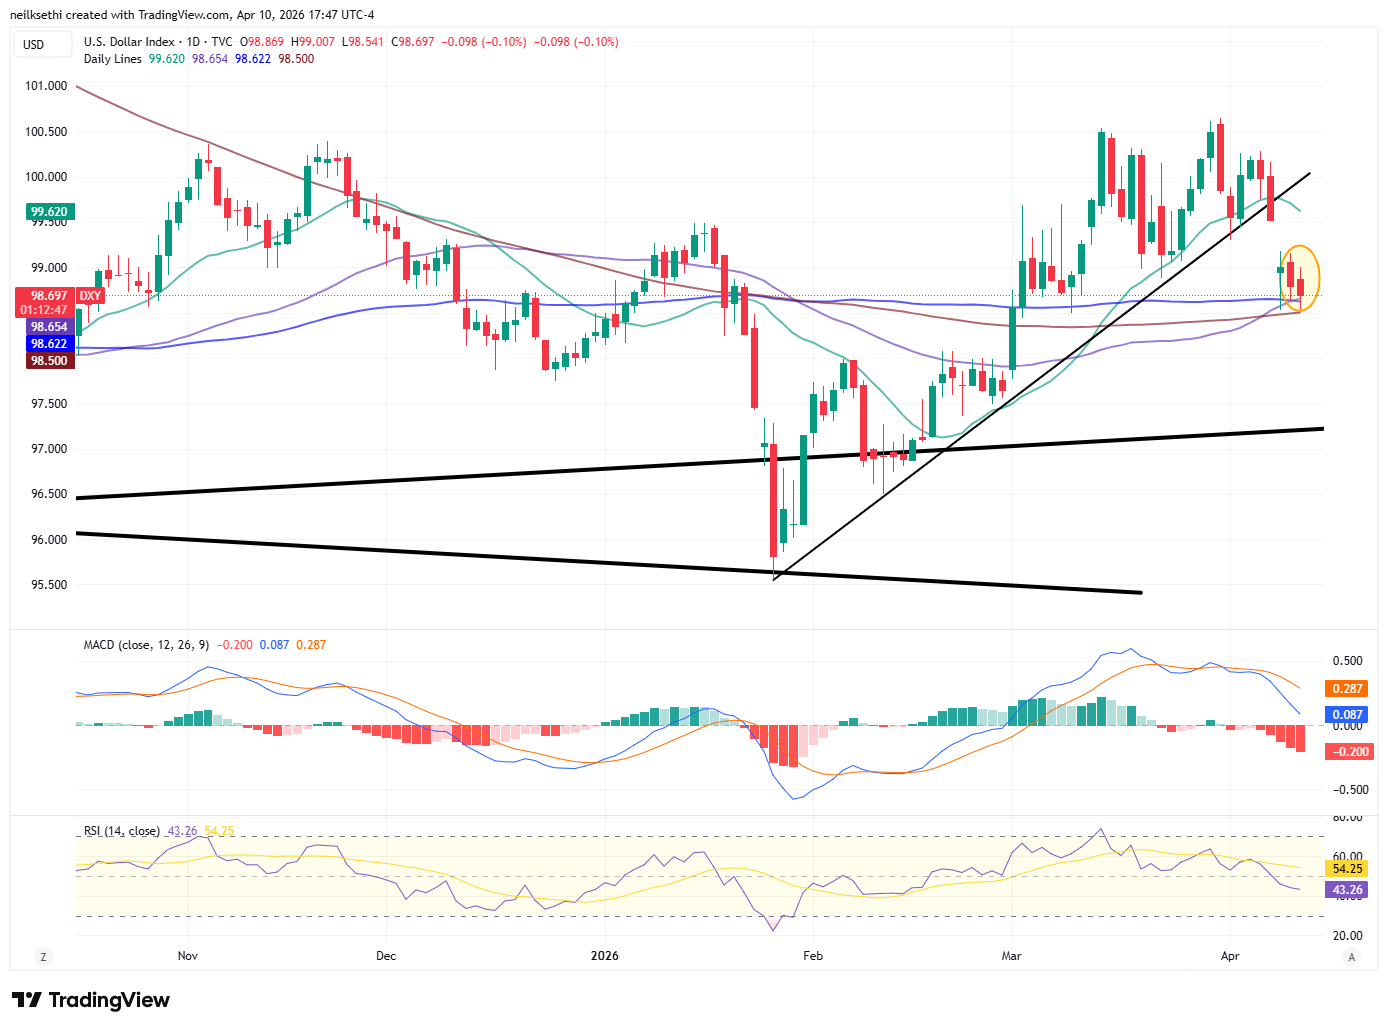
The $DXY dollar index (which as a reminder is very euro heavy (57%) and not trade weighted) again tested the confluence of its 25, 100, and 200-DMAs which again held. As I noted Wed, “it’s now conclusively below the uptrend line from the Jan lows, but I guess as long as it holds the 200-DMA I won’t turn super-bearish. As noted last week, though, the daily MACD is already pointing in that direction and now the RSI is as well.”
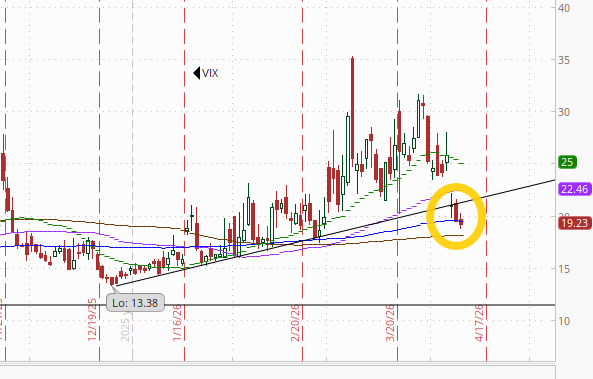
VIX edged a little further below 20 to 19.2. Still a little elevated historically and consistent w/~1.20% average daily moves in the SPX over the next 30 days.
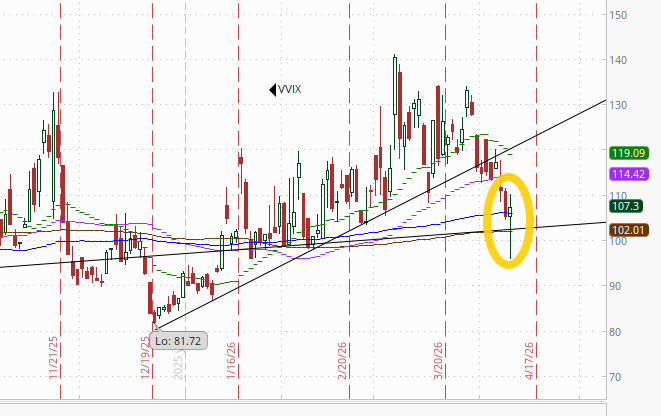
The VVIX (VIX of the VIX) at one point fell to the least since mid-Jan but ended a little higher at 107.2, just off the least since February.
The current level is still consistent with “moderately elevated” daily moves in the VIX over the next 30 days (historically, normal is 80-100, but we’ve been above 90 most of the time since July ‘24)). Above 100 is the level flagged by Charlie McElligott as indicating higher stress.
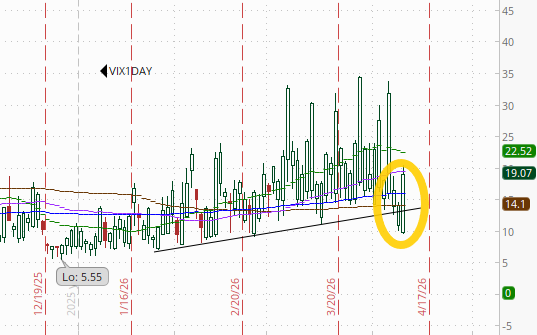
With what promises to be a headlined filled weekend ahead, the 1-day VIX jumped to 19.1, but that’s the lowest week-end read since the Iran conflict began. It’s consistent with a move of 1.19% in the SPX next session.
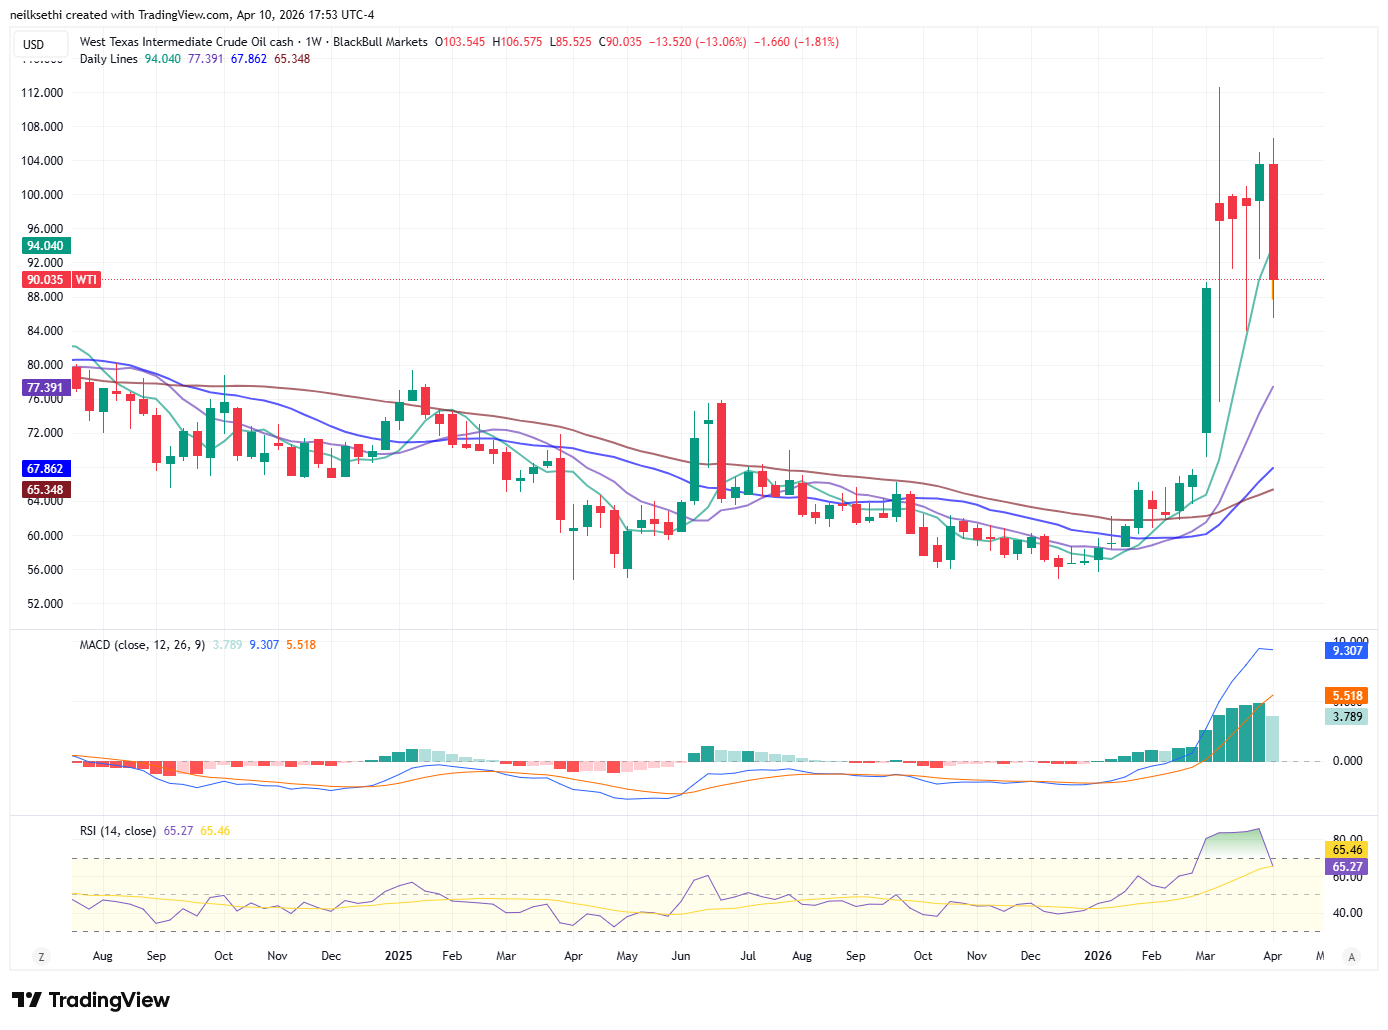
WTI fell back to a 2-week low. As noted Wed, it’s broken its uptrend line and as mentioned a couple of weeks ago the technicals are not favorable. As I said Wed, “its path from here likely depends mostly on whether the ceasefire holds and the Strait of Hormuz reopens.”
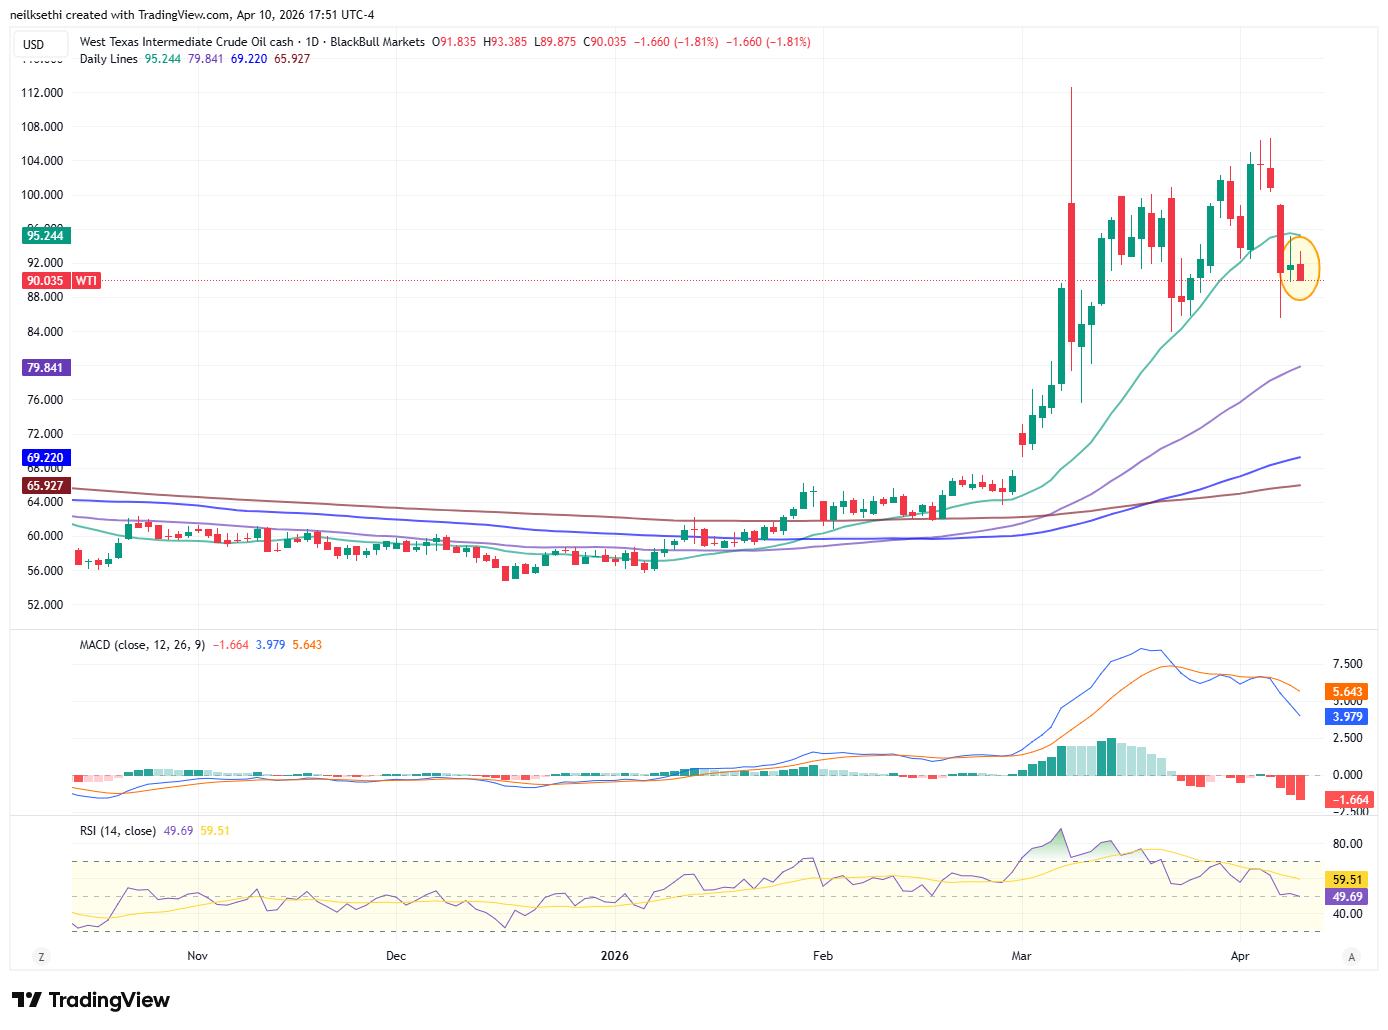
It was the largest weekly drop since 2020.
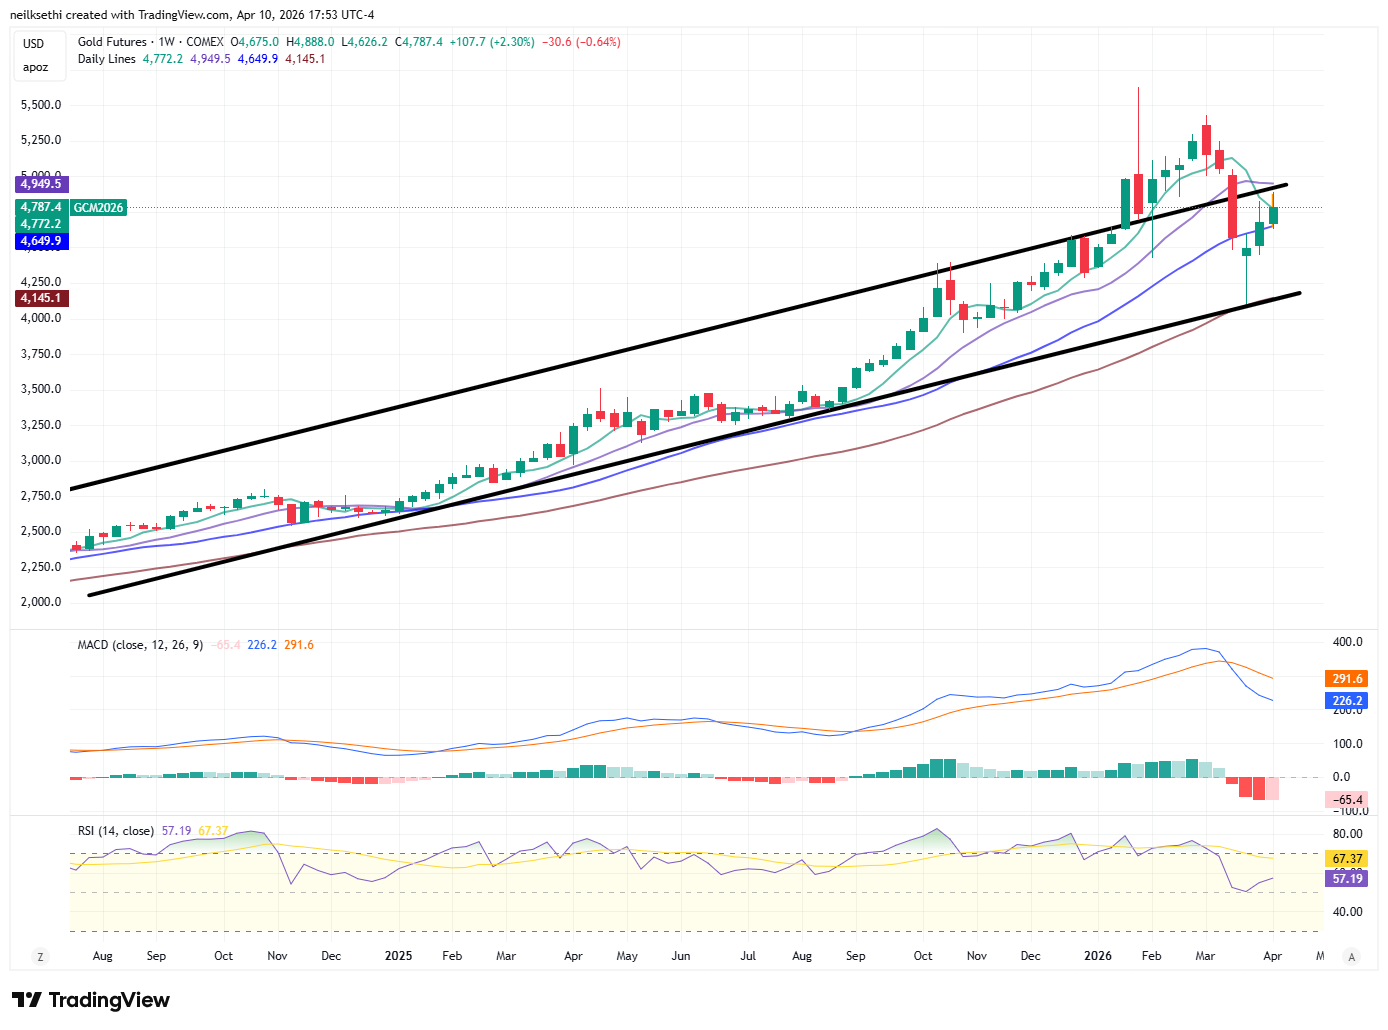
Gold futures (/GC) fell back from a three-week high. For now, they remain in their old channel from early 2024 that they left at the start of 2026 for a couple of months. The technicals are favorable with the MACD in a “cover shorts” reading although the RSI softened back towards 50.
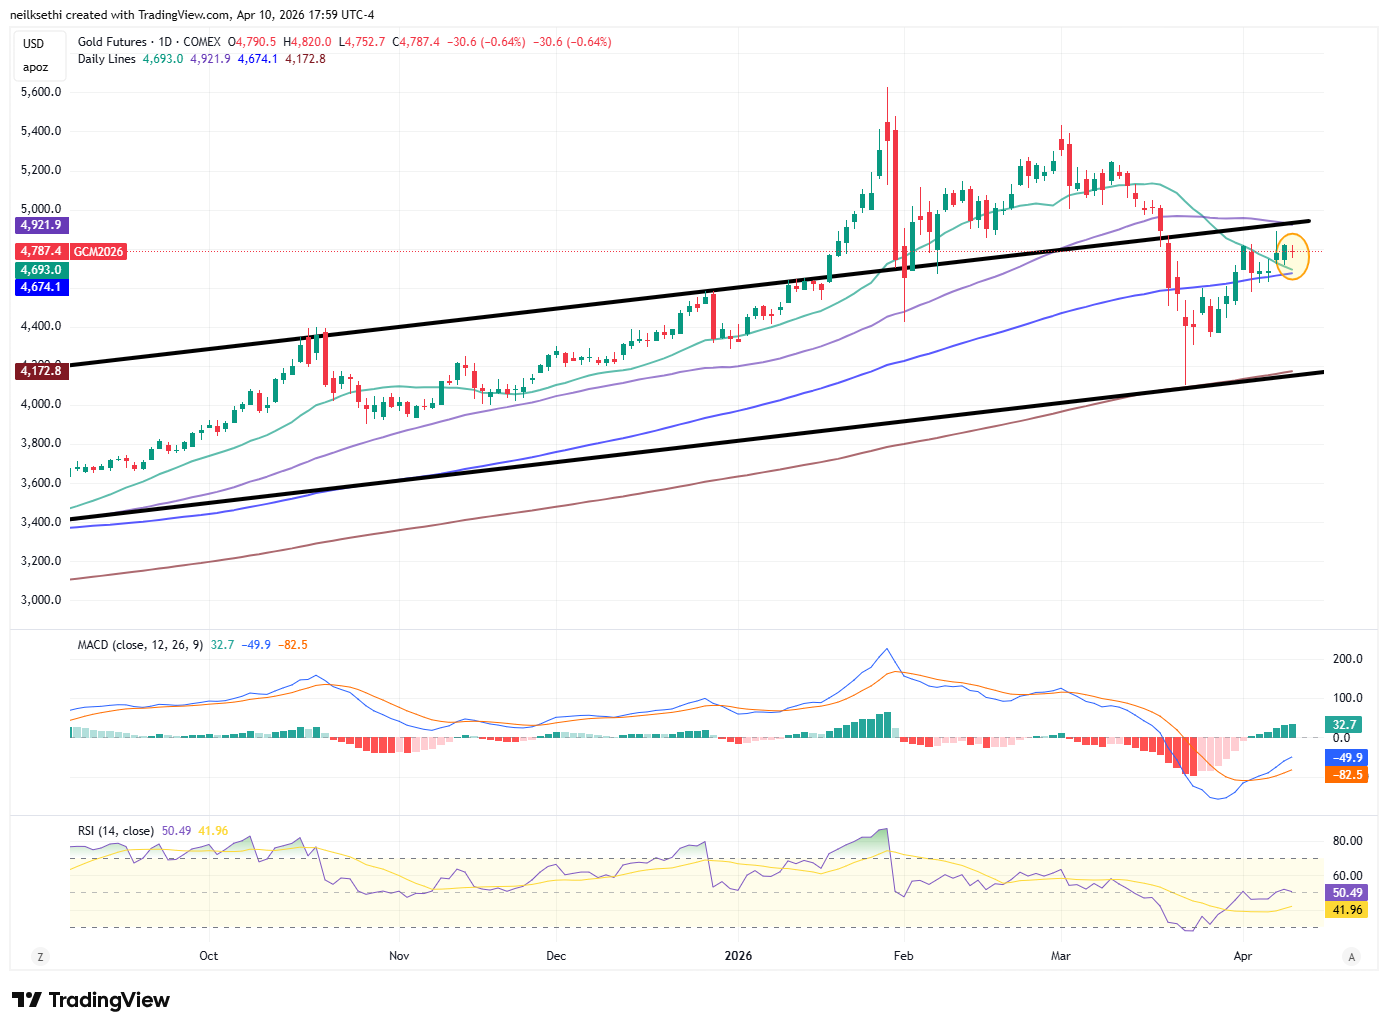
Up for a third week.
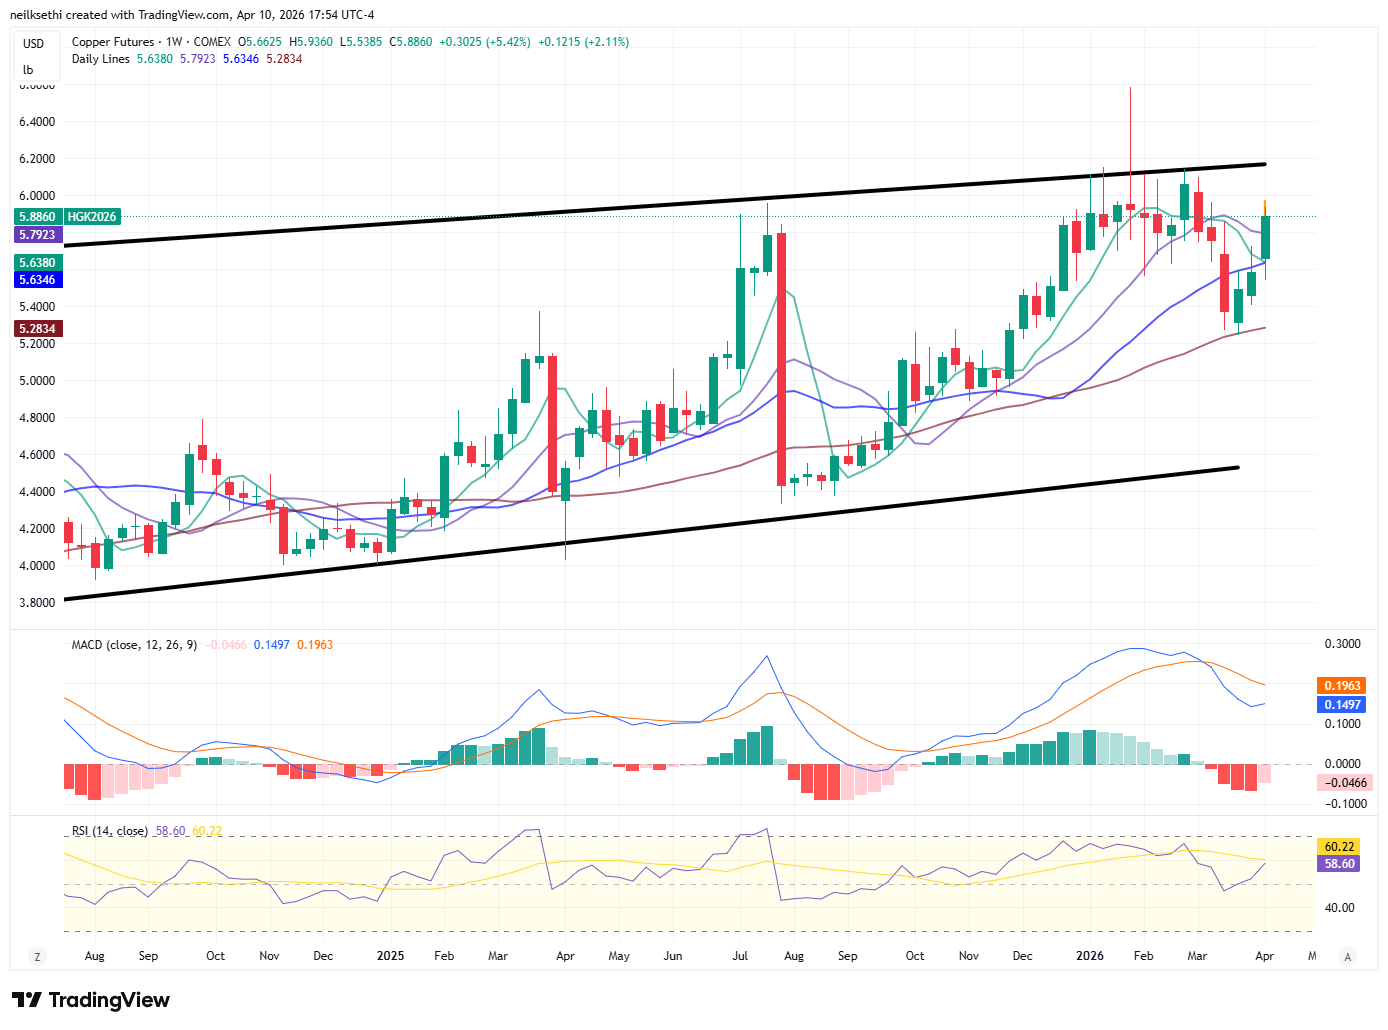
US copper futures (/HG) up again to a 1-month high now above all its key moving averages. Like gold, the daily MACD is in a “cover shorts” positioning, but the RSI is a little stronger so does it make a run to that upper trendline again?.
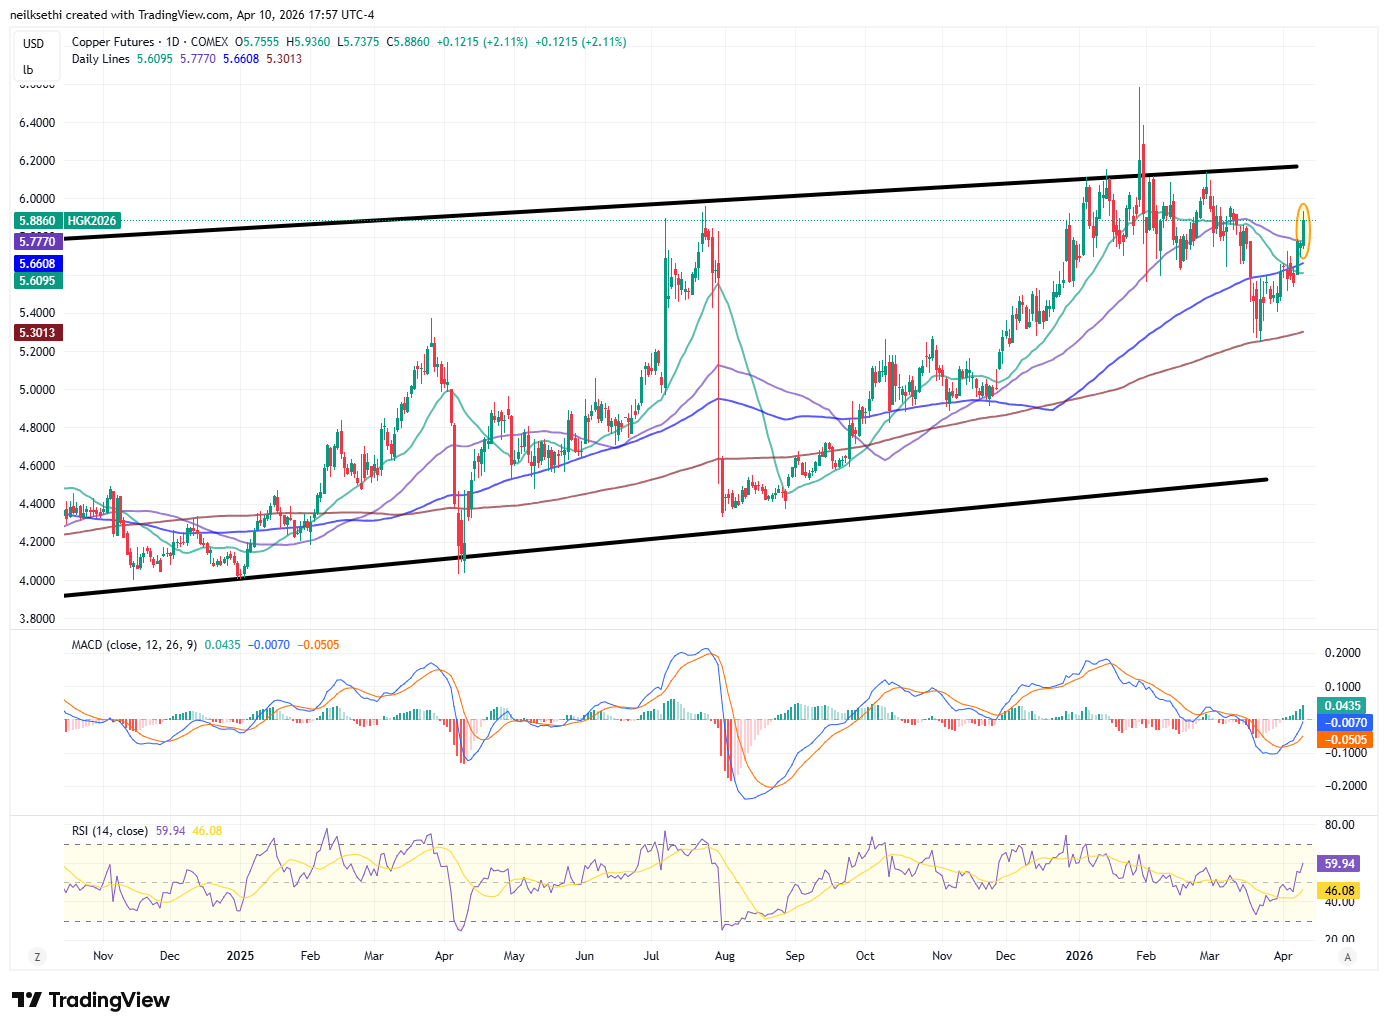
Also higher for a third week.
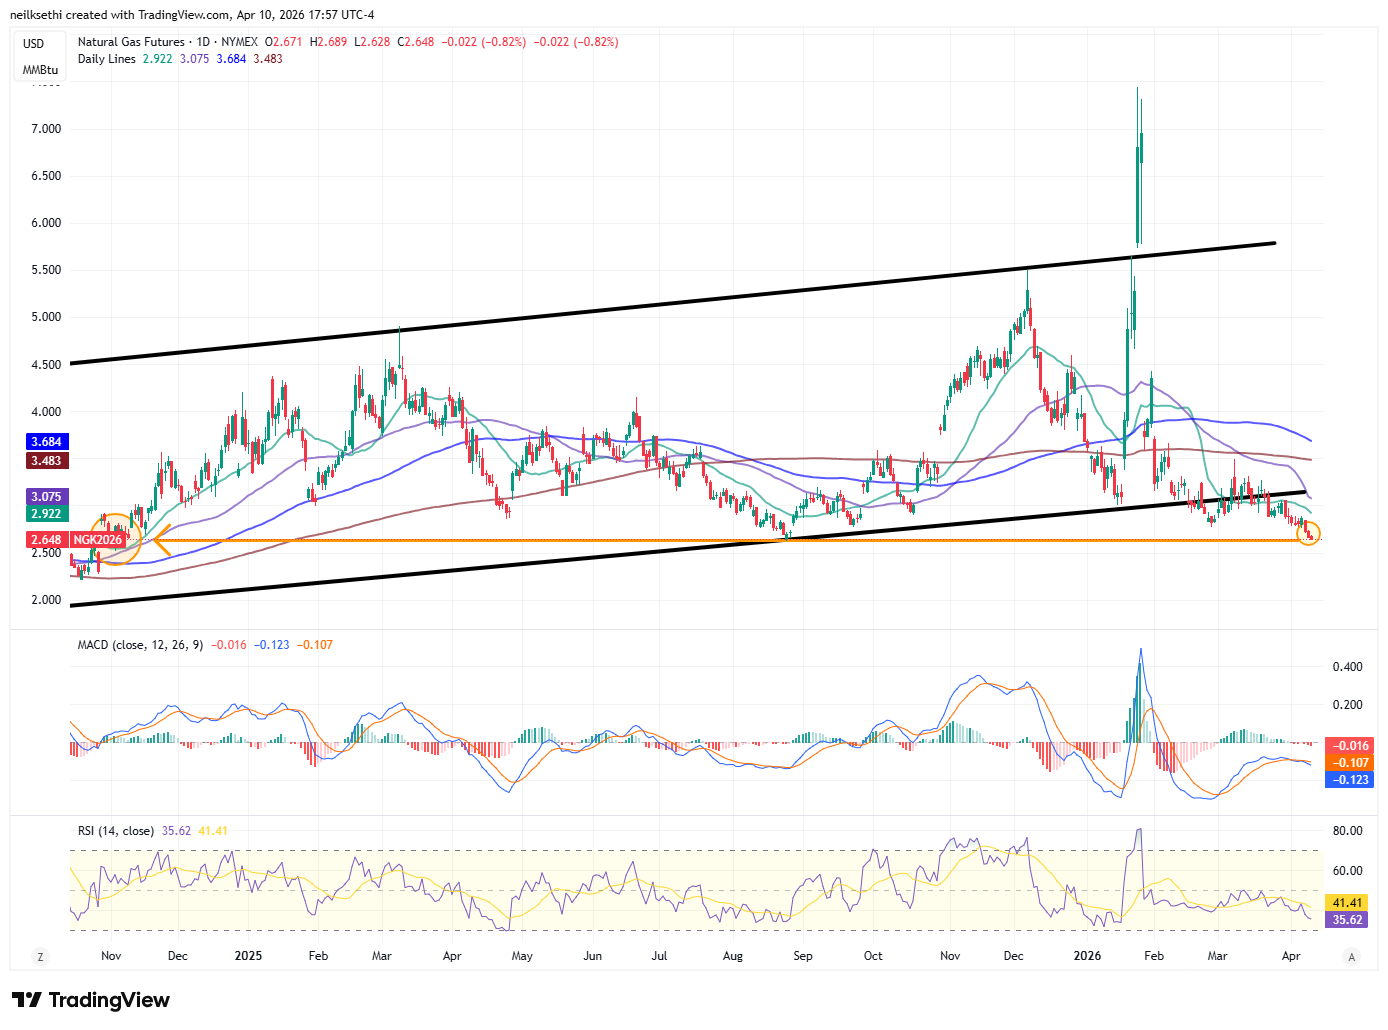
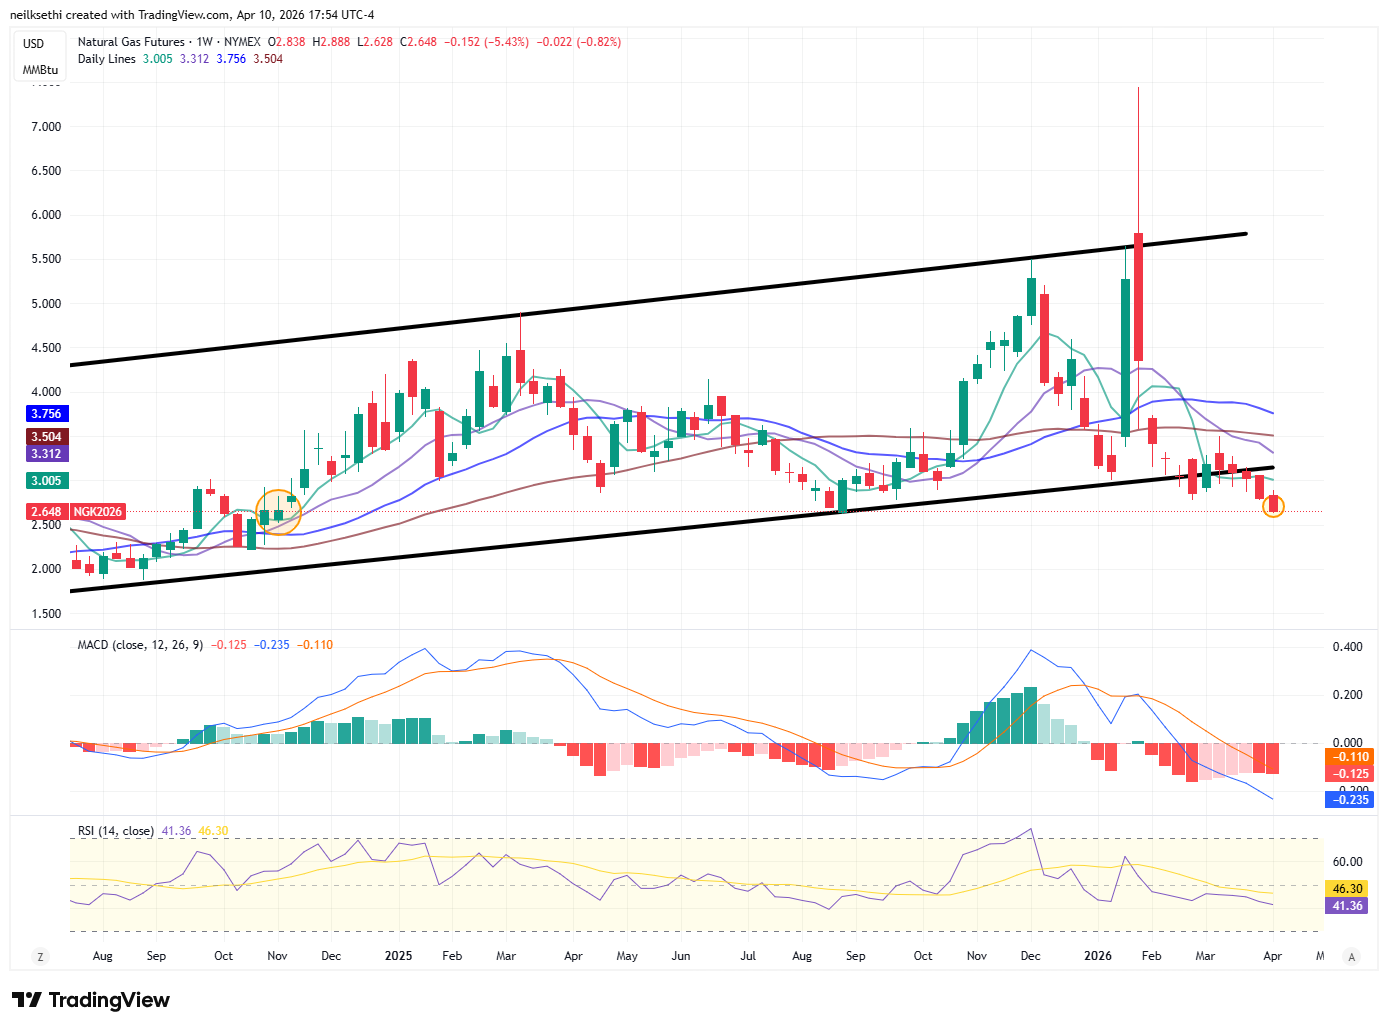
US natural gas futures (/NG) fell to the least since Nov 2024. The daily MACD is into a “go short” reading, and the RSI is under 40, so as I said last week “not much to get excited about, particularly with winter in the rear-view mirror.”
Weekly chart doesn’t look any better.
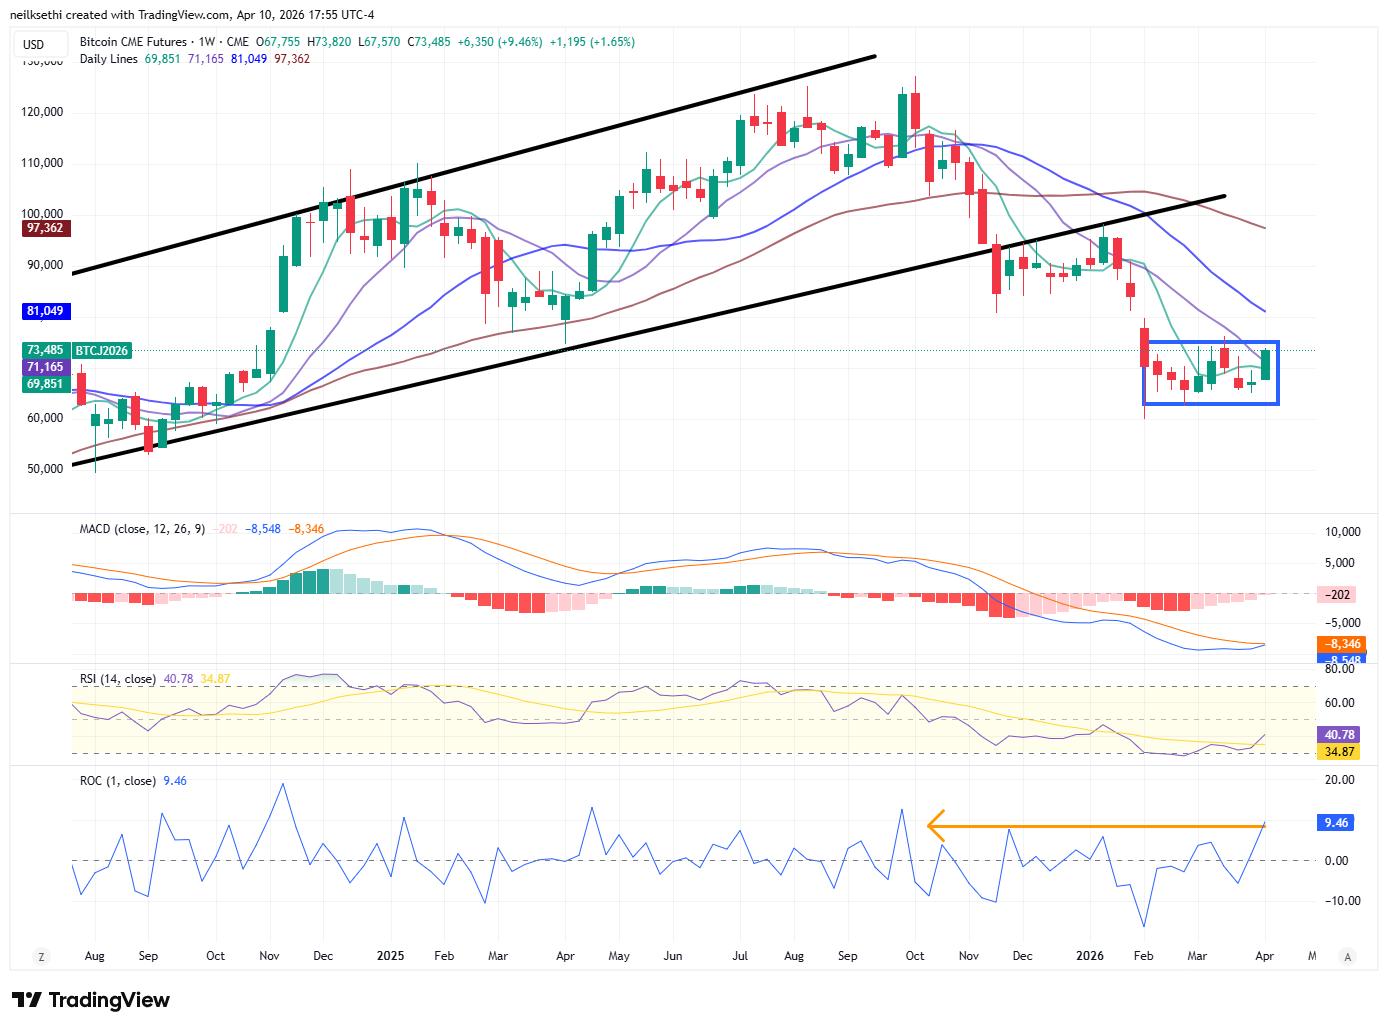
Bitcoin futures up for a third session to the highest close in three weeks, moving towards the top of the range since the start of February (the blue box). The daily MACD remains in a “cover shorts” reading, and the RSI is back over 50, plus it cleared the 50-DMA so as I mentioned Wed, “we could see it test the top of the range again at least.”
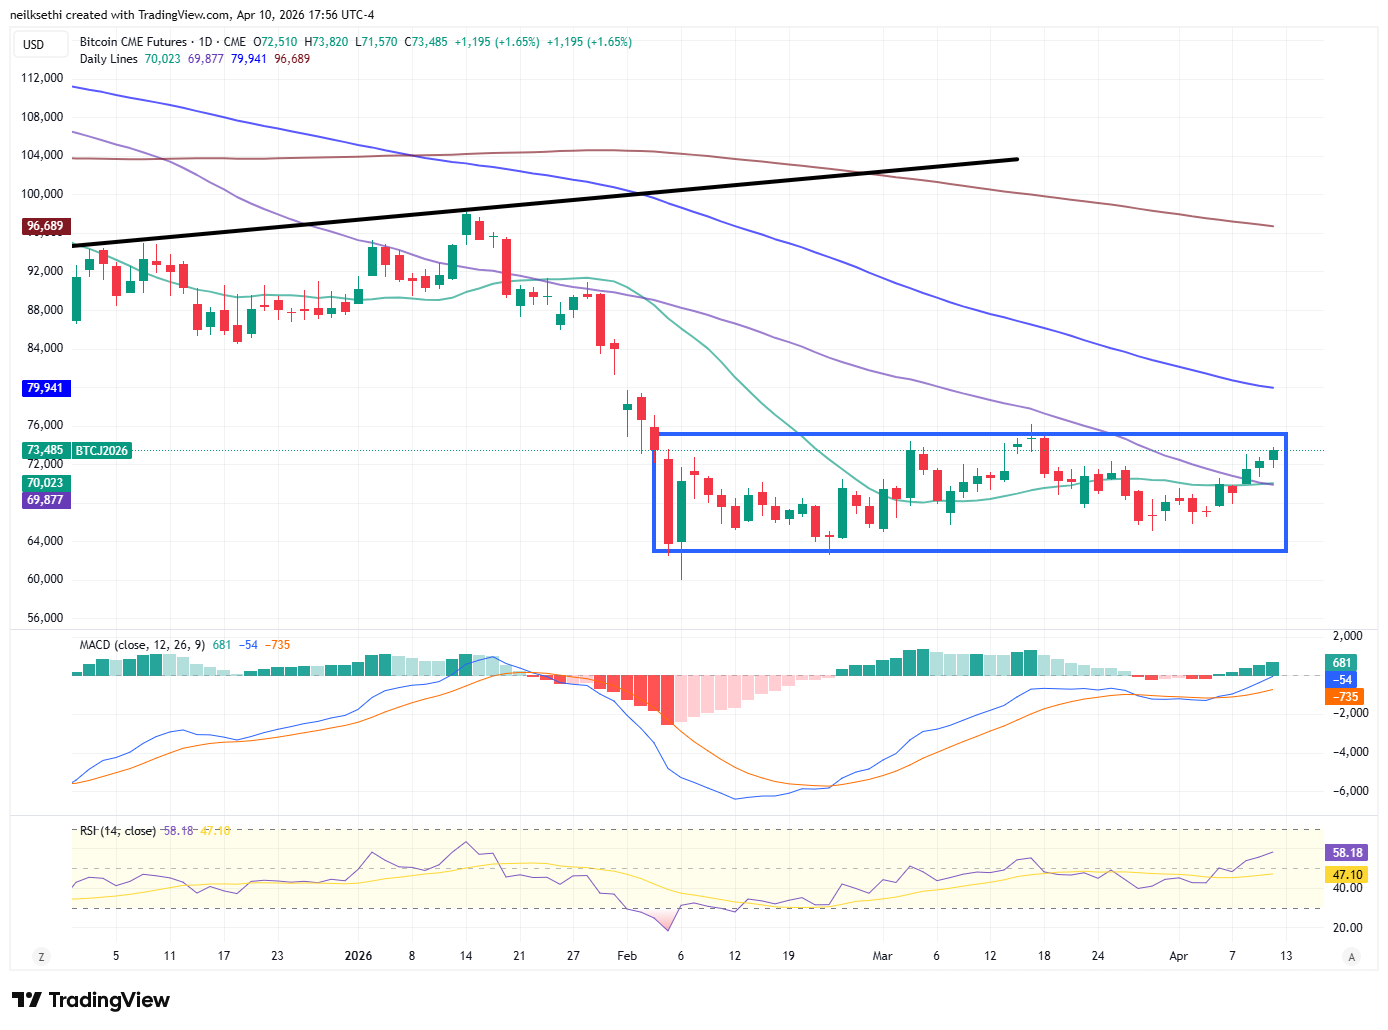
Best week since Sept.
The Week Ahead
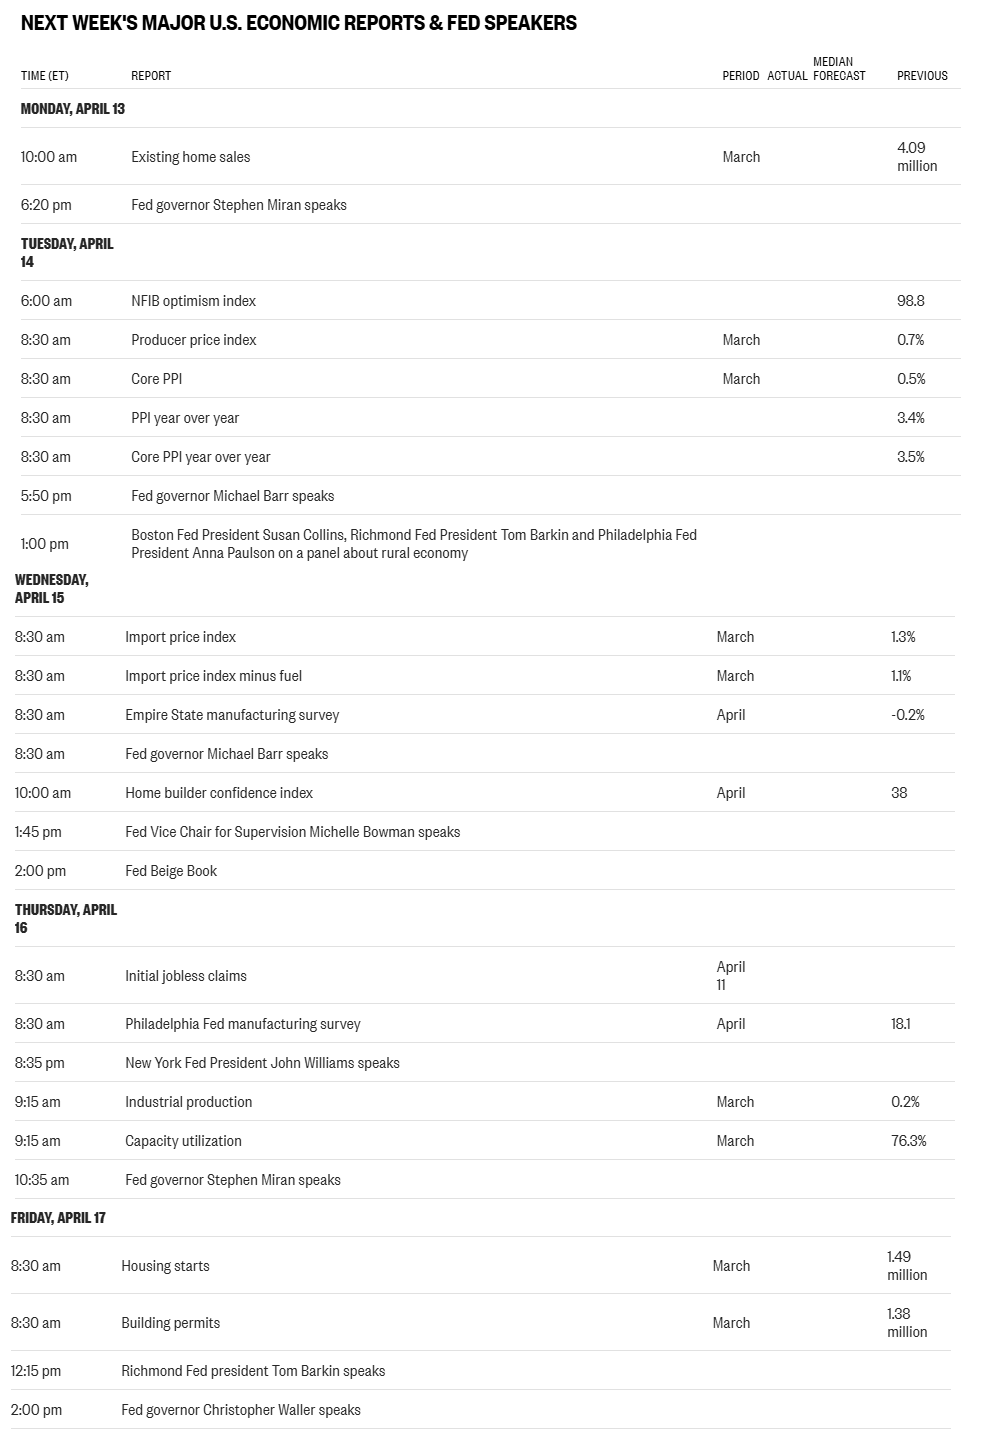
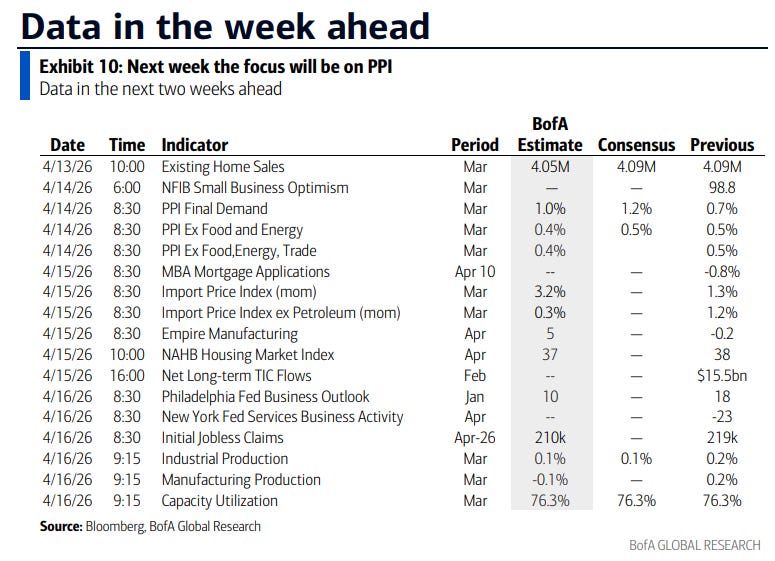
US economic data remains relatively heavy next week although mostly second or third tier data with March PPI, import prices, industrial production, housing starts/permits, existing home sales, NAHB home builder sentiment, and NFIB small business sentiment in addition to some regional Fed PMIs and the weekly reports (ADP, jobless claims, mortgage applications, EIA petroleum inventories, etc.).
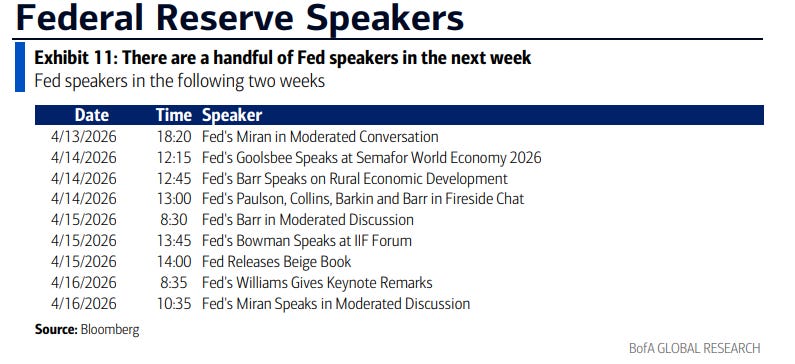
Lots of Fed speakers ahead of the policy speaking blackout starting Friday night with Gov’s Barr, Bowman, Waller, and Miran and regional Fed Presidents Collins, Barkin, Paulson, and Williams (Collins and Barkin are not voters this year). We’ll also get the Fed’s Beige Book prepared for the April meeting which will give us an update on what they’ve been hearing from their regions.
Non-bill Treasury auctions (>1yr in duration) off next week.
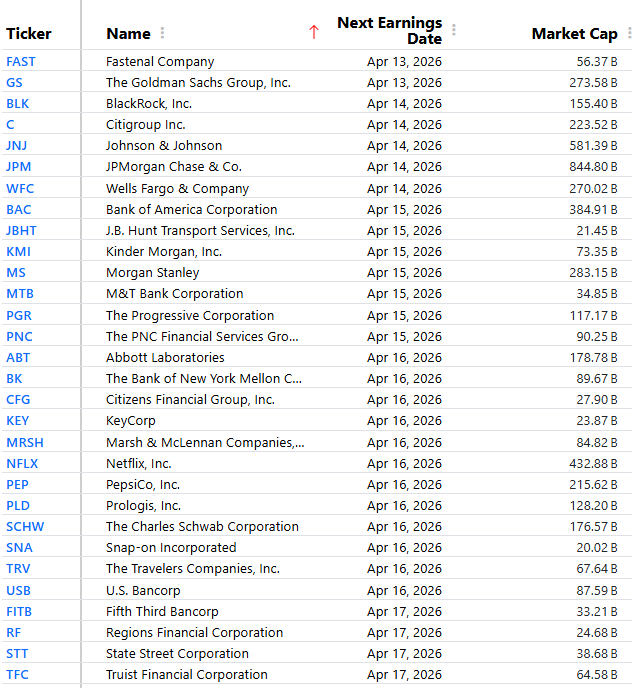
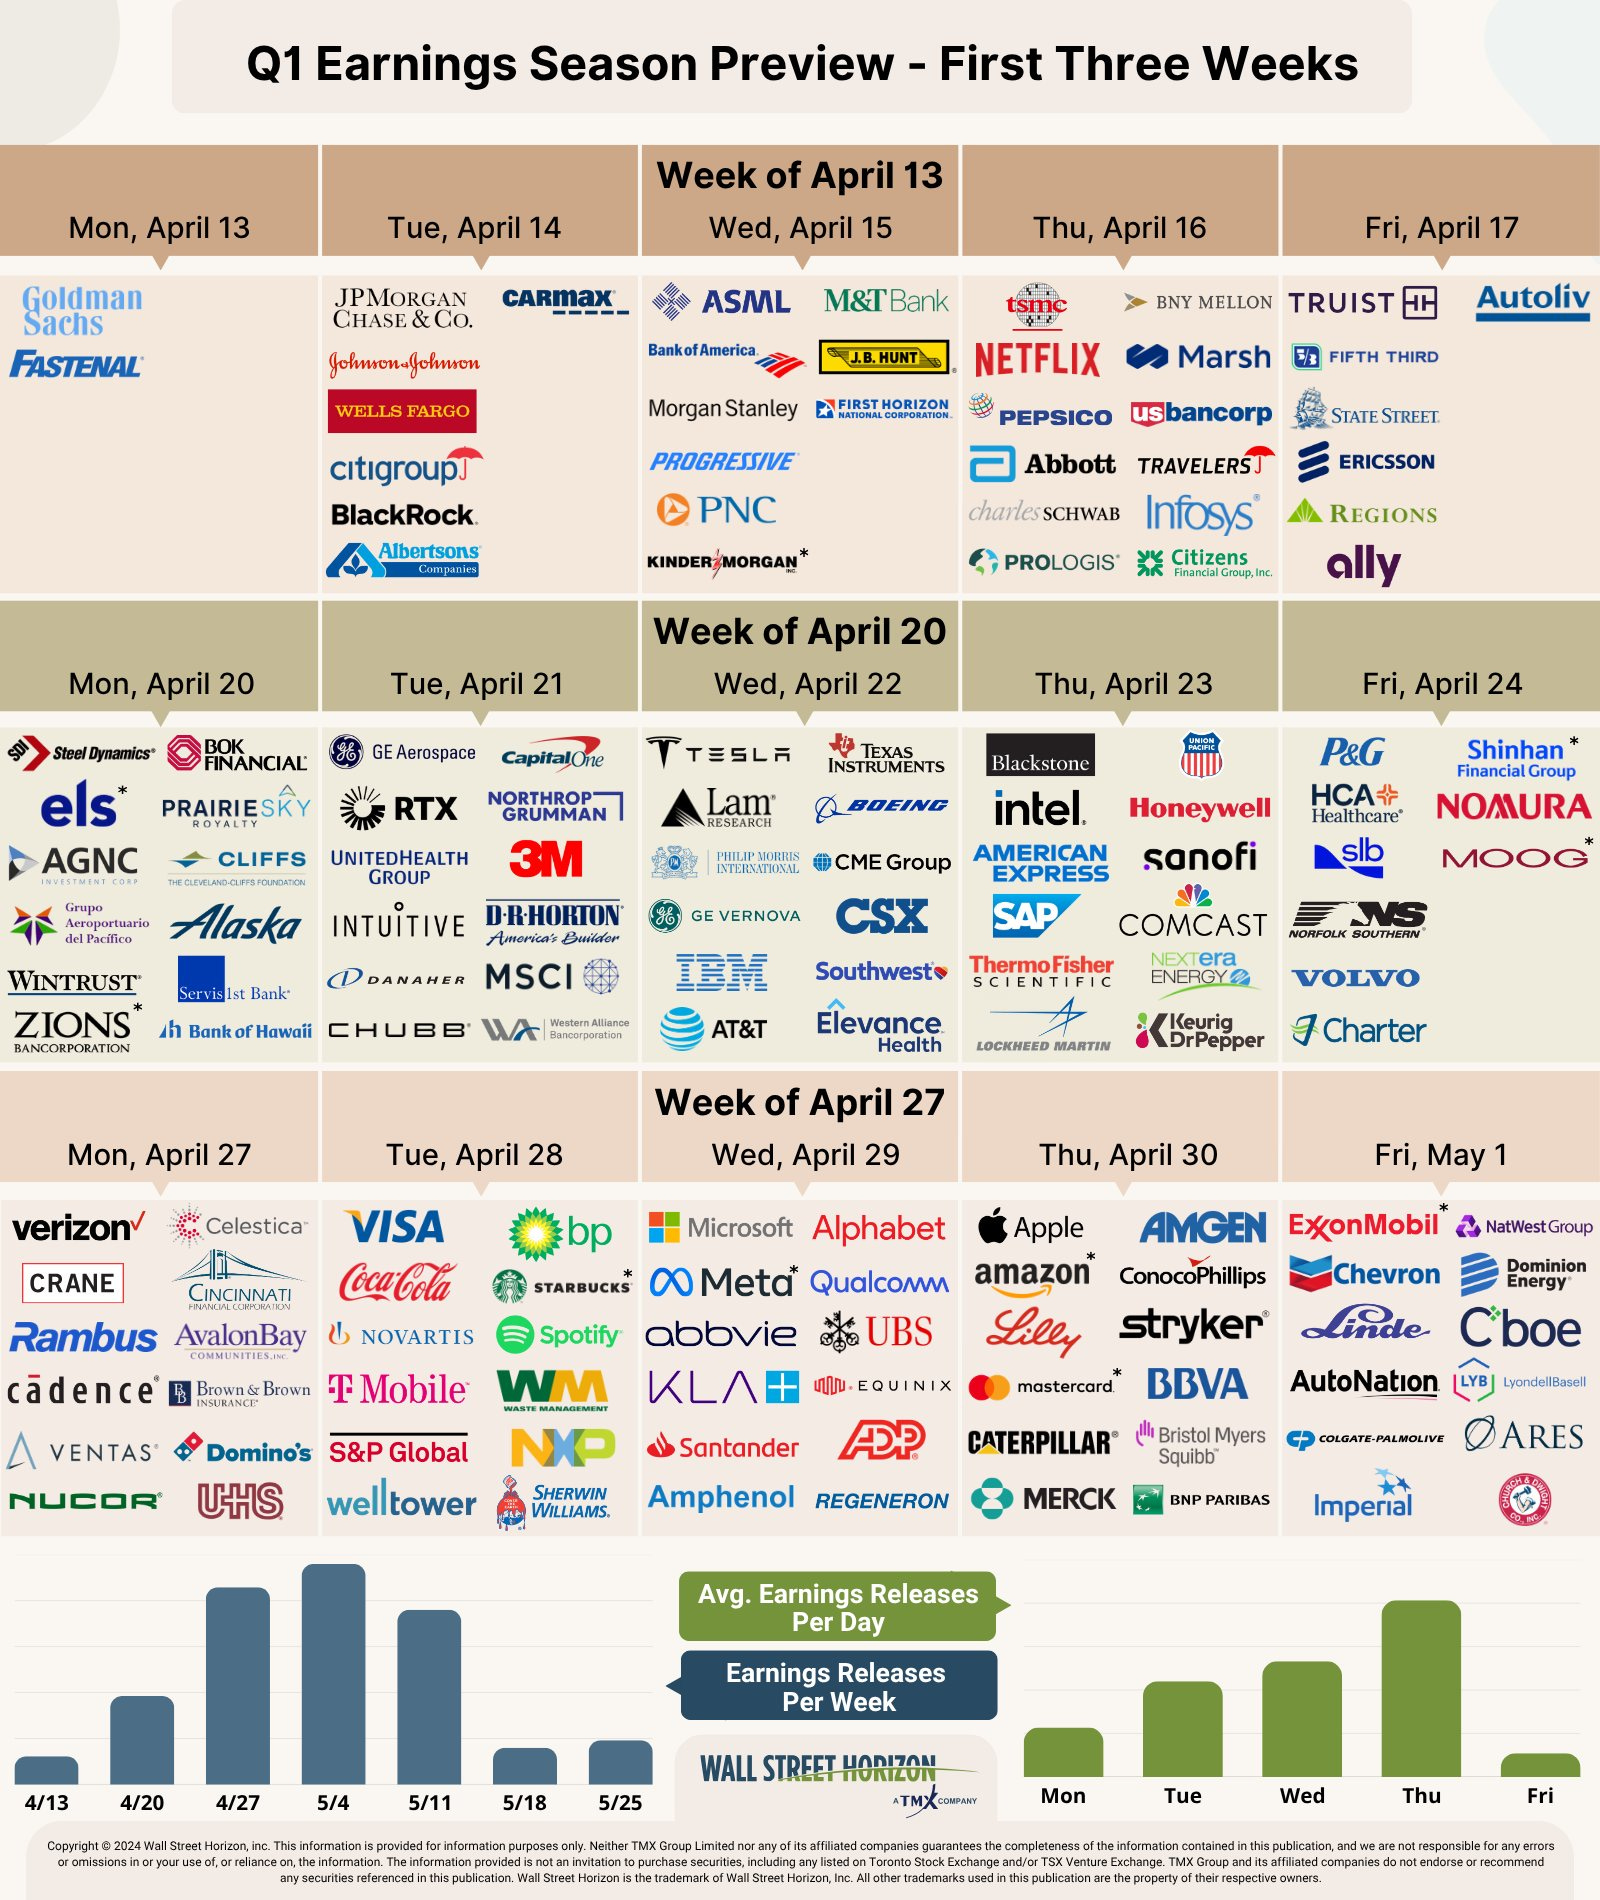
SPX earnings reports come back into center stage though with 1Q reporting season unofficially starting. We’ll get ~30 SPX components reporting, with an emphasis on Financials, and 14 >$100bn in market cap in GS, WFC, JNJ, BLK, C, JPM, BAC, MS, PGR, ABT, PEP, NFLX, PLD, SCHW (in order of earnings date).
Link to X posts - Neil Sethi (@nelksethi) / X
To subscribe to these summaries, click below (it’s free!).
To invite others to check it out,