
Markets Update - 4/2/26
Update on US equity and Treasury markets, US economic data, the Fed, select commodities and a look at the upcoming day with charts!

To subscribe to these summaries, click below!
To invite others to check it out (sharing is caring!), here’s the button:
Link to posts on X - Neil Sethi (@neilksethi) / X
Note: links are to outside sources like Bloomberg, CNBC, etc., unless it specifically says they’re to the blog.
Also, if you see an error (a chart or text wasn’t updated, etc.), always appreciate a note in the comments section or email so I can fix it.
In that regard, I do make mistakes sometimes, and usually I catch them at some point and correct them, and/or I sometimes add new material, so it’s always safest to read from the website where it will have any updates.
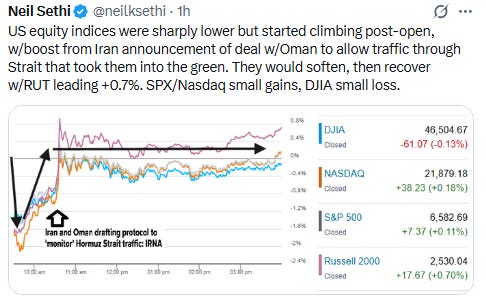
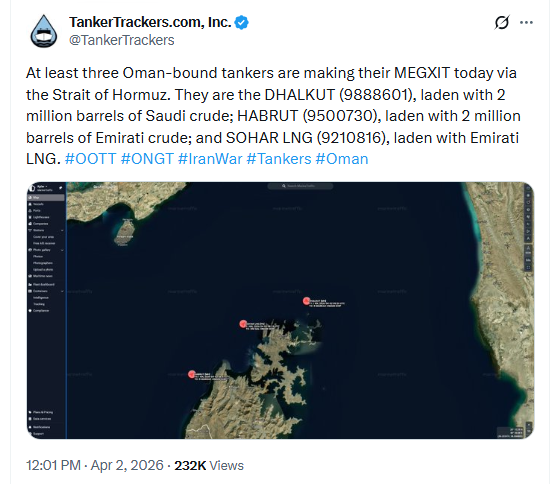
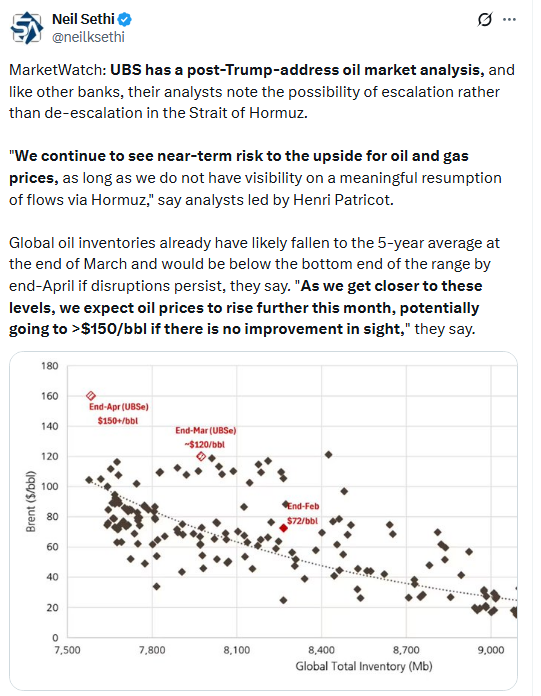
US equity indices opened trading Thursday sharply lower after President Trump’s address to the nation Wednesday night where he indicated that the Iran war would likely escalate in coming weeks as detailed in the morning update. However they would quickly find their footing and start recovering boosted by a report that Iran was drafting a protocol with Oman to permit traffic through the Strait of Hormuz in exchange for a toll (even though it is international waters). That report was followed later by a report from Tanker Trackers that some Oman flagged vessels had passed through the Strait.
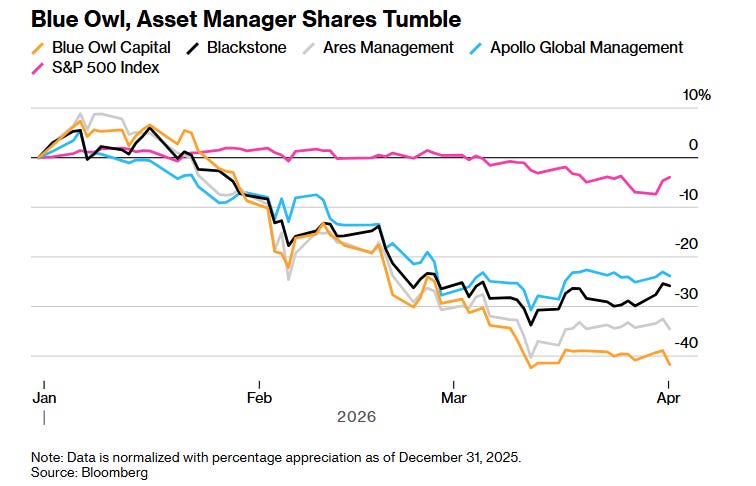
That saw equities hit the highs of the day just over flat levels before edging back on continued concerns about private credit after Blue Owl Capital capped private credit redemptions at 5% after the asset management firm experienced increased requests in two of its private credit funds including 21.9% in requests for its $36 billion Blue Owl Credit Income Corp. fund, one of the industry’s largest. The smaller Blue Owl Technology Income Corp. saw shareholders ask for 40.7% back, after with 15.4% three months earlier. Blue Owl’s stock fell as much as 7%. Equities were also pressured by Tesla falling over -5% after the company posted one of its worst sales quarters in years.
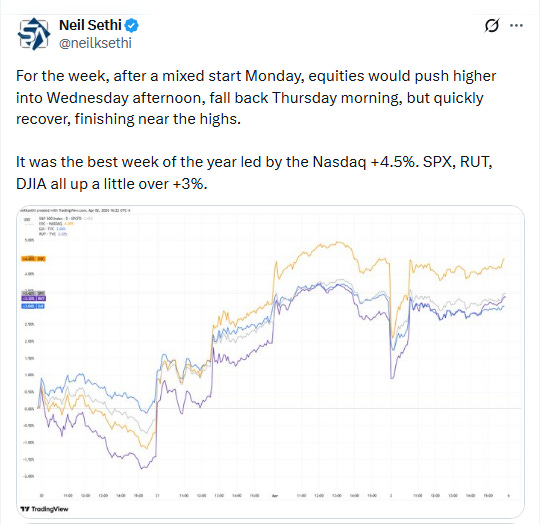
Still equity indices would hold in with the small cap Russell 2000 (RUT) leading +0.7%. The S&P 500 and Nasdaq would see small gains, the DJIA a small loss. For the week, though, it was the best of the year led by the Nasdaq +4.5%. SPX, RUT, DJIA all up a little over +3%.
Elsewhere, bond yields were little changed, but crude prices shot to new highs. The dollar was also higher but US natural gas, gold, copper, and bitcoin all fell (all covered in the subscriber section with charts).
The market-cap weighted S&P 500 (SPX) was +0.1%, the equal weighted S&P 500 index (SPXEW) +0.3%, Nasdaq Composite +0.2% (and the top 100 Nasdaq stocks (NDX) +0.1%, the SOXX semiconductor index +0.4% (up 9% the last two sessions), and the Russell 2000 (RUT) +0.7%.
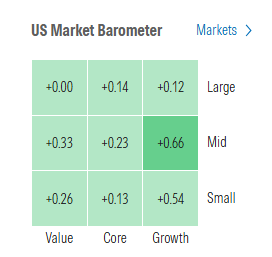
Morningstar style box saw mild gains across the box Thurs led for a third session by growth.
Market commentary:
“Obviously, any cessation of outright warfare would be a good thing—hopefully no one wants to see casualties and major disruptions—but the notion that it might occur without a reopening of the Strait of Hormuz seemed rather incomplete,” says Steve Sosnick, chief strategist at Interactive Brokers. “A ceasefire is a necessary condition for a resolution; reopening the Strait is the only condition sufficient to return global economies to a state of relative normalcy.”
“What often happens with the stock market is that any certainty is often considered a positive,” Larry Tentarelli, chief technical strategist of the Blue Chip Daily Trend Report told CNBC. “There looks to be light at the end of the tunnel.” Tentarelli said President Donald Trump’s Wednesday address was hawkish overall. But Trump’s comments about strikes lasting for two or three more weeks could offer some confidence that the conflict won’t be longer-term, Tentarelli said. “A two-to-three week time frame is much better than two to three months,” Tentarelli said. “Two to three weeks doesn’t seem that bad in the grand scheme of things.”
“I think investors are having knee-jerk reactions — they want the news to be good, but then think about it a little longer and decide perhaps the uncertainty is still too high, hence the high intraday volatility,” Melissa Brown, managing director of investment decision research at SimCorp, said to CNBC.
“This market just isn’t manageable,” said Laurent Lamagnere, deputy chief executive officer at Alphavalue in Paris. “We’re really concerned about second-round effects, not only on oil prices but also on oil supply, for example, airlines trimming destinations with harsh consequences for tourism.”
“While assets gyrate on every new headline, until a clear agreement is achieved with a palatable plan for reopening the Strait, there’ll be downward pressure on economic growth and upward pressure on headline inflation,” said Max Gokhman, deputy CIO, Franklin Templeton Investment Solutions. “That spells indigestion for both equity and bond investors.”
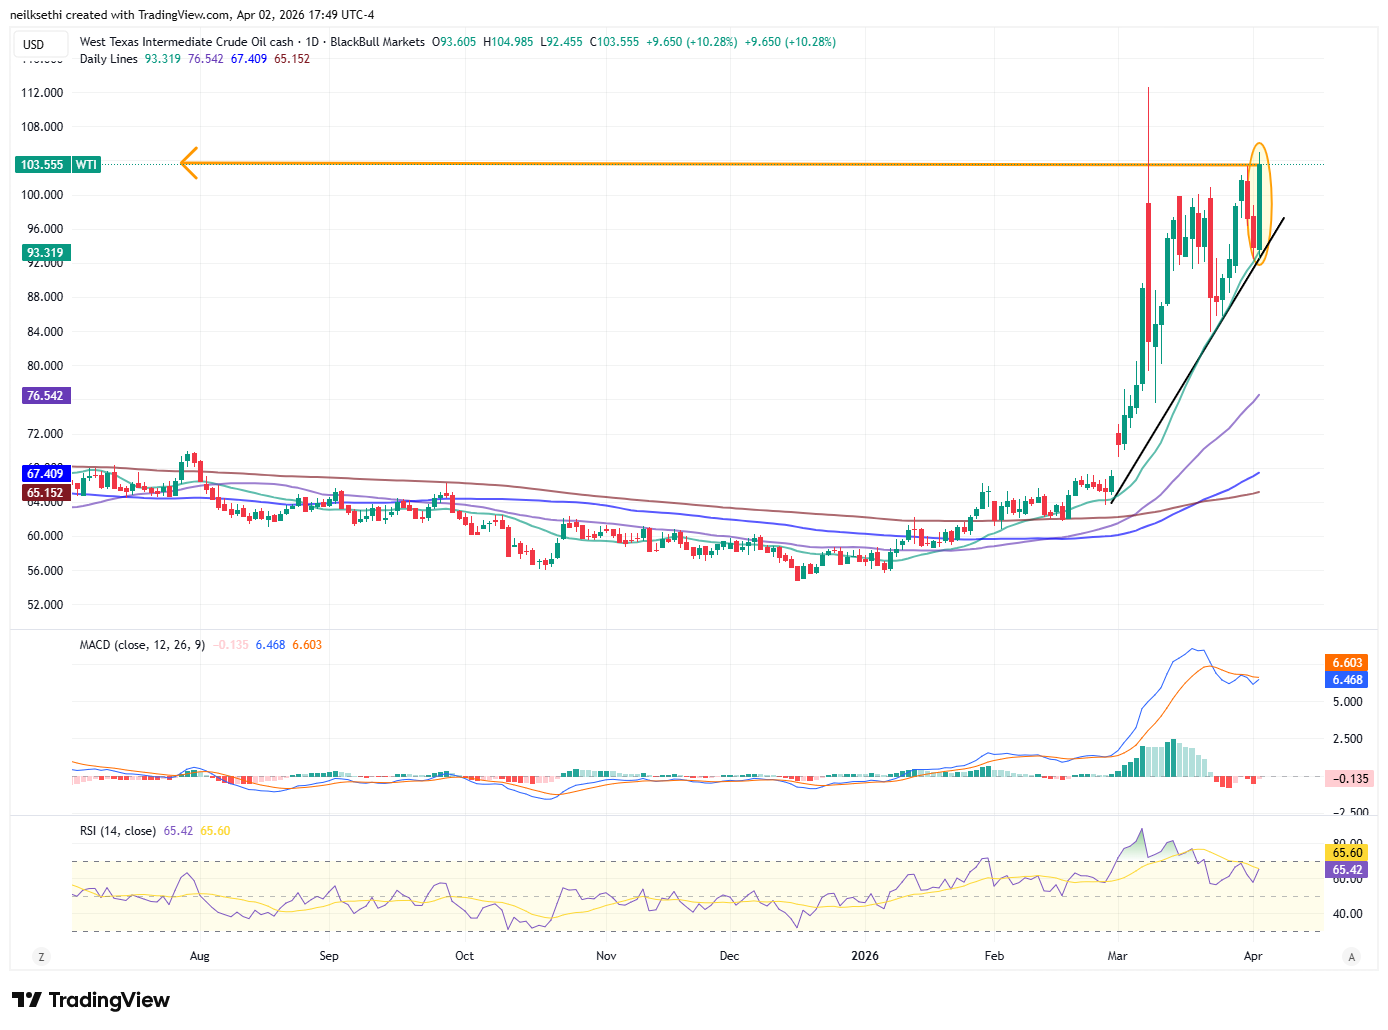
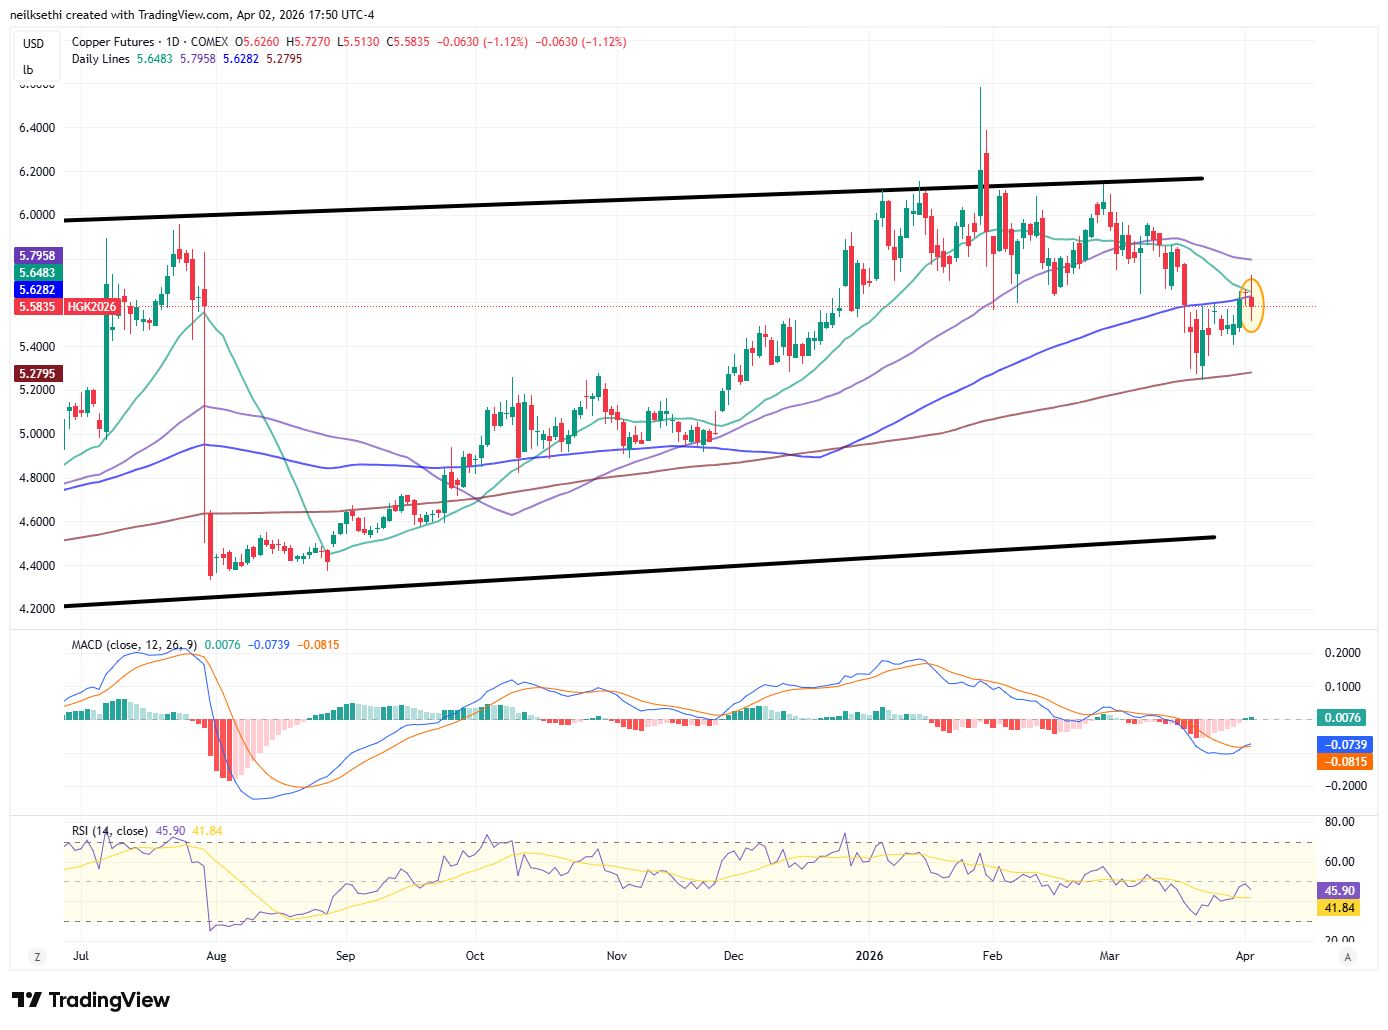
Oil “has rarely dipped below $100 per barrel since its initial surge,” said Russ Mould, investment director at AJ Bell. “This may be a better indicator of where we are than the latest movements in global indices, as the world is forced to confront a situation where around 20% of the world’s supply is disrupted.”
“Equity markets are kind of numbing to what crude is doing,” said Ryan Detrick, chief market strategist at Carson Group. While markets are forward-looking, and thus pricing in an end to the war, the moves in crude prices contradict that, he said.
For Mabrouk Chetouane, global head of market strategies at Natixis IM Solutions, there is little sense in buying protection or hedging positions ahead of the break as events could go either way. “The outcome is completely binary, it’s 50/50 between escalation and de-escalation,” Chetouane said. “The best choice is just to keep a cool head and maintain our allocation, it’s the most reasonable thing to do.”
“With a long weekend looming thanks to tomorrow’s Good Friday, it looks like Thursday is the new Friday, particularly when one considers the potential event risks. There is also the small issue of a non-farm payroll report released tomorrow in what’s sure to be poor liquidity conditions.” — Cameron Crise, Macro Strategist, Markets Live
“The biggest problem that we face right now is that unlike last year, the President does not hold all of the cards. As we’ve been saying for more than a week, he cannot flip a switch and change the situation unilaterally,” said Matthew J. Maley, chief market strategist at Miller Tabak + Co.
Markets had been hoping that President Donald Trump’s address Wednesday night would provide more clarity concerning an off-ramp for the U.S. in the Iran conflict as investors continue to look for signs of de-escalation in the Middle East, said Michael Reynolds, vice president of investment strategy at Glenmede, in a phone interview. There’s “still a lot of uncertainty over what the next couple weeks” will look like, he said.
“The upshot is that markets remain uncertain as to how long the acute disruptions we are seeing to global energy supplies will persist,” wrote James McCann, senior economist, Edward Jones. “Against this backdrop, sentiment will likely remain headline-driven in coming sessions, with volatility likely to remain elevated over the short term at least.”
“Equity markets seem to be looking past the risk of a higher embedded premium in oil and more focused on the Strait reopening,” said Adam Turnquist, chief technical strategist for LPL Financial. “With oil clearly in the driver’s seat of risk appetite, sustainability of the recovery in equity markets appears vulnerable.”
“The longer oil prices stay higher, the less consumers will have to spend, and the more the economy will slow,” Kevin Mahn, CIO of Hennion & Walsh, told CNBC’s “Squawk Box” in an interview. He added that he doesn’t expect the Federal Reserve to move on rates in the near future, so “we’re going to have to wait for a resolution in the conflict to actually see some respite with respect to oil prices and inflation.”
“It’s pivotal for the United States that the Strait is reopened, not so much because of oil but because of helium,” said Todd Schoenberger, chief investment officer at CrossCheck Management, noting that helium is “more valuable than foreign oil” given its usage in semiconductor processing and that “there is no substitute for it.”
“Expect more volatility going into the long weekend,” he added.
Link to X posts - Neil Sethi (@neilksethi) / X for full posts/access to charts.
In individual stock action:
Tesla Inc. shares fell after the company posted one of its worst sales quarters in years, missing Wall Street’s expectations, as it struggles to turn around its core business and navigate an increasingly challenged electric-vehicle market.
Joining Blue Owl in trading lower Thursday, the company’s peers Blackstone Inc., Apollo Global Management Inc., KKR & Co Inc., Ares Management Corp. all fell by around 3%.
Corporate news from BBG:
A group of private credit firms led by Blackstone Inc. has refused to extend another lifeline to software company Medallia, amping up pressure on owner Thoma Bravo to inject more equity into the troubled business or hand over the keys via a debt restructuring.
Stellantis NV is discussing options for building electric vehicles in Canada with its Chinese partner, Zhejiang Leapmotor Technology Co., according to people familiar with the matter.
Alibaba Group Holding Ltd. has released its third proprietary AI model in as many days, reinforcing the company’s intent to focus on profiting off its flagship artificial intelligence services.
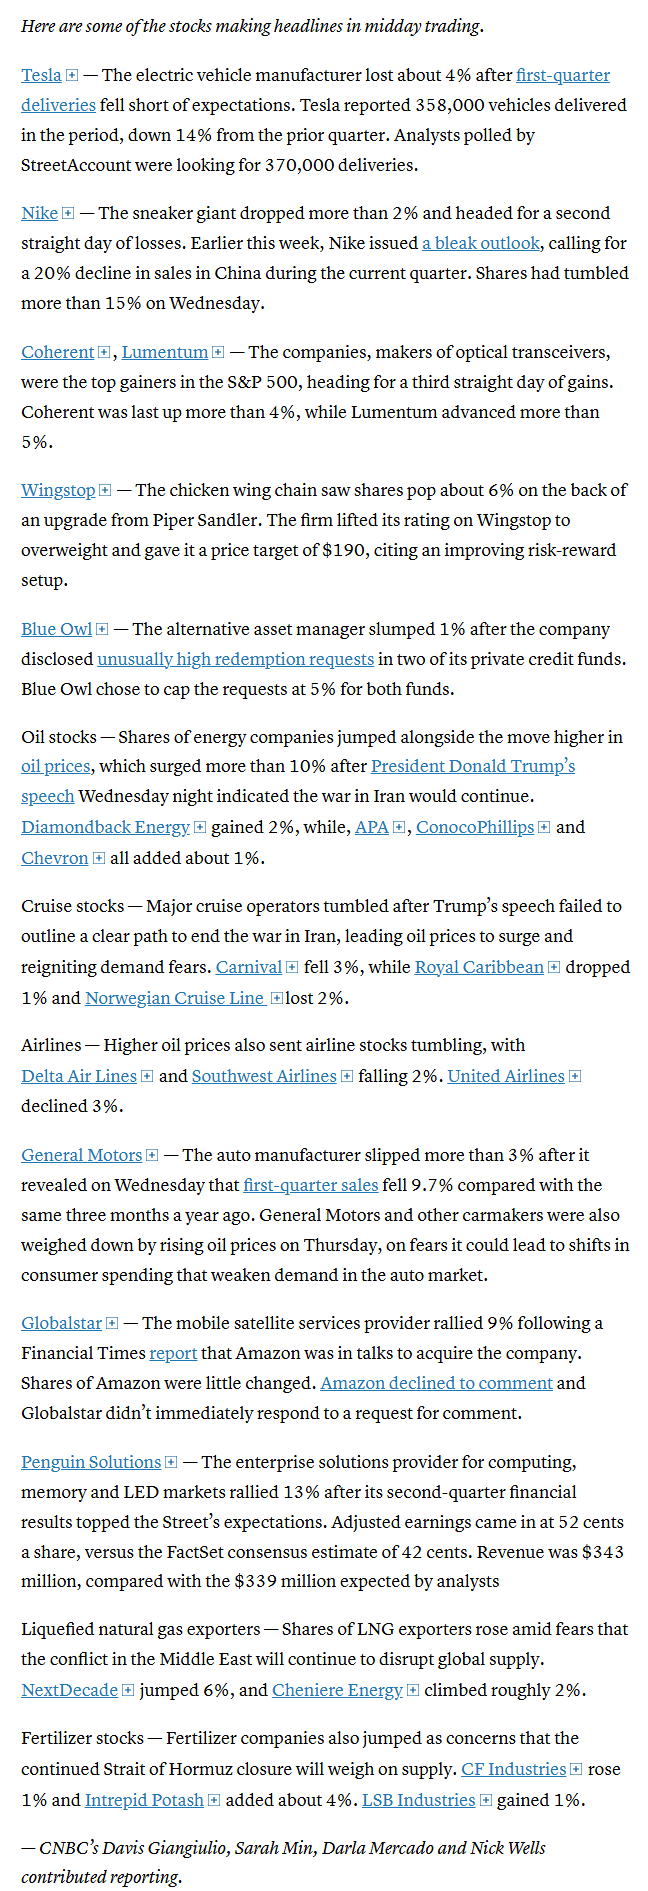
Mid-day movers from CNBC:
In US economic data:
Substack articles today - NOTE TRADE BALANCE REPORT BELOW WAS NOT EMAILED OUT
Link to posts for more details/access to charts - Neil Sethi (@neilksethi) / X
The remainder of the note with deeper analysis of equity, bond, and commodity markets, charts, FOMC updates, and the look ahead to the following day (week on Fridays) is for subscribers contributing to the charity fund.
Note on all charts the lines are moving averages (the average price over various lookback periods (days on the daily charts, weeks on the weekly charts, etc.))”
20 = green
50 = purple
100 day = blue
200 day = brown
MACD = Moving average convergence/divergence line, a measure of a momentum that compares longer term and shorter term momentum to gauge if a move is strengthening or weakening,
RSI = Relative Strength Index (basically what it sounds like) = measures the strength of the move comparing gains to losses over the given lookback window (I use the standard 14-periods)
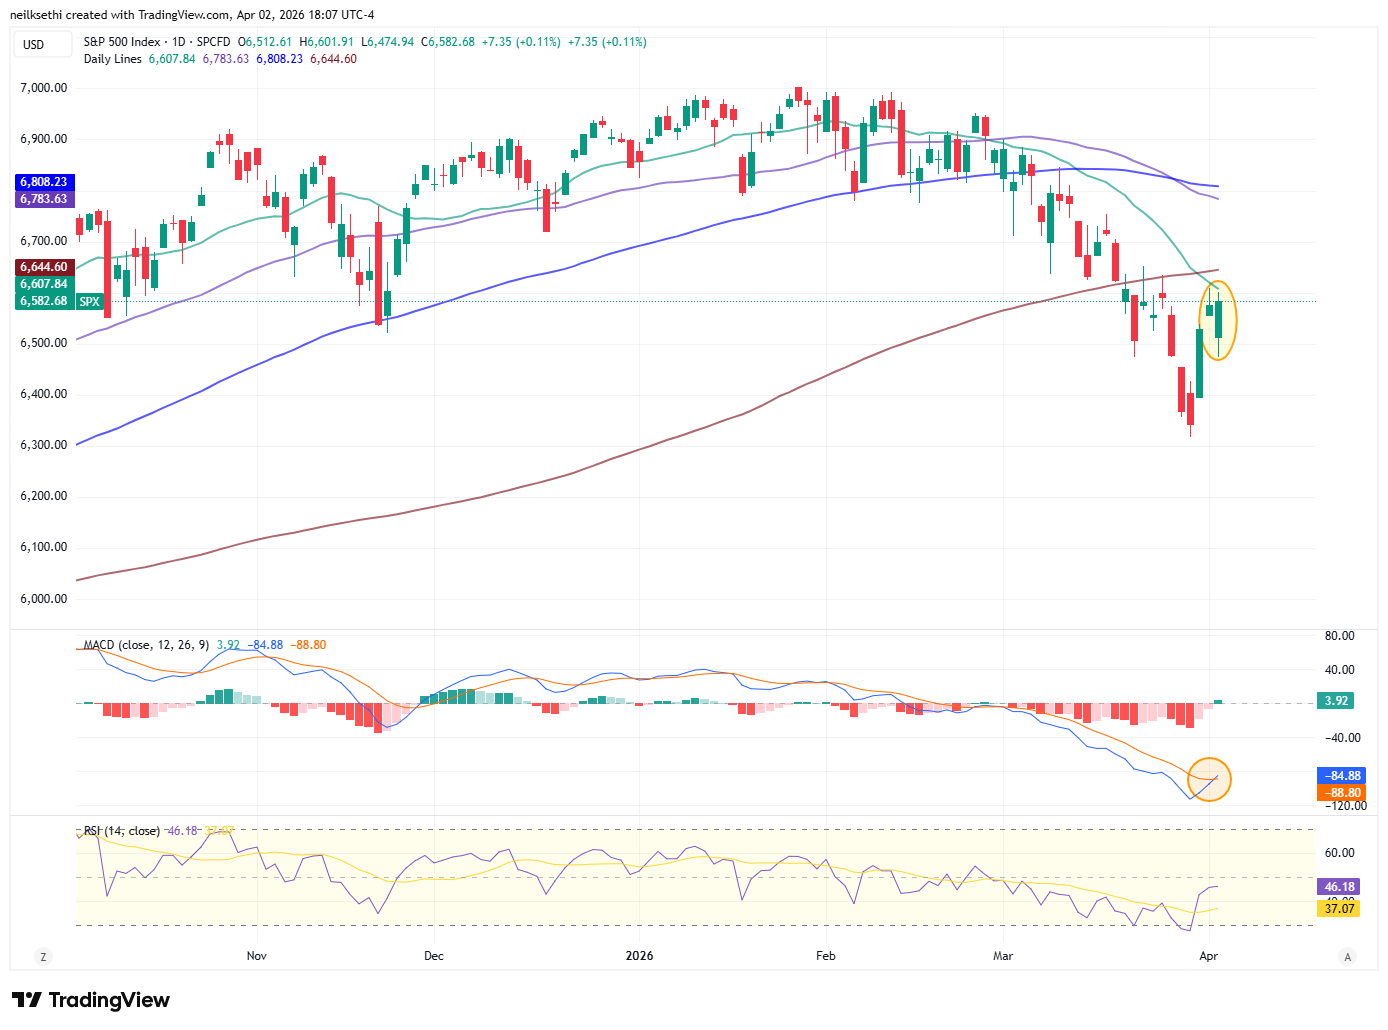
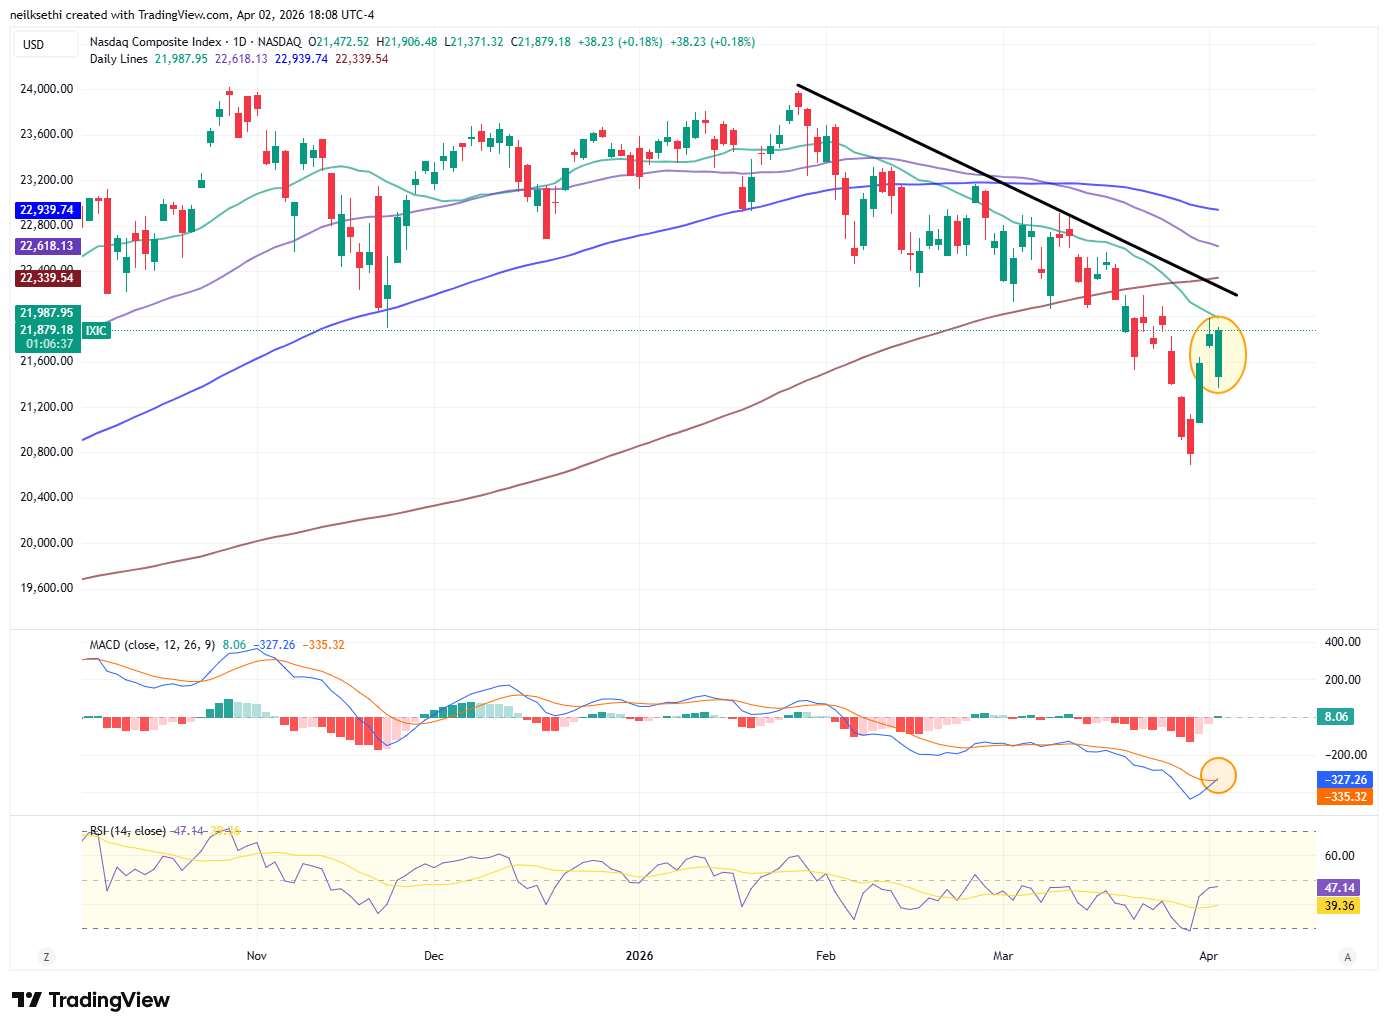
SPX was little changed again capped by its 20-DMA (with the 200 just above it). The daily MACD though did turn more positive while the RSI is not far.
“A two‑day relief rally has pushed the S&P 500 back above support from the November lows (6,522), but the 200‑day moving average (dma) now represents a key test of demand,” said Adam Turnquist, chief technical strategist at LPL Financial. “Failure to reclaim this level would keep the near‑term downtrend intact and raise the risk of a retest of last Friday’s low.”
The Nasdaq Composite a similar story.
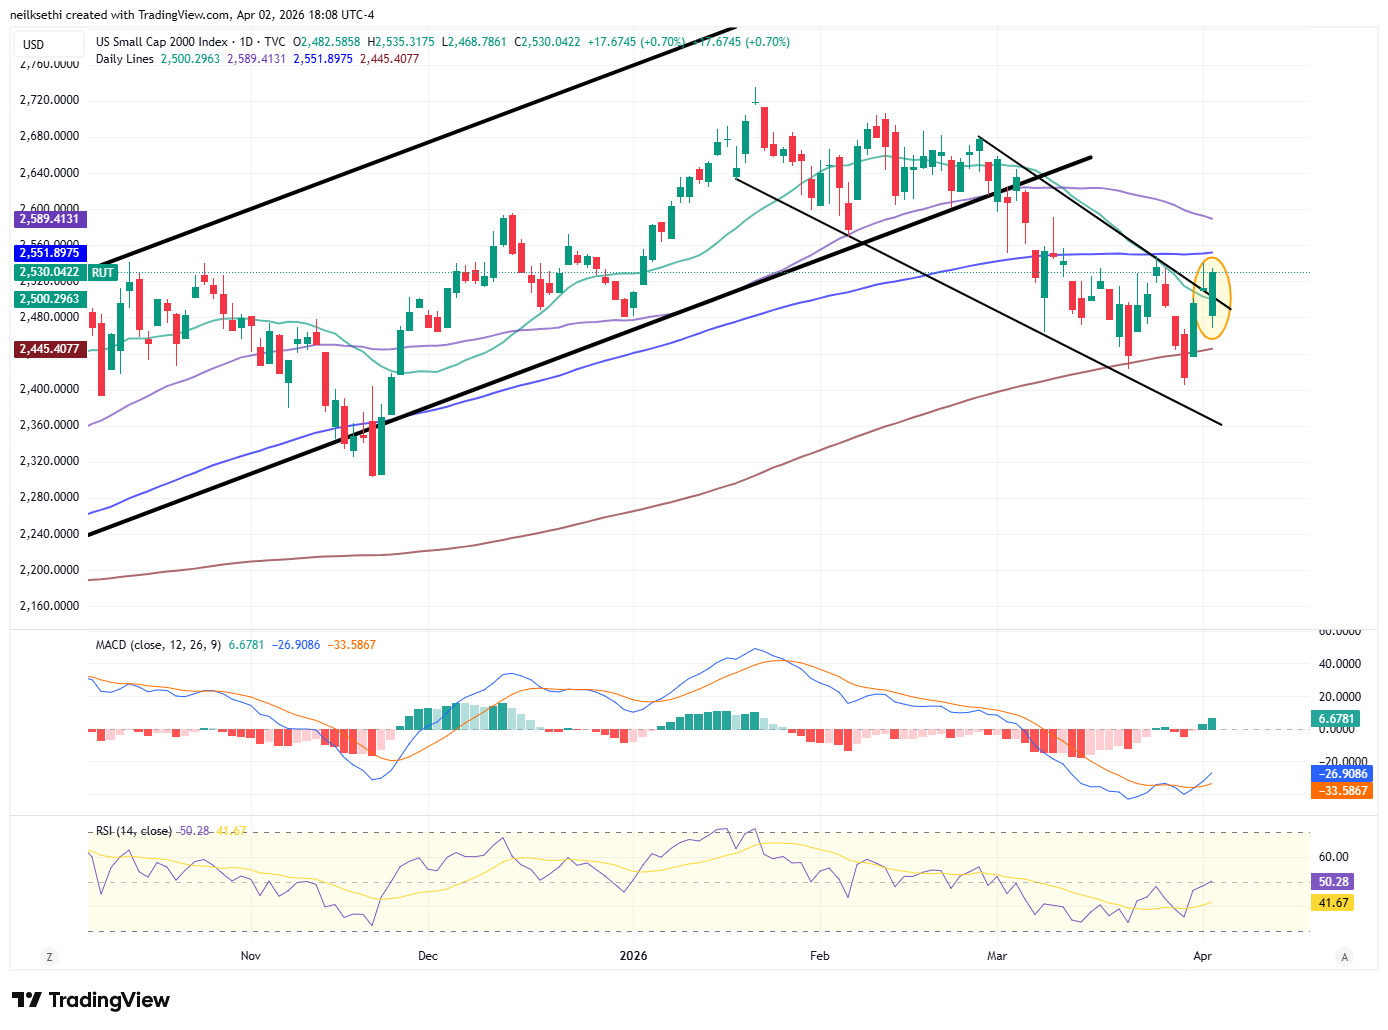
RUT (Russell 2000) I noted Wed “looks like it’s trying to break out, pushing over the top of the downtrend wedge it’s been in,” and that continued Thurs. Also, its daily MACD and RSI as mentioned Wed have turned more positive. As I’ve said the past couple of weeks, “easily the best looking chart of the three.”
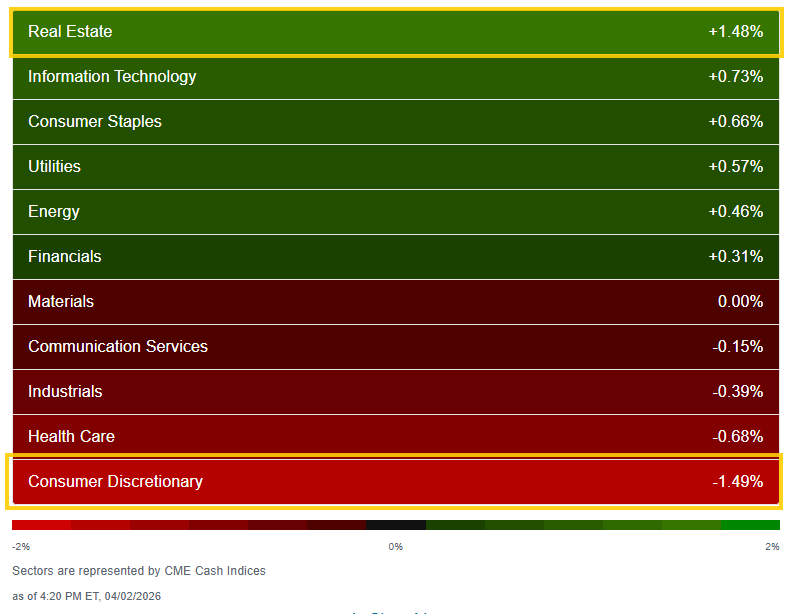
Sector flag from CME Cash Indices weakened but still 6 of 11 sectors higher (after 8 Wed, 9 Tues, 8 Mon). Just one sector up over 1% though (after four Wed, eight Tues) in RE.
Tech finished second but Wed/Tues leader Comm Services would fall into the red and the other megacap growth sector (Cons Discr) would lead to the downside -1.5% the only sector down more than -0.7%.
Stock-by-stock SPX flag from finviz_com consistent with a more mixed look with red and green scattered throughout.
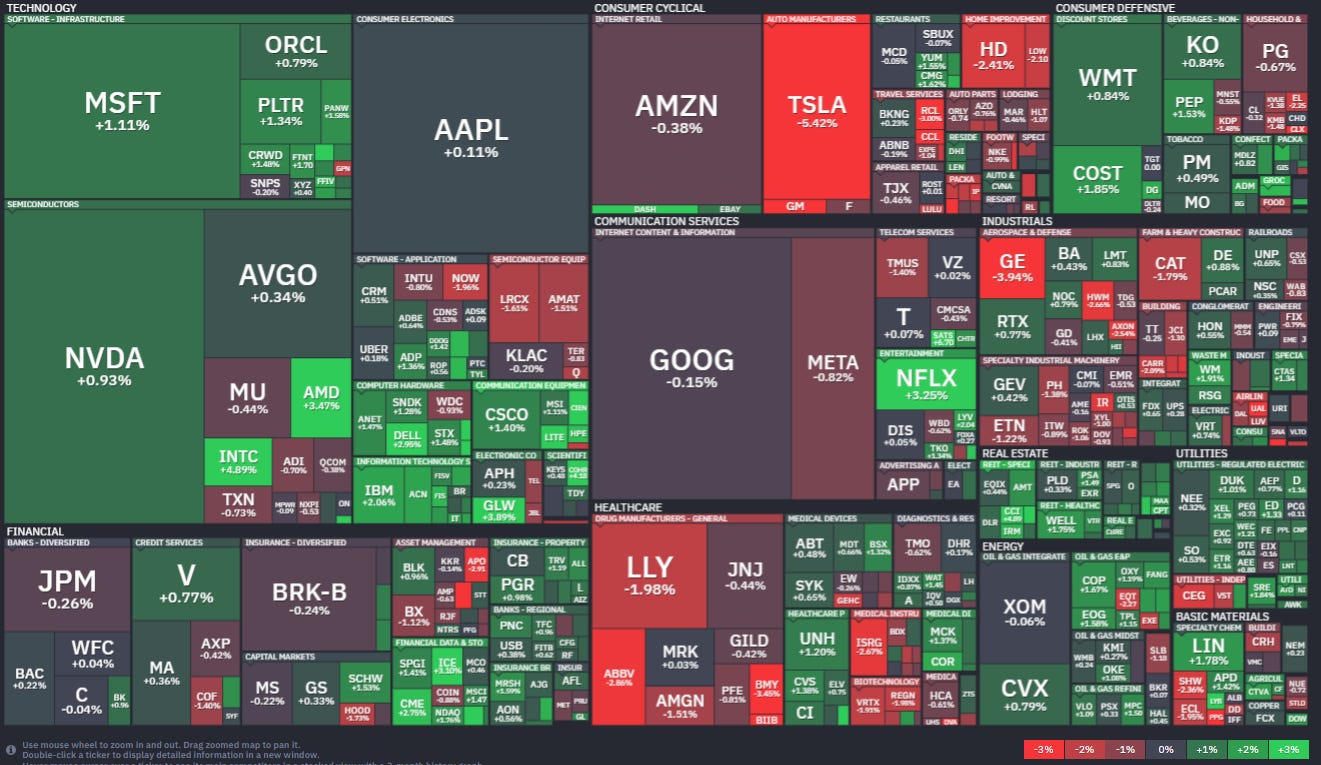
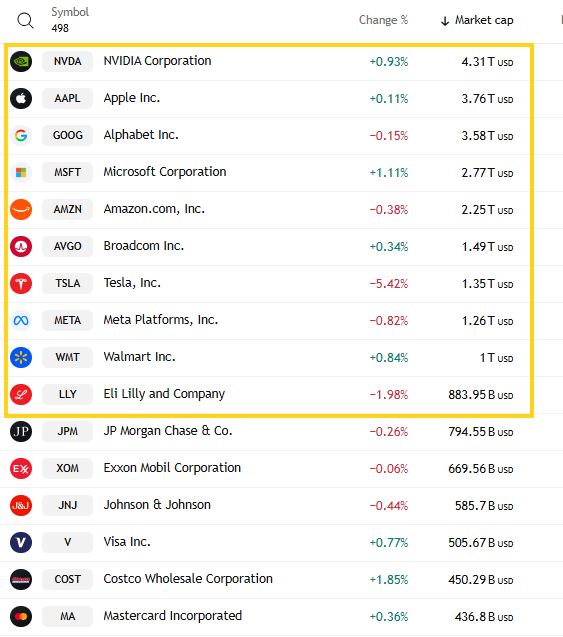
In that regard five of the largest 10 SPX components were higher (after all 9 Wed, 10 Tues) led by MSFT +1.1% (which was Wed’s sole decliner). TSLA was easily the largest decliner -5.4%.
Mag-7 ended -0.7%, ending the week +5.1% it’s first positive week since February after -5% last week, its worst since April, and -2.6%, -1.6%, -0.6% and -2% the four prior weeks.
18 SPX components up +3% or more, after ~35 Wed, 170 Tues, 14 Mon, led by SBA Communications SBAC +18.9% on potential sale talks.
4 of the SPX components up over 3% were >$100bn in market cap in INTC, GLW, AMD, NFLX with all but NFLX the third straight session (in descending order of percentage gains).
13 SPX components were down -3% or more, after ~20 Wed, 4 Tus, 50 Mon, 85 Fri, 105 a week ago, led by Tesla TSLA -5.4%.
Three of the SPX components down -3% or more that were >$100bn in market cap in TSLA, GE, BMY (in descending order of percentage losses (most to least)).
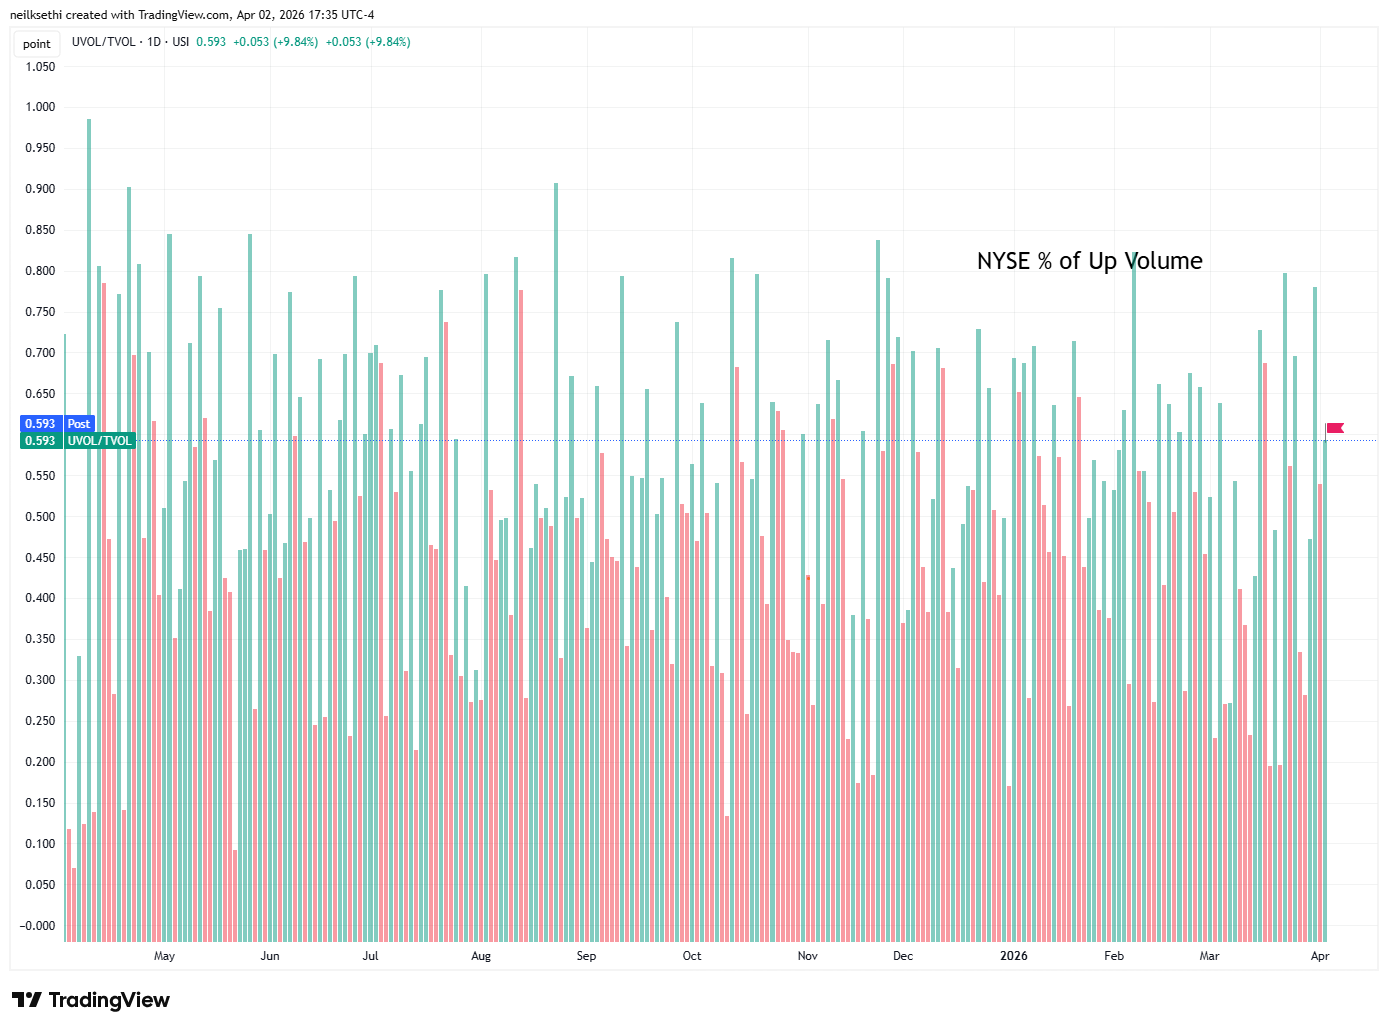
NYSE positive-volume ratio (intensity of buying in stocks up on the day), which has been mixed lately and weak Wed, improved to 59.3% from 54.0% even as the gain fell back to +0.06% from +0.41% so a much better relative performance.
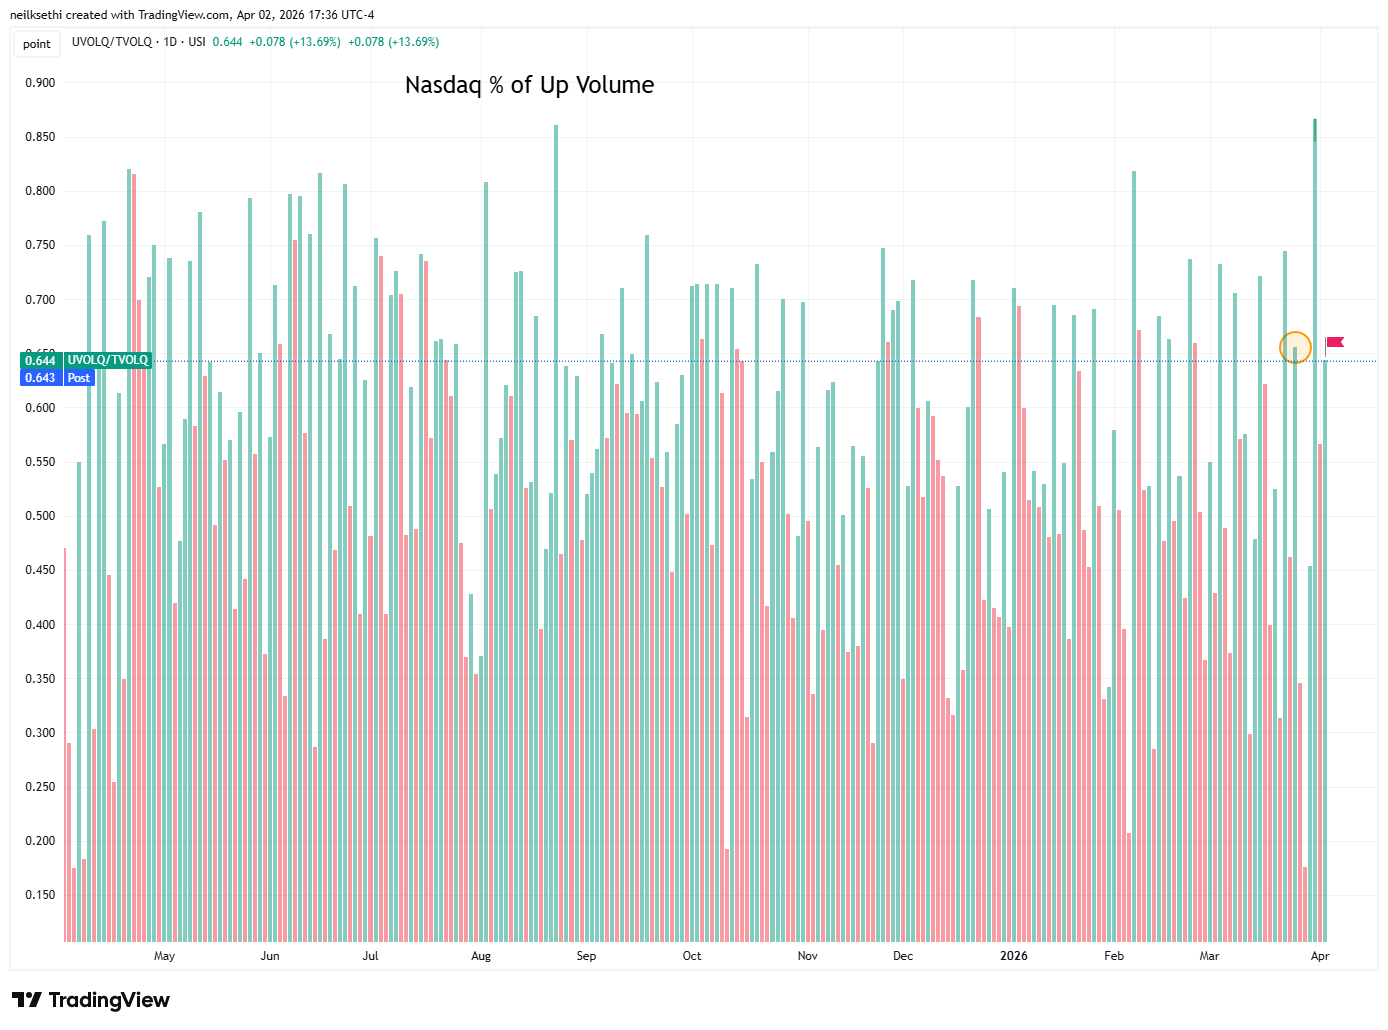
Nasdaq positive-volume ratio (intensity of buying in stocks up on the day) similarly improved to 64.3% from 56.6% despite the gain in the index falling to +0.18% from +1.16%.
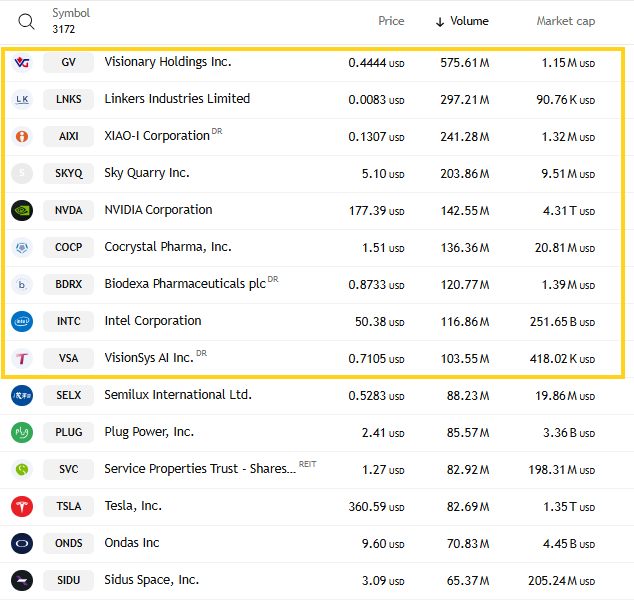
Speculative activity on the Nasdaq edged up with the top 3 stocks by volume (all penny stocks) seeing a little over 1.1bn shares traded, up from 1bn Wed but down from around 1.5bn Mon/Tues which were the most since ~2.15bn Mar 18th which was one of the highest of the year. One other though over 200mn shares and five others were over 100mn.
Positive issues (percent of stocks trading higher for the day), were weaker than positive volumes on both the Nasdaq at 56% (vs positive volume of 64%), and the NYSE at 59% (vs 57%).
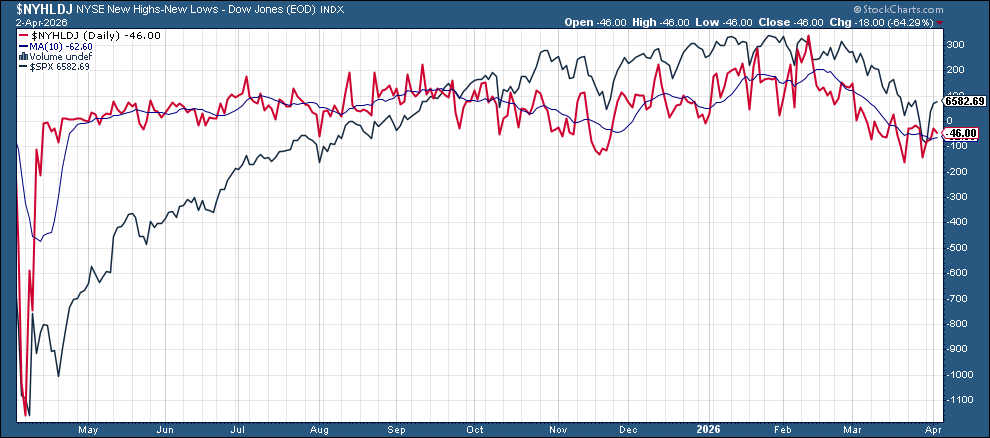
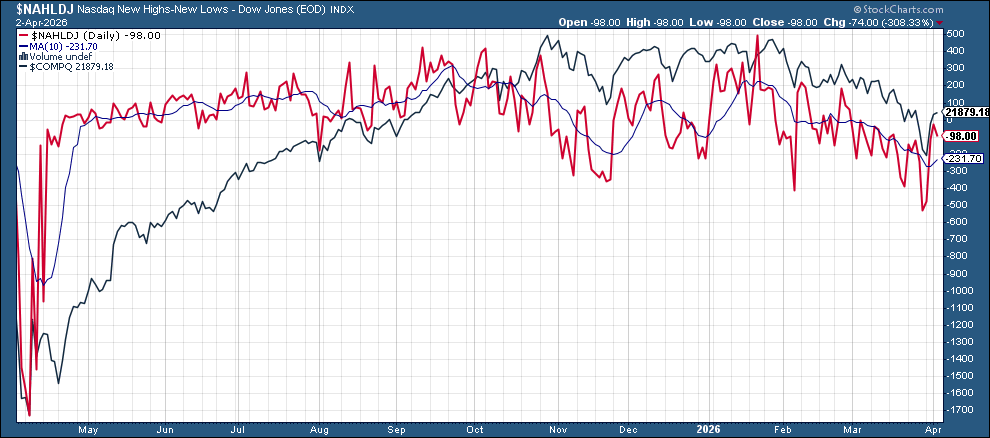
New 52-wk highs minus new 52-wk lows (red lines) though fell back to -46 on the NYSE and to -103 on the Nasdaq (but still up from -528 Friday, the least since April).
I did not update the FOMC rate pricing today as the CME data is clearly erroneous. If it looks better tomorrow, I’ll update the post with that data.
FOMC rate cut pricing little changed despite the better than expected economic data according to the CME’s FedWatch tool.
The chance for an April hike remained at 2.6% (still down from 41% chance of a cut Feb 11th), but that remains the peak for the net probability for a hike (down from 50% in December on Thursday).
The first cut (assuming no hike) remained September 2027 at now 77% (from 53% Monday). A second cut remains off the board with Dec ‘27 at 44% (up from 29% Fri but down from a 64% chance of a Sept ‘26 second cut on Feb 9th).
Pricing for 2026 now +6bps of cuts (from 16bps of hikes on Thursday but still well under the average dot on the dot plot of +28bps in cuts and down from +64bps cuts priced Feb 20th).
2027 also little changed at +35bps of cuts from current levels (so +29bps of cuts from YE 2026), vs +43bps of cuts from current levels for the average dot on the dot plot, corresponding to a terminal rate of 3.28% down from 3.38% Thurs, the joint highest to date, but up from 2.80% Feb 27th which was the lowest to date.
As a reminder these are the construct of probabilities. While some are bets on exactly one, two, etc., cuts some (most?) of it is bets (hedging) on a lot of cuts (3+) or a hike (or two).
Note I’ve changed the labels to just net chance of easing (probability of cuts minus probability of hikes).
Note includes the dot plot average in orange.
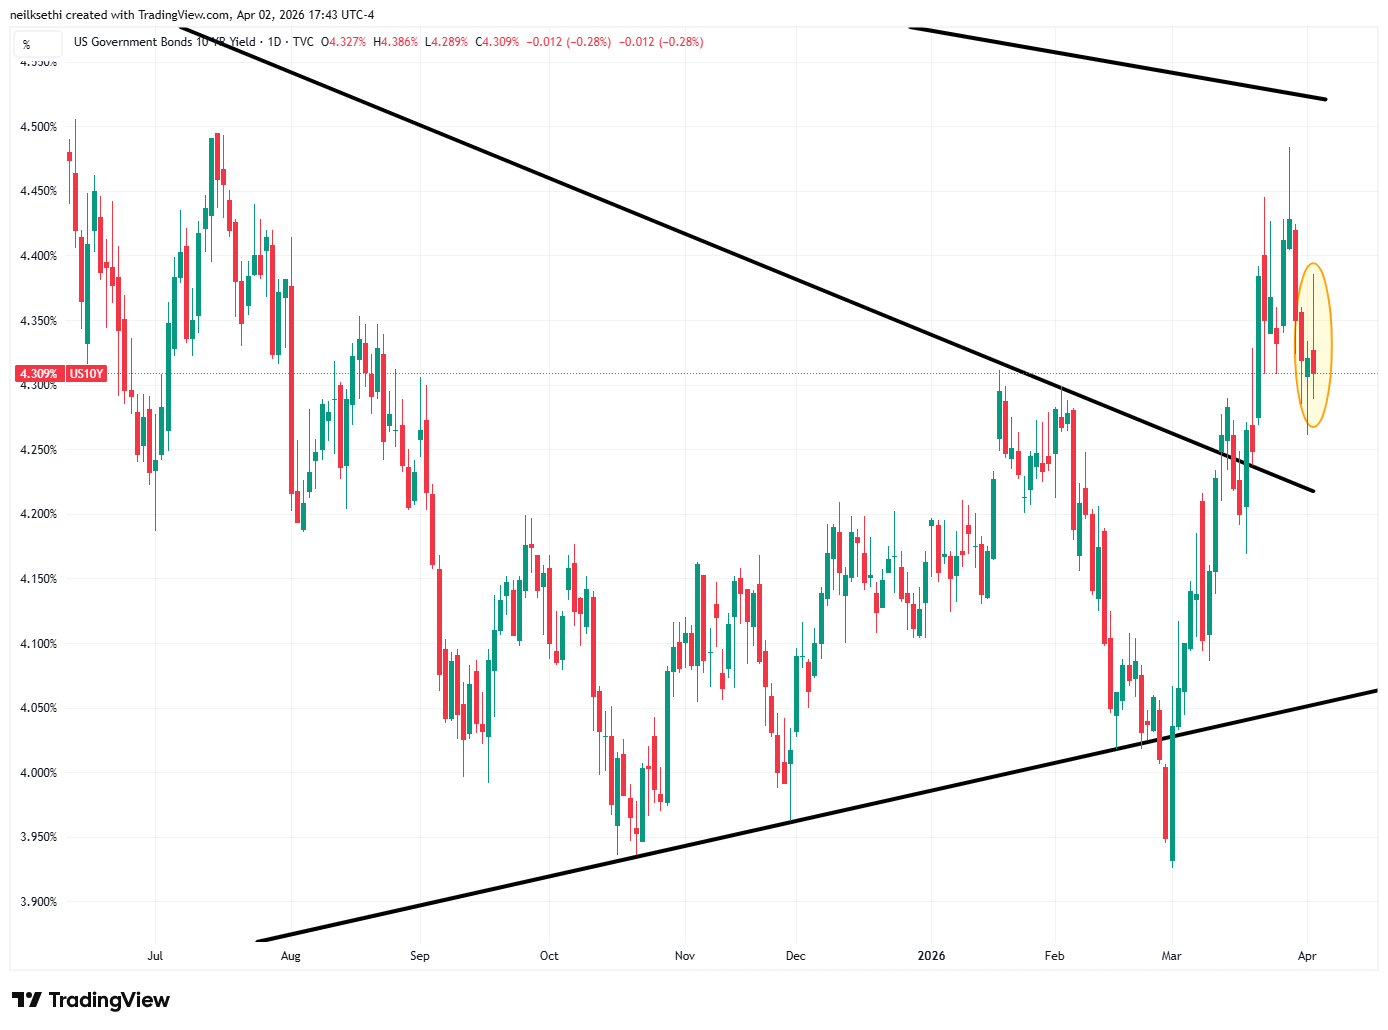
The 10yr UST yield started higher but fell back to end slightly lower at 4.31%, down -12bps from the highest since July. I had said Thursday we might test 4.5% and we touched 4.48% last Friday, close enough?
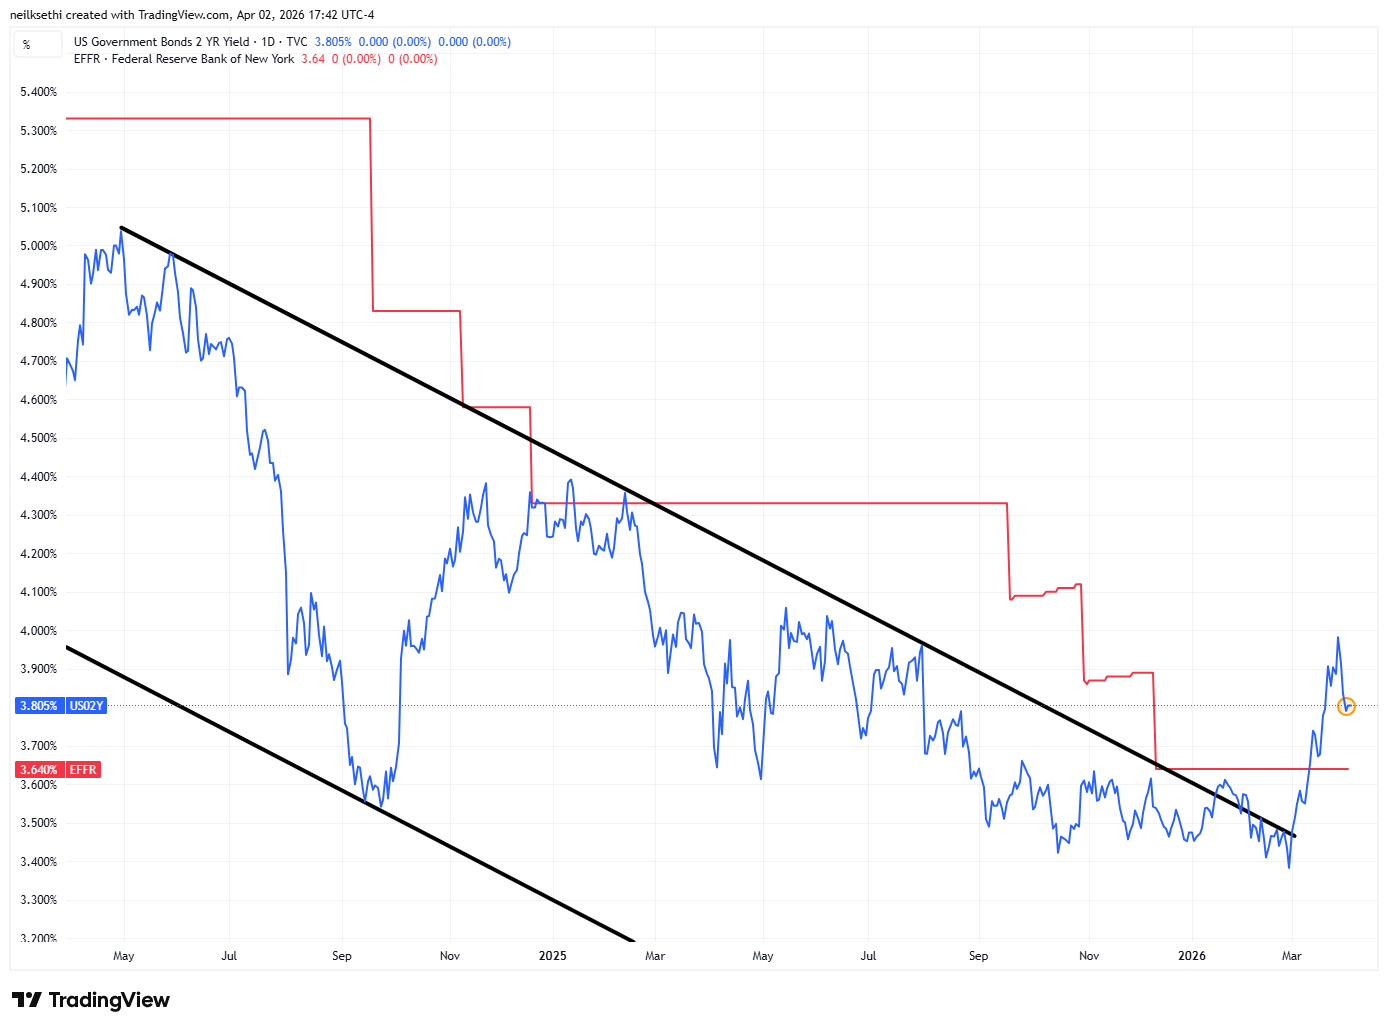
The 2yr yield, more sensitive to FOMC rate cut pricing, unchanged at 3.81% down -10bps from the highest since June hit last Friday, +20bps above the Fed Funds midpoint. Outside of recessions it is normally above by around +50bps on average, but BMO’s Ian Lyngan said over the weekend this is now consistent with very little pricing for rate cuts.
The Effective Fed Funds Rate (red line) remained at 3.64%.
I had mentioned on Mar 14th “this is now is an attractive yield unless we really aren’t going to get more than a couple more rate cuts (which is possible). I had said I don’t know that I want to buy 2-years at what is basically the 1-month yield, but now we’re above it, so I did buy some.” I had said after “I’ll probably look to add more if we revisit those levels,” and I did buy some Thursday and then again Friday. I’ll buy another slug at 4%. Seems like I might not get the chance now.
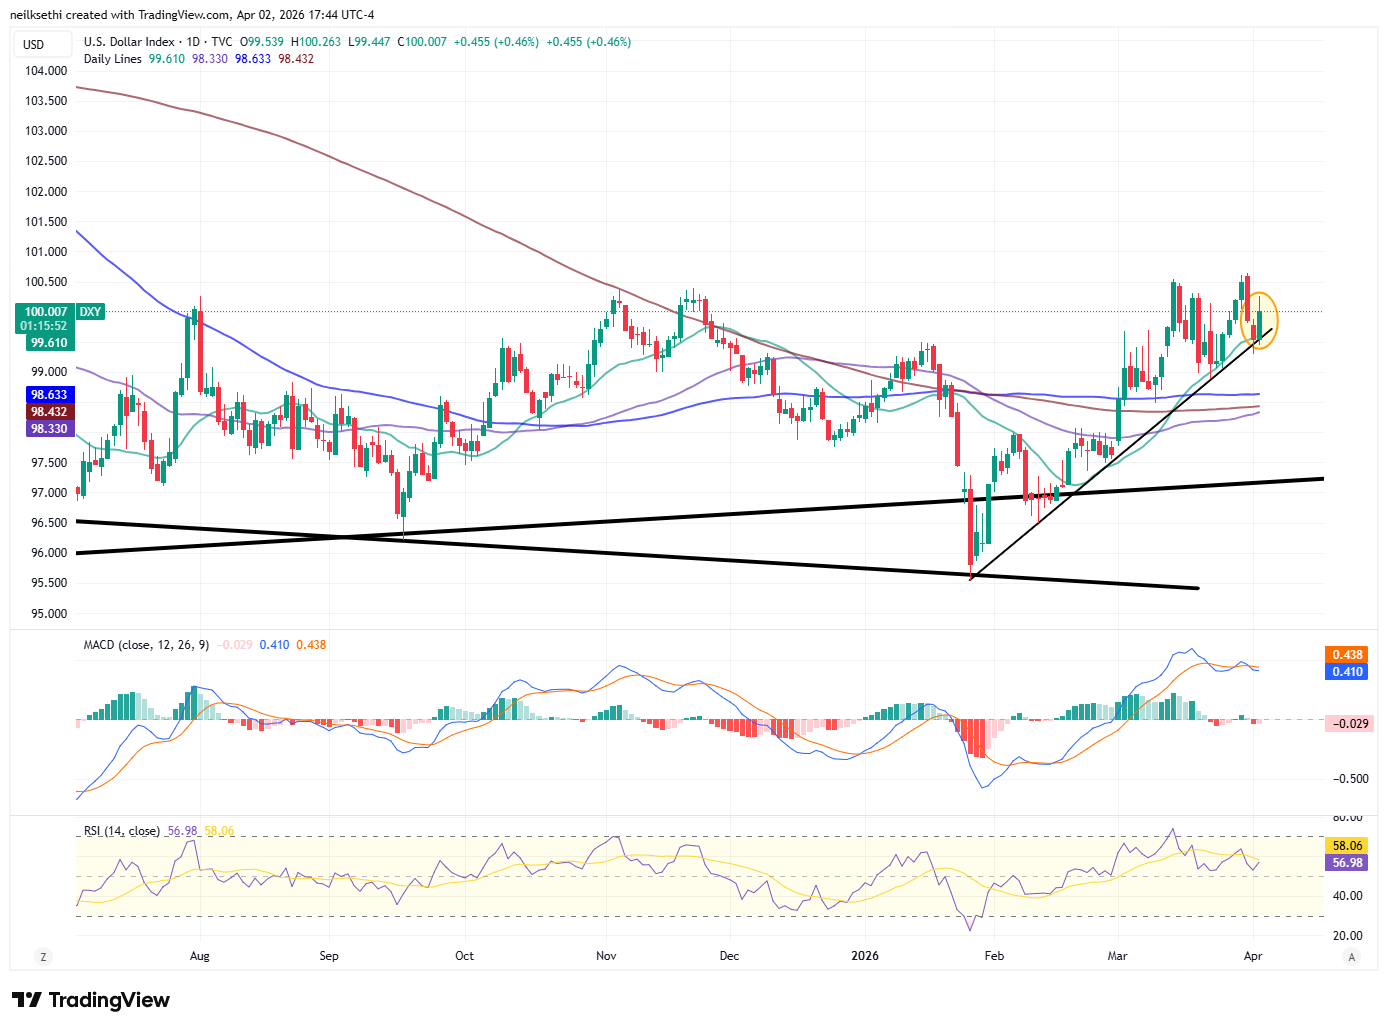
The $DXY dollar index (which as a reminder is very euro heavy (57%) and not trade weighted) bounced once again from its uptrend line from the Jan lows. I’ve said since the start of March, “it remains above all its major moving averages I track,” but as mentioned Tues, the MACD and RSI have fallen back towards more neutral levels.
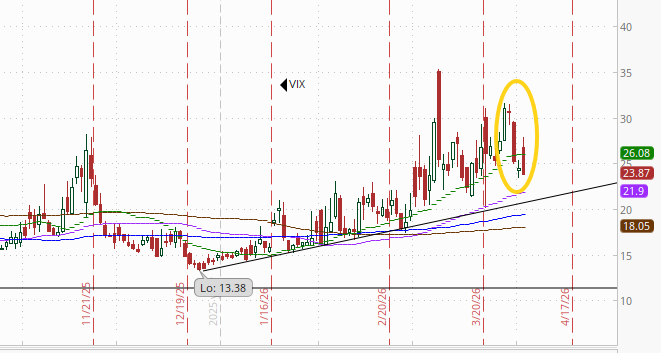
VIX fell for a fourth session to the lowest close in two weeks but still a little elevated at 23.9. The current level is consistent w/~1.50% average daily moves in the SPX over the next 30 days.
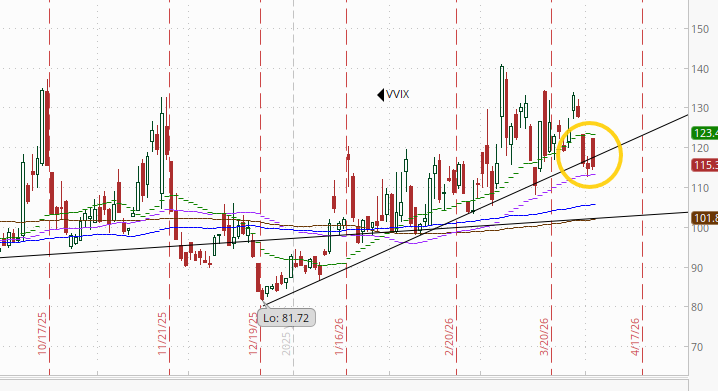
The VVIX (VIX of the VIX) little changed at 115.3, remaining under its uptrend line from the December lows. As I mentioned Wed, '“We’ll see if it falls further which will be a good indicator of the VIX likely following.”
The current level is still consistent with “elevated” daily moves in the VIX over the next 30 days (historically, normal is 80-100, but we’ve been above 90 most of the time since July ‘24)). Above 100 is the level flagged by Charlie McElligott as indicating higher stress.
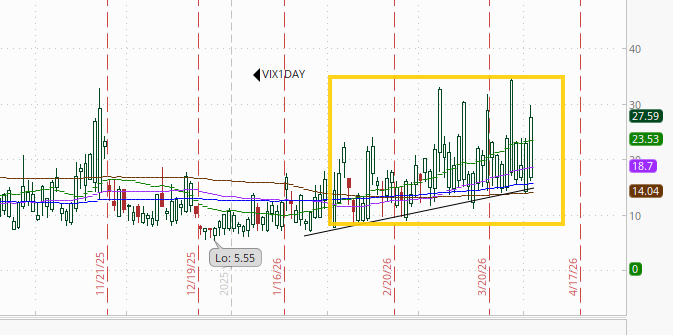
With a 3-day weekend ahead, the 1-day VIX jumped higher to 27.6, but that’s interestingly the least of any pre-weekend read since the start of the Iran conflict (despite having an extra day). That is still consistent with a move of 1.72% in the SPX next session.
WTI jumped back above $100 to the highest close since 2022.
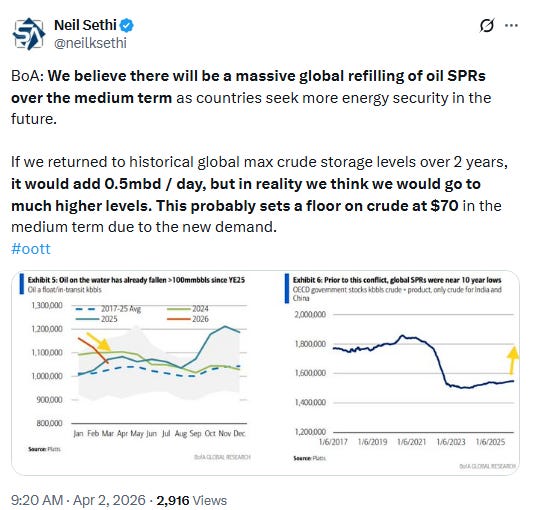
Gold futures (/GC) fell back for the first time this week.
Despite the down session, the daily MACD flipped to a “cover shorts” reading, and I had noted a week ago the RSI moved from under 30 (for the first time since Oct ‘23) to over, which can be evidence of a reversal, which we’d finally seen.
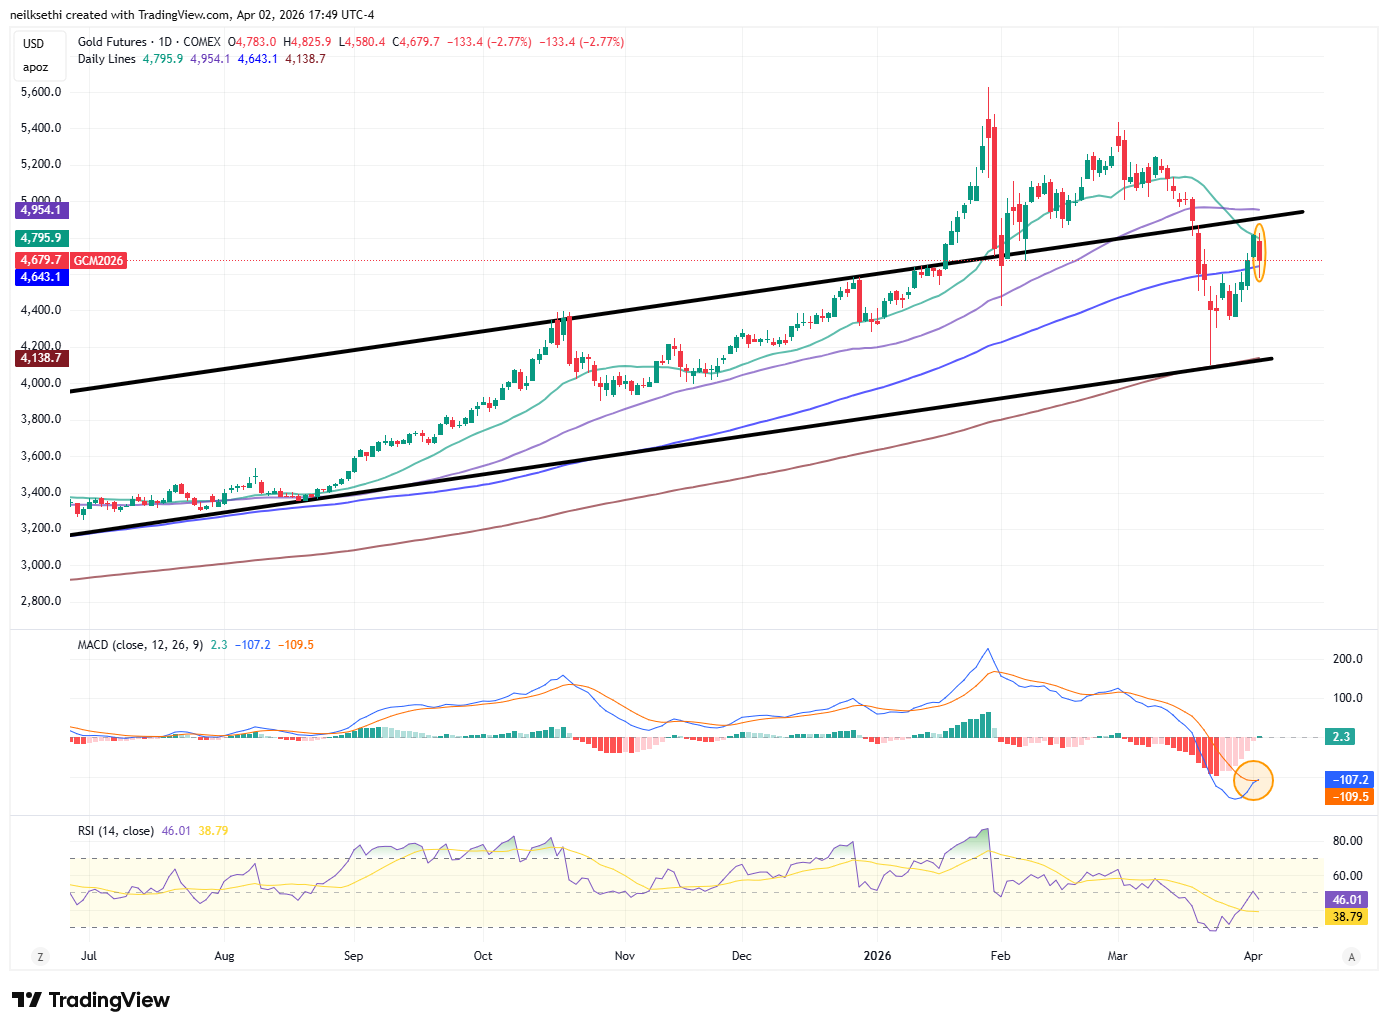
US copper futures (/HG) also fell back. As noted Thursday, the daily MACD has also flipped here to “cover shorts” positioning, but the RSI is still under 50.
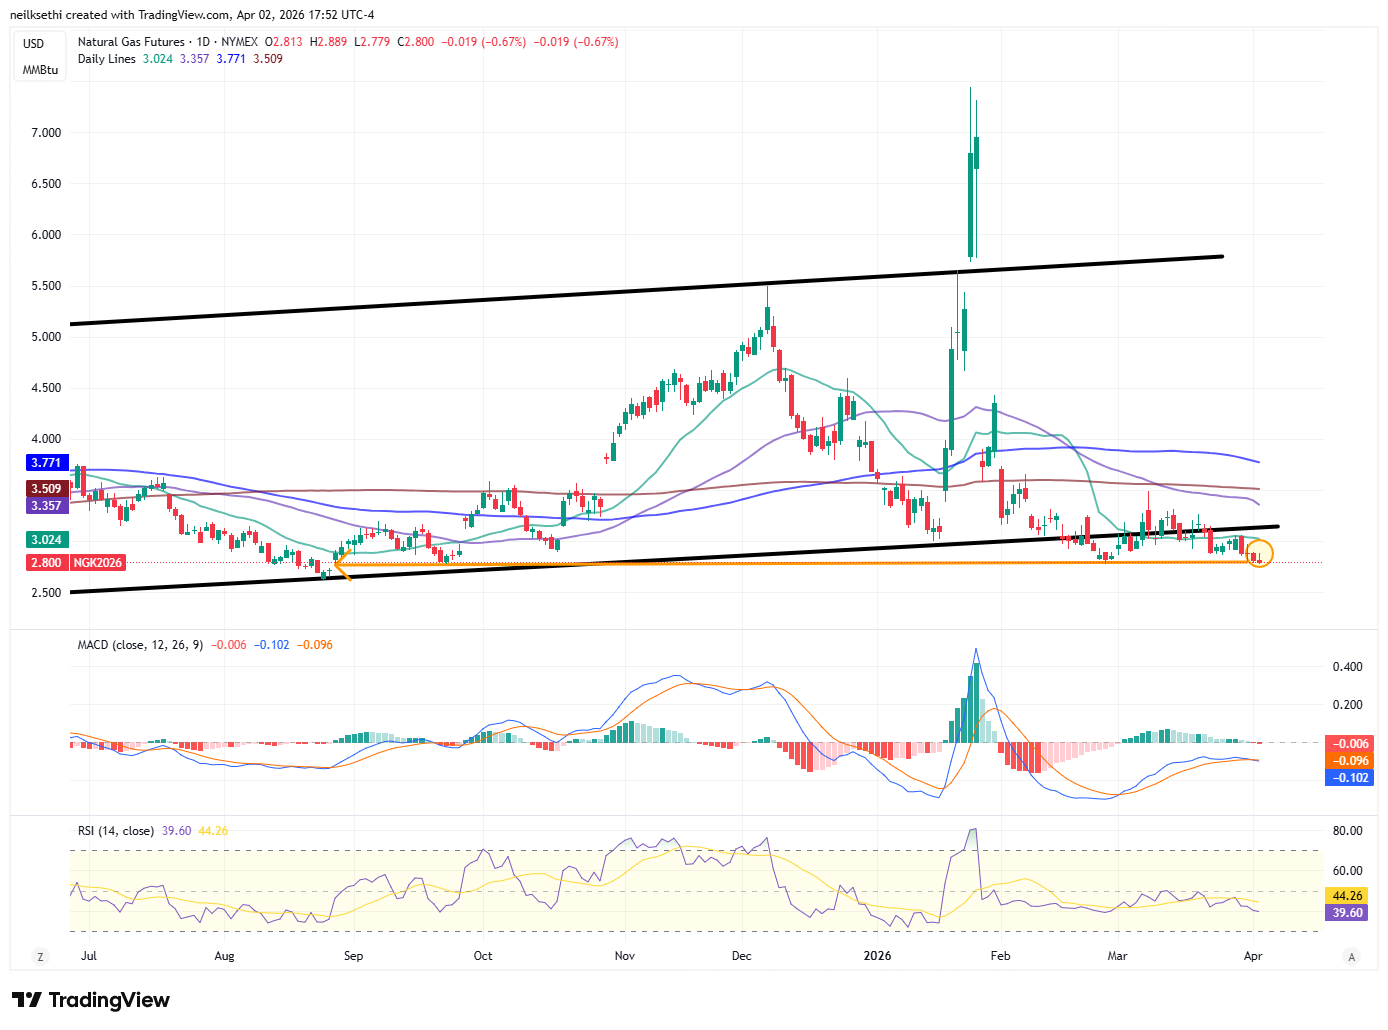
Natural gas futures (/NG) edged to the least since August. The daily MACD as mentioned Wed has crossed to “go short” positioning, and the RSI is now under 40.
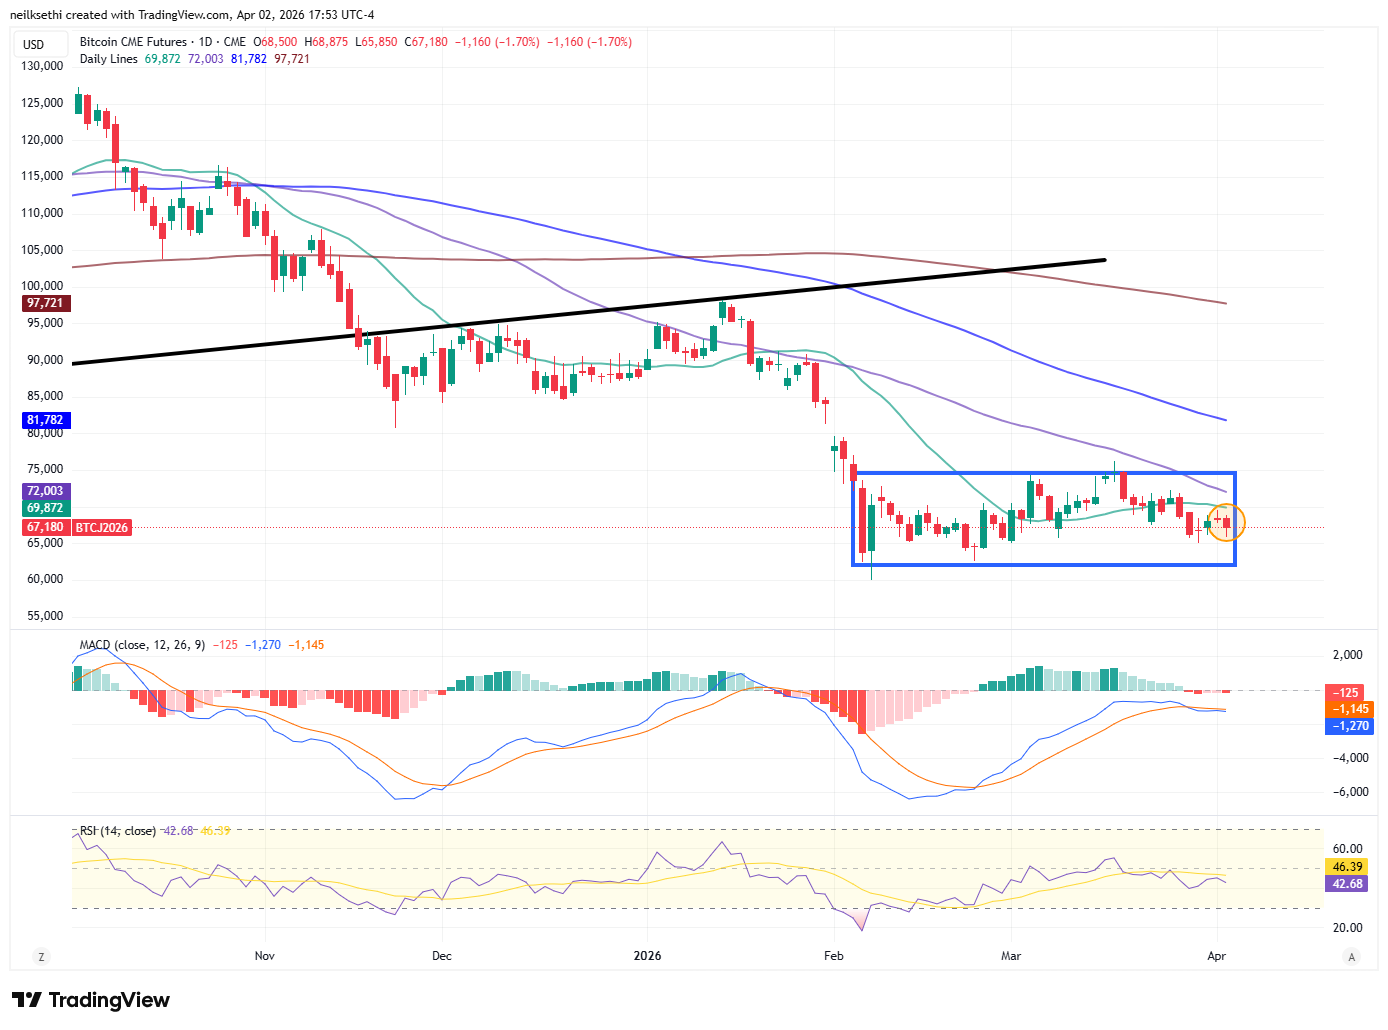
Bitcoin futures fell back remaining in their the range since the start of February (the blue box). The daily MACD as noted Friday has crossed over to a mild “go short” reading, and the RSI is under 50.
The Day Ahead
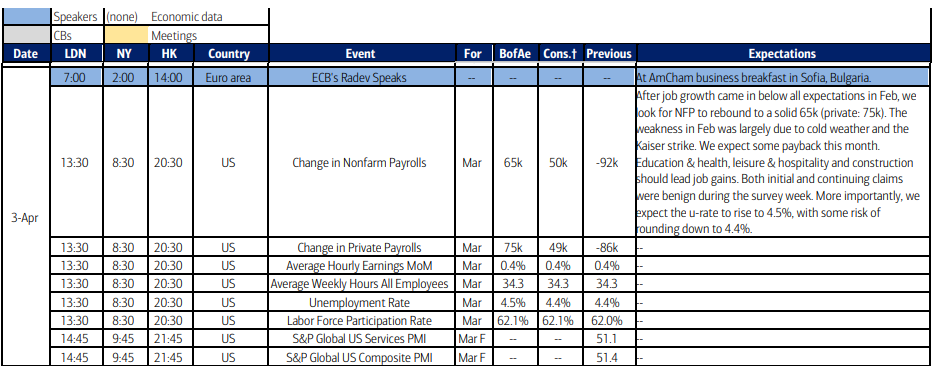
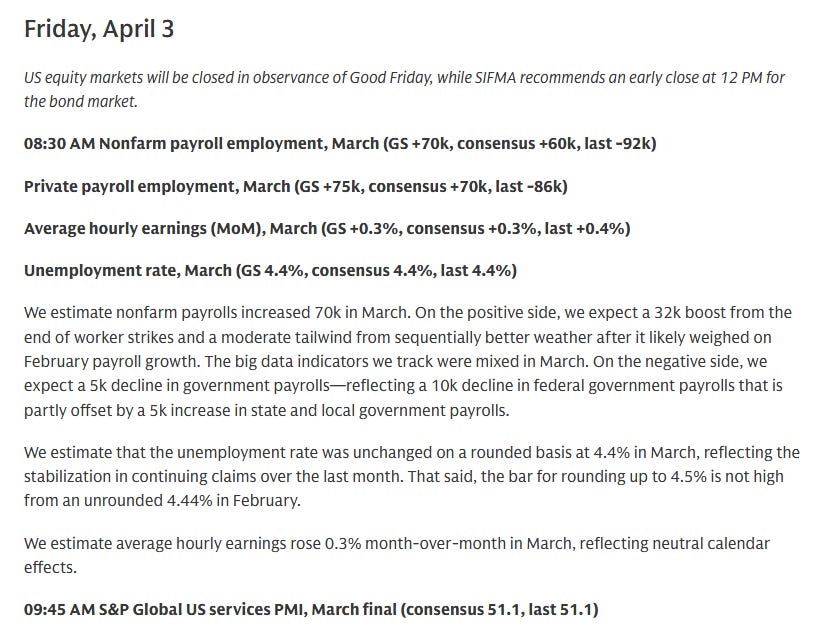
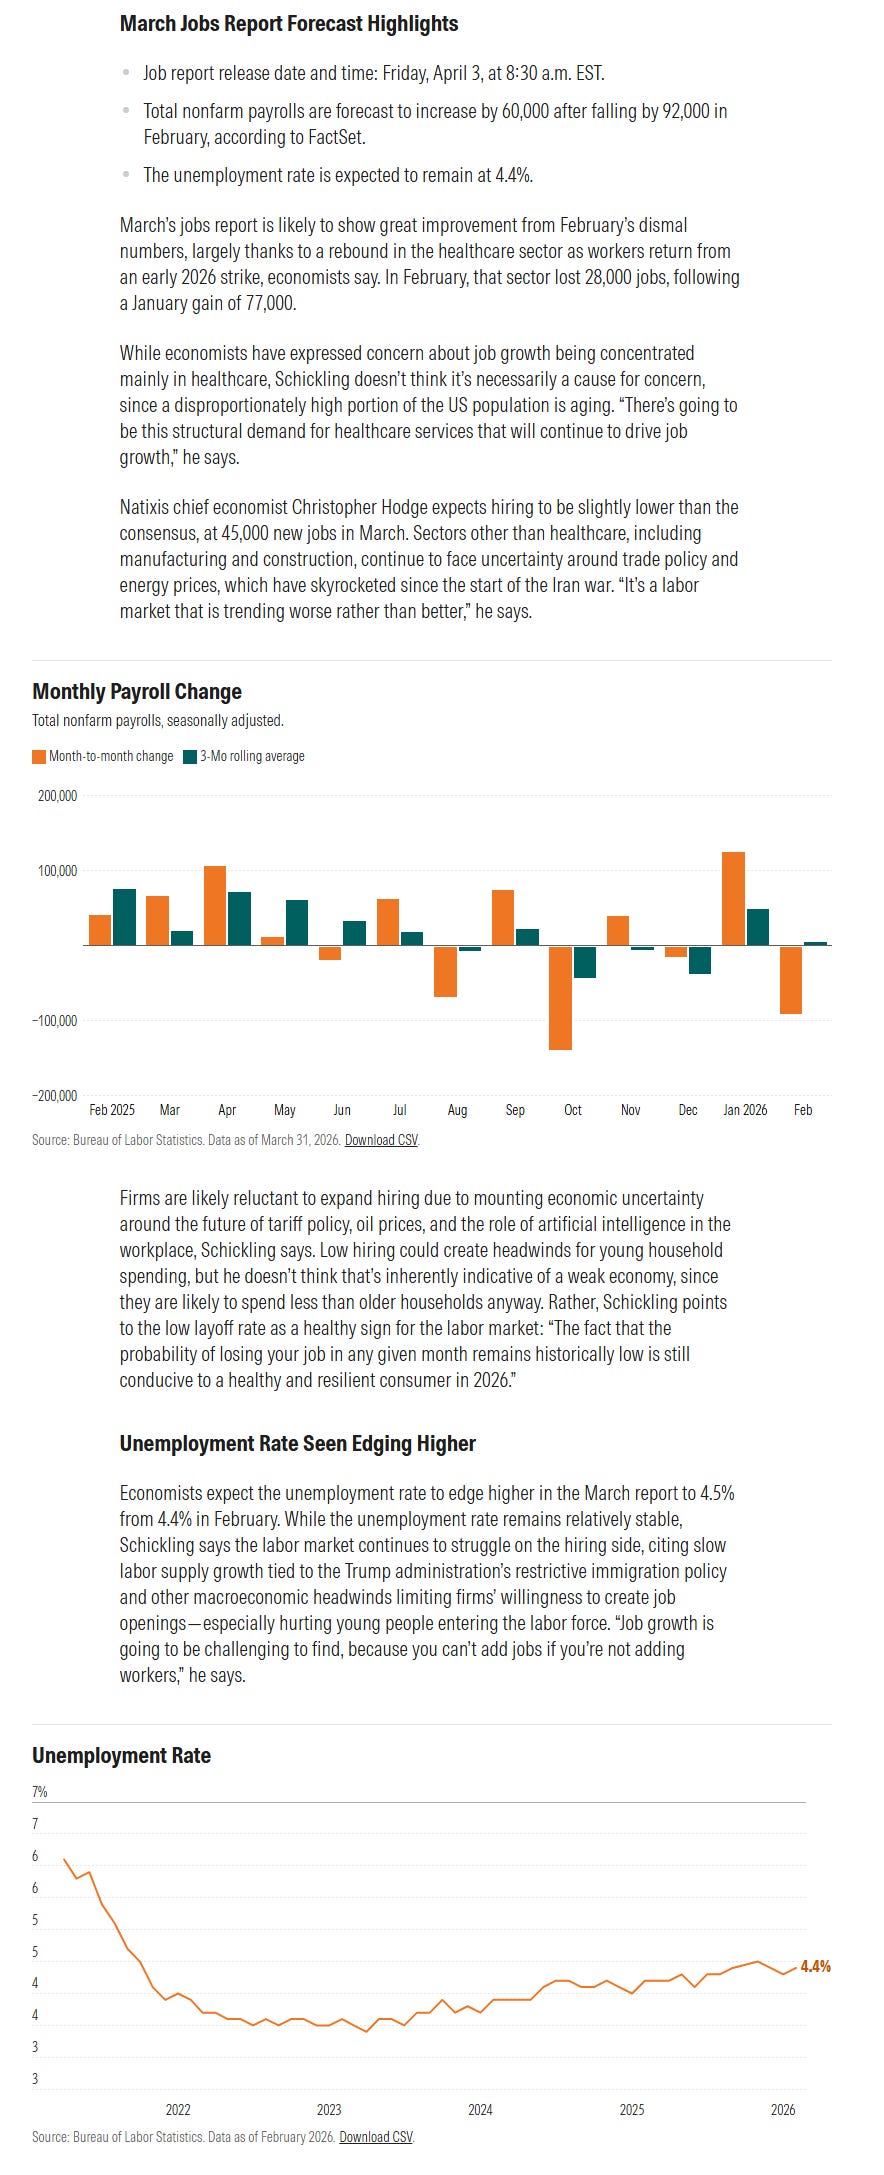
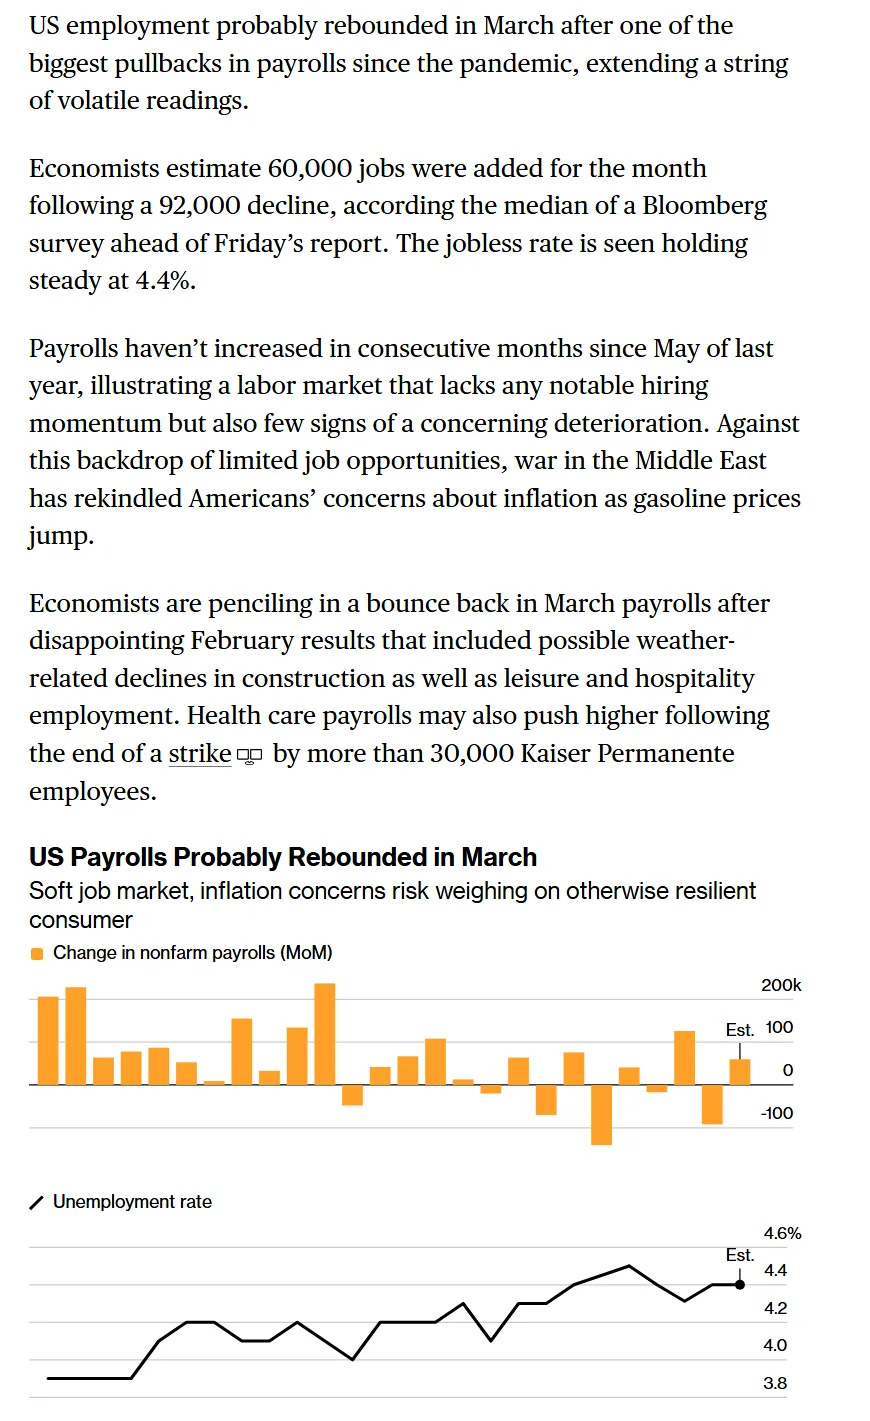
While US (and many ex-US) equity markets will be closed Friday (bond markets will have a half-session) US economic data continues with our most watched report of the month in the Employment Situation survey for March. We’ll also get S&P services PMI (ISM is Monday).
Nothing else on the docket in the US and very little ex-US (services PMIs in Japan and China). List of countries with holidays below.
Link to X posts - Neil Sethi (@nelksethi) / X
To subscribe to these summaries, click below (it’s free!).
To invite others to check it out,