
Markets Update - 4/6/26
Update on US equity and Treasury markets, US economic data, the Fed, select commodities and a look at the upcoming day with charts!

Similar to the Week Ahead, I am going to rework the nightly Markets Update to make it more streamlined and hopefully more useful. I’ve made today’s version open to all subscribers so you can see the format and give it a try. As always, feedback is welcome.
Quick Summary:
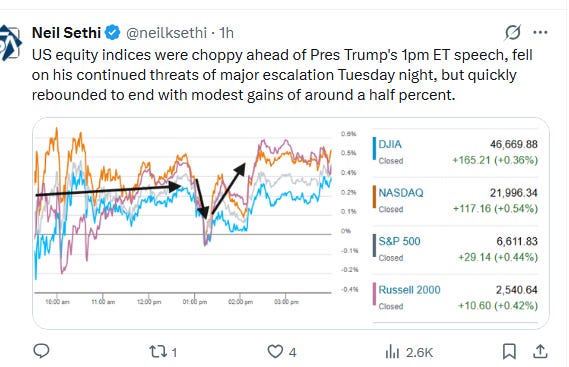
Equities fought through a choppy session to end with modest gains as headlines shifted all day between hopes for a near-term resolution on ceasefire talks to fears of a major escalation Tuesday evening.
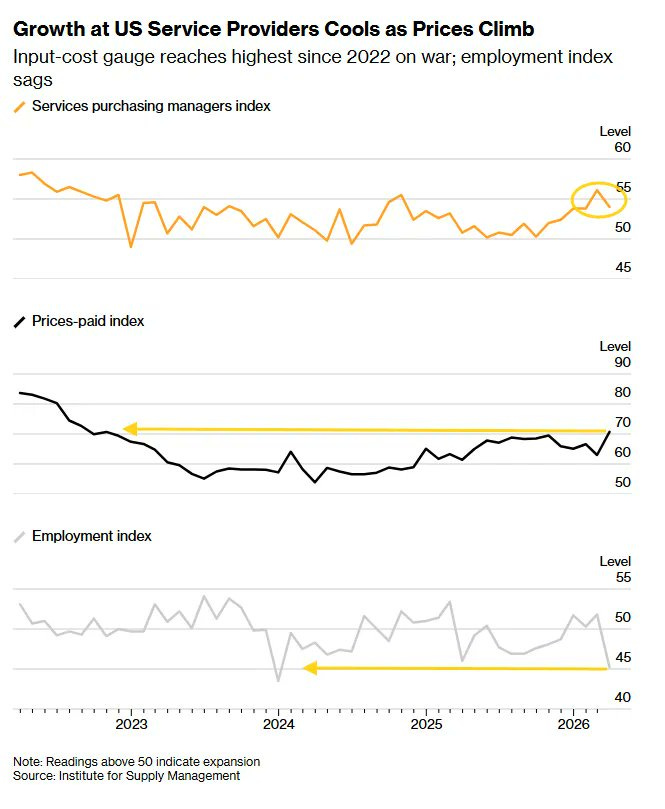
In US economic data we got the March ISM Services PMI indicating a mixed picture with orders increasing but output decelerating sharply, employment dropping by the most since 2023, and prices increasing by the most since 2022.
US equity indices opened trading for the week modestly higher after a news-filled weekend as detailed in this morning’s opener. Equities would maintain their modest pre-market gains (albeit in choppy fashion) ahead of Donald Trump’s 1pm press conference where he would both provide hopes for a near-term resolution (talks with Iran are “going well”) and fan fears of a major escalation Tuesday evening (if Iran does not agree to the US’s terms, the military could destroy “every bridge in Iran by 12 o’clock tomorrow night” and put every power plant “out of business”).
Not helping sentiment was Iran rejecting the current ceasefire proposal demanding a permanent end to the war, lifting of sanctions, reconstruction efforts, and protocol for safe passage through Hormuz, according to the state-run Islamic Republic News Agency. In addition, the ISM Service sector PMI would soften and indicate a sharp decline in employment growth and rise in prices.
Still equities would rebound to finish near the highs of the day with decent gains of around a half percent.
Elsewhere, bond yields edged higher, while crude prices were little changed as were gold, copper, and US natural gas. Bitcoin though rose (all covered in the subscriber section with charts).
The market-cap weighted S&P 500 (SPX) was +0.5%, the equal weighted S&P 500 index (SPXEW) +0.4%, Nasdaq Composite +0.5% (and the top 100 Nasdaq stocks (NDX) +0.6%, the SOXX semiconductor index +1.0% (up 10% the last three sessions), and the Russell 2000 (RUT) +0.4%.
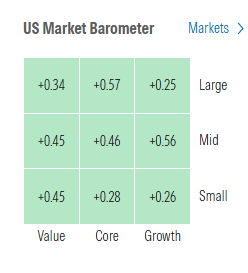
Morningstar style box saw mild gains across the box again Monday.
Market commentary:
“This mix of coercion and negotiation leaves the market without a stable reference,” said Sergio Avila, senior market analyst at IG Group in Madrid. “The rebound makes tactical sense, but it doesn’t yet signal a solid improvement in the macroeconomic and financial outlook.”
“The question is whether or not a more favourable outcome can be reached without another round of exchanges that can potentially narrow the path to lower intensity conflict in the medium term,” said Homin Lin, senior macro strategist at Lombard Odier, adding that investors will be careful with trading from headline to headline. If Trump follows through on targeting Iran’s power grid and civilian infrastructure, risk assets may face another leg lower, Lin added. “As long as the anxious wait for Iran end-game clarity continues, markets will likely remain volatile.”
“As the conflict with Iran enters its sixth week persistent concern about the time it will take to arrive at an effective resolution to the conflict will, however, likely remain for now as a negative overhang for market participants to navigate,” said John Stoltzfus, chief investment strategist at Oppenheimer Asset Management. “We remain positive in our outlook for the markets and the US economy this year with ‘resilience’ the operative word for providing the market with enough opportunities to climb the proverbial ‘wall of worry,’” he added.
“It’s clearly too early for market watchers to stop thinking about geopolitical risk,” said Jeff Buchbinder at LPL Financial. “For now, we believe the best course of action for investors is to be patient.”
“People are finally getting around to the idea that we are at war,” said Cindy Beaulieu, chief investment officer at Conning North America, speaking in the wake of Trump’s Wednesday night address on Iran. Beaulieu pointed to the significant buildup of U.S. troops “ready to go, if needed,” the U.S. air assault against Iran since Feb. 28, as well as Trump’s comments Wednesday around another “two to three weeks” to complete the military’s objectives. What was “billed as a four-to-six weeks type of thing,” now sounds like it could last through late April, she said.
“The market may be underestimating the magnitude of the disruption in the world economy,” said Michael Rosen, chief investment officer at Angeles Investments. The “immediate and intermediate impact of the energy disruption is, I think, likely to be under appreciated by the markets, meaning energy prices staying higher for longer.”
“The question every institutional investor is asking themselves seems to be why we haven’t sold off harder, or had anything remotely close to a ‘capitulation’ day after 5 weeks of Hormuz being effectively closed. I’m as surprised as anyone, but my best guess is very strong economic momentum in early 2026 (including March data released last week), and an oil curve that is quite ‘backwardated’, which seems to be soothing credit and equity markets,′ wrote Tavis McCourt, institutional equity strategist at the firm, in a note dated Sunday. “The next hurdle for this market is the next Trump deadline for a deal with Iran this Tuesday evening,” he continued.
Stocks are now seeing “light at the end of the Middle East tunnel” as President Trump showed optimism around the Iran conflict, according to José Torres, senior economist at the Interactive Brokers.
While investors have been fixated on geopolitical risks, the macro data continues to point to a resilient economy and a still-constructive earnings outlook, according to Mark Hackett at Nationwide.
“I think what’s the most interesting is throughout this period, strategists have been raising their earnings estimates. They actually expect earnings to grow 20% this year, and at the same time, the S&P 500 market multiple has gone from 23 times to 19 times,” Stephanie Link, chief investment officer at Hightower Advisors told MarketWatch on Monday.
“A prolonged struggle over the Strait of Hormuz into May and June would markedly darken the outlook for the US and the global economy,” Jeff Roach at LPL Financial said. “For now, given last Friday’s payroll numbers, Fed policymakers have the luxury of remaining in ‘wait and see’ mode.”
“March’s gangbuster payrolls print and lower unemployment rate certainly don’t boost the case for the Fed to resume cutting rates anytime soon. Data this coming week also won’t likely make the case for rate reductions.” - BBG Economics
Some posts from the weekend/Monday:
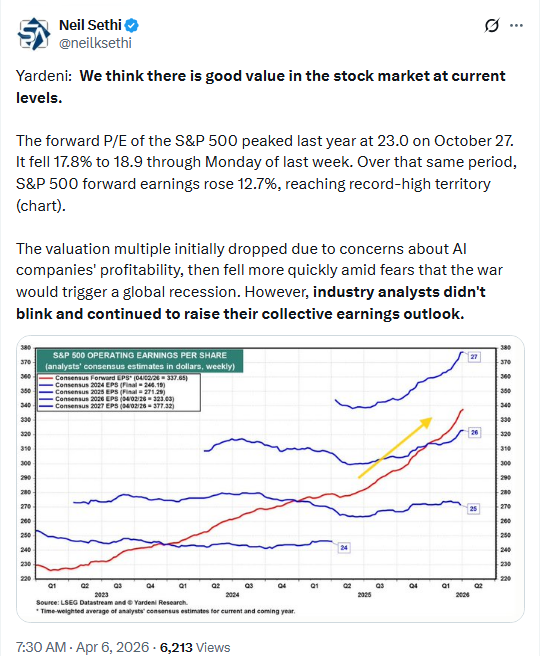
Ed Yardeni remains constructive:
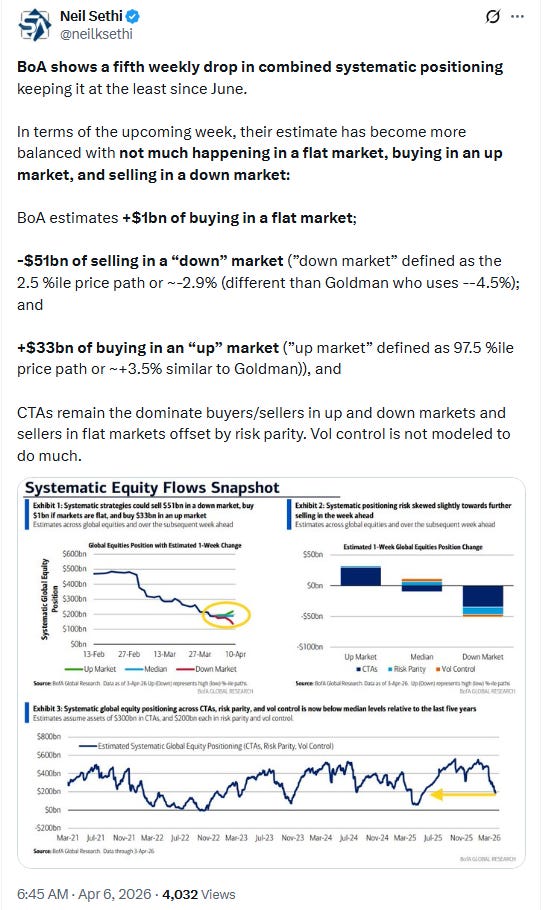
BoA models systematic traders as not doing much this week in a flat market but buying/selling modestly on up/down markets (but note the large moves required):
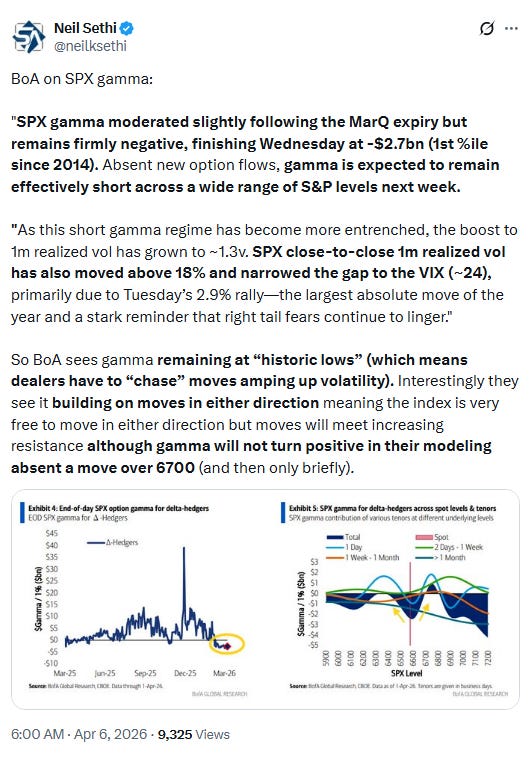
BoA on gamma (which directly impacts volatility):
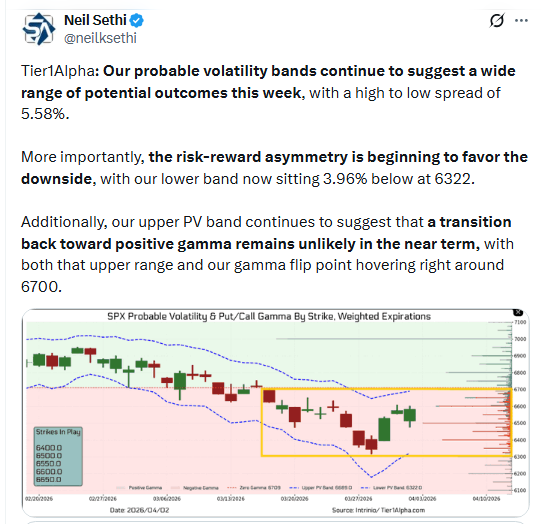
Tier1Alpha on the wide distribution of outcomes that negative gamma creates:
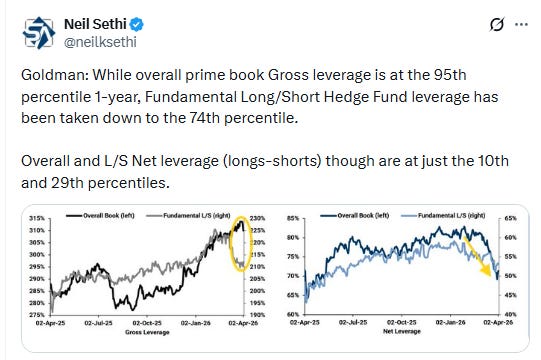
Goldman says hedge funds and institutions continue to pare back the net equity exposure.
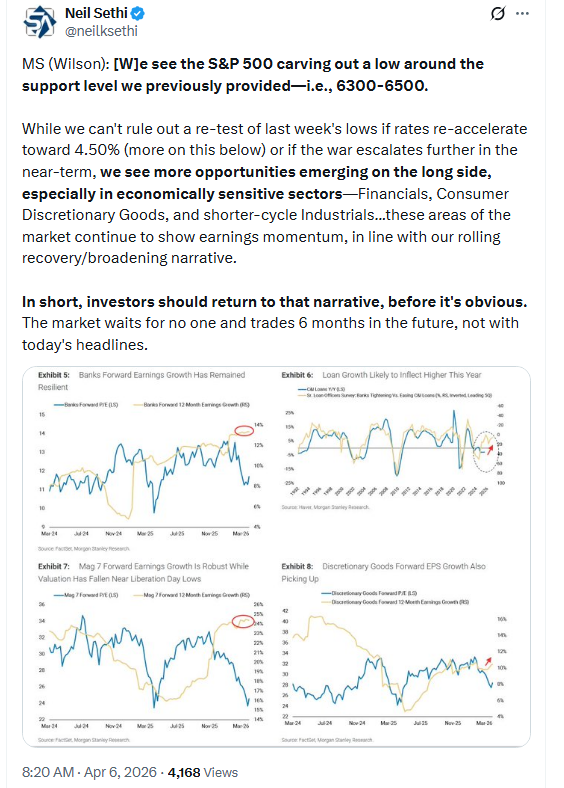
MS’ Mike Wilson is bullish but flags a rise in the 10-year to 4.5% or further escalation in the conflict as key risks:
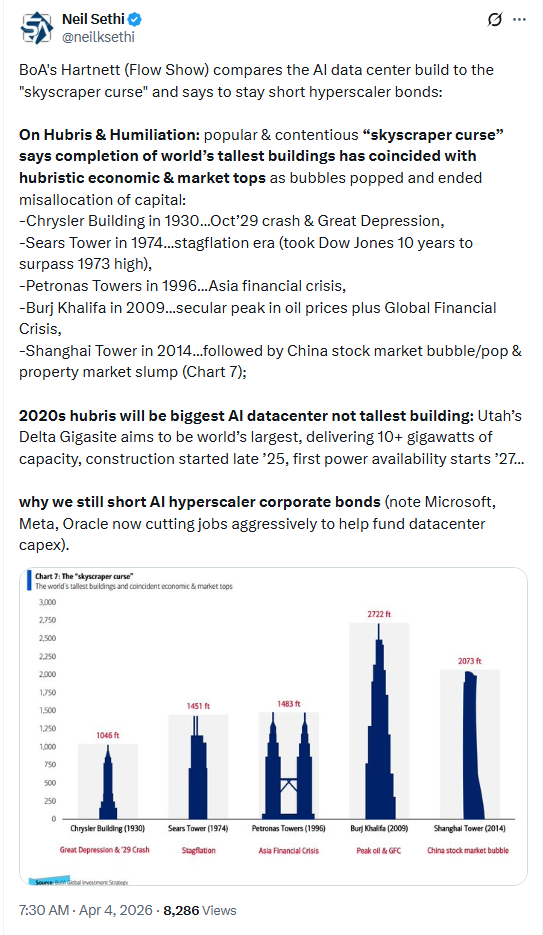
BoA’s Hartnett compares the AI center buildout to the “skyscraper curse”":
Link to X posts - Neil Sethi (@neilksethi) / X for full posts/access to charts.
Corporate news from BBG:
A Goldman Sachs Group Inc. private credit fund said investors sought to pull just under 5% of their cash in the first quarter, narrowly escaping a broader exodus that has forced peers to cap withdrawals.
Oracle Corp. named Schneider Electric SE executive Hilary Maxson as its chief financial officer to help the company navigate massive data center development plans and an accompanying cash crunch.
AMC Entertainment Holdings Inc. saw a surge in ticket sales and concessions over the long Easter weekend, buoyed by The Super Mario Galaxy Movie.
Neurocrine Biosciences Inc. agreed to buy Soleno Therapeutics Inc. for $2.9 billion to expand in rare genetic disorders.
Madison Air Solutions Corp. is seeking to raise as much as $2.23 billion in its initial public offering, in what would be the biggest US listing of an industrial company in close to three decades.
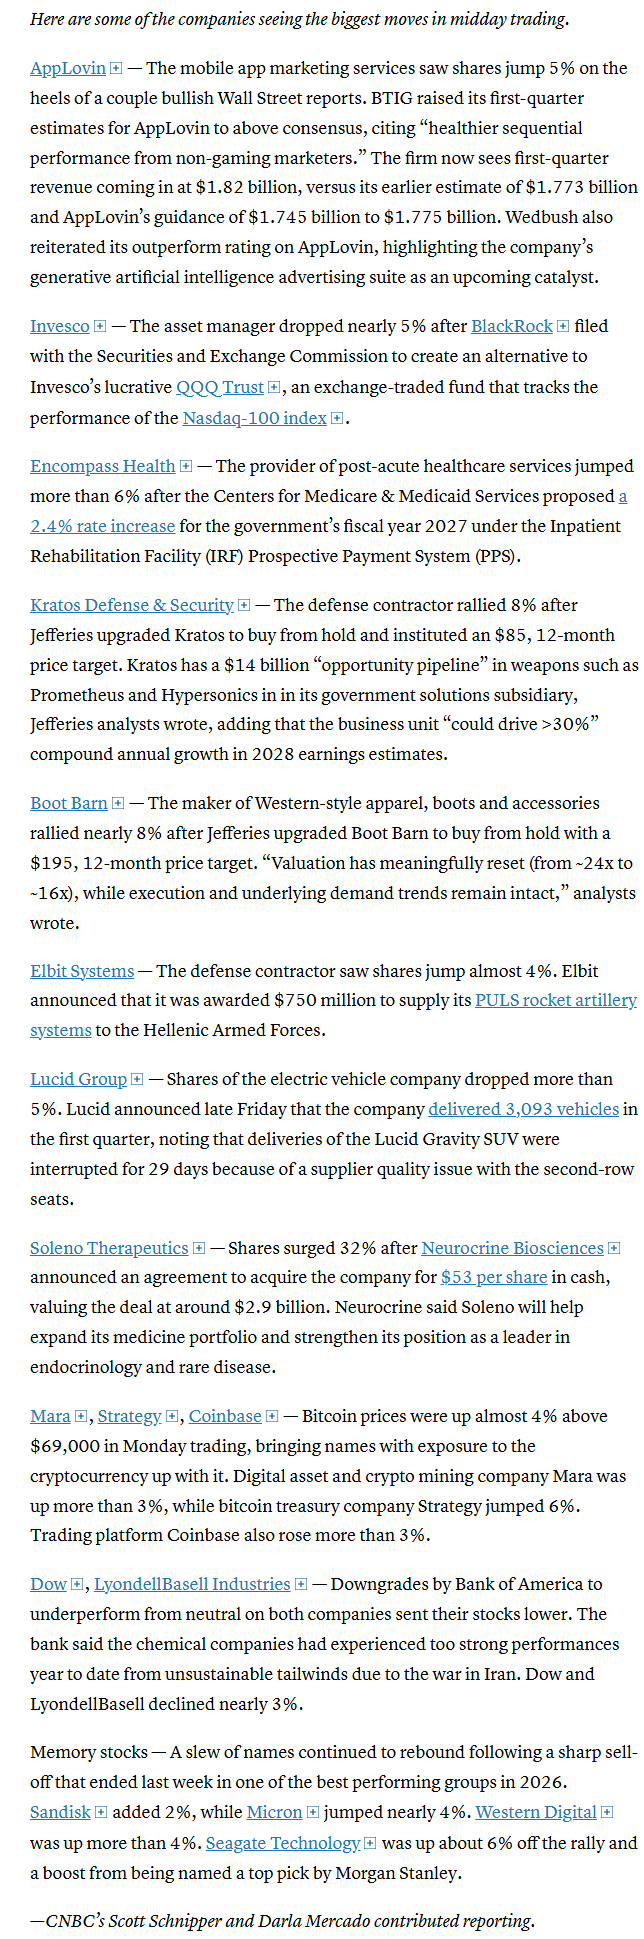
Mid-day movers from CNBC:
In US economic data:
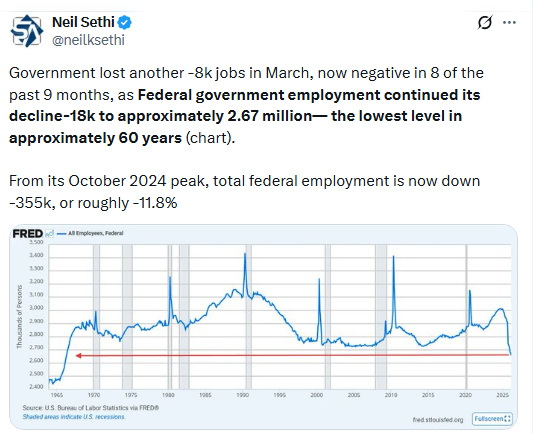
The main data release today was the ISM Services sector PMI which fell back from the highest since October 2024 despite new orders increasing the quickest since February 2023 as output and employment dropped sharply, the latter contracting the most since December 2023, while prices increased the most since October 2022 (with the acceleration the fastest in nearly 14 years).
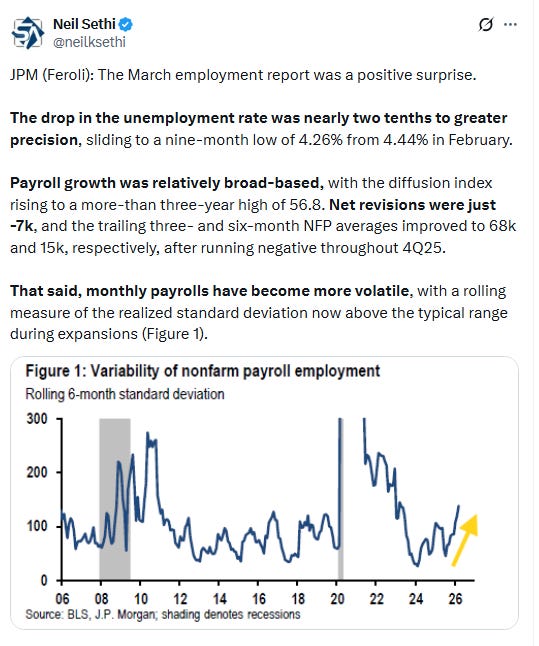
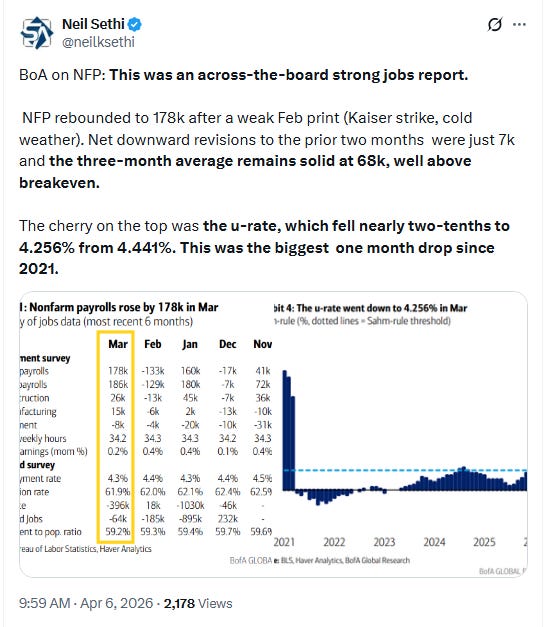
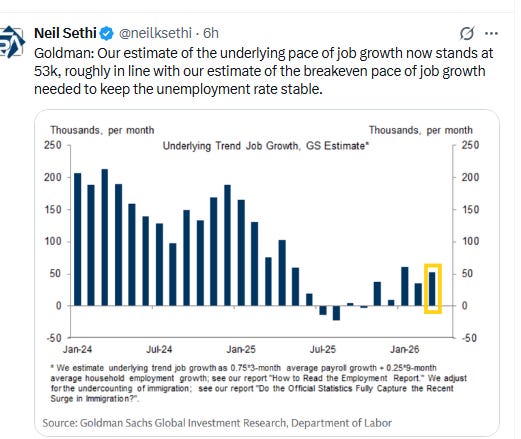
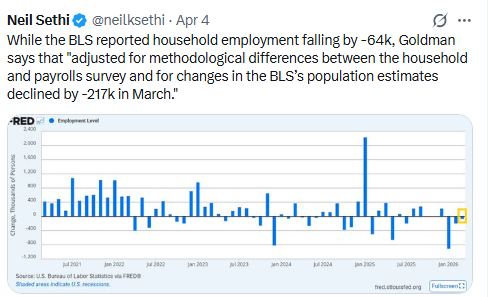
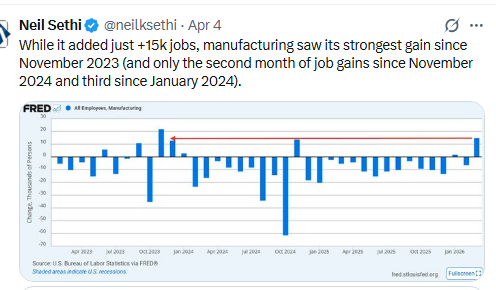
Some posts on Friday’s NFP report:
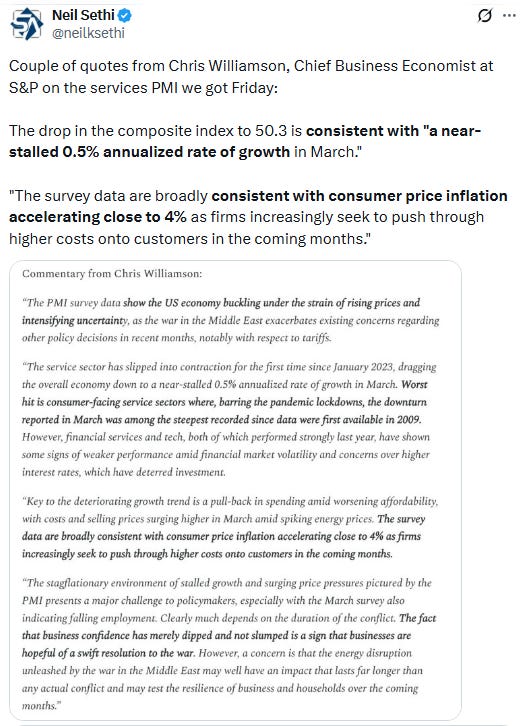
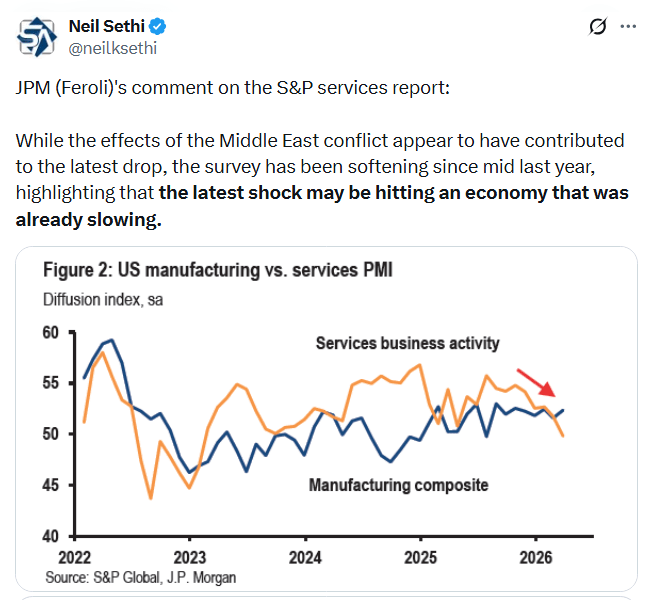
Some posts on the S&P service sector PMI Friday:
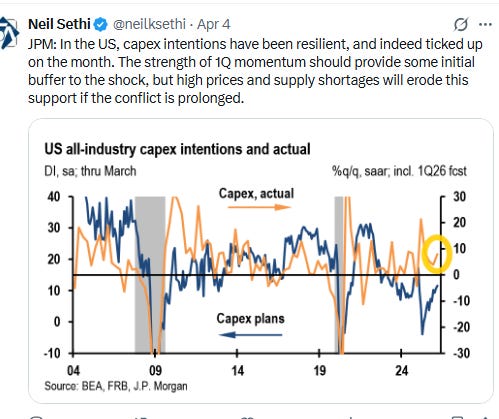
JPM says capex has been resilient but subject to price increases and supply shortages if the conflict lingers.
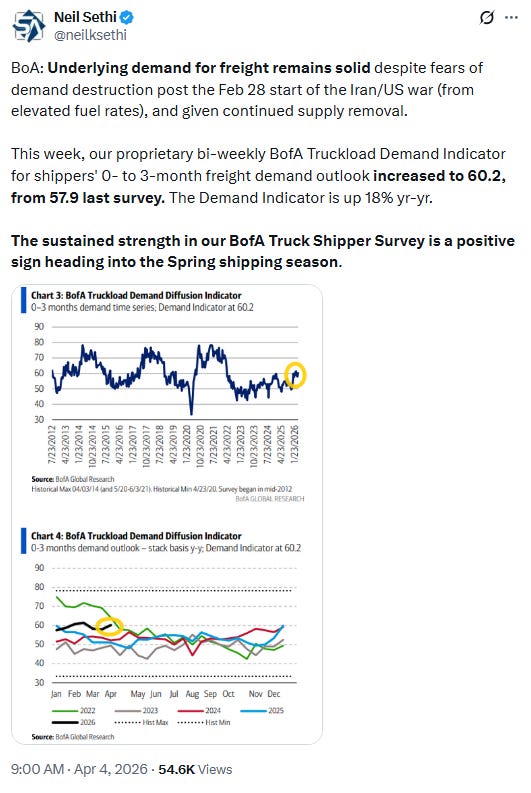
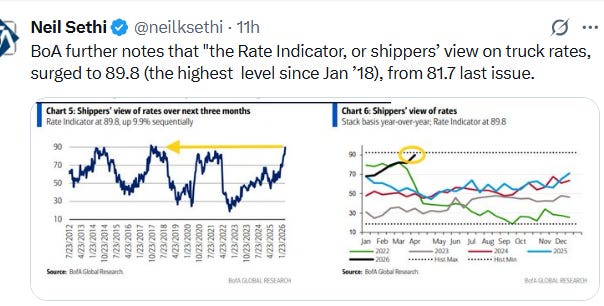
BoA on the continued positive inflection in trucking demand:
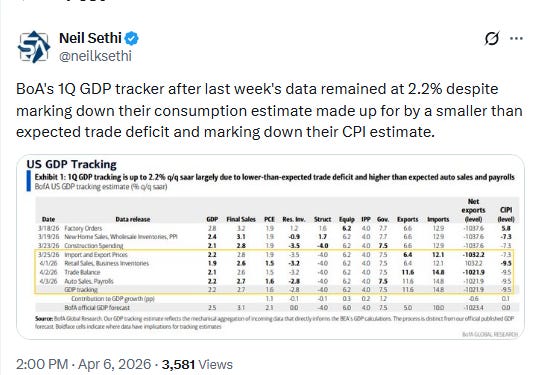
BoA on their Q1 GDP tracker:
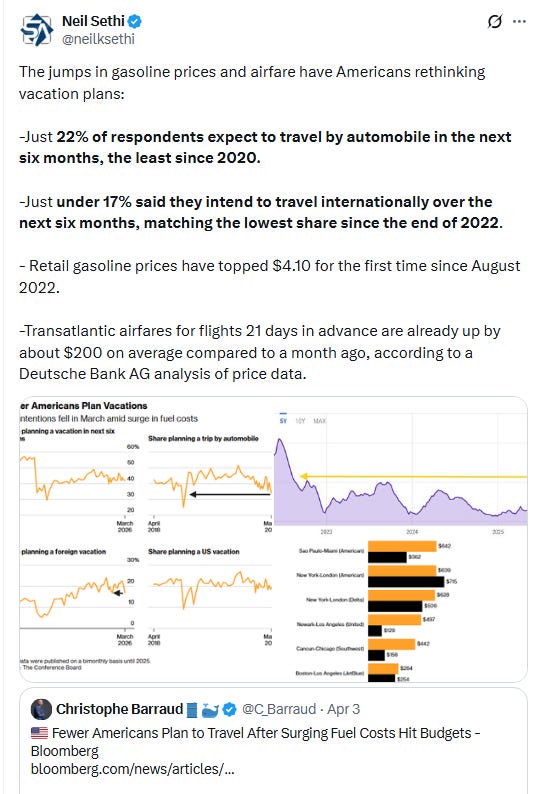
BBG on how higher gasoline prices and airfares are impacting vacation plans:
Link to posts for more details/access to charts - Neil Sethi (@neilksethi) / X
Note on all charts the lines are moving averages (the average price over various lookback periods (days on the daily charts, weeks on the weekly charts, etc.))”
20 = green
50 = purple
100 day = blue
200 day = brownMACD = Moving average convergence/divergence line, a measure of a momentum that compares longer term and shorter term momentum to gauge if a move is strengthening or weakening,
RSI = Relative Strength Index (basically what it sounds like) = measures the strength of the move comparing gains to losses over the given lookback window (I use the standard 14-periods)
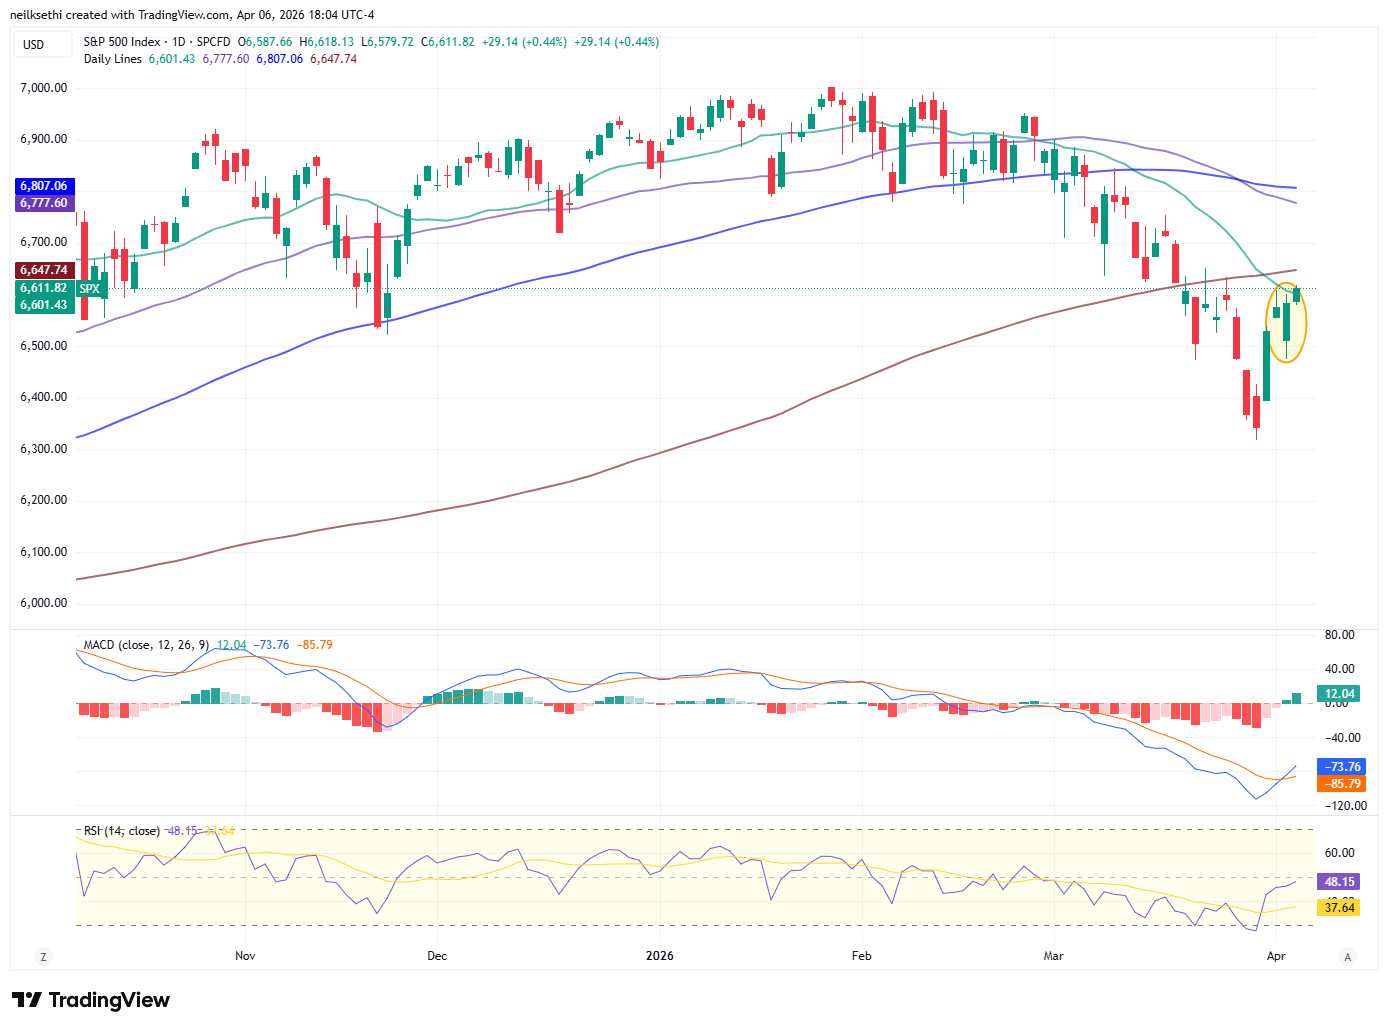
SPX edged higher, over the 20-DMA. The real test everyone is watching at this point though is the 200-DMA (brown line). If it can clear that, investors will turn their eyes higher looking for the 6800 level. Until then, they will remain (appropriately) cautious. As noted Thursday we did see the daily MACD turn more positive, and the RSI is not far.
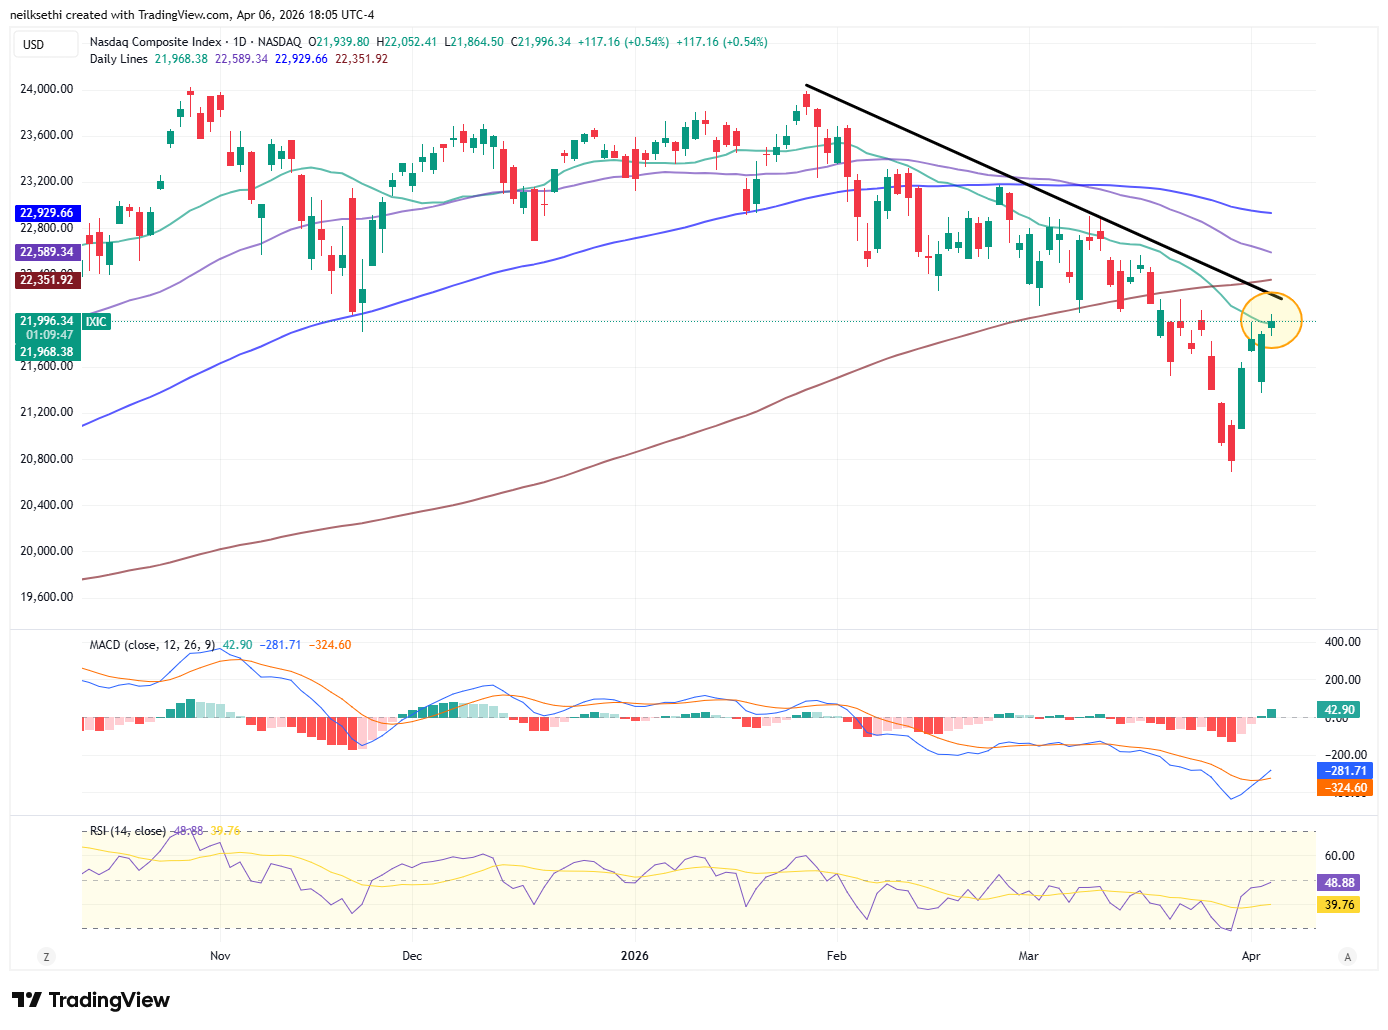
The Nasdaq Composite remains a similar story.
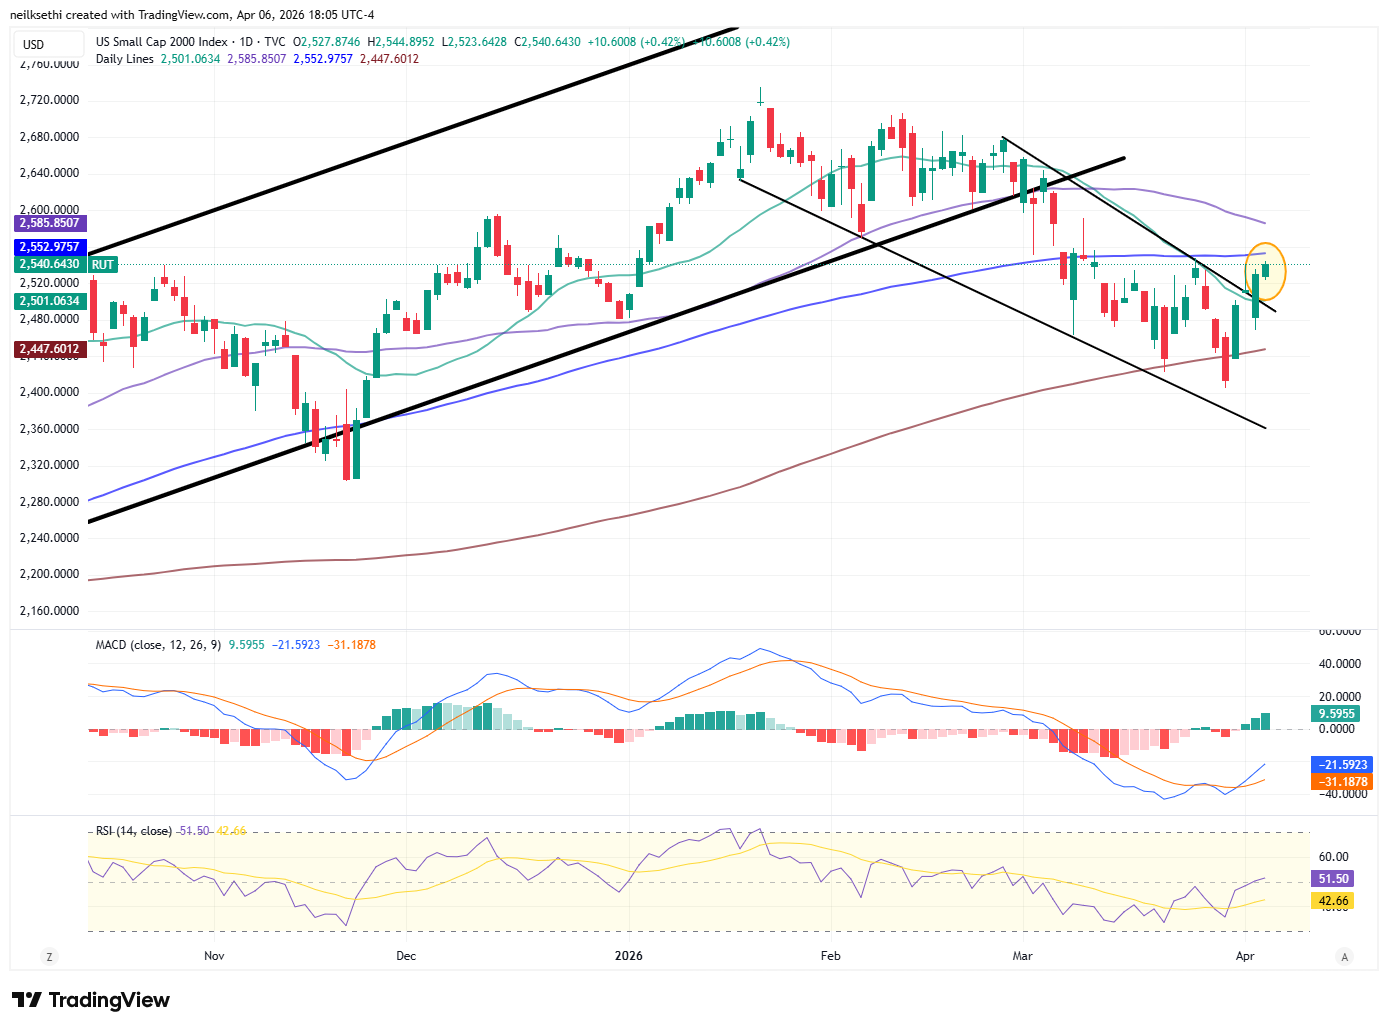
RUT (Russell 2000) I have described the past couple of weeks as “easily the best looking chart of the three,” and that continued Monday, now coming up on its 100-DMA. Its daily MACD and RSI as mentioned Wednesday are supportive.
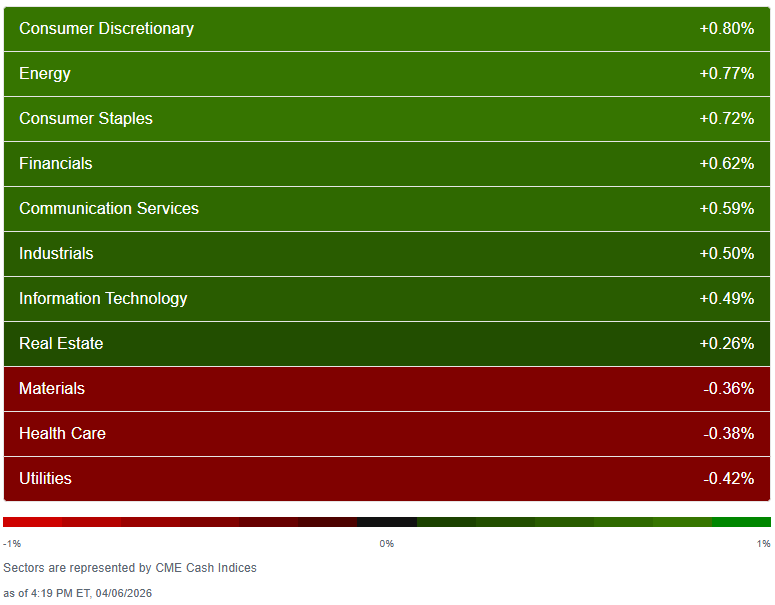
Sector breadth remained solid with 8 of 11 sectors higher (after 6 Fri, 8 Wed, 9 Tues, 8 a week ago), although none were up over 1% (the least in that span). Cons Discr led +0.8%. But seven sectors were up around a half percent or higher, while no sector was down that much (most was Utilities -0.4%).
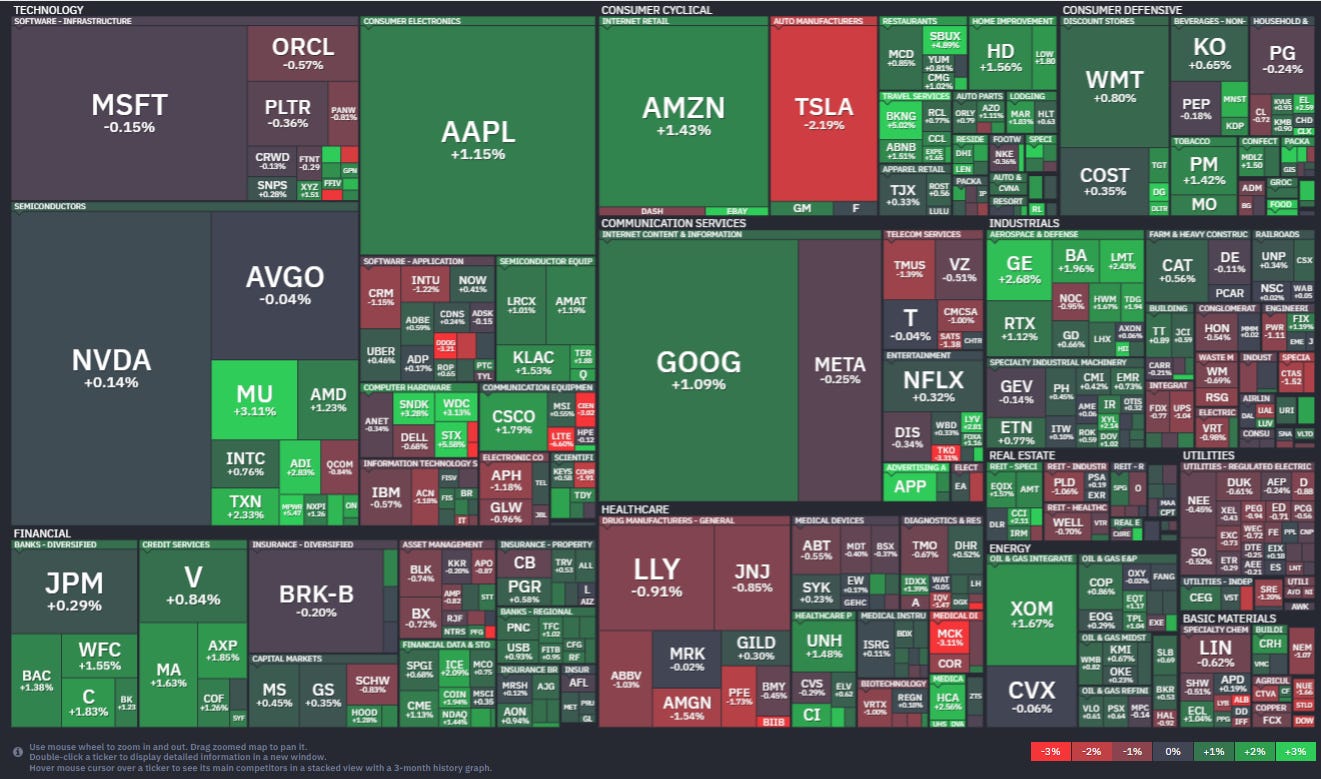
Stock-by-stock SPX flag from finviz_com consistent with another mixed look with red and green scattered throughout, but generally following the sector flag in terms of proportions.
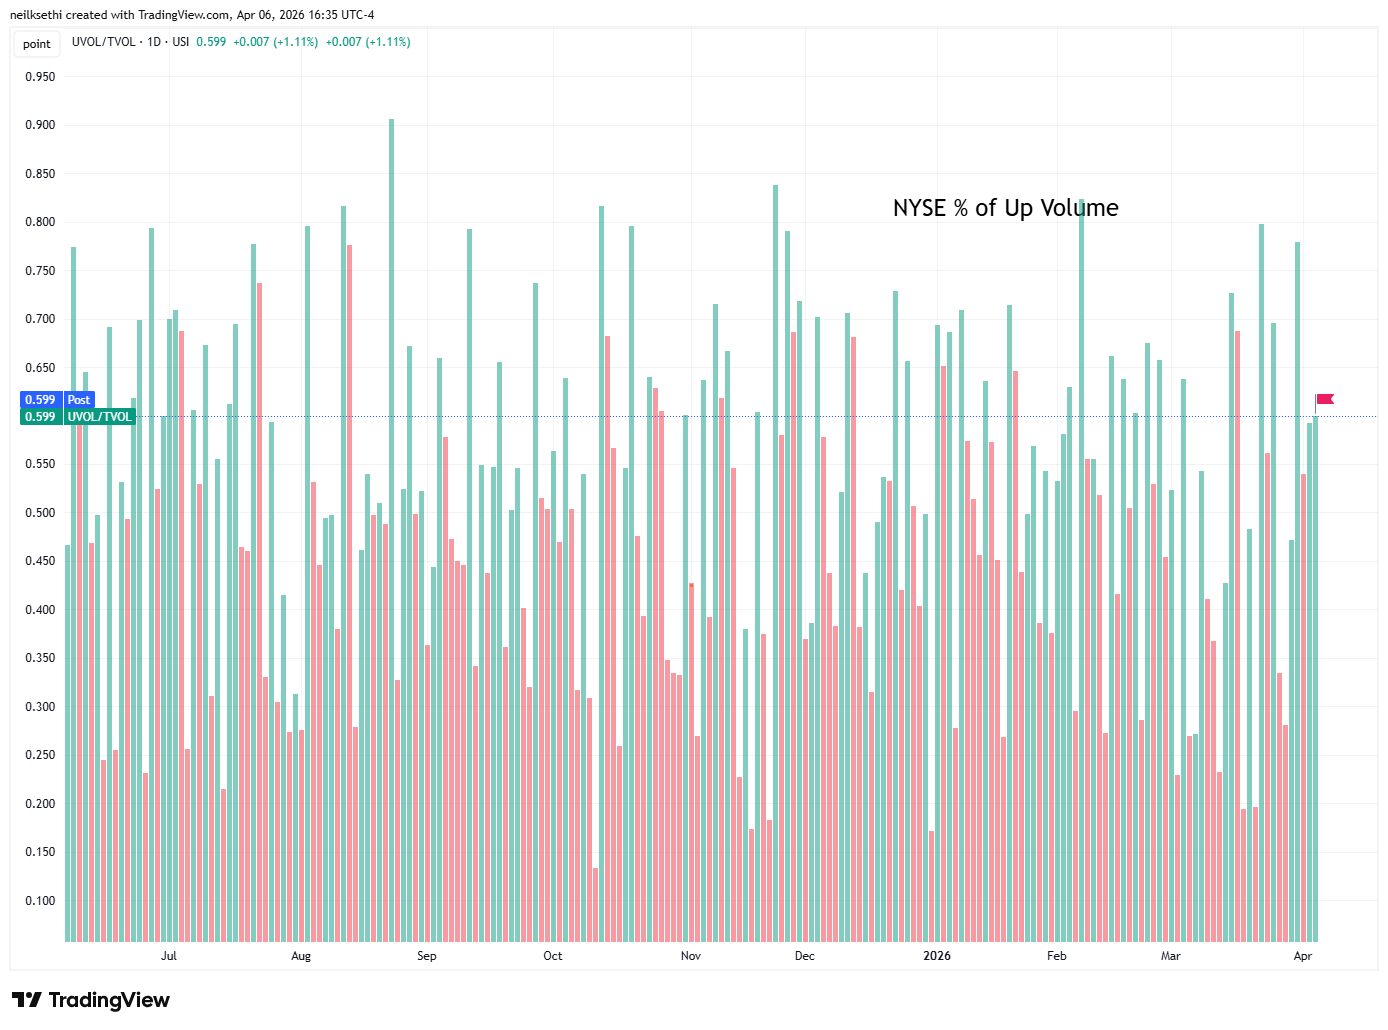
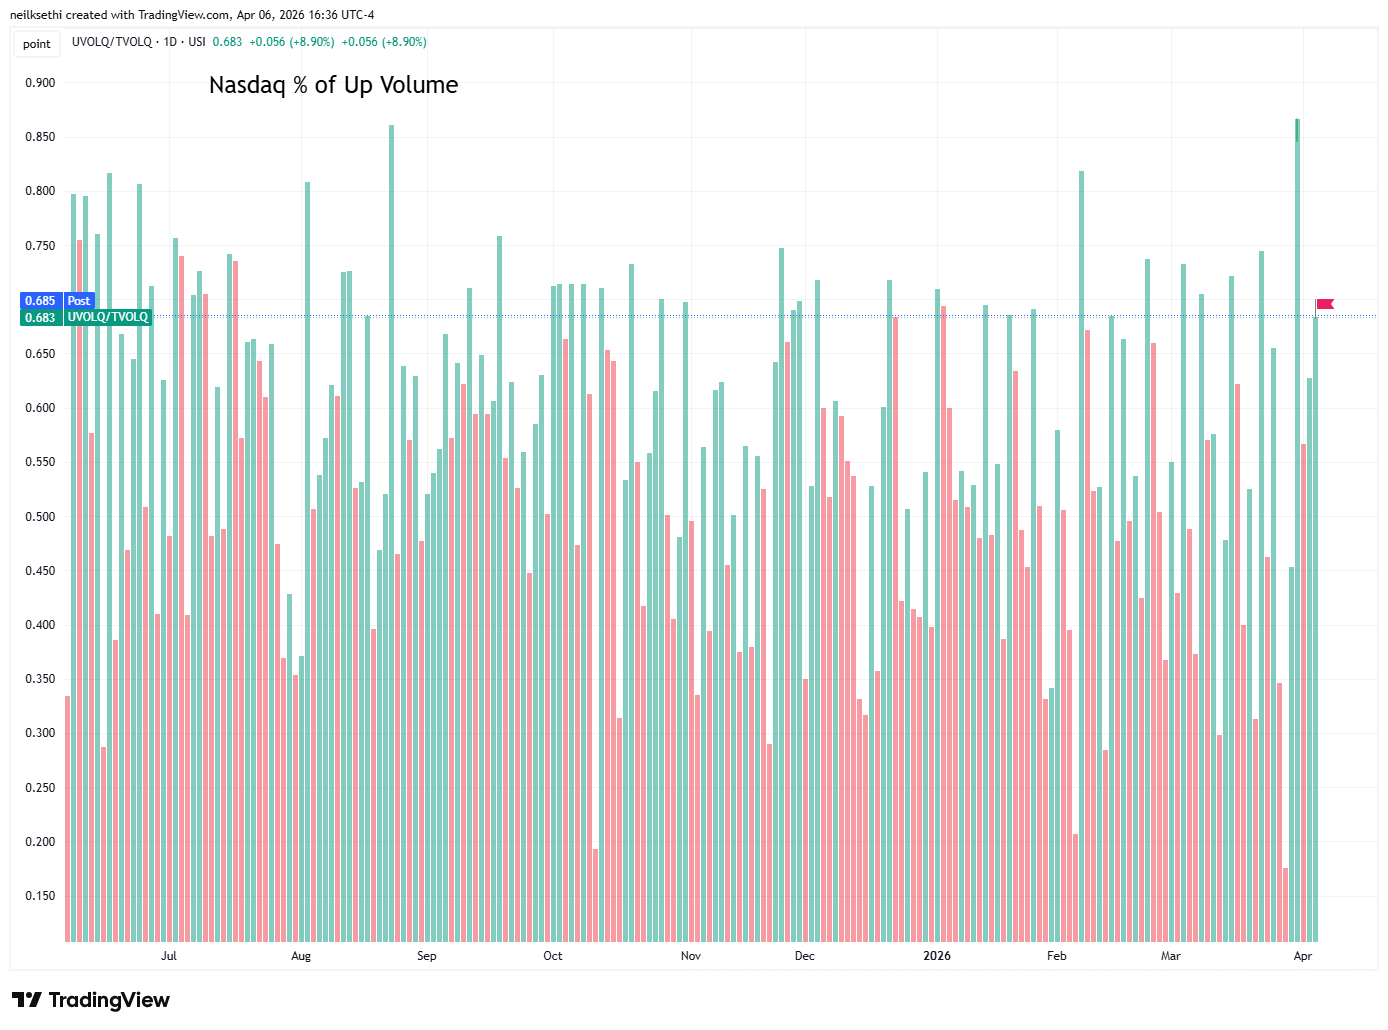
NYSE and Nasdaq positive-volume ratios (intensity of buying in stocks up on the day), both continued with the better relative performance from Friday.
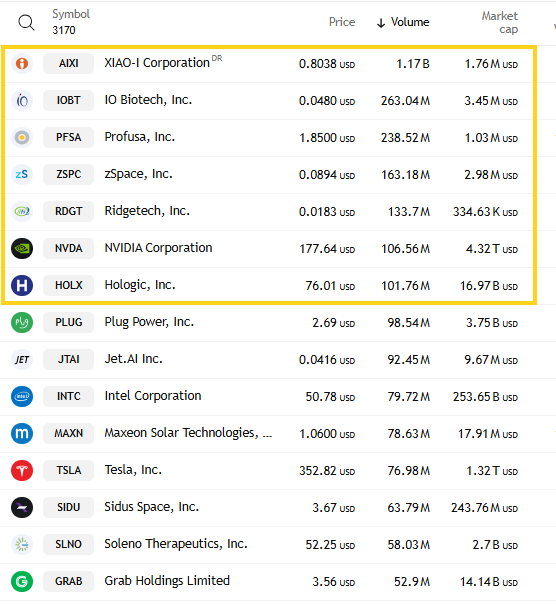
Speculative activity was robust on the Nasdaq with the top 3 stocks by volume seeing 1.6bn shares traded (mostly due to penny stock AIXI which traded 1.2bn) the most since ~2.15bn Mar 18th which was one of the highest of the year. Four others were over 100mn.
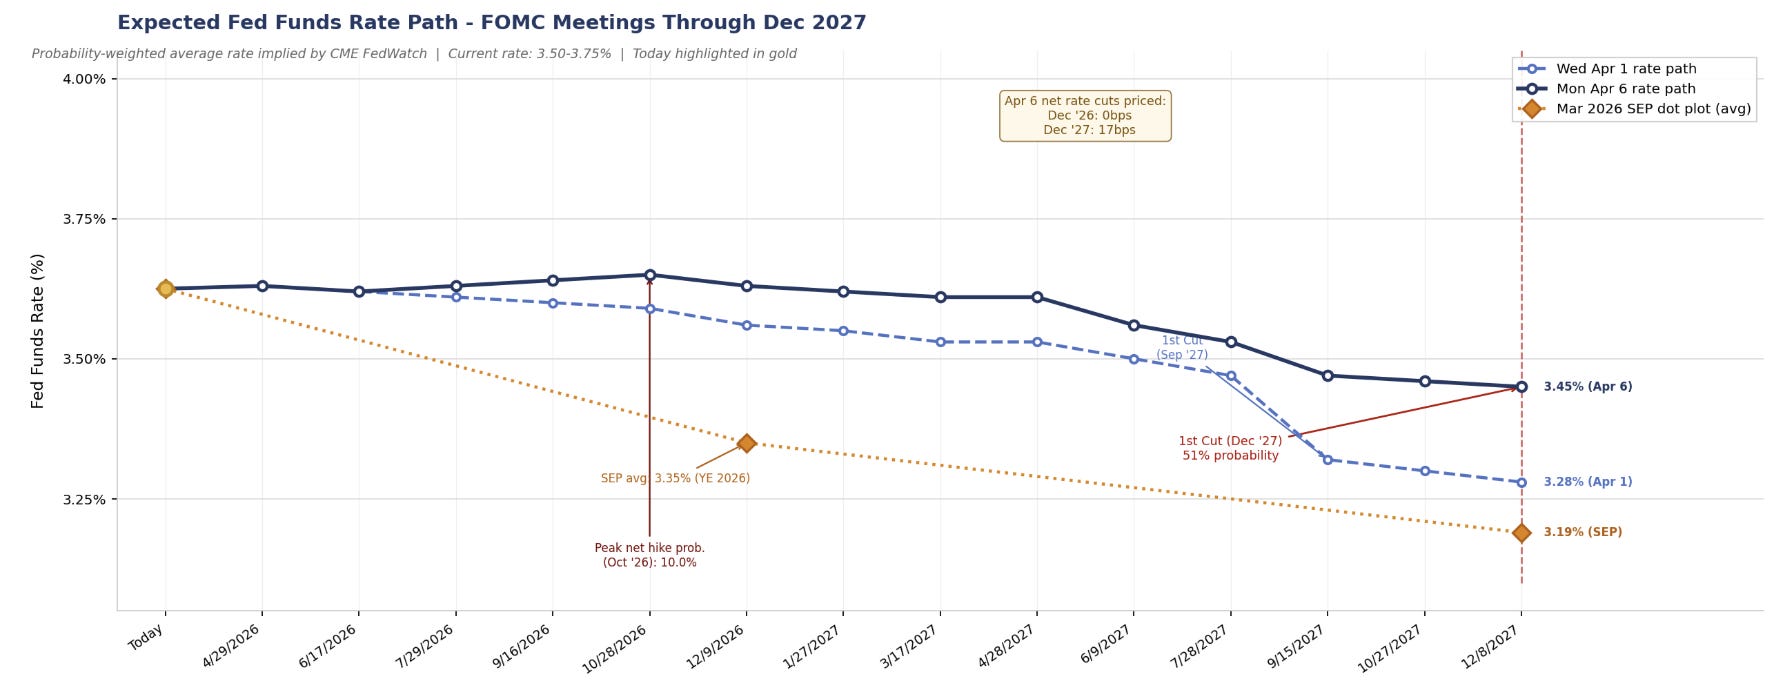
FOMC rate cut pricing turned a bit more hawkish on the inflationary ISM report according to CME’s Fedwatch tool with hike probabilities now peaking at 10% (in October). Still that’s down from 50% in December March 23rd.
No cuts (assuming no hikes) though are priced at all until December 2027 and just barely at 51% (from 77% chance of a September cut on Wednesday). A second cut remains off the board with Dec ‘27 at 20% (down from 44% Wednesday.
Pricing for 2026 now has 0bps of cuts (well under the average dot on the dot plot of +28bps in cuts). 2027 is at +18bps of cuts from current levels (almost half of the +35bps priced last Wednesday and compared to +43bps of cuts from current levels for the average dot on the dot plot), corresponding to a terminal rate of 3.45% up from 3.28% Wednesday, and around the highest to date.
Change from Wednesday. Note includes the dot plot average in orange.
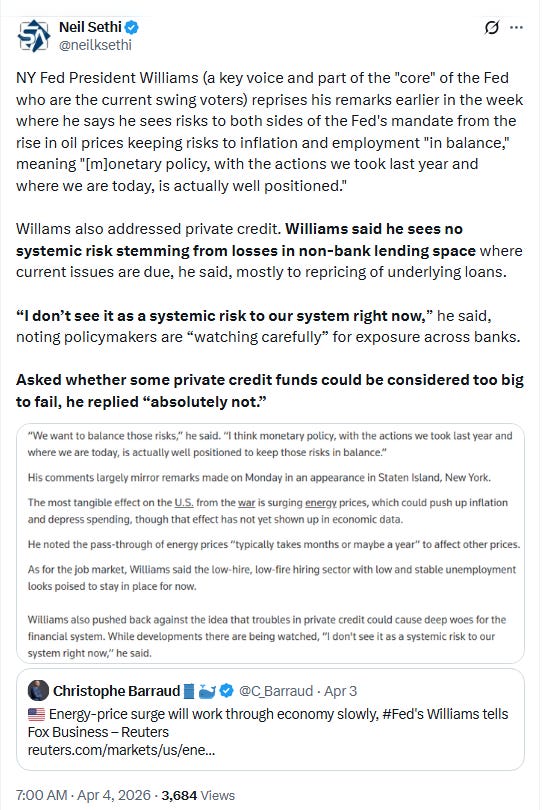
Low probabilities of a Fed move in the near term are also consistent with the speech from NY Fed Chair Williams on Friday:
The 10yr UST yield started higher but fell back to end slightly lower at 4.31%, down -12bps from the highest since July. I had said Thursday we might test 4.5% and we touched 4.48% last Friday, close enough?
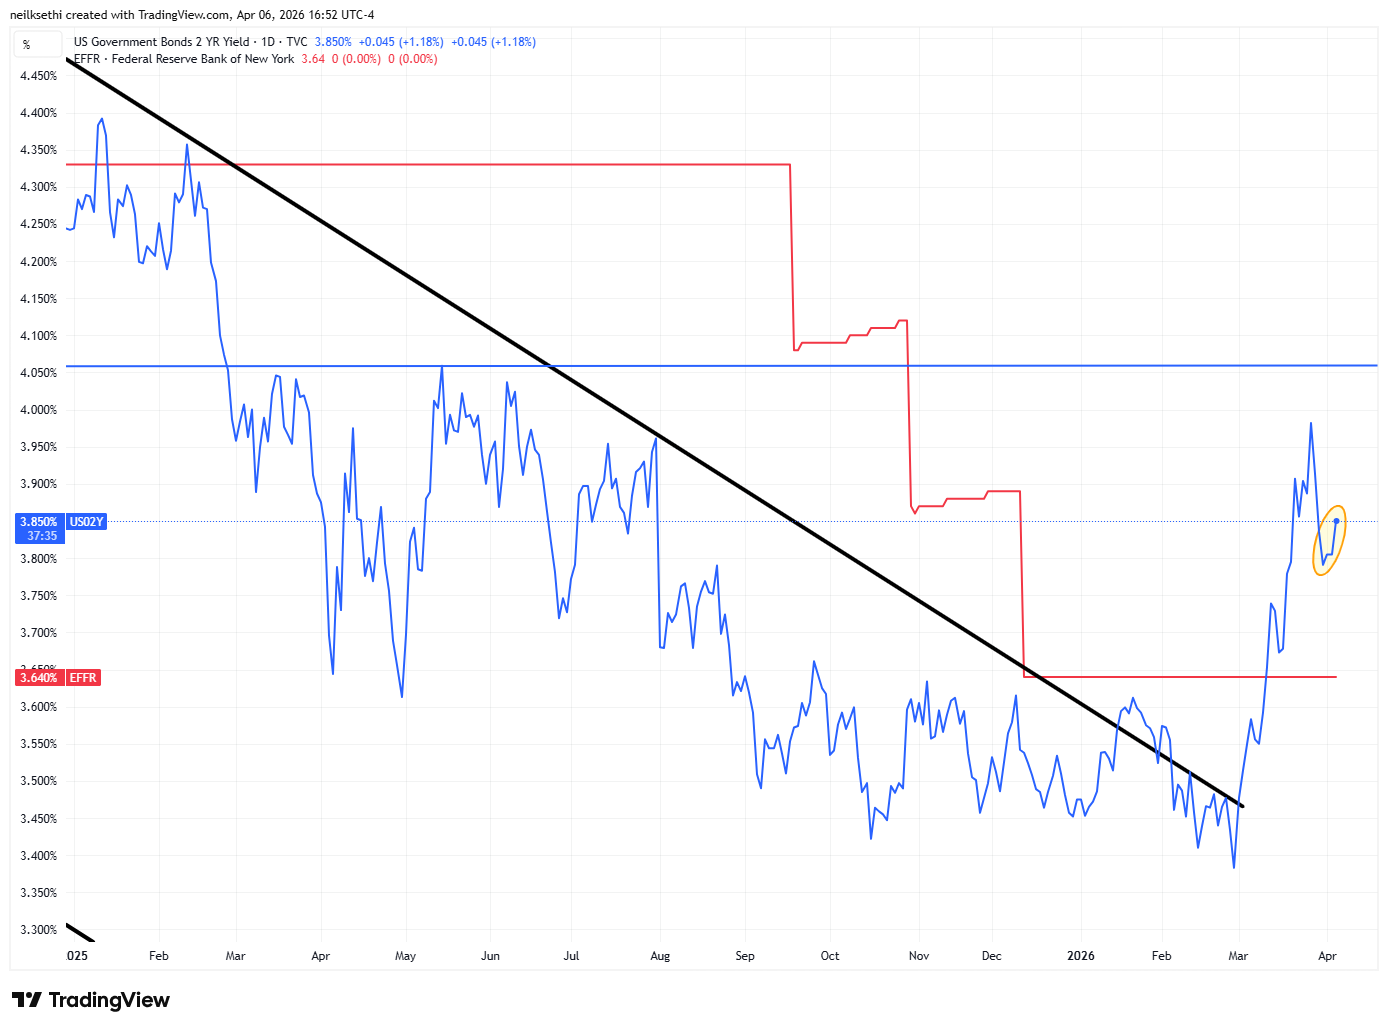
The 2yr yield, more sensitive to FOMC rate cut pricing, edged up for a third session to 3.85% +23bps above the Effective Fed Funds rate (red line), consistent with no Fed cuts over the 2-year window.
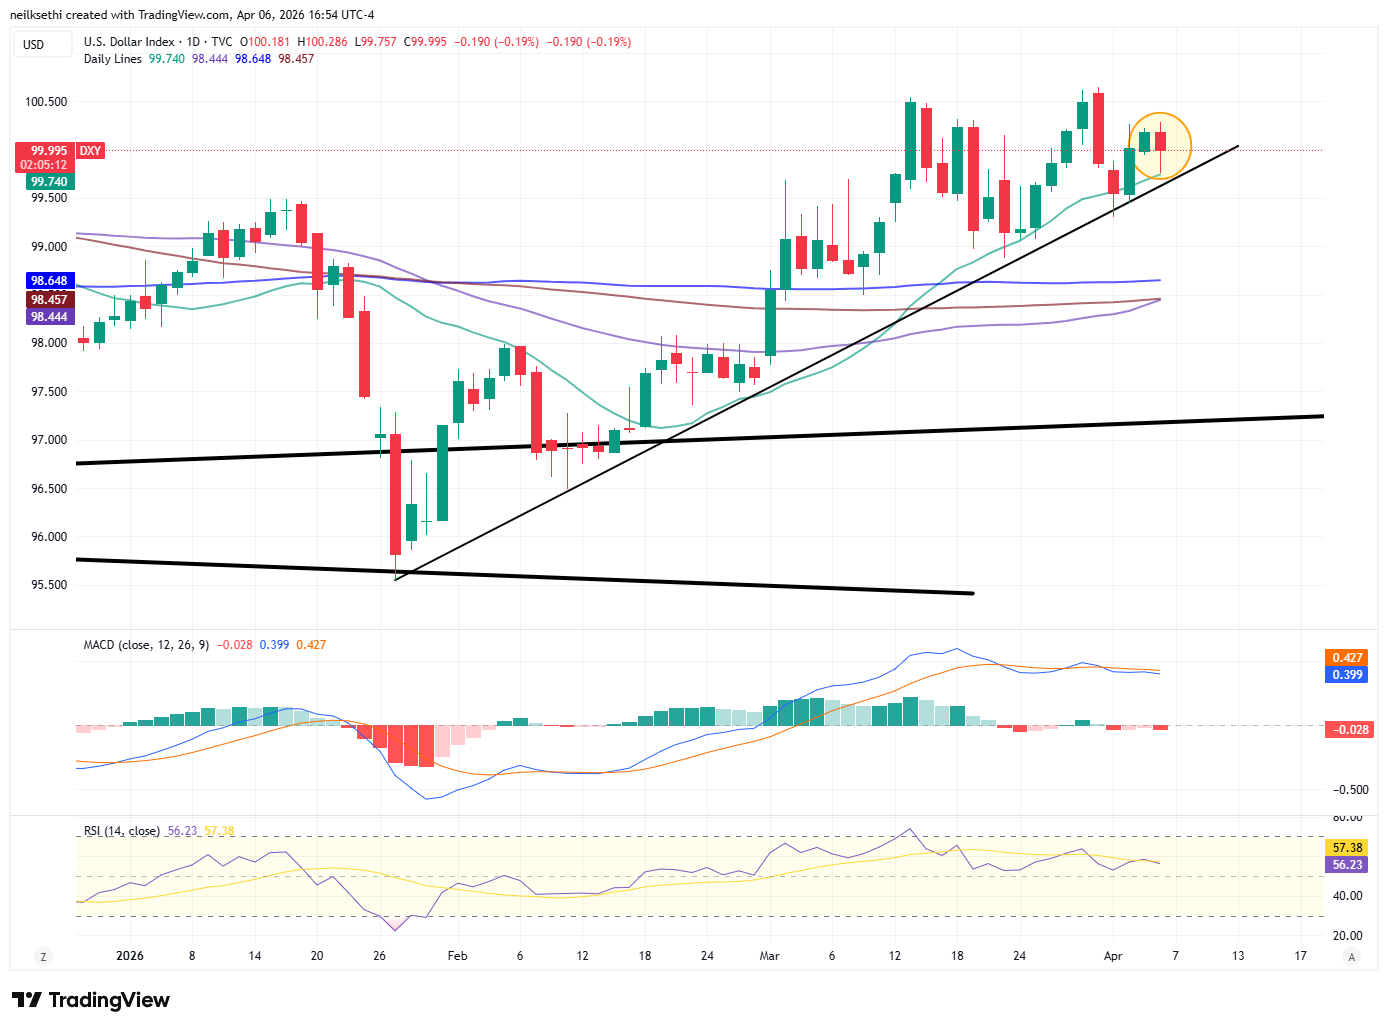
The $DXY dollar index (which as a reminder is very euro heavy (57%) and not trade weighted) fell back to its 20-DMA which continued to hold as did the uptrend line from the Jan lows. As long as that’s true as I’ve said since early March, there’s no reason to turn bearish.
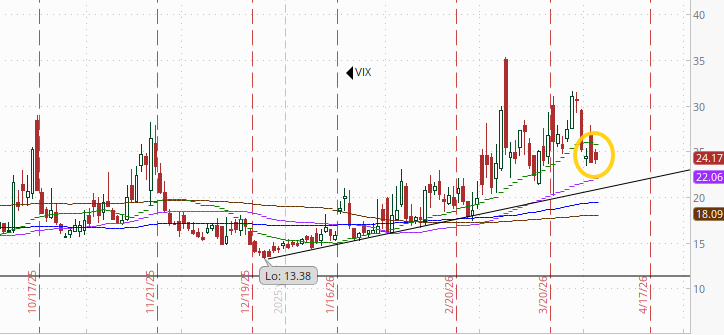
VIX little changed remaining a little elevated at 24.2. The current level is consistent w/~1.52% average daily moves in the SPX over the next 30 days.
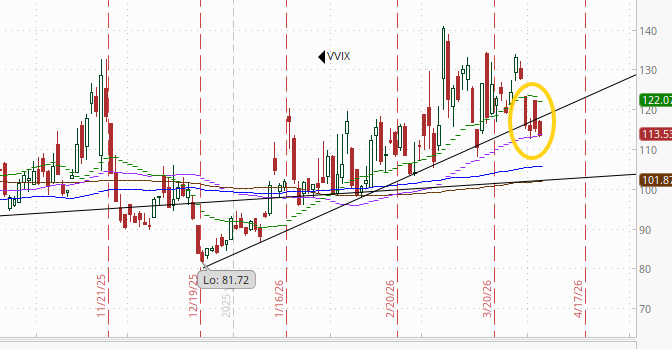
The VVIX (VIX of the VIX) little changed at 113.5, remaining under its uptrend line from the December lows for a third session but for now holding the 50-DMA. As I mentioned Wed, “we’ll see if it falls further which will be an indication the VIX may be following.”
The current level is still consistent with “elevated” daily moves in the VIX over the next 30 days (historically, normal is 80-100, but we’ve been above 90 most of the time since July ‘24)). Above 100 is the level flagged by Charlie McElligott as indicating higher stress.
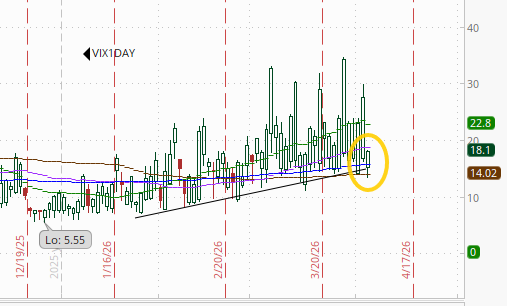
With a 3-day weekend behind us, the 1-day VIX fell back to 18.1, but that’s still fairly elevated and consistent with a move of 1.13% in the SPX next session. I would imagine we’ll see this spike tomorrow ahead of the Tuesday night deadline if there isn’t a ceasefire or extension announced.
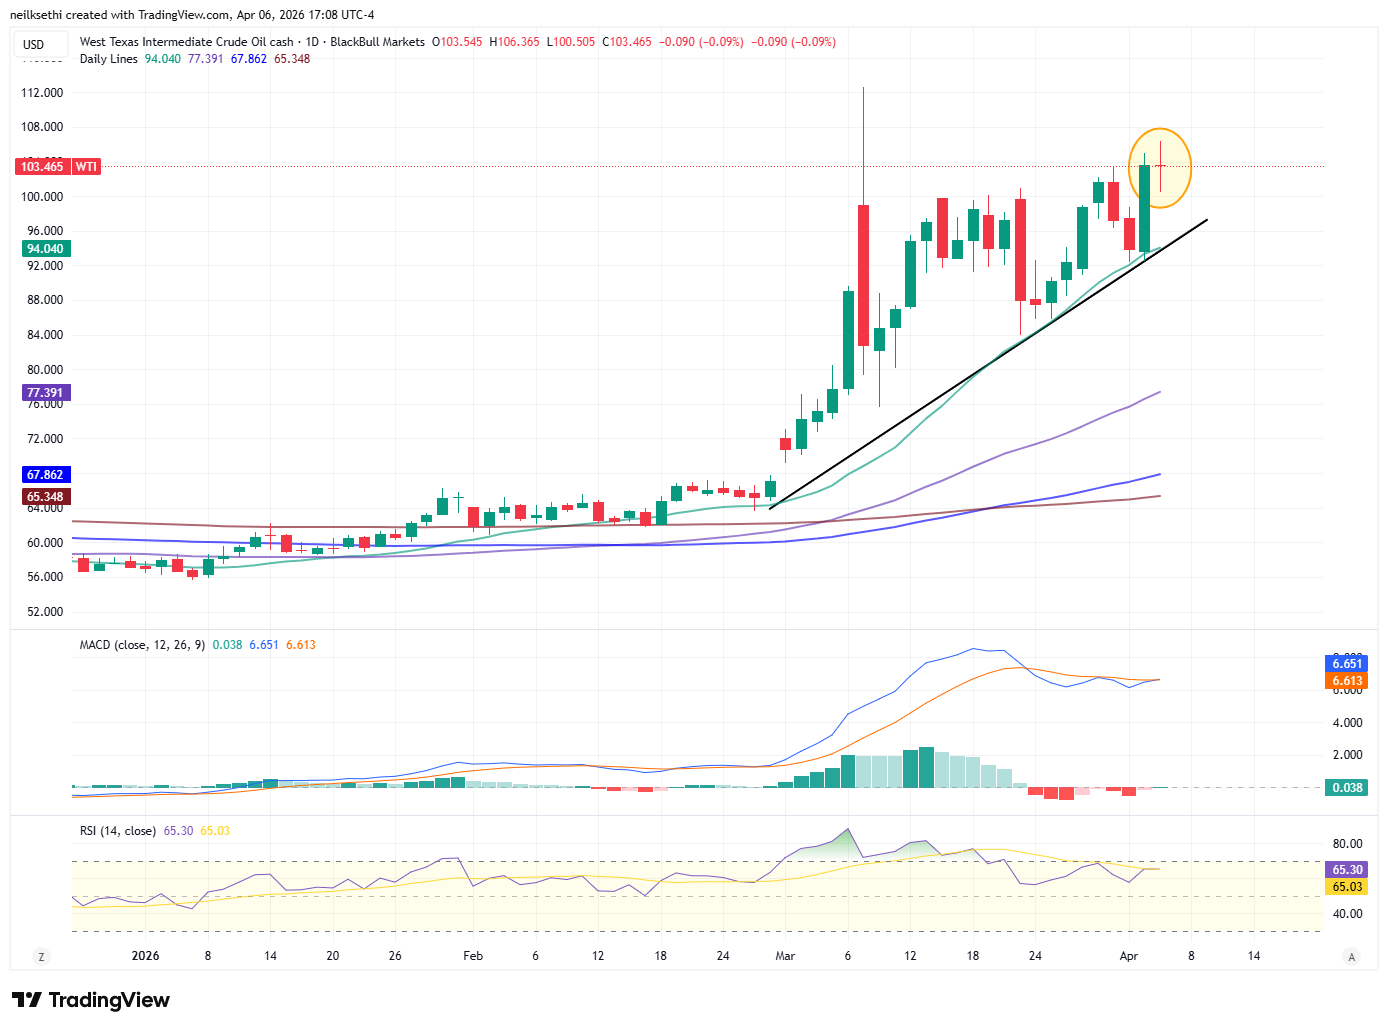
WTI was basically unchanged remaining a little above $100 just off the highest close since 2022.
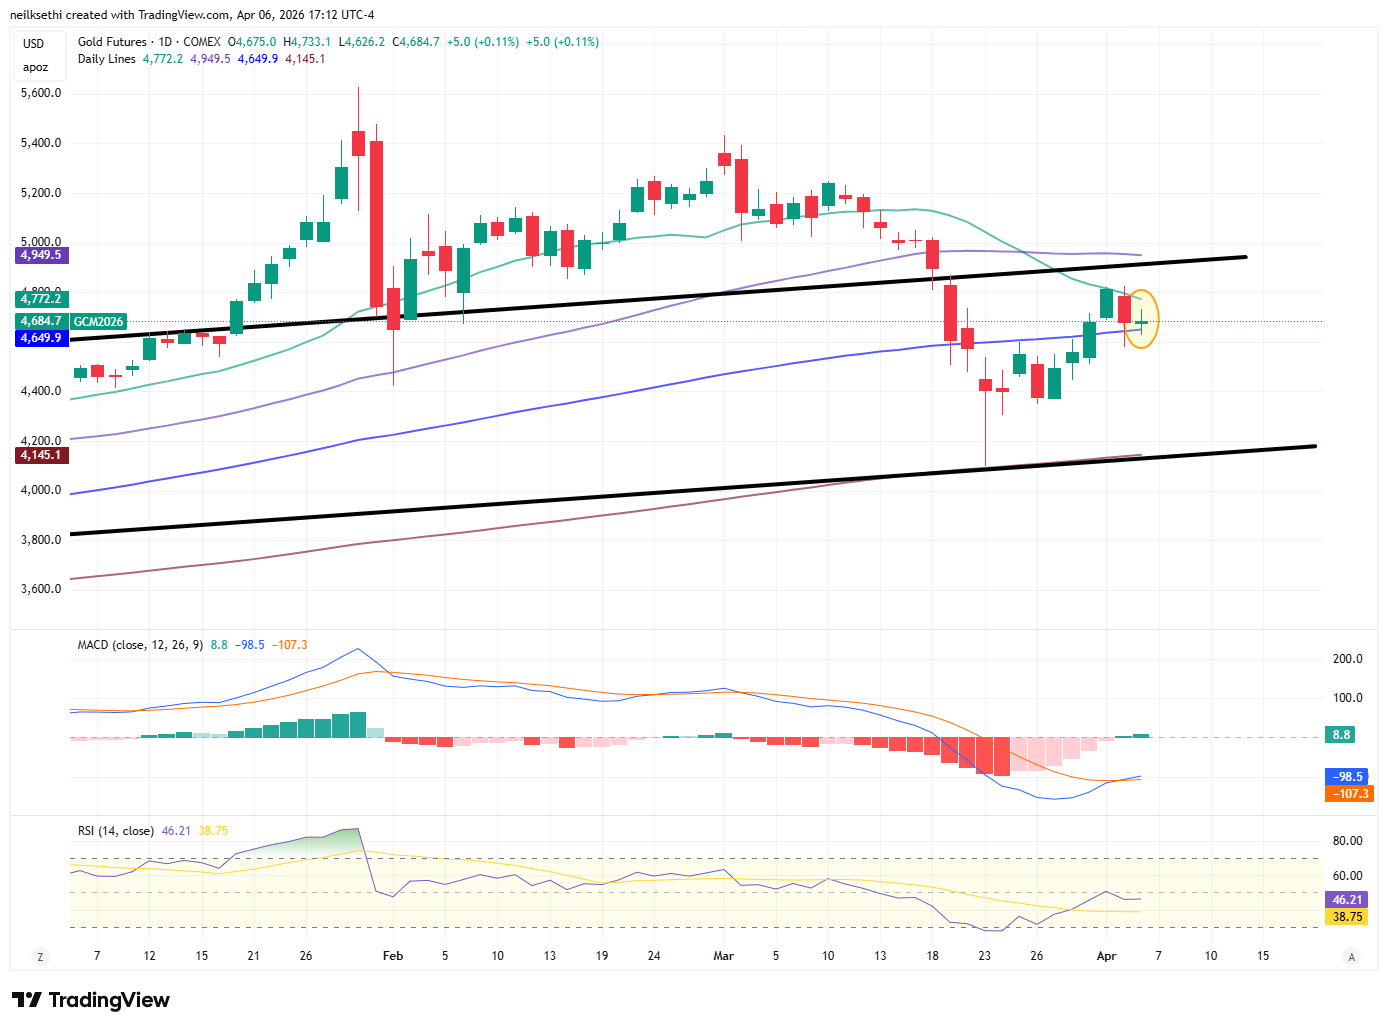
Gold futures (/GC) also little changed remaining in their old channel from early 2024 that they left at the start of 2026 for a couple of months. The technicals are mixed with the MACD in a mild “cover shorts” reading but the RSI is still under 50 so hard to say which way it goes from here.
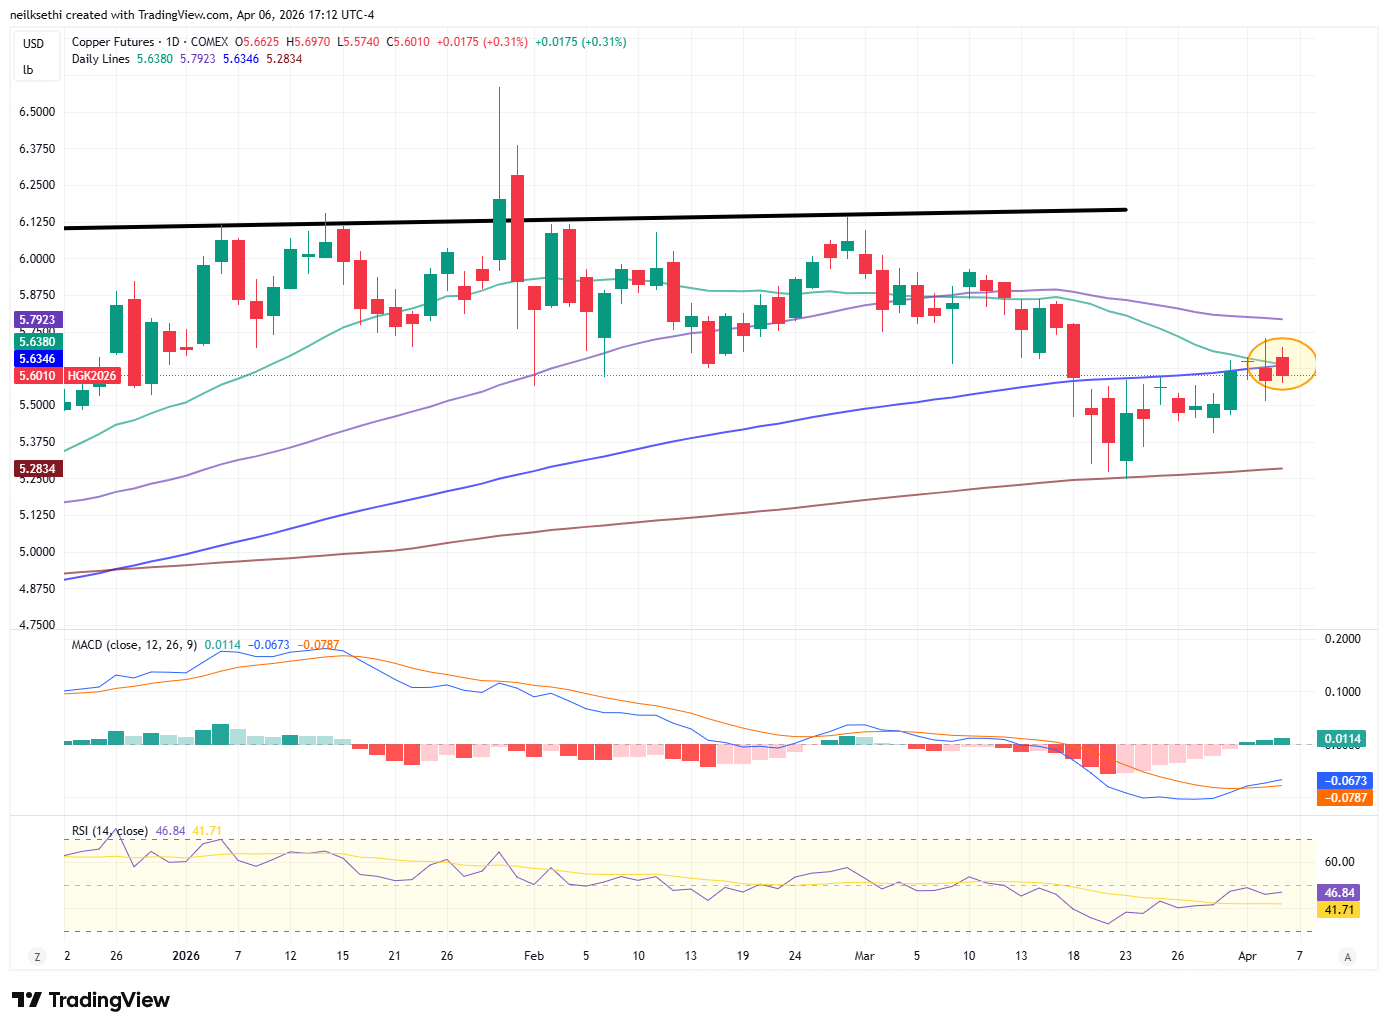
US copper futures (/HG) edged higher. Like gold, the daily MACD is in a “cover shorts” positioning, but the RSI is still under 50. It seems like there’s more momentum to this chart, but it has the 50-DMA (purple line) ahead.
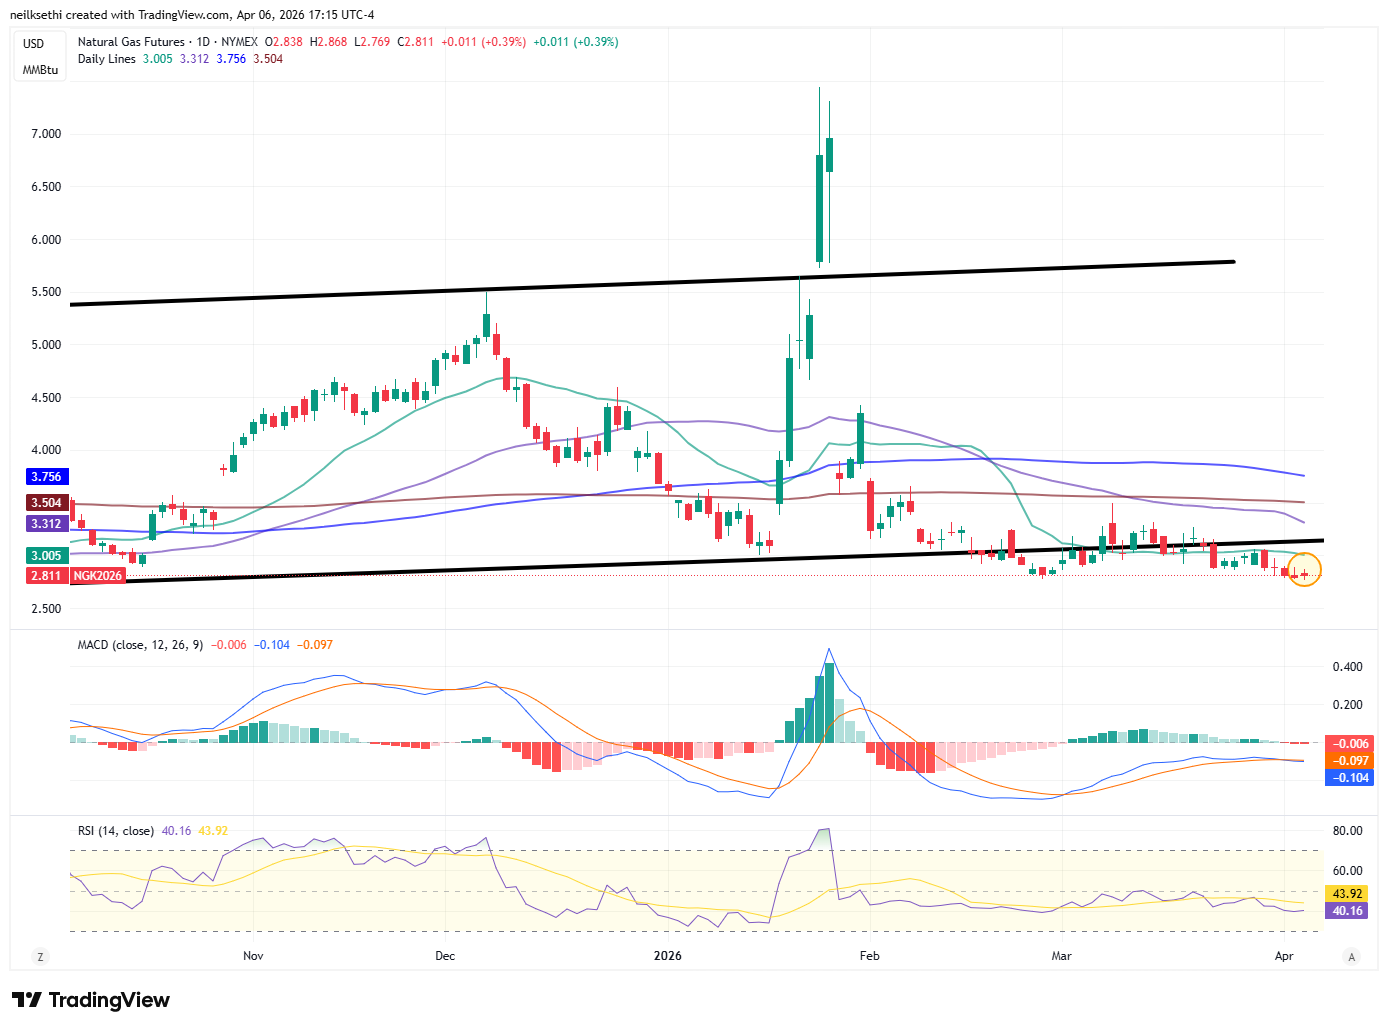
Natural gas futures (/NG) were up early but gave most of that back to finish just off the least since August. The daily MACD as mentioned Wednesday has crossed to “go short” positioning, and the RSI is around 40 so not much to get excited about, particularly with winter in the rear-view mirror.
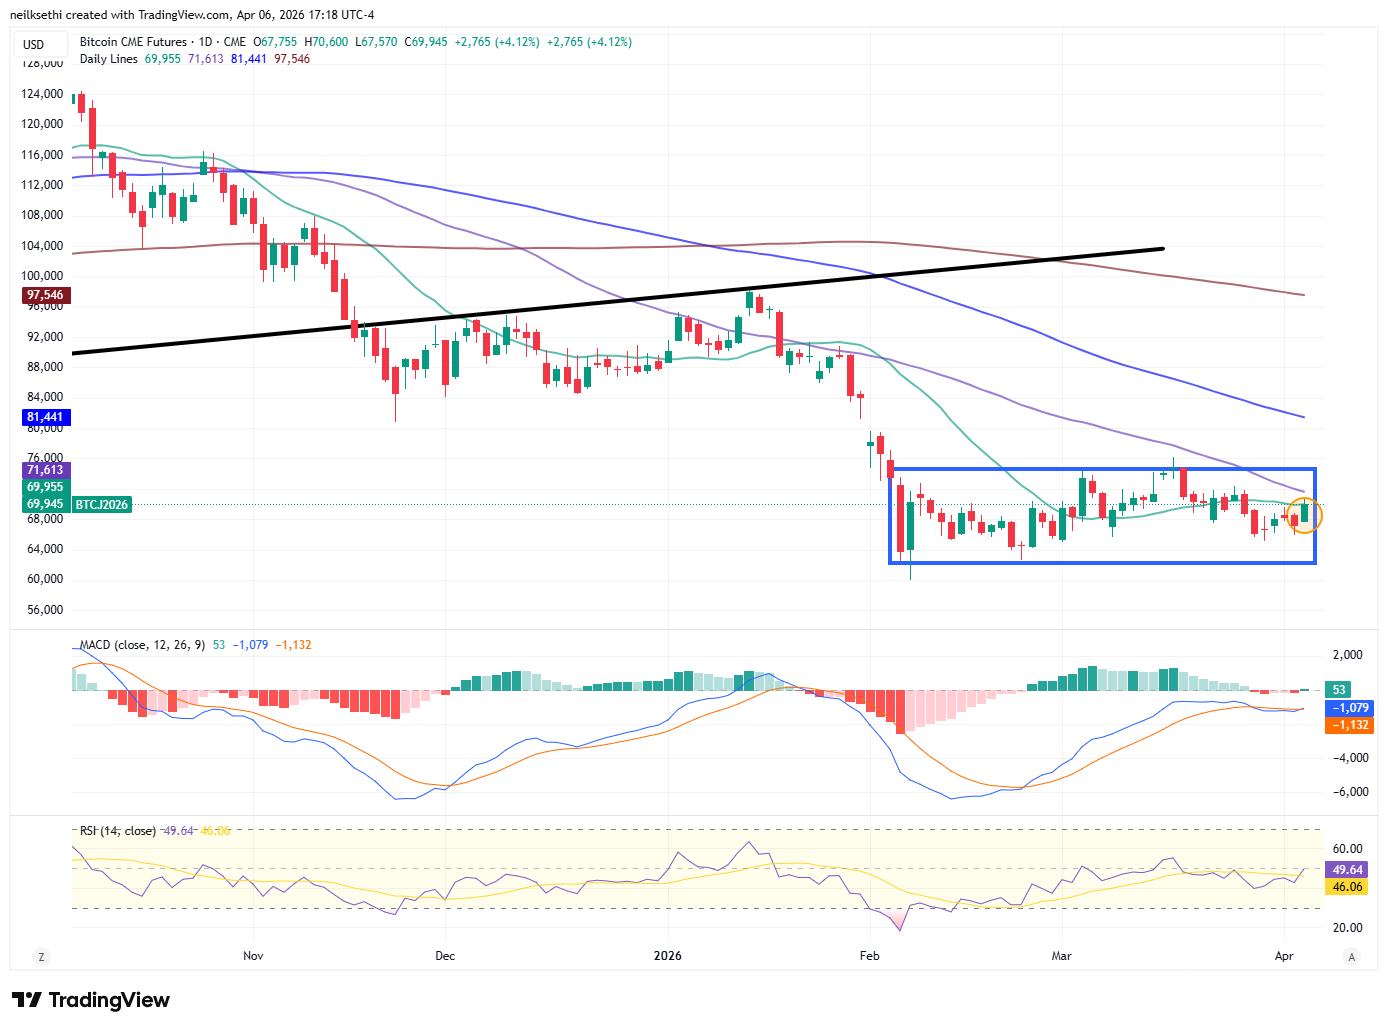
Bitcoin futures saw their best day in a month although overall remain in their the range since the start of February (the blue box). The daily MACD crossed back over to a mild “go long” reading, and the RSI is now around 50, so we’ll see if it can sustain a rally finally.
The Day Ahead
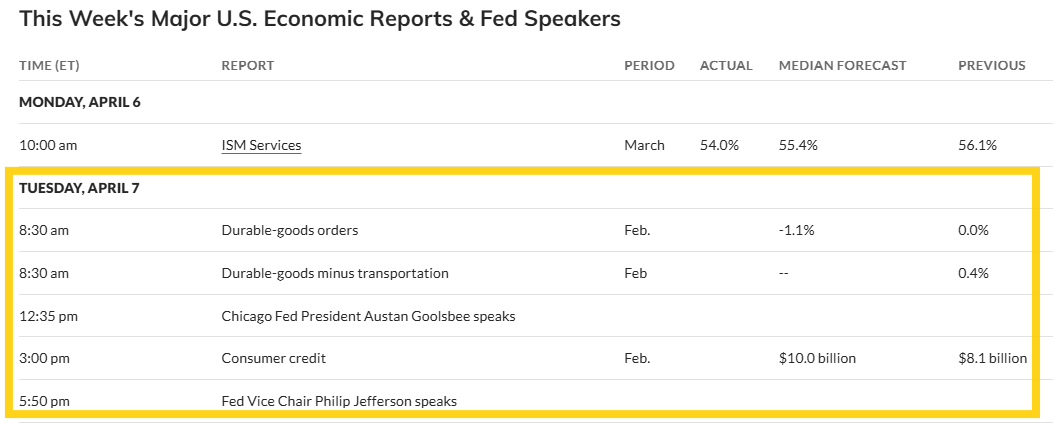
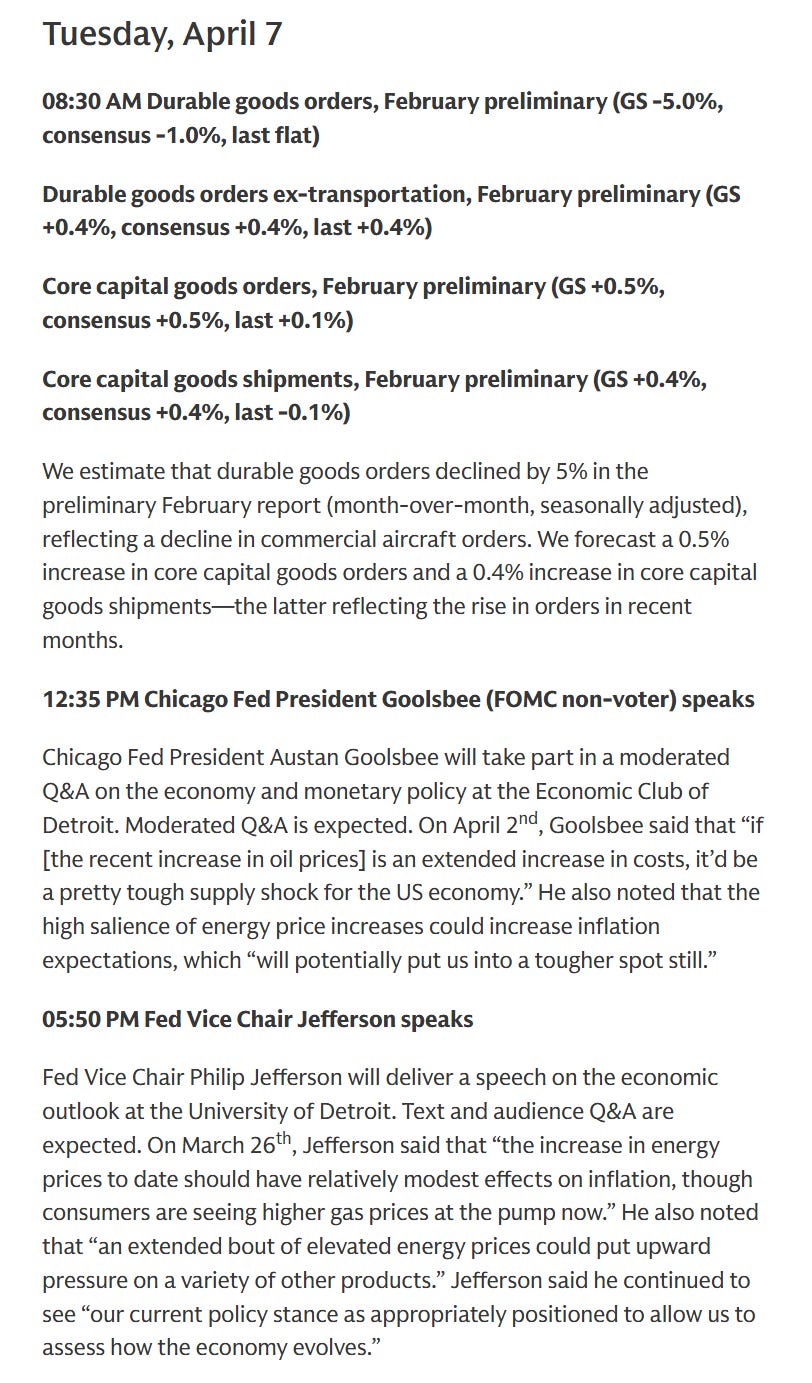
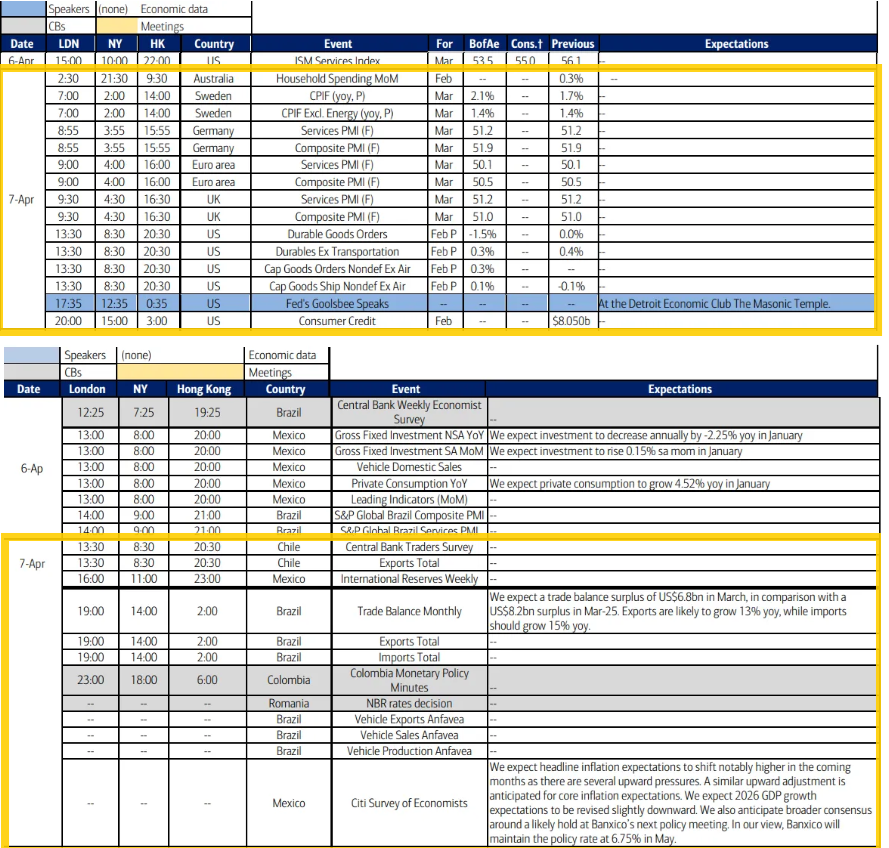
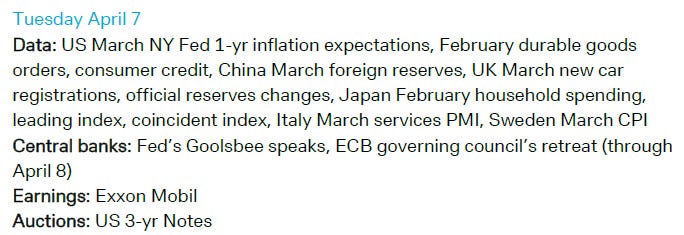
In US economic data Tuesday brings us Feb durable goods orders and consumer credit, the March NY Fed consumer survey (not listed below), and the ADP weekly report.
Fed speakers pick back up with Governor (and Vice-Chair) Jefferson (a leading voice, but one we heard from last week) and Chicago Fed Pres Goolsbee.
Non-bill Treasury auctions (>1yr in duration) will start for the week with 3-year notes.
No SPX reporters Tuesday.
Ex-US highlights are Japan household spending, Europe services PMIs, Brazil trade balance, Mexico economists survey.

Link to X posts - Neil Sethi (@nelksethi) / X
To subscribe to these summaries, click below (it’s free!).
To invite others to check it out,
The new 'Markets Update' format looks great Neil! Thank you very much for all your work!