
Markets Update - 4/9/26
Update on US equity and Treasury markets, US economic data, the Fed, select commodities and a look at the upcoming day with charts!

Similar to the Week Ahead, I am reworking the nightly Markets Update to make it more streamlined and hopefully more useful. I’m making this week open to all subscribers so you can see the format and give it a try. As always, feedback is welcome.
Quick Summary:
Equities rebounded from early losses (and crude oil pared gains) after Israel said they would engage in talks with Lebanon, which markets welcomed given the continued conflict in that country has held up progress on the reopening the Strait of Hormuz.
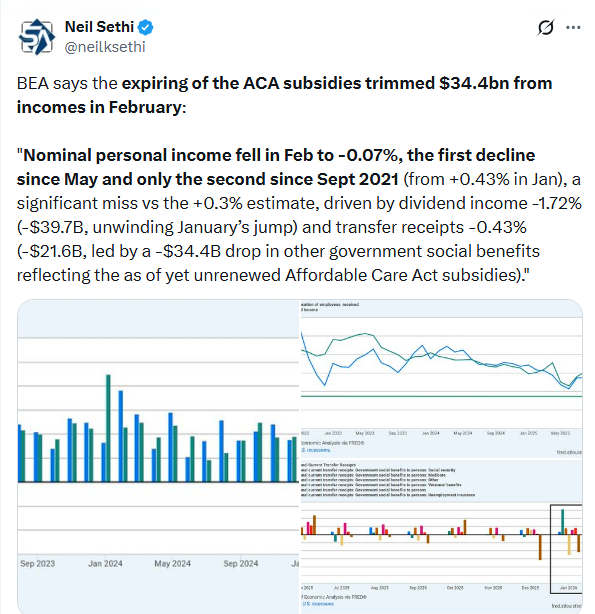
While weekly unemployment claims remained low we got a further markdown to Q4 GDP, February inflation and spending figures came in roughly as expected (but with inflation remaining uncomfortably high and spending weak when adjusted for inflation), and incomes were well under expectations led by a drop in ACA subsidy payments (but with wages also moderating).
US equity indices opened trading Thursday giving back a little of of Wednesday’s jump higher as oil prices rebounded with concerns continuing about the durability (and effectiveness) of Tuesday night’s announced US/Iran ceasefire with both sides accusing the other of breaches and traffic through the Strait of Hormuz remaining at a trickle as further detailed this morning.
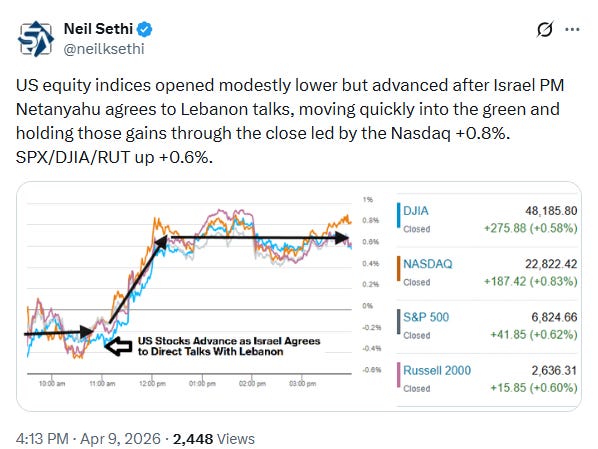
But with one of the primary flashpoints Israel’s continued attacks on Lebanon, stocks would swing higher late morning after a Reuters report that Israeli Prime Minister Benjamin Netanyahu directed his aides to open direct negotiations. Those talks are set to begin next week, although Israel has stated that it will continue to launch strikes against Hezbollah in the interim, which could lead to volatility in the interim. Talks between the US and Iran are set for Saturday.
Equity indices would hold their gains through the afternoon to finish solidly higher led by the Nasdaq +0.8% helped by a 5.6% jump in Amazon as it announced it would be selling its homemade chips to third parties and investing $25 billion in data centers in Mississippi. Meta Platforms (META 628.39, +15.97, +2.61%) also supported the indices following the release of its newest AI model.
Elsewhere, bond yields were little changed despite the rise in crude prices, but the dollar continued its declines. Gold and bitcoin were mildly higher, while copper and US natural gas prices were modestly lower (all covered in the subscriber section with charts).
The market-cap weighted S&P 500 (SPX) was +0.6%, the equal weighted S&P 500 index (SPXEW) +0.1%, Nasdaq Composite +0.8% (and the top 100 Nasdaq stocks (NDX) +0.7%, the SOXX semiconductor index +2.1% (up nearly 20% the last six sessions to an ATH), and the Russell 2000 (RUT) +0.6%.
Some market commentary:
“There’s a fair amount of scepticism in the market about the ceasefire and the upcoming negotiations,” said Raphael Thuin, head of capital markets strategies at Paris-based Tikehau Capital. “The big question is what state the global economy will be in after the crisis.”
“Not much matters for the market other than the durability of the ceasefire, shipping volume through the Strait of Hormuz and ultimately, whether a bona fide permanent deal is struck,” said Bradford Smith at Janus Henderson Investors.
“After yesterday’s understandable enthusiasm around a ceasefire, it is difficult to identify a catalyst for another leg higher in bonds and equities, and the longer the Strait of Hormuz remains closed, the less confidence there will be in the rally that has already occurred.” — Skylar Montgomery Koning, BBG macro strategist.
“Daniela Hathorn, senior market analyst at Capital.com, writes:
From a market perspective, this underscores that the cease-fire should be viewed as a pause in escalation rather than a resolution. The Strait remains the central lever in this conflict, and Iran’s willingness to reassert control suggests it is not prepared to relinquish that leverage easily. Given the waterway accounts for roughly 20% of global oil flows, even limited disruption is enough to reintroduce a significant risk premium into energy markets and keep volatility elevated. The key implication is that markets are likely to remain highly reactive. Any signs that the cease-fire is breaking down, whether through renewed restrictions in the Strait or spillover from regional conflicts like Lebanon, could push oil prices higher again, strengthen the U.S. dollar and weigh on risk assets.
After the release of sticky inflation data Thursday, more attention will be placed by investors on a couple of aspects of the U.S. economy, according to Bret Kenwell, eToro U.S. investment and options analyst. “In the weeks and months ahead, investors really need to see stability in the labor market and some reassurance from corporate earnings,” he said. “If management teams tell a constructive story about resilient consumers and steady demand, investors may breathe a sigh of relief and refocus on the fundamentals. That is, of course, assuming we avoid a major setback on the geopolitical front.”
Some posts from today:
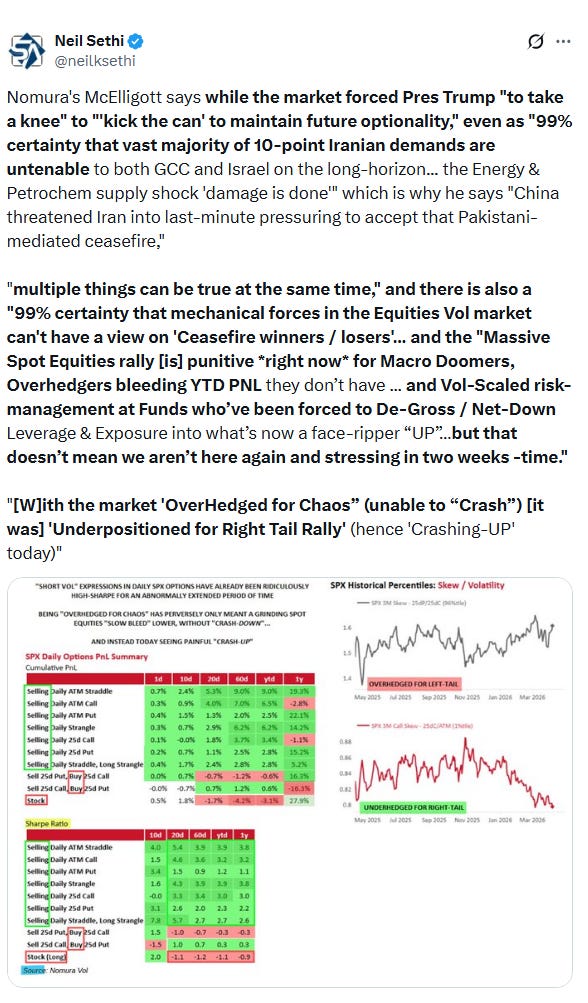
Normur’s McElligott says we may be seeing the effects of a market well hedged for downside but not upside (resulting in a chase for “upside protection”), but noting “that doesn’t mean we won’t be back down in two weeks”:
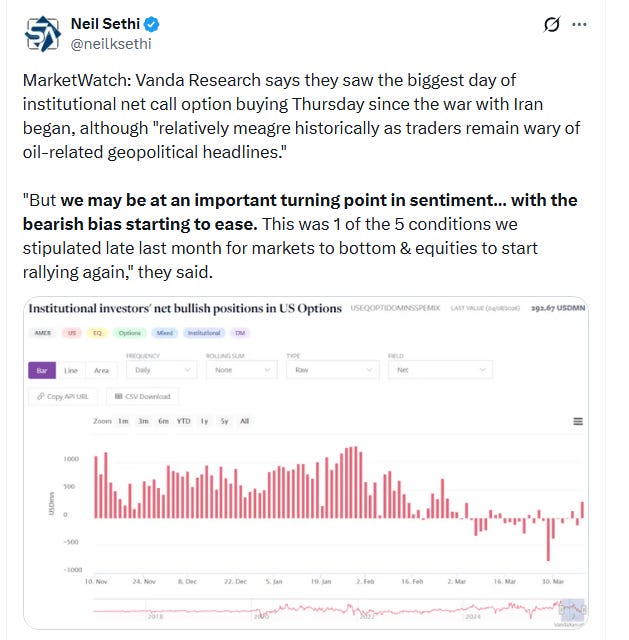
Vanda Research says institutional sentiment may have reached a turning point.
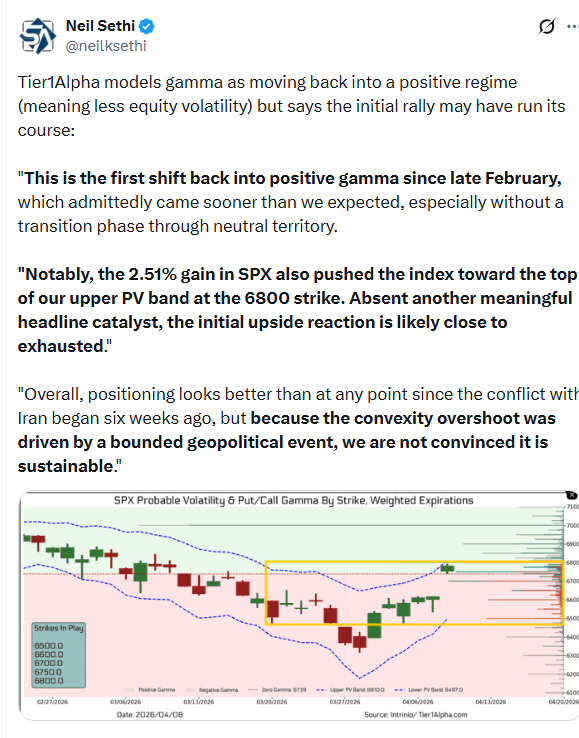
Tier1Alpha says we’re likely back in a positive gamma environment (which means less volatility) and with us moving above the 6800 level I’ll be interested in if they become more bullish:
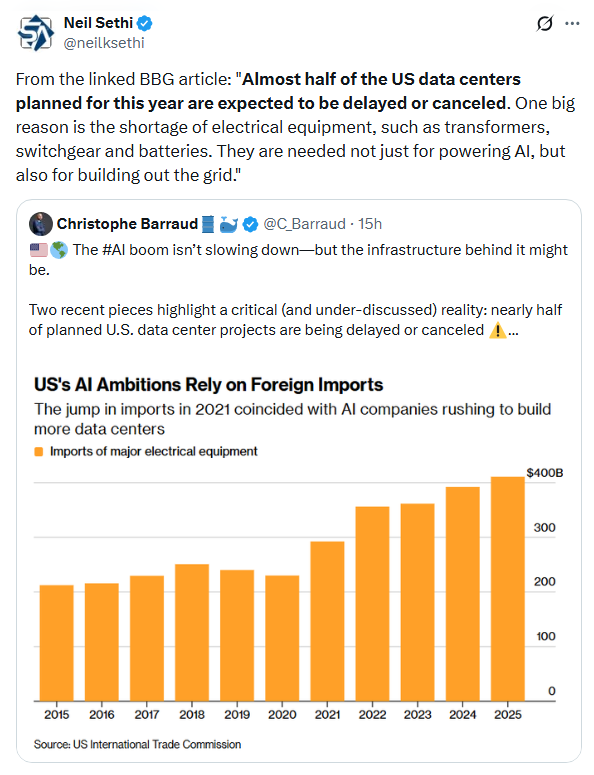
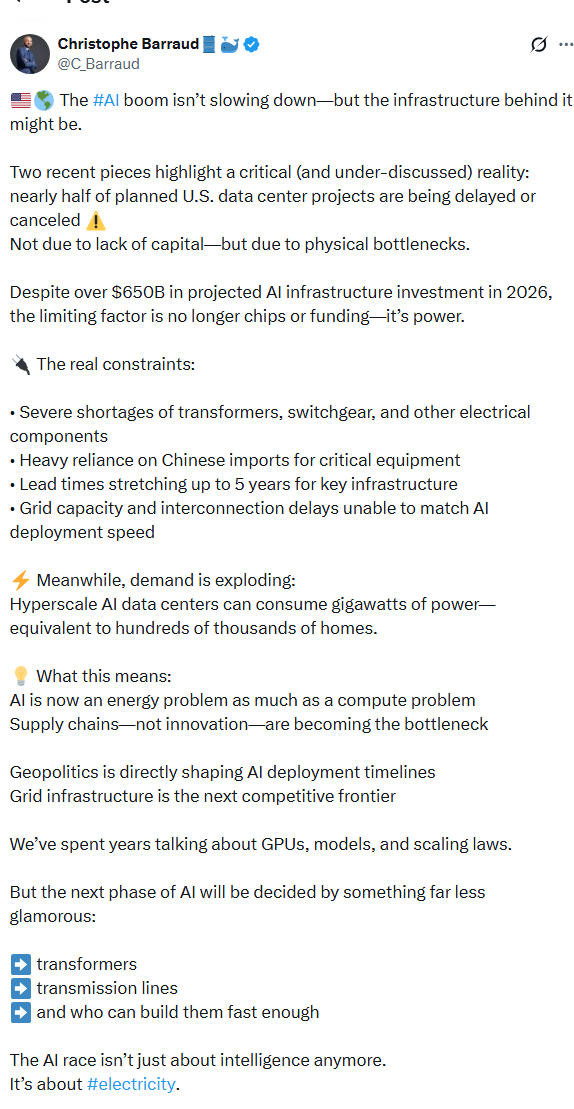
From BBG: The throttle on AI may end up being the inability to build data centers:
Link to X posts - Neil Sethi (@neilksethi) / X for full posts/access to charts.
In individual stock action:
The energy sector (-1.3%) ceded early gains after oil trimmed its advance finishing firmly lower. On an unrelated note, Texas Pacific Land Trust (TPL 377.97, -70.31, -15.68%) was the worst-performing S&P 500 component today after the sudden death of Murray Stahl, the company’s largest shareholder and longtime board member.
Some of the AI gains also made their way downstream, as stocks set to benefit from the AI data center buildout cycle put up solid performances. Corning (GLW 169.80, +4.70, +2.85%), Caterpillar (CAT 787.07, +15.49, +2.01%), and GE Vernova (GEV 968.02, +31.95, +3.41%) all traded to fresh record highs today, with the latter two names helping the industrials sector (+1.0%) notch a solid gain.
Meanwhile, the information technology (+0.4%) notched a more modest gain. There was some renewed AI enthusiasm, with Sandisk (SNDK 851.57, +70.67, +9.05%) posting another monster day, while large chip makers such as Nvidia (NVDA 183.94, +1.86, +1.02%) and Intel (INTC 61.72, +2.77, +4.70%) helped push the PHLX Semiconductor Index 2.1% higher.
However, software stocks remained weak with ServiceNow (NOW 89.81, -7.66, -7.86%) and Palantir Technologies (PLTR 130.54, -10.22, -7.26%), which pushed the IGV -3.9% lower.
Corporate news from BBG:
A $7 billion private credit fund managed by Carlyle Group Inc. capped redemptions after investors asked to pull 15.7% of the shares in the first quarter.
CoreWeave Inc. has struck another, much larger $21 billion deal to supply computing power to Meta Platforms Inc. through 2032, deepening its business with the social media giant that’s trying to catch up in the race to build more powerful artificial intelligence models.
Intel Corp., trying to promote the use of its technology in data centers, said Alphabet Inc.’s Google has committed to using future generations of its Xeon processors and other chips.
Pacific Investment Management Co. is looking to sell a portion of the $14 billion of debt financing it’s providing for a massive Oracle Corp. data center in Michigan, according to people with knowledge of the matter.
Chevron Corp. said its production fell as much as 6% in the first quarter due in part to the Iran war, echoing a similar disclosure from Exxon Mobil Corp. earlier this week.
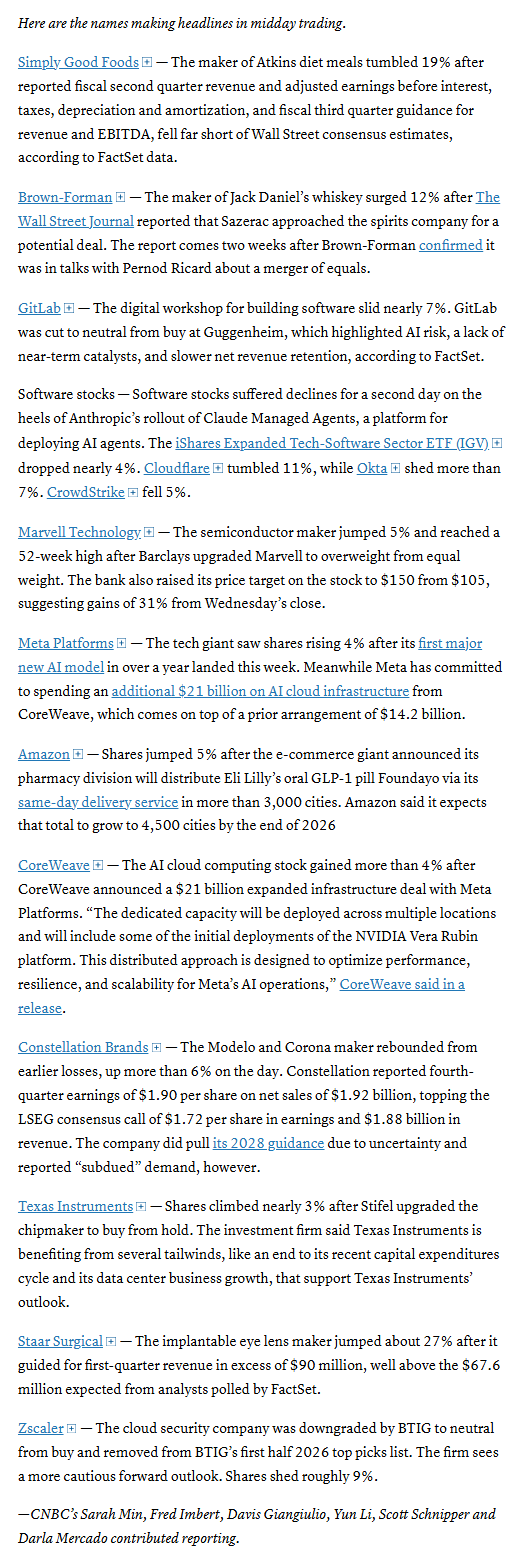
Mid-day movers from CNBC:
In US economic data:
Weekly unemployment clains saw initial claims edge higher but remain near 50-year lows while continuing claims fell to the least since May 2024.
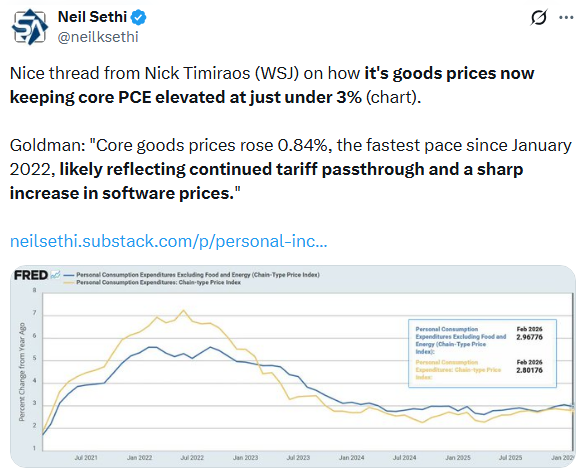
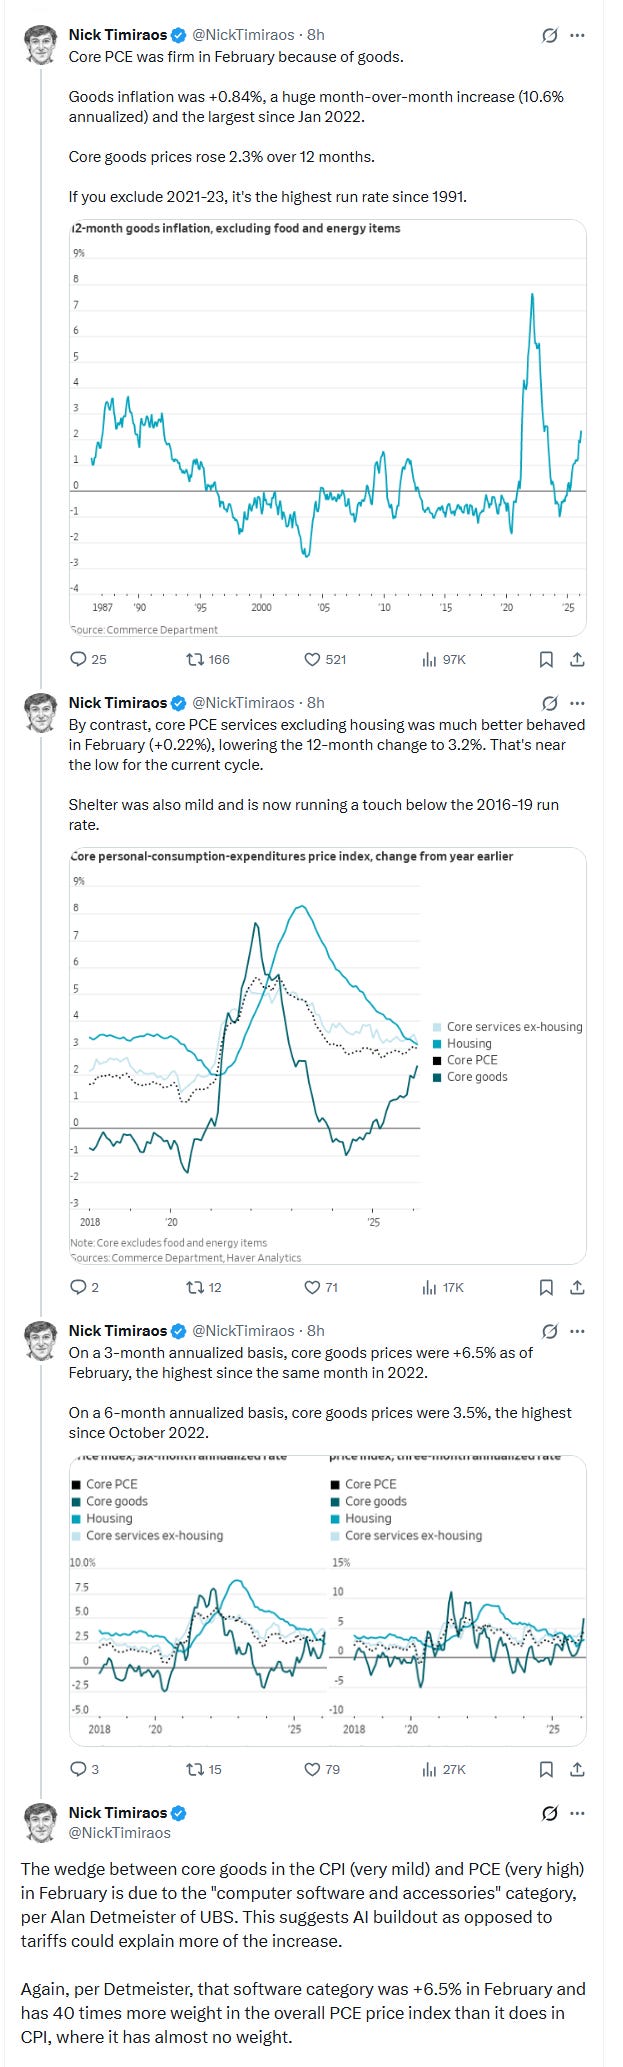
The personal income and spending report for February (our most holistic look at incomes, spending, and prices, was not great with incomes seeing a rare decline which pulled year-over-year real incomes to the least since Dec 2022, while real spending was subdued (although better y/y), while core prices remain elevated (but we did see y/y supercore ease to the least in nearly four years).
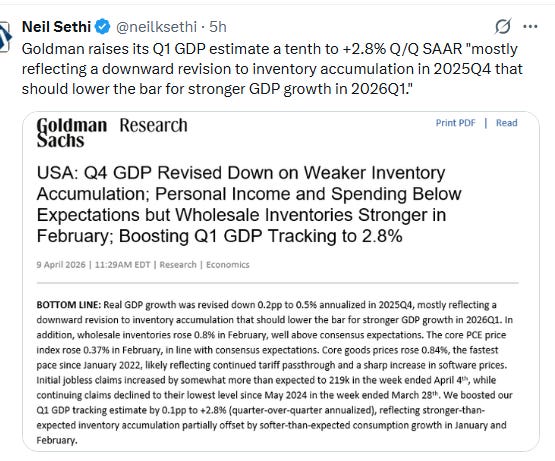
Goldman’s GDP tracker for 1Q now at 2.8%.
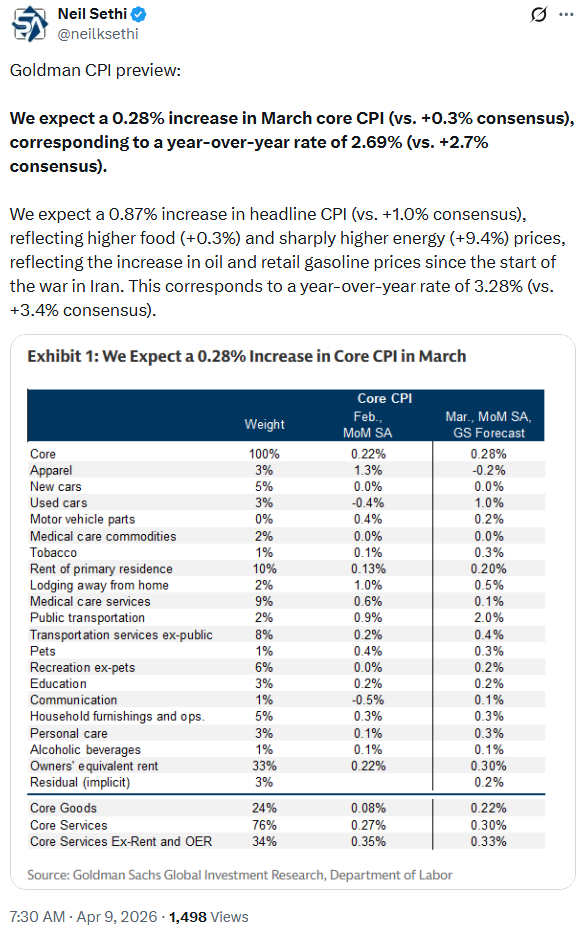
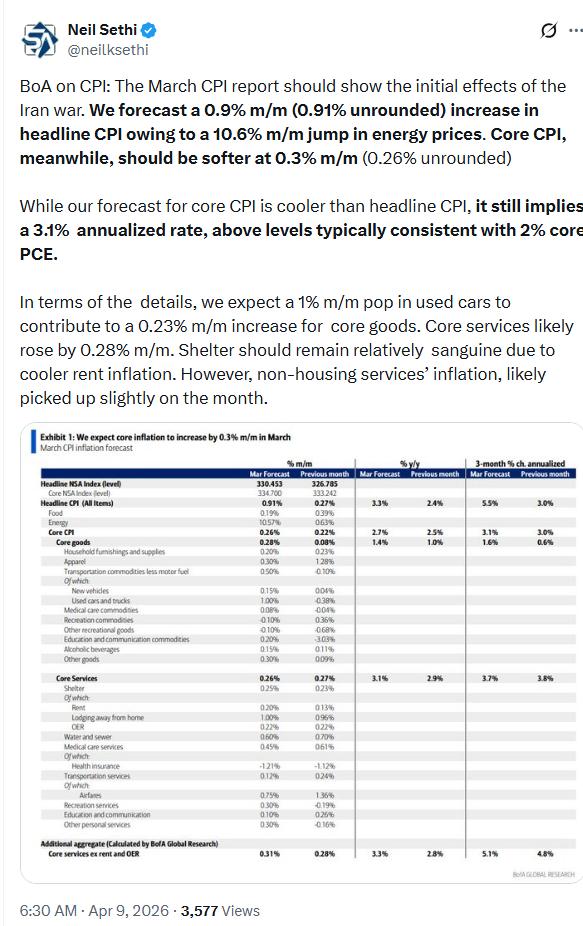
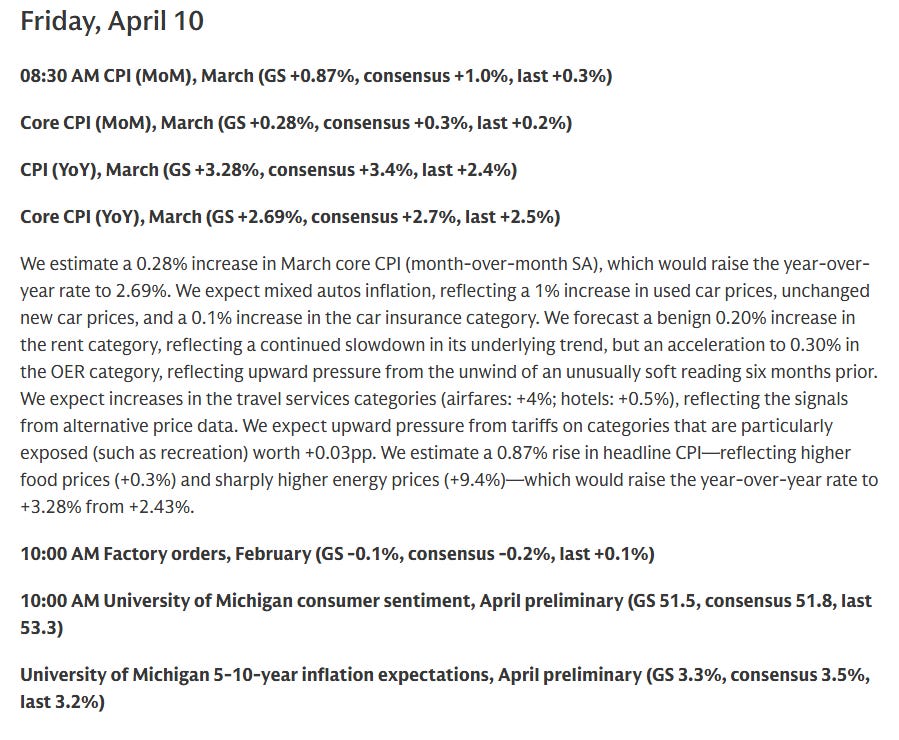
CPI previews from Goldman and BoA:
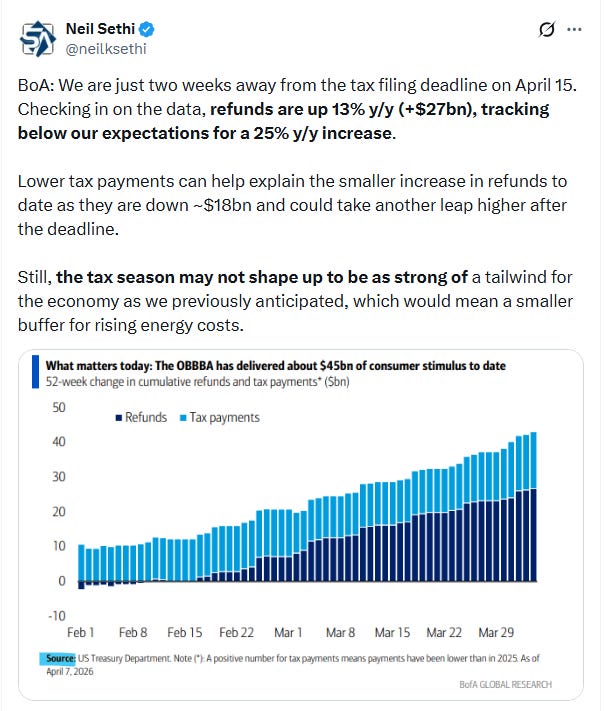
BoA says tax refunds are coming in below their estimates:
Link to posts for more details/access to charts - Neil Sethi (@neilksethi) / X
Note on all charts the lines are moving averages (the average price over various lookback periods (days on the daily charts, weeks on the weekly charts, etc.))”
20 = green
50 = purple
100 day = blue
200 day = brownMACD = Moving average convergence/divergence line, a measure of a momentum that compares longer term and shorter term momentum to gauge if a move is strengthening or weakening,
RSI = Relative Strength Index (basically what it sounds like) = measures the strength of the move comparing gains to losses over the given lookback window (I use the standard 14-periods)
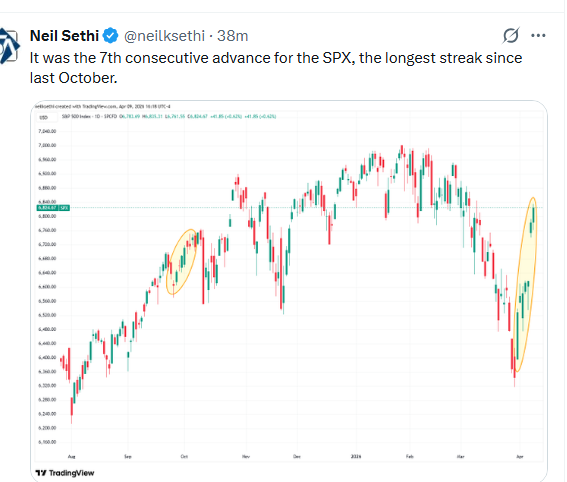
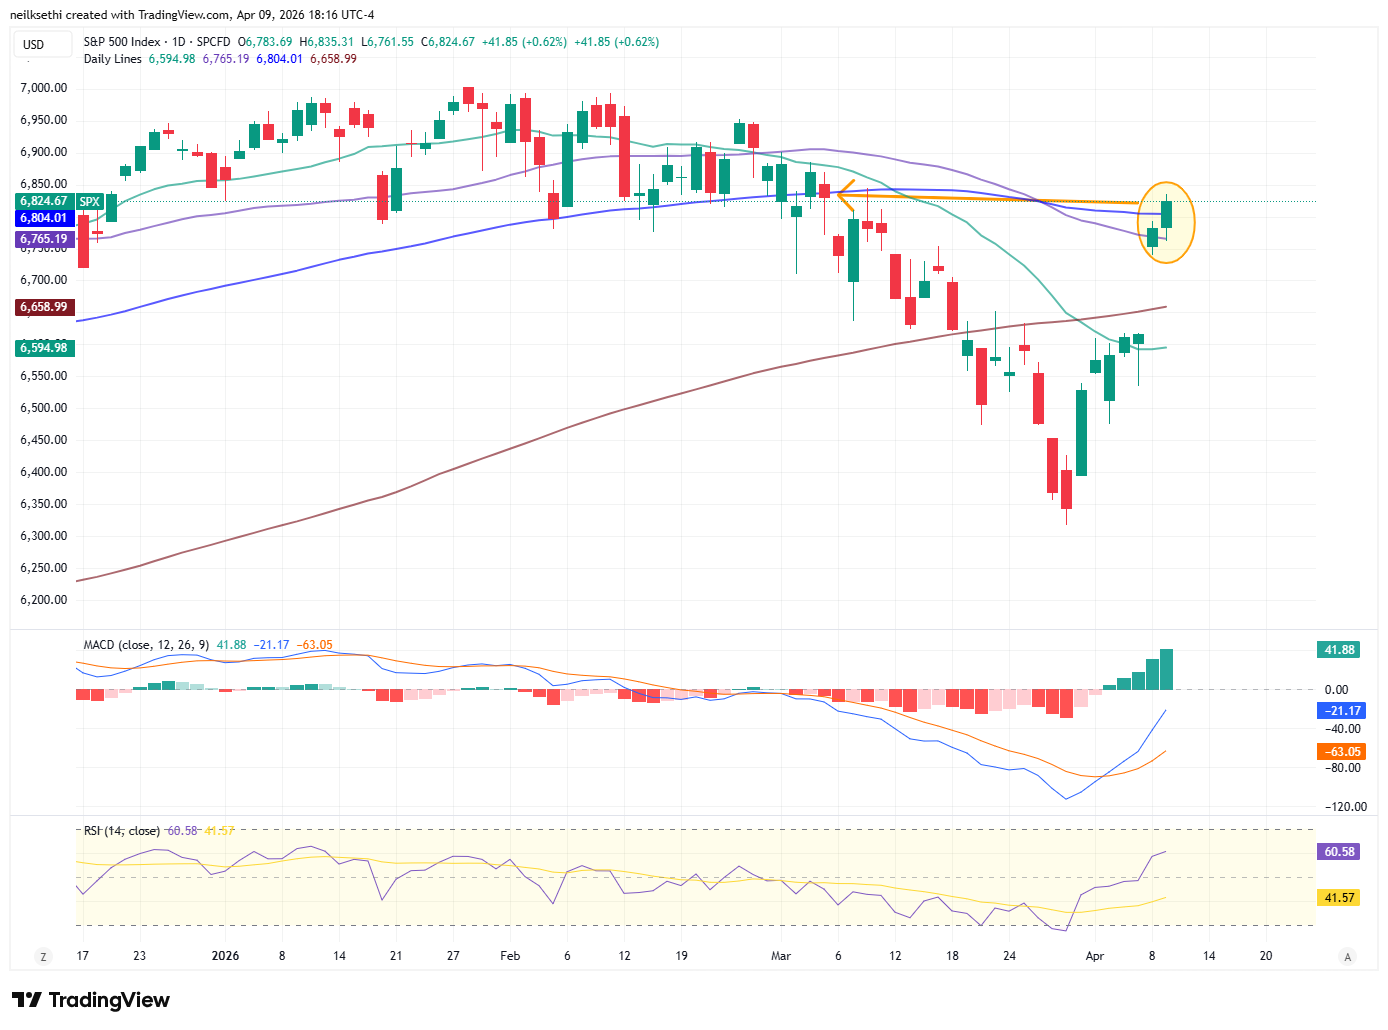
SPX up for a 7th straight session, not through its 100-DMA and more importantly the 6800 level flagged Tuesday. As I said Wed, “I’d like to see it take and hold that level before stepping in, but now my sights are set higher and will also be watching for a dip to buy.” But with the index clearing the 6800 level I’ve made a buy at this point with a stop at 6750. Daily MACD and RSI are now strongly positive.
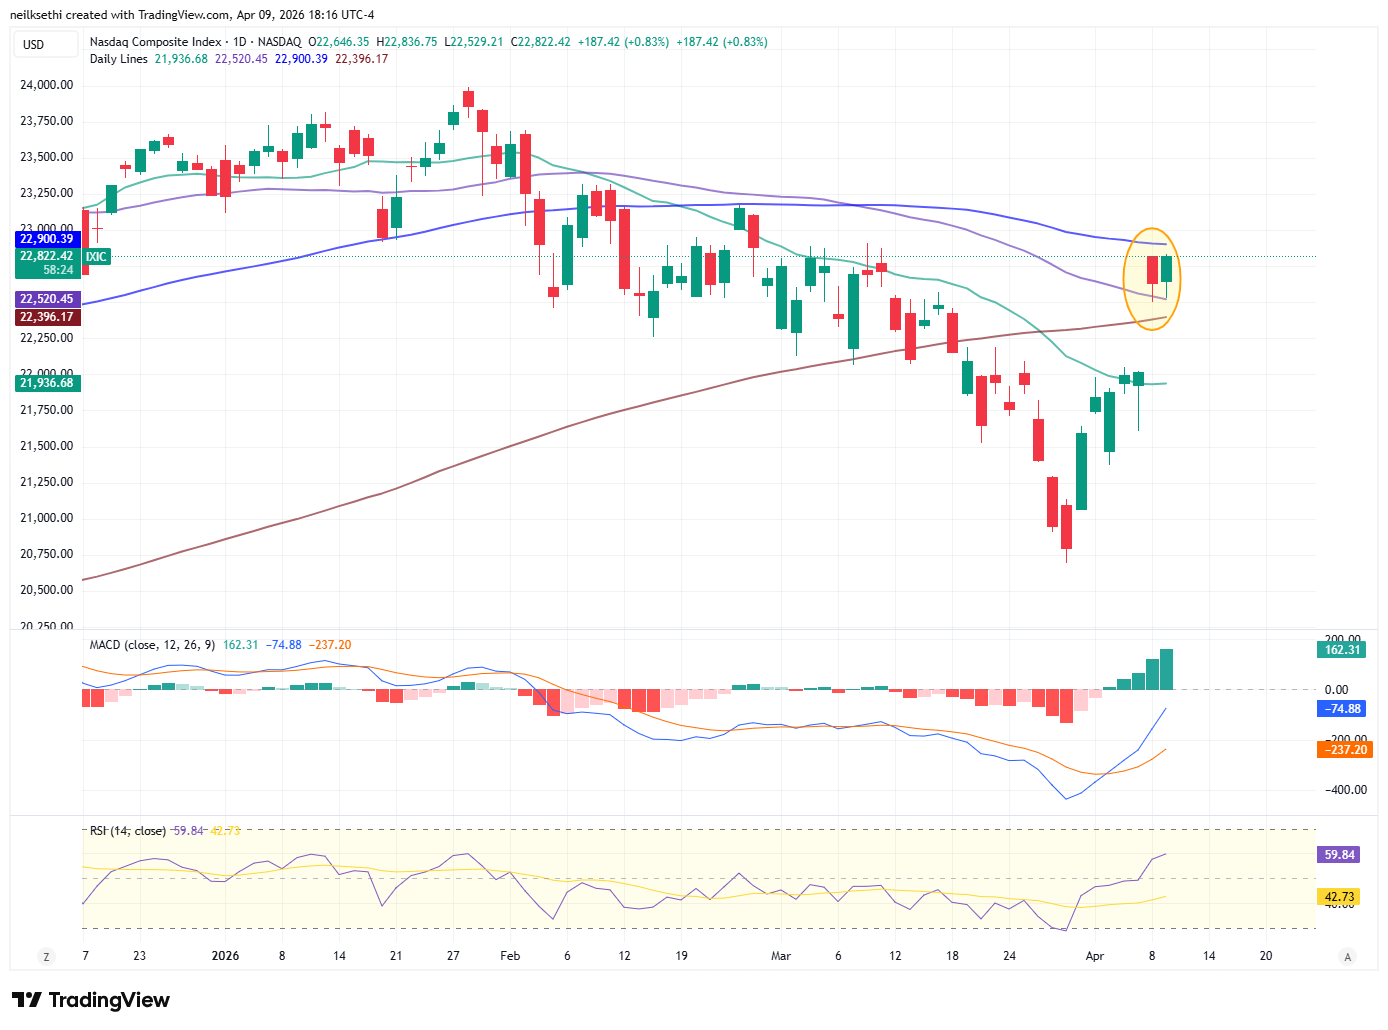
The Nasdaq Composite remains under its 100-DMA and the 23,000 level noted Wed, so not yet pulling the trigger there.
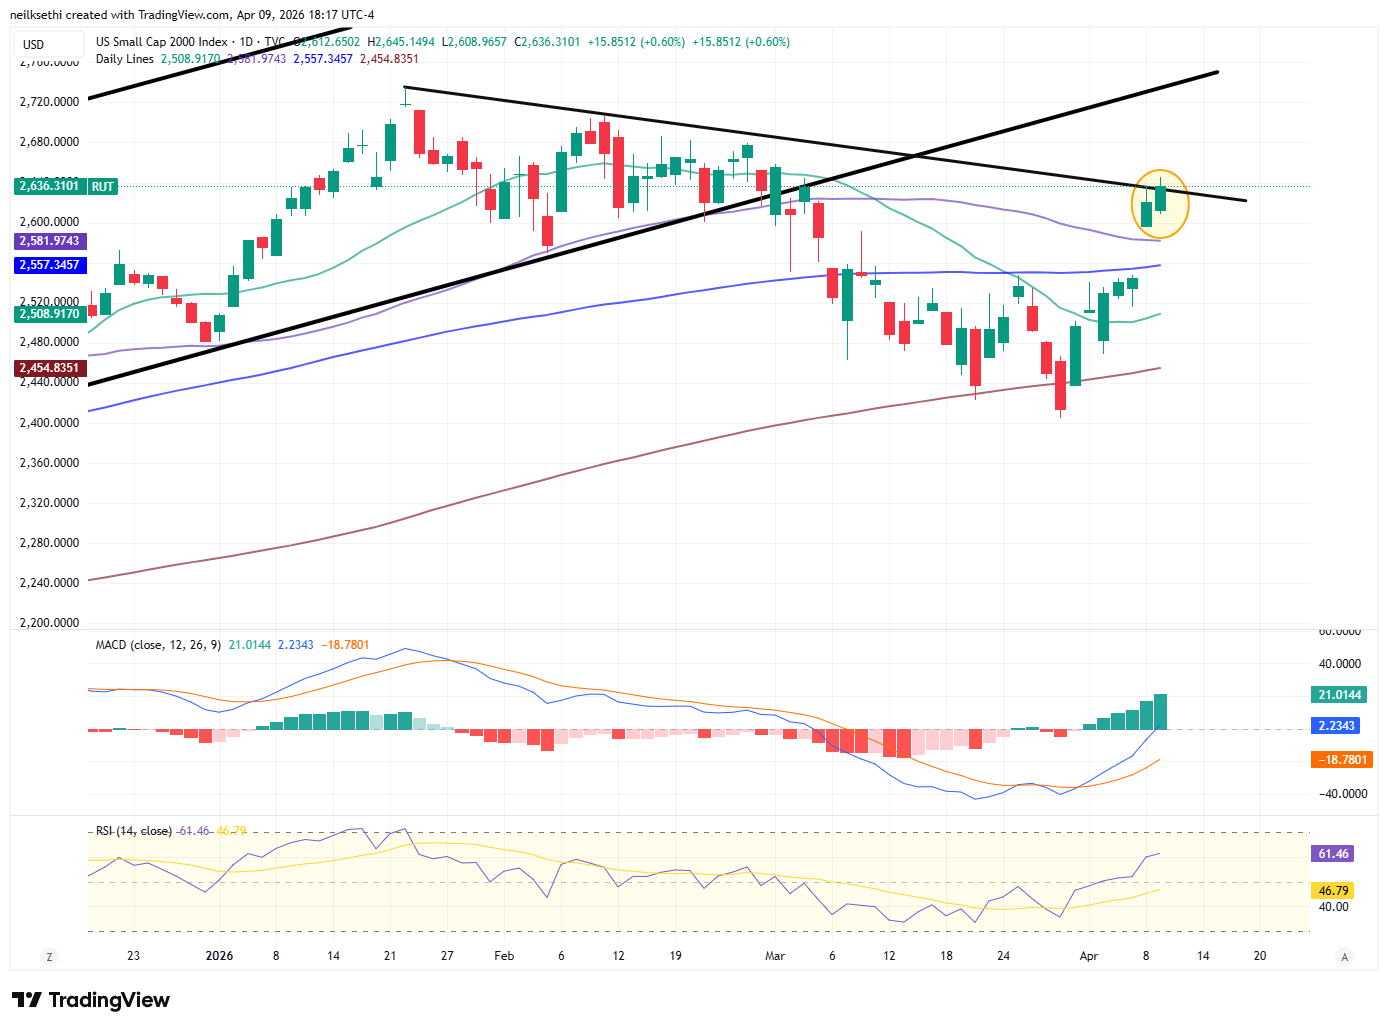
RUT (Russell 2000) I have described the past few weeks as “easily the best looking chart of the three,” and one that I should have bought when it broke over its downtrend line, but I didn’t want the headline risk pre-ceasefire (as fragile as it remains). As noted Wed, “now through all of the major moving averages but getting stopped at one last trendline (from the all-time highs) that it needs to clear.”
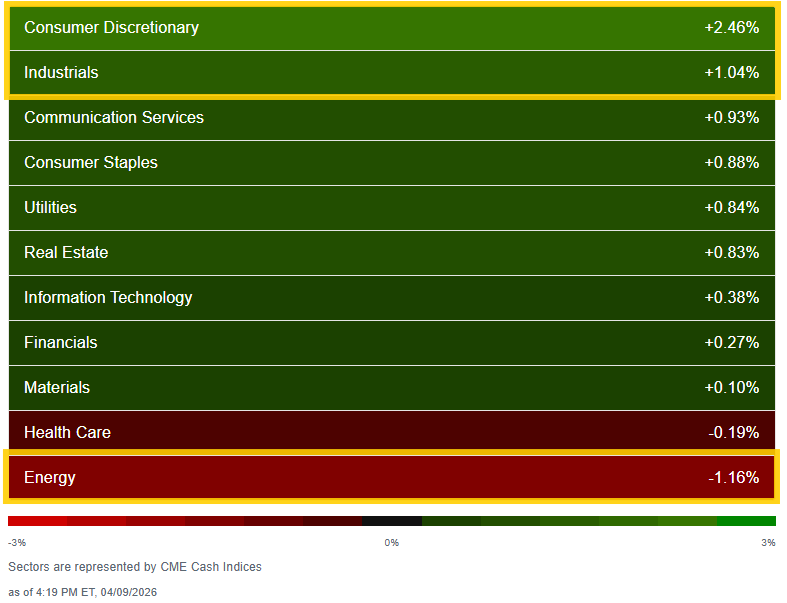
Sector breadth remained solid with 9 of 11 sectors higher (after 10 Wed) although the gains were more modest with just two sectors up over 1% (vs 10 Wed) led by Cons Discretionary +2.5% on the back of a +5.6% jump in AMZN. The other was Industrials up another +1% after +3.75% Wed, its best day since April 9th)
Energy in last place for a second day -1.2% after -3.7% Wed.
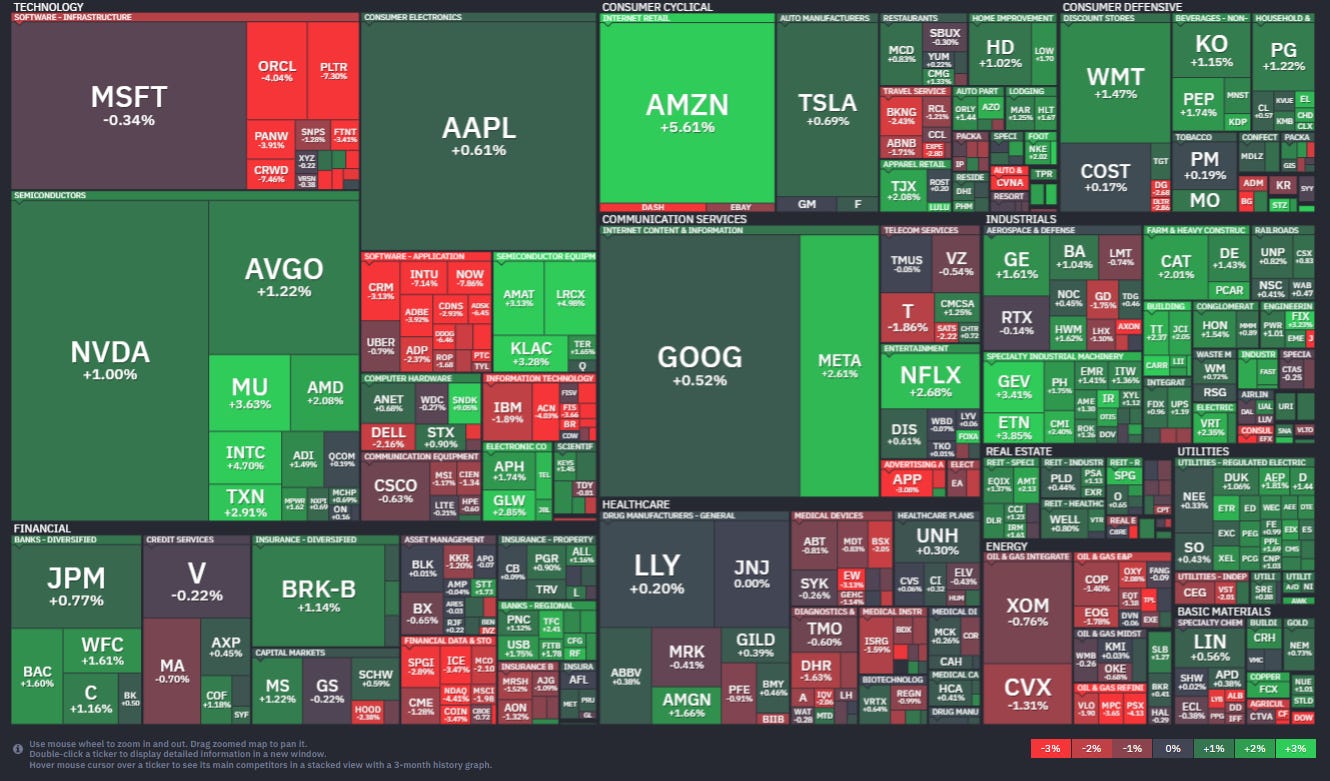
Stock-by-stock SPX flag from finviz_com consistent with the green dialing back and the red increasing.
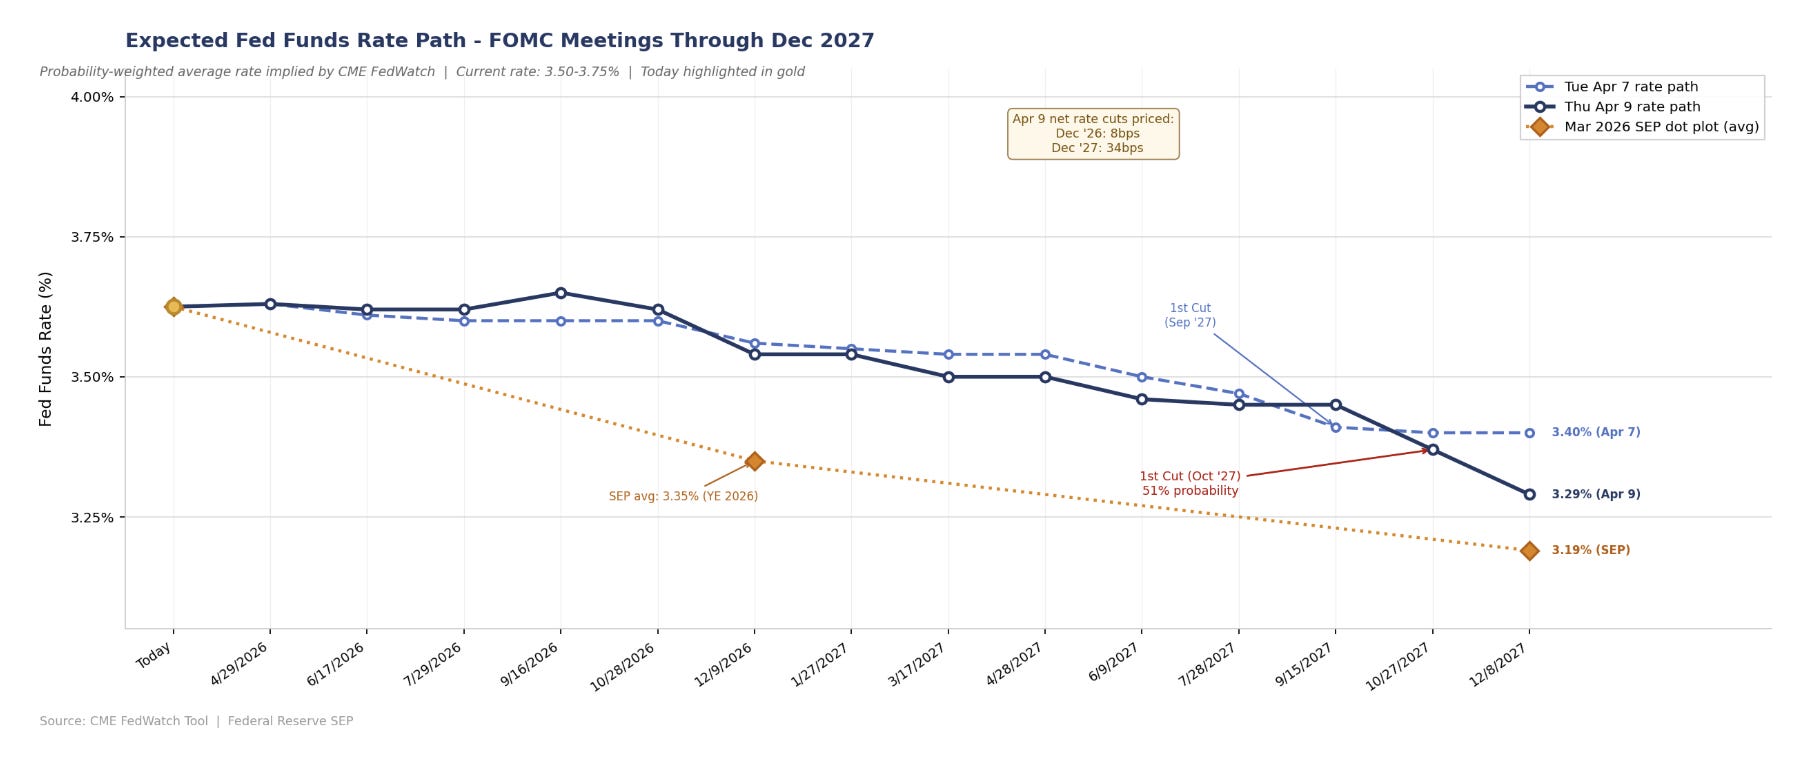
After the relatively elevated inflation print and renewed rise in crude prices we did see 2026 FOMC rate cut pricing soften (fewer cuts) but 2027 on net is looking for more cuts.
The first cut (assuming no hikes) moved back to October 2027. A second cut remains off the board at 35% for Dec ‘27.
Pricing for 2026 now has +8bps of cuts (compared to the average dot on the dot plot of +28bps in cuts). 2027 is at +34bps of cuts from current levels (compared to +43bps of cuts from current levels for the average dot on the dot plot), corresponding to a terminal rate of 3.29%, down from 3.45% Monday, but also up from 2.80% pre-war.
Change from Tuesday (because Wed’s readings were not usable). Note includes the dot plot average in orange.
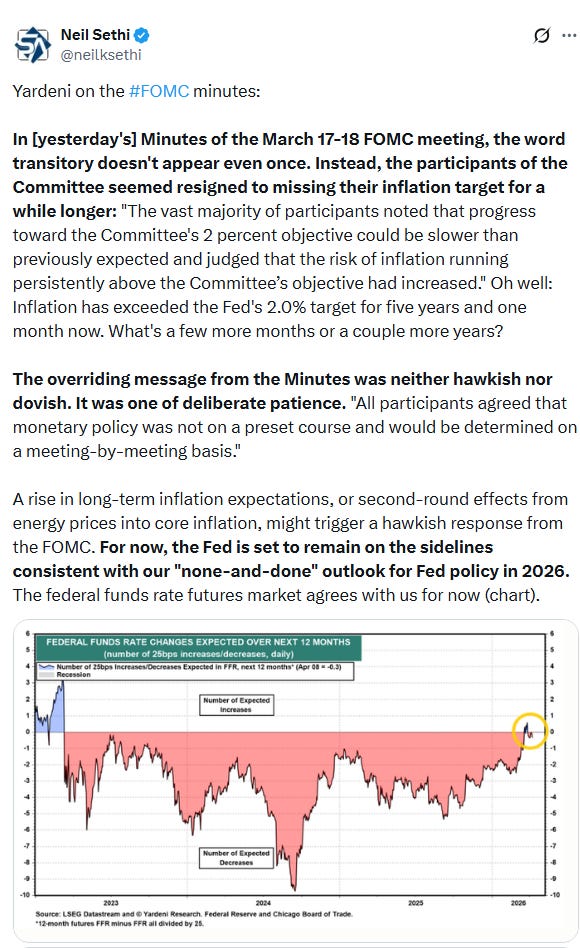
I did a piece on the FOMC minutes:
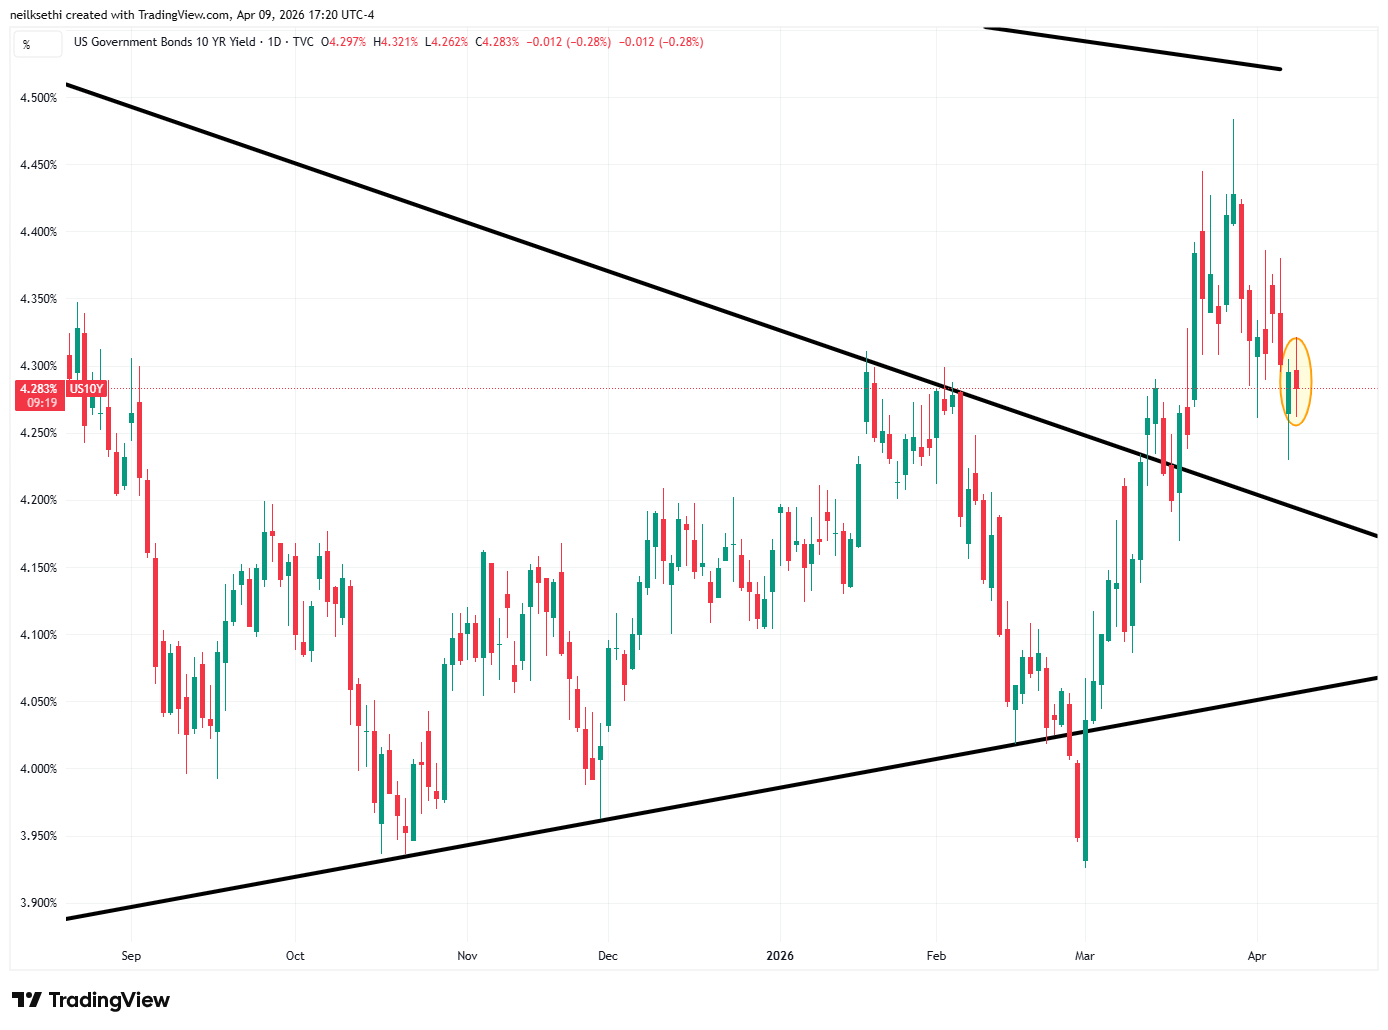
The 10yr UST yield edged down to the lowest close in three weeks at 4.28%, down -15bps from the highest since July hit at the end of March.
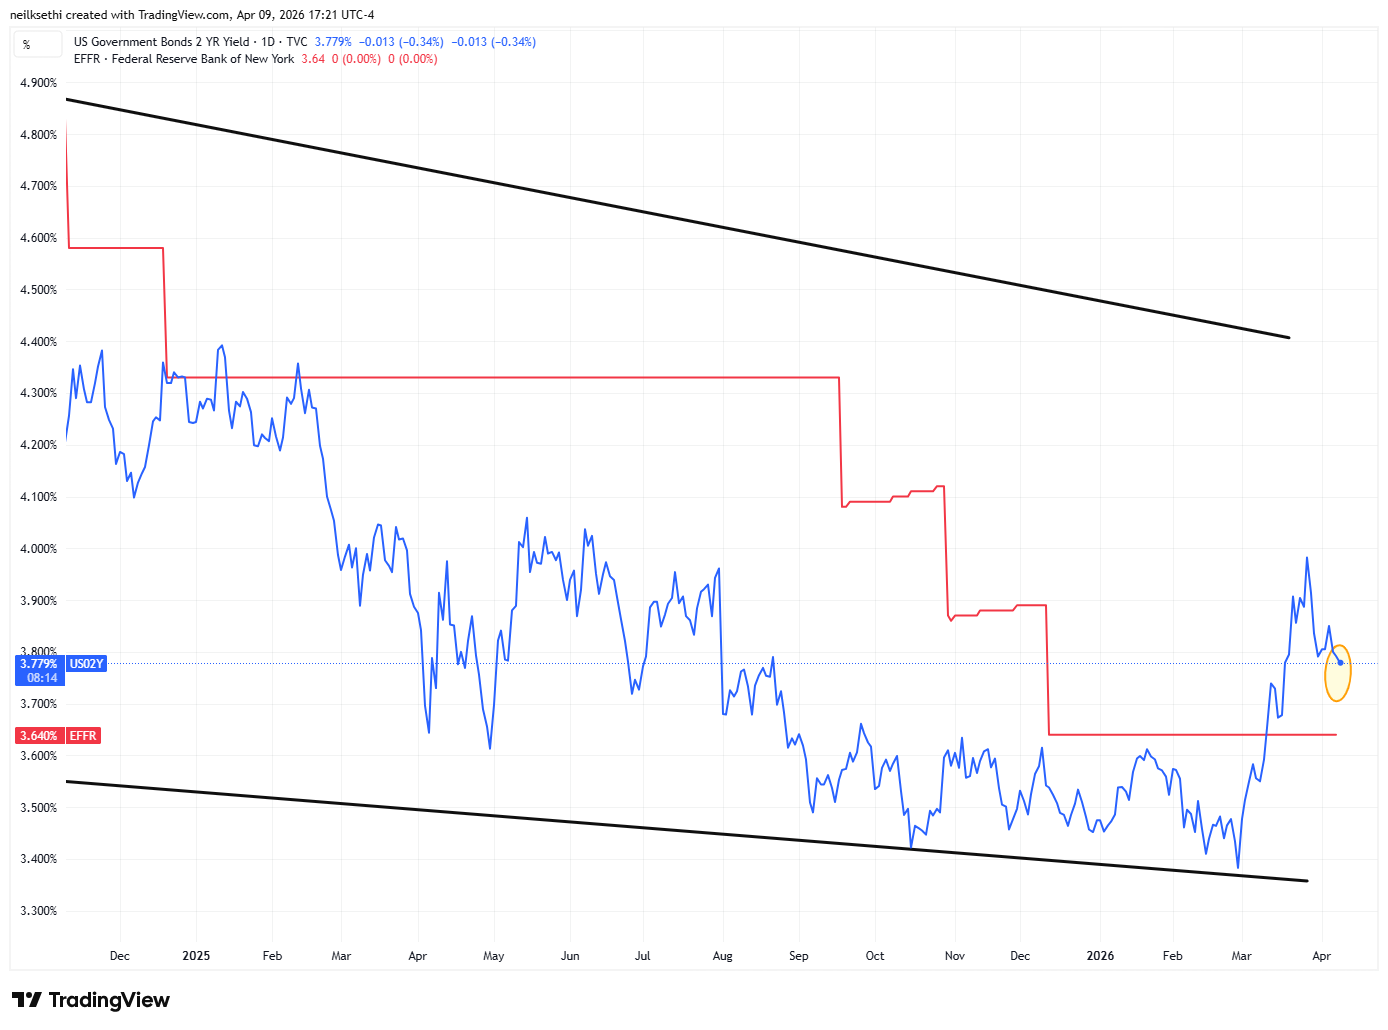
The 2yr yield, more sensitive to FOMC rate cut pricing, also the lowest close in three weeks at 3.78%, still +16bps above the Effective Fed Funds rate (red line), consistent with perhaps one Fed cut over the 2-year window.
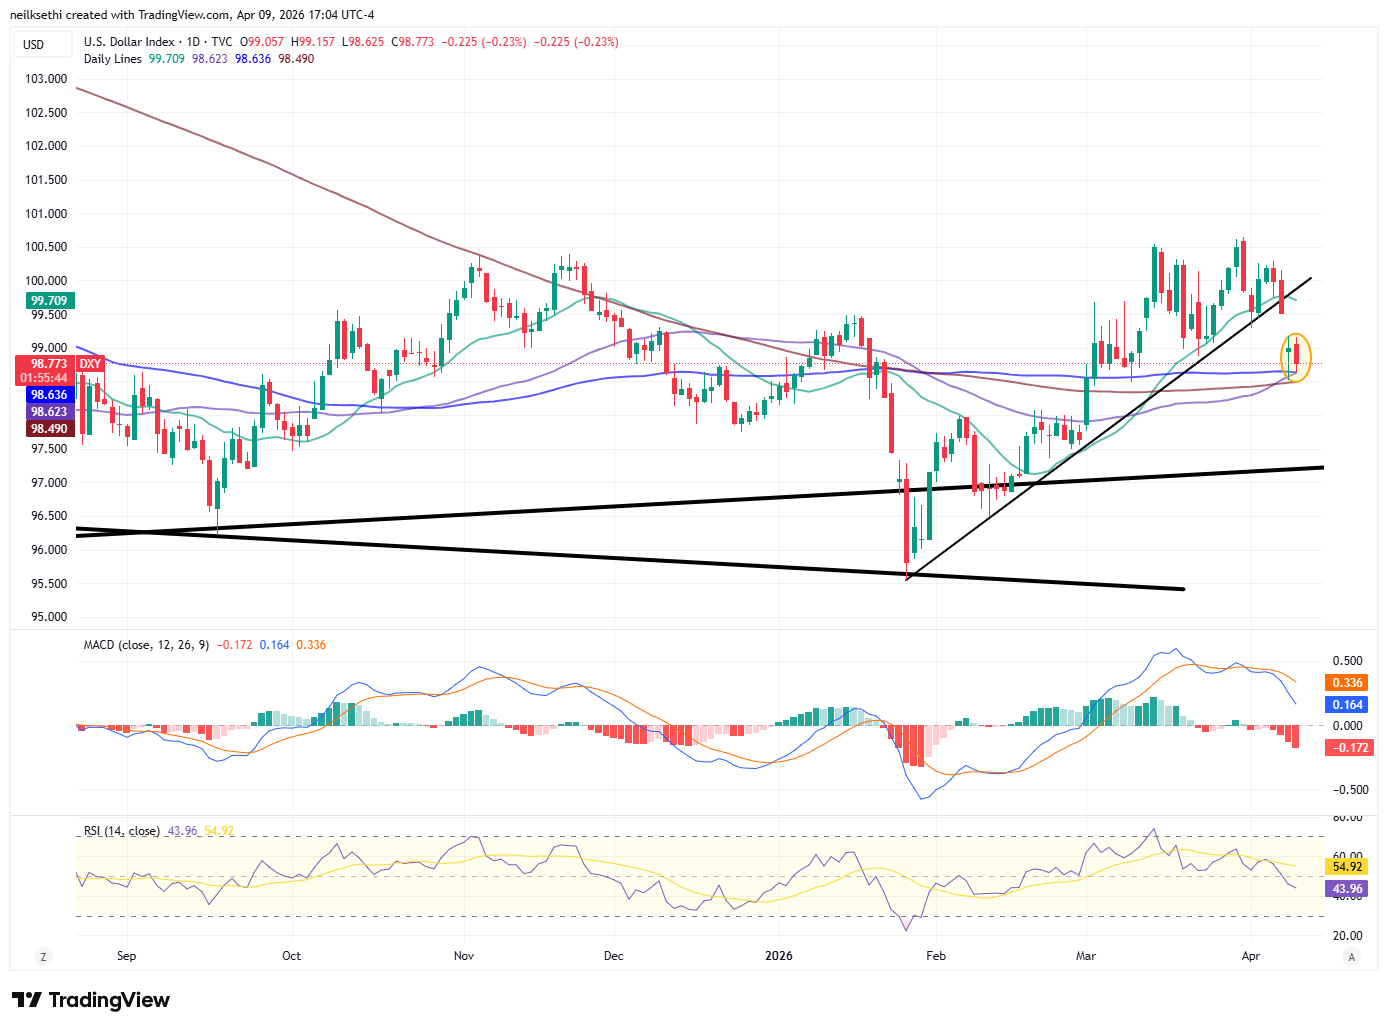
The $DXY dollar index (which as a reminder is very euro heavy (57%) and not trade weighted) again tested the confluence of its 25, 100, and 200-DMAs which again held. As I noted Wed, “it’s now conclusively below the uptrend line from the Jan lows, but I guess as long as it holds the 200-DMA I won’t turn super-bearish. As noted last week, though, the daily MACD is already pointing in that direction and now the RSI is as well.”
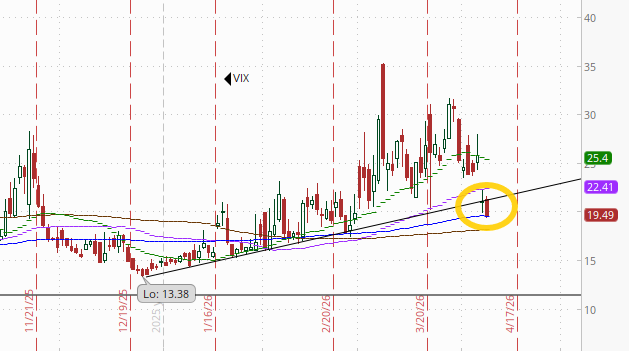
I had asked whether the VVIX falling below its uptrend line from the Dec lows might presage the VIX doing the same, and it did just that today, closing under for the first time since then and overall the lowest close since Feb 26th at 19.5. Still elevated though and consistent w/~1.22% average daily moves in the SPX over the next 30 days.
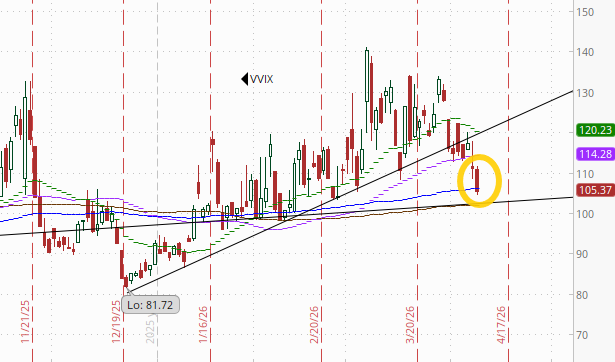
The VVIX (VIX of the VIX) at 111.1 continued its decline to 105.4, now also the least since February and well under its line from the December lows.
The current level is still consistent with “moderately elevated” daily moves in the VIX over the next 30 days (historically, normal is 80-100, but we’ve been above 90 most of the time since July ‘24)). Above 100 is the level flagged by Charlie McElligott as indicating higher stress.
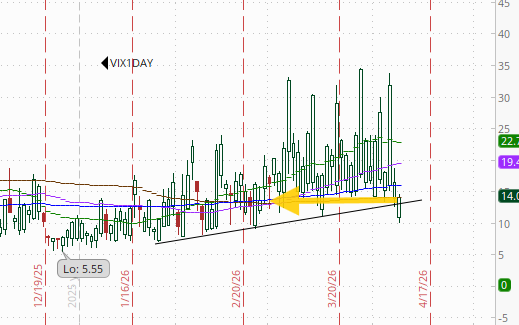
Like the VIX and VVIX, 1-day VIX fell to the least since February at 14.1. That’s consistent with a move of 0.88% in the SPX next session.
WTI was up but finished well off the highs following the announcement of Israel/Lebanon talks next week. As noted Wed, it’s broken its uptrend line and as mentioned a couple of weeks ago the technicals are not favorable. As I said Wed, “its path from here likely depends mostly on whether the ceasefire holds and the Strait of Hormuz reopens.”
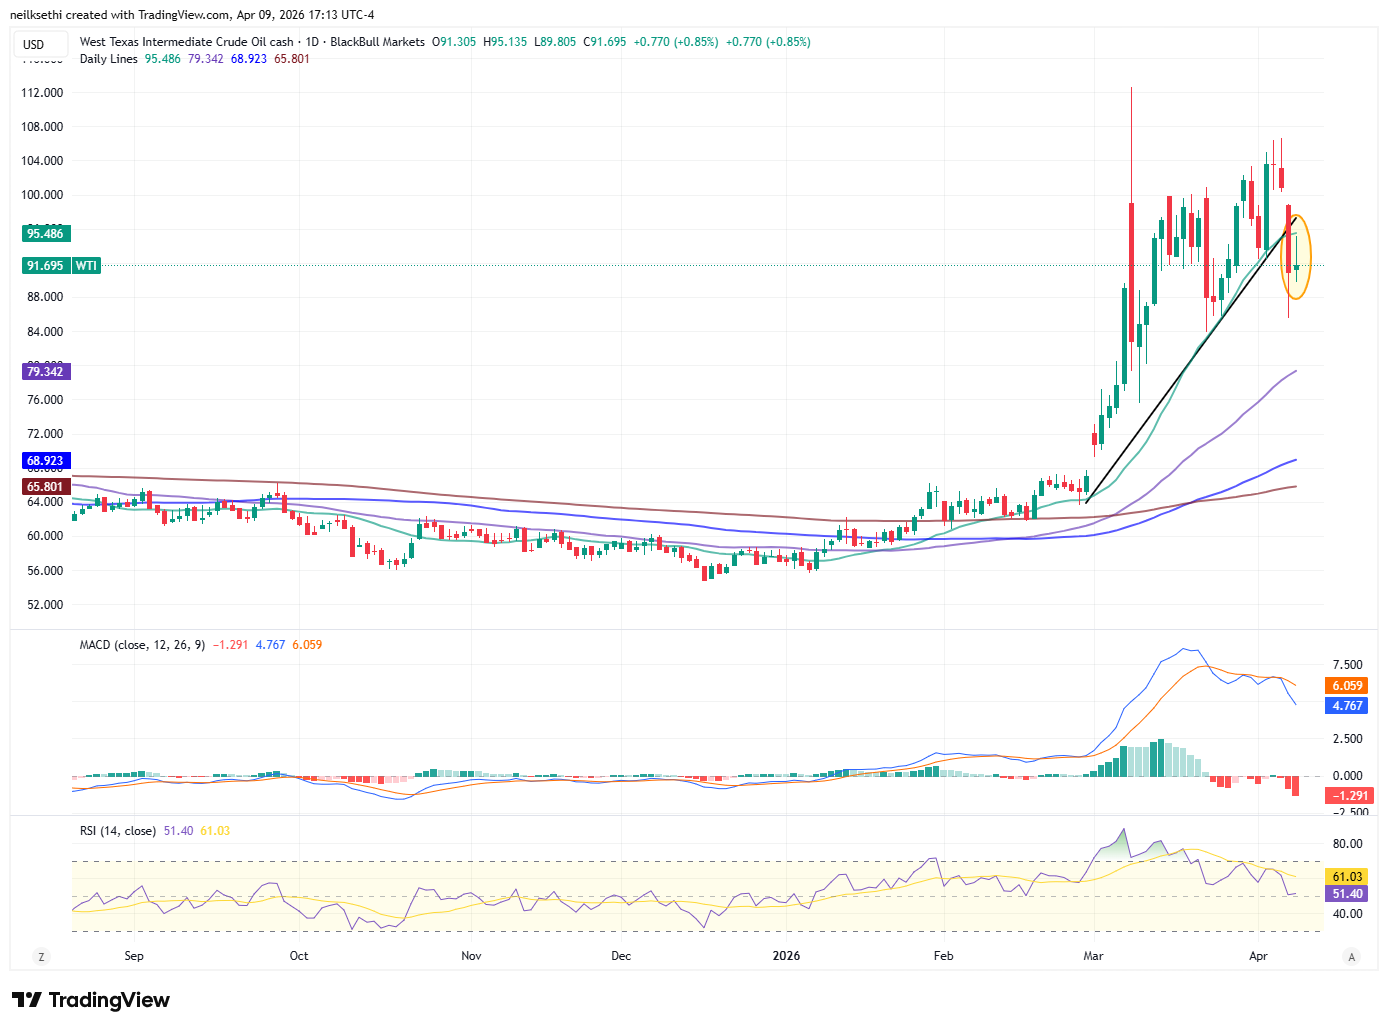
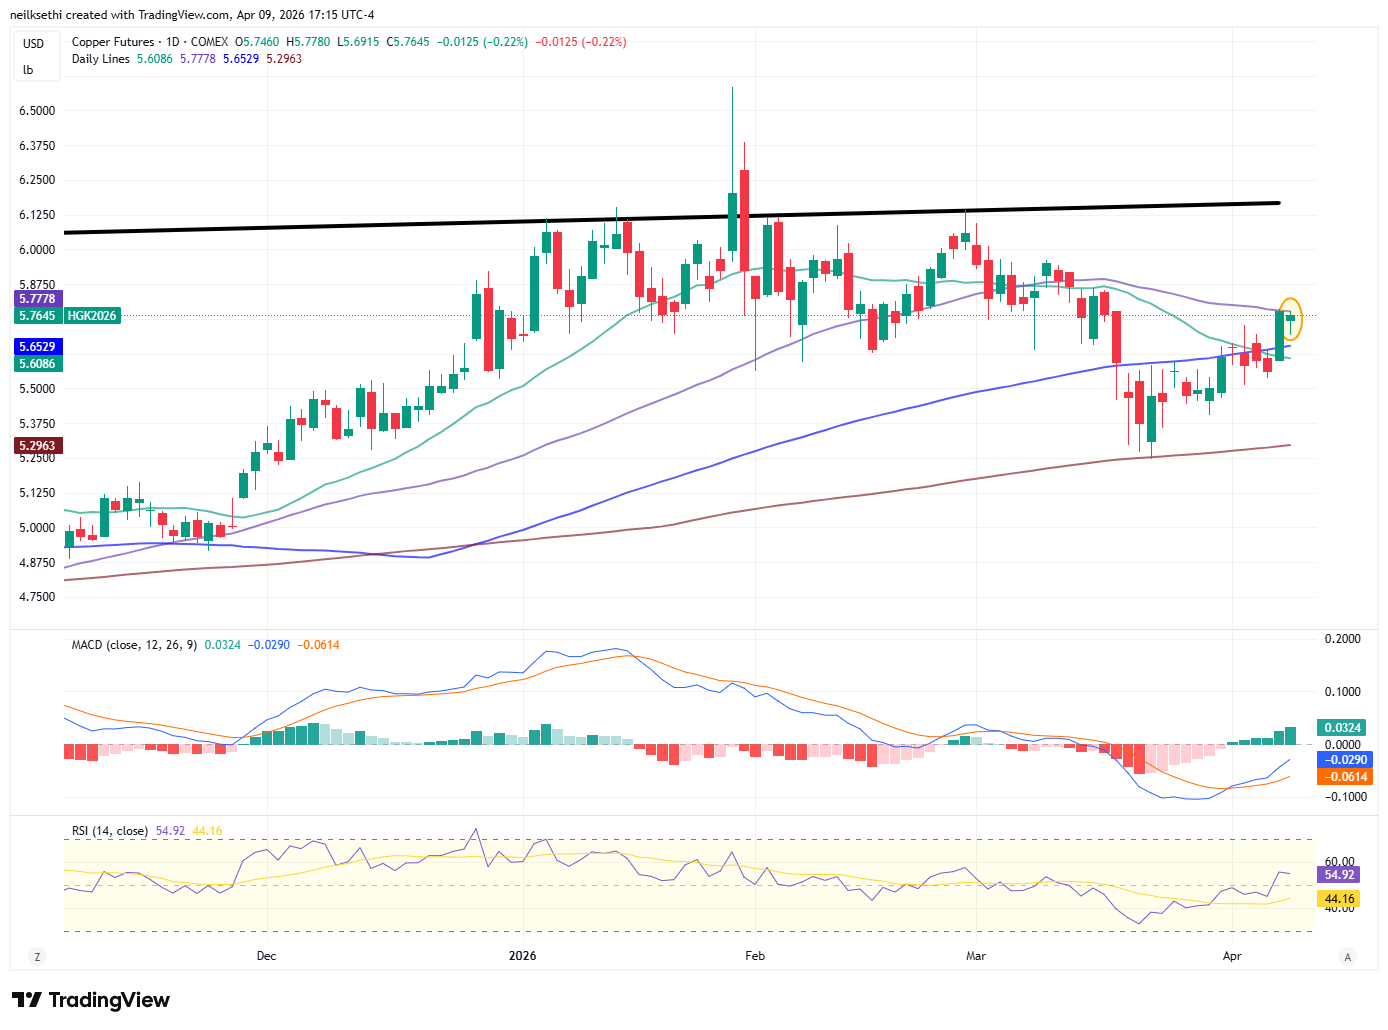
Goldman updates their oil price forecasts:
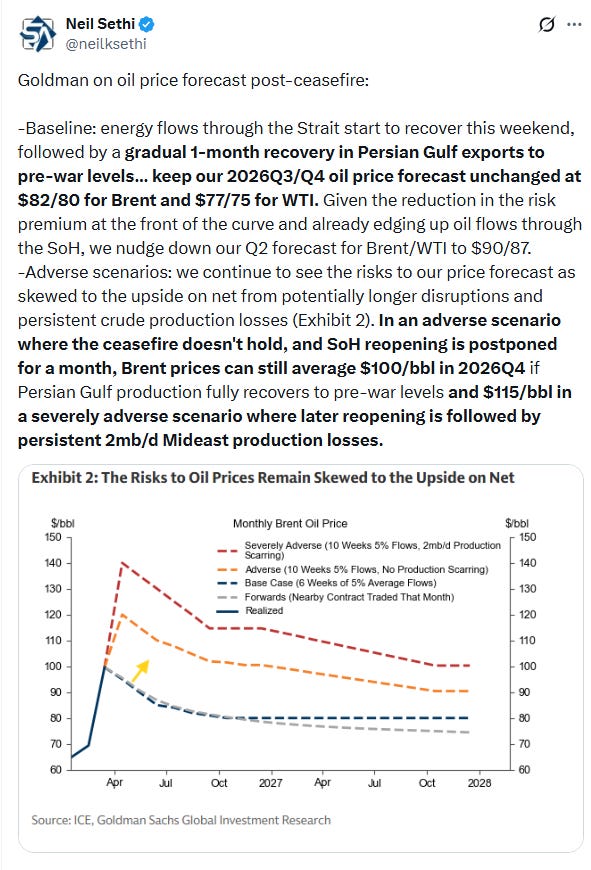
Gold futures (/GC) moved to the highest close in three weeks. For now, they remain in their old channel from early 2024 that they left at the start of 2026 for a couple of months. The technicals are favorable with the MACD in a “cover shorts” reading while the RSI is over 50.
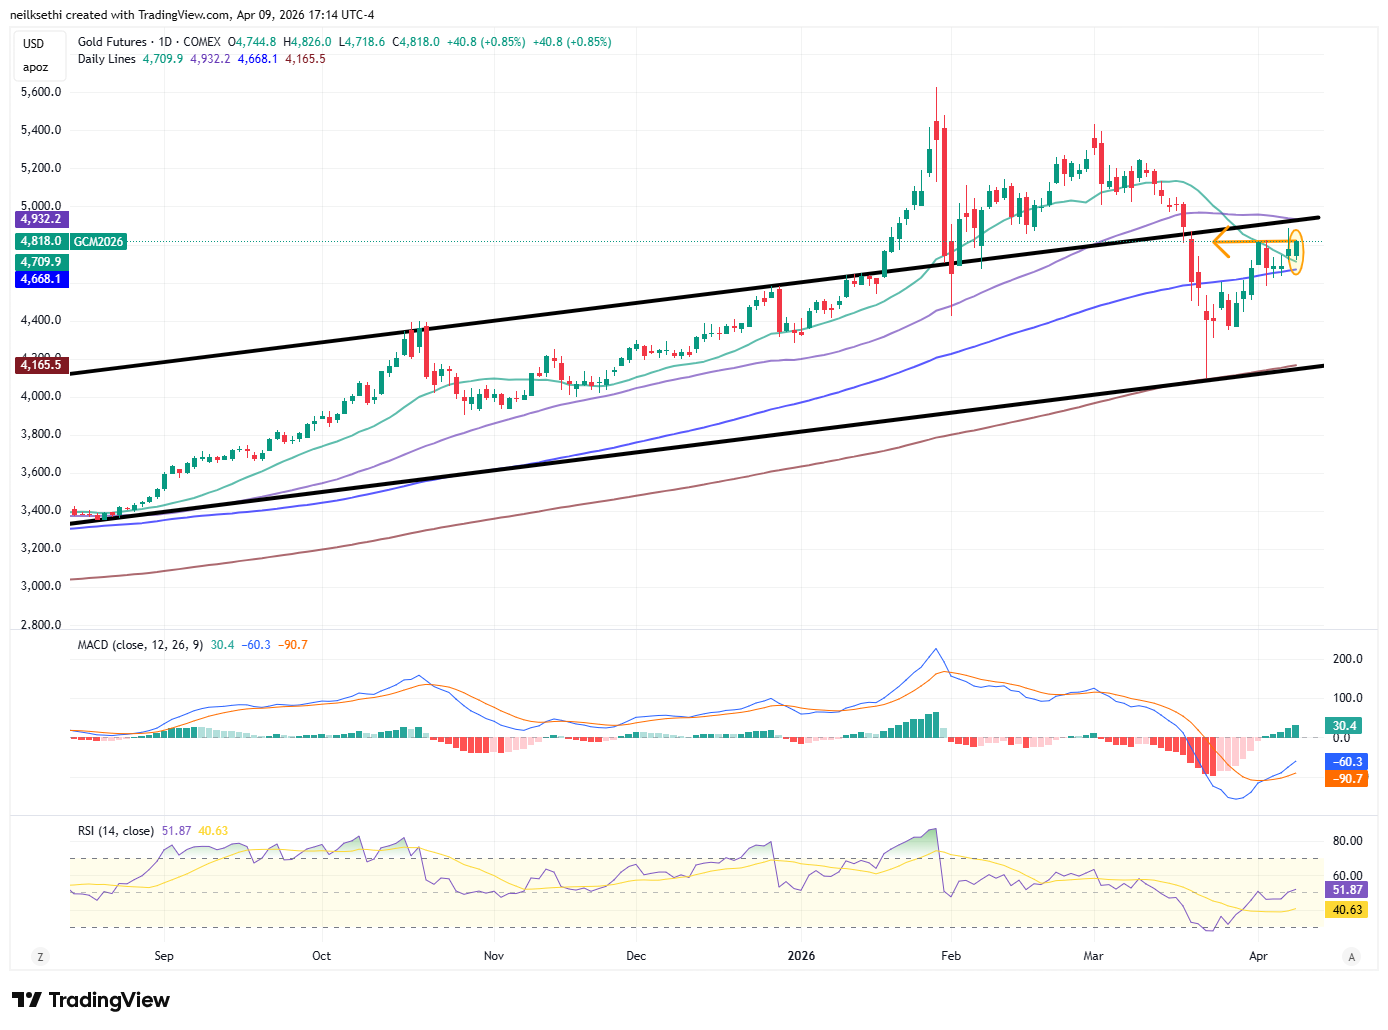
US copper futures (/HG) ended a little lower not able to get through their 50-DMA. Like gold, the daily MACD is in a “cover shorts” positioning, but the RSI is a little stronger.
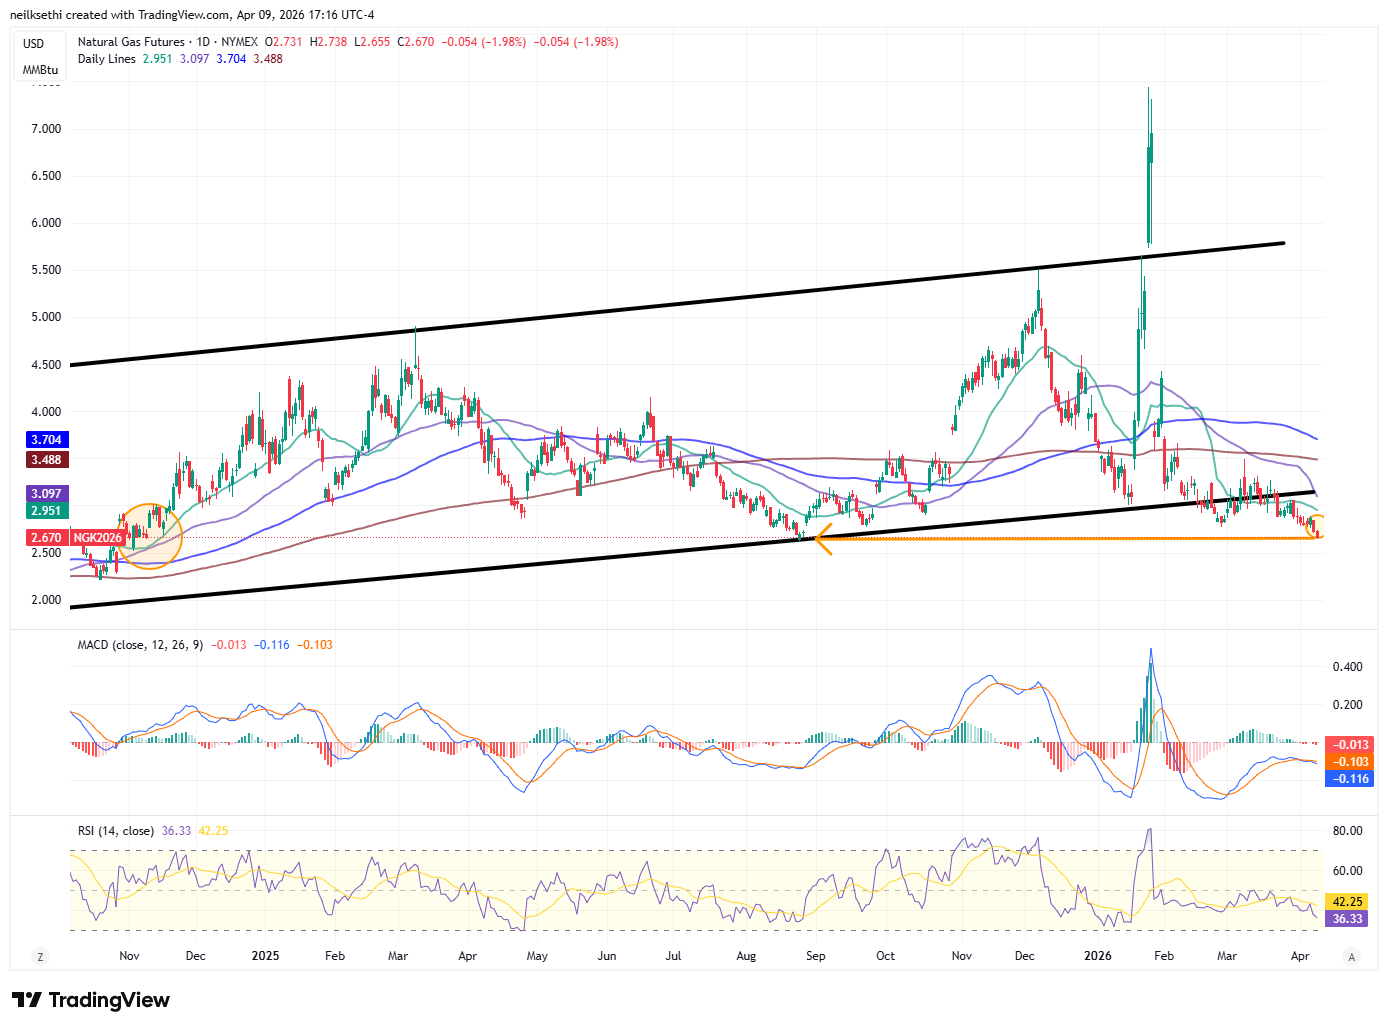
Natural gas futures (/NG) dropped -2% to right at the lows from August (which were the least since Nov ‘24). The daily MACD is pushing into a “go short” reading, and the RSI is under 40, so as I said last week “not much to get excited about, particularly with winter in the rear-view mirror.”
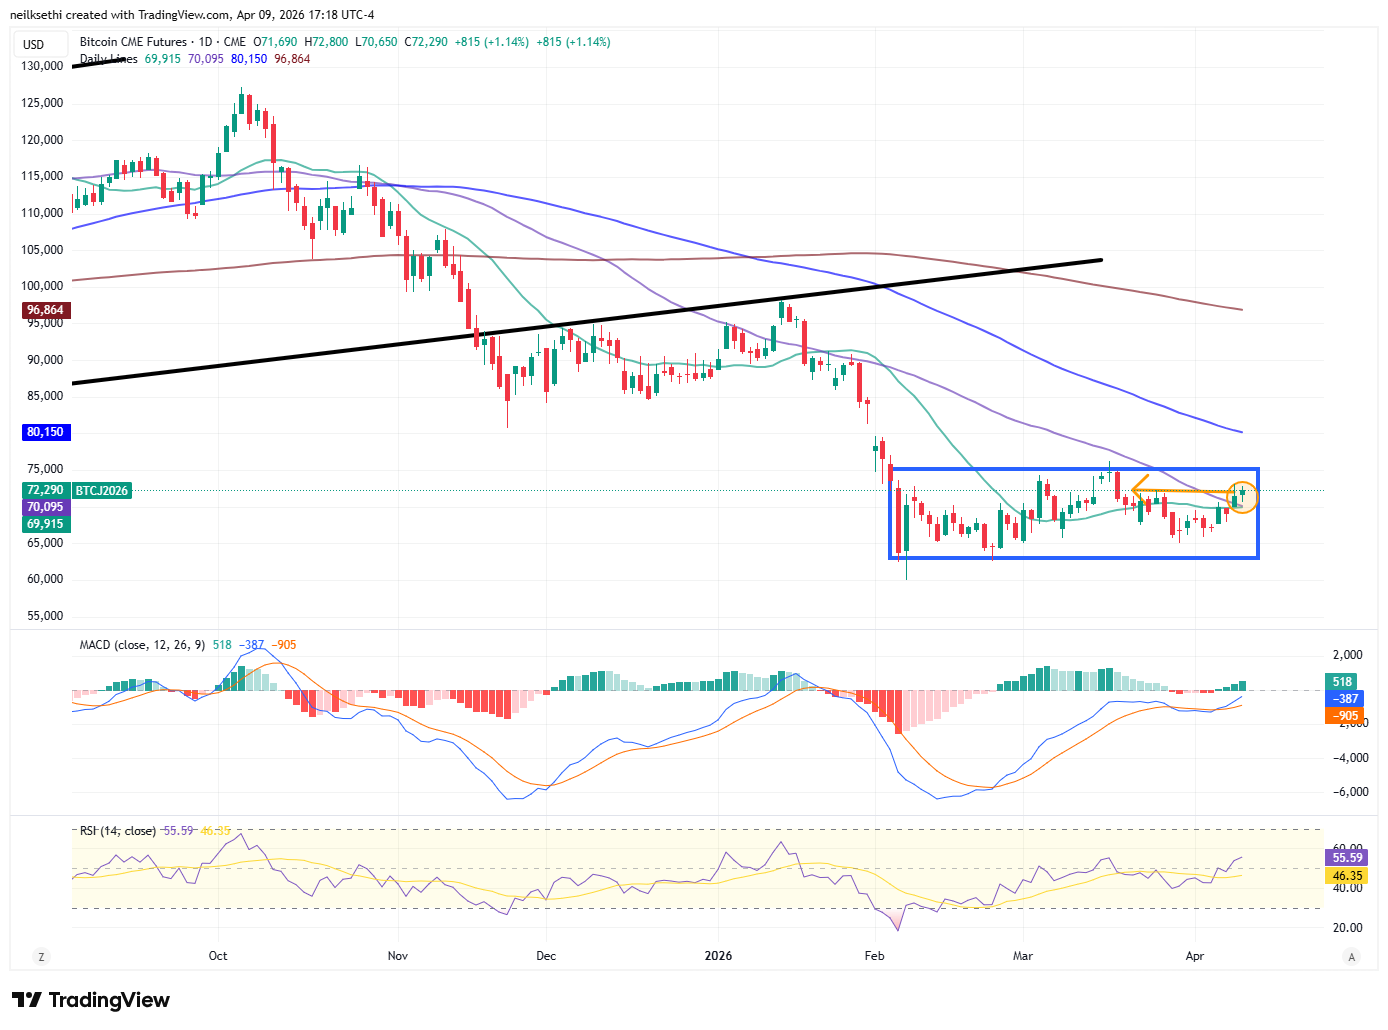
Bitcoin futures up 1% to the highest close in three weeks, but for now remaining in their the range since the start of February (the blue box). The daily MACD remains in a “cover shorts” reading, and the RSI is back over 50, plus it cleared the 50-DMA so as I mentioned Wed, “we could see it test the top of the range again at least.”
The Day Ahead
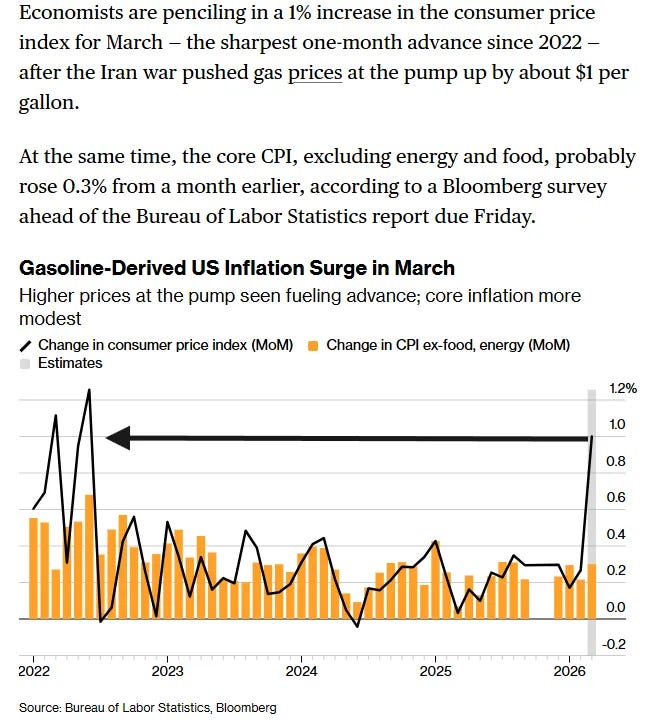
US economic data remains heavy Friday with arguably our most important data point in the release in March CPI which will give us our first look at economy-wide impacts from the Iran conflict on consumer prices. We’ll also get Feb factory orders and the preliminary April UMich consumer sentiment report.
No Fed speakers on the calendar again, but we’ll see if we don’t get an interview or two.
Non-bill Treasury auctions (>1yr in duration) done for the week.
SPX reporters are also done for the week (but pick up in a big way next week).
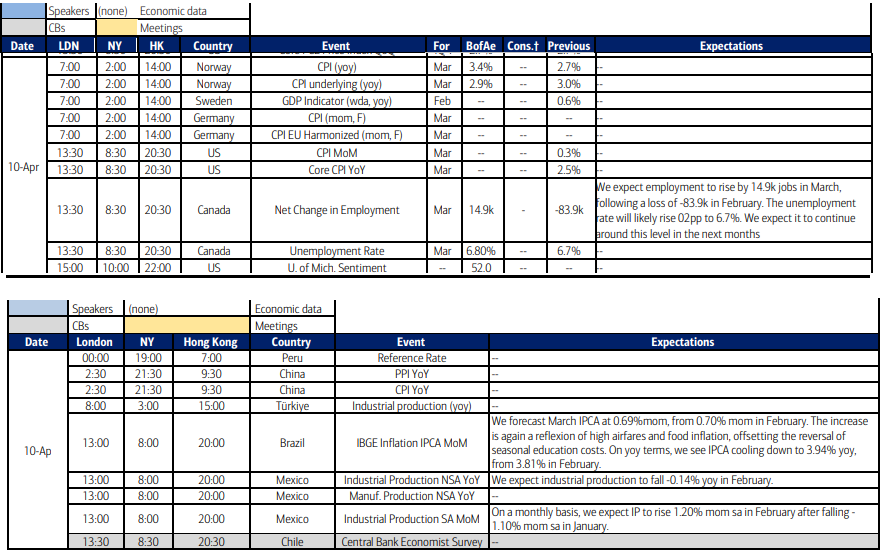
Ex-US highlights are China CPI/PPI, Canada employment, a policy decision from S Korea (Thurs night), and Brazil CPI.
Link to X posts - Neil Sethi (@nelksethi) / X
To subscribe to these summaries, click below (it’s free!).
To invite others to check it out,