


Markets Update - 6/17/25
Update on US equity and bond markets, US economic reports, the Fed, and select commodities with charts!

To subscribe to these summaries, click below (it’s free!).
To invite others to check it out (sharing is caring!),
Link to posts - Neil Sethi (@neilksethi) / X
Note: links are to outside sources like Bloomberg, CNBC, etc., unless it specifically says they’re to the blog. Also please note that I do often add to or tweak items after first publishing, so it’s always safest to read it from the website where it will have any updates.
Finally, if you see an error (a chart or text wasn’t updated, etc.), PLEASE put a note in the comments section so I can fix it.
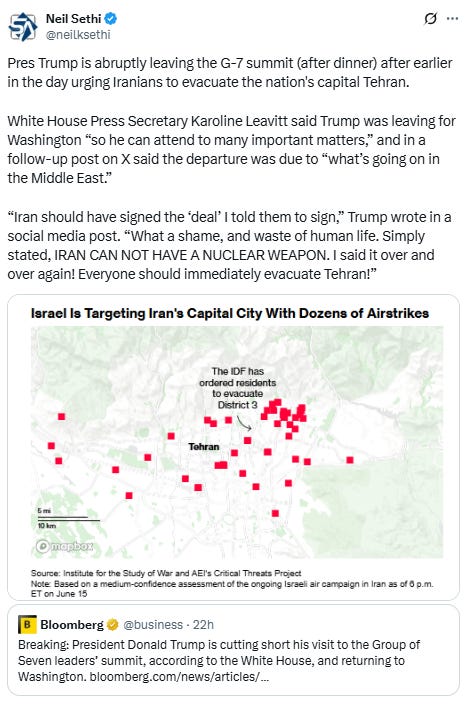
Major US equity indices started the day lower after President Trump abruptly left the G-7 meeting last night after earlier urging residents of Tehran to evacuate, which Press Secretary Leavitt confirmed was due to issues in the Mid-East, but he said in an interview on the way back that his departure had “nothing to do with a Cease Fire. Much bigger than that,” and that he was looking for a “real end, not a ceasefire, an end” to the conflict, saying “I’m not too much in the mood to negotiate.”
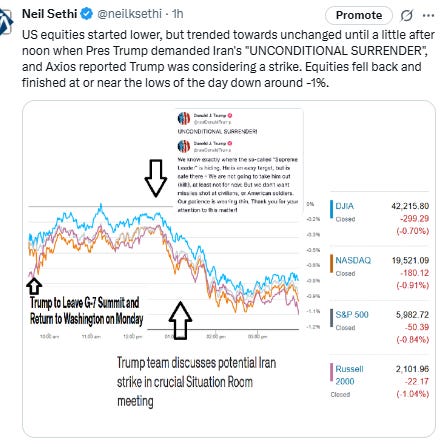
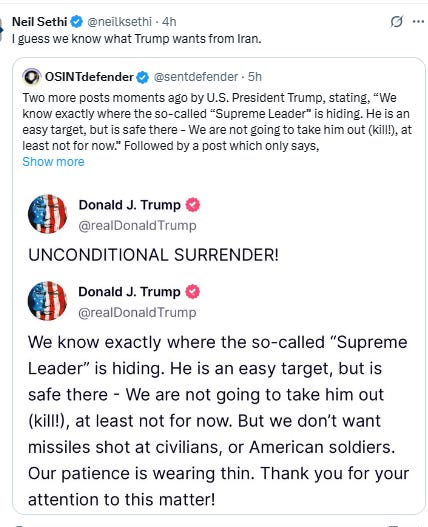
Equities though were able to make upward progress despite weaker than expected headline retail sales and industrial production reports but then dropped sharply when Trump in a social media post demanded Iran's "UNCONDITIONAL SURRENDER", saying in another that “We know exactly where the so-called ‘Supreme Leader’ is hiding. He is an easy target, but is safe there - We are not going to take him out (kill!), at least not for now”. Soon thereafter Axios reported Trump was meeting in the Situation Room considering a strike. Additionally, German Chancellor Friedrich Merz told the country’s public broadcaster ZDF that a US decision on whether to join the war militarily would come “in the course of the day” and said that if Iran doesn’t return to the negotiating table, then “the complete destruction of Iran’s nuclear program may be on the agenda.” Meanwhile the USS Nimitz aircraft carrier strike group is sailing to the Middle East ahead of schedule, marking the first significant move of American military assets to the region since Friday Equities fell back and finished at or near the lows of the day down around -1%.
Elsewhere, Treasury yields fell back, while Fed rate cut expectations saw more cuts pushed into 2026. The dollar rose as did crude and nat gas while gold, bitcoin, and copper all fell.
The market-cap weighted S&P 500 (SPX) was -0.8%, the equal weighted S&P 500 index (SPXEW) -1.0%, Nasdaq Composite -0.9% (and the top 100 Nasdaq stocks (NDX) -1.0%), the SOX semiconductor index -0.8%, and the Russell 2000 (RUT) -1.0%.
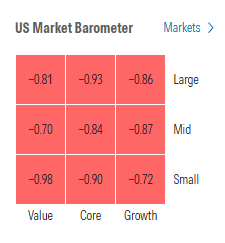
Morningstar style box showed broad losses across styles.
Market commentary:
Investors attempted Monday to put the Israel-Iran conflict in the rear-view mirror, interpreting news reports that Tehran was eager to resume talks on its nuclear program as a sign that it had "no intention — or possibly no means — to escalate the war," Ipek Ozkardeskaya, senior analyst at Swissquote Bank, said in a note. That eased concerns about potential disruption to the Strait of Hormuz, a critical chokepoint through which around 20% of global oil and gas flows transit. But oil prices were back on the rise and stocks were under pressure early Tuesday, with President Donald Trump warning residents of Tehran, with a population of nearly 10 million, to evacuate. That means "this is not a classic de-escalation story," Ozkardeskaya wrote. Trump's call to evacuate Tehran and Israel's commitment to further strikes "makes it a one-sided de-escalation at best, and keeps risks across energy markets and haven assets tilted to the upside. If Iran fails to find room to maneuver diplomatically, it could easily make a U-turn."
The situation with Israel and Iran is "quite different this time," said Fawad Razaqzada, market analyst at City Index and FOREX.com. U.S. President Donald Trump said in a social-media post that "we now have complete and total control of the skies over Iran," which Razaqzada said suggests that the U.S. is "entering the fray." That's "hardly a surprise to be honest. This is not going to end well," the analyst told MarketWatch in emailed comments. "The conflict may get far worse in the short term, and this will send shockwaves through the oil markets — especially if there are disruptions in the Strait of Hormuz."
“Volatility continues as the Iran situation plays out,” Louis Navellier, chief investment officer of Navellier & Associates, said in emailed comments Tuesday. He pointed to major stock indexes trading down as well as rising oil and natural-gas prices.
″[Israel’s] main short-term objective is to neutralize the Iranian nuclear threat. Longer term, the more difficult goal is to effect regime change, though it is not clear whether that will be achievable,” said Jeff Buchbinder, chief equity strategist at LPL Financial.
“For now, markets will remain mostly on edge until they lower the temperature in the region,” said Kenny Polcari at SlateStone Wealth.
James Rossiter, head of global macro strategy at TD Securities, says the world is now juggling two potentially impactful shocks. For the U.S., the combination of tariffs and higher oil prices is a doubling-up of supply shocks that likely leaves the Fed doubling down on its strategy to maintain the current level of interest rates.But for the rest of the world, tariffs are a demand shock while higher energy prices are a supply shock. "In other words, growth is clearly weaker while the inflation impact is ambiguous and a function of the size of the energy price shock. This leaves risks around other central banks' policy paths (particularly in Europe) skewed to the downside, in our view, as growth slows and the inflation impact is less certain," he says. TD's year-end rate forecasts are for U.S. rates of 4%, European Central Bank rates of 1.75% and Bank of England rates of 3.75%.
“Investors should still expect some volatility in economic data due to lingering effects of trade policy,” said Bret Kenwell at eToro. “The economy and the consumer are holding up for now, but there are signs of vulnerability. That could present risks in the second half of the year — particularly if we see a further slowdown in jobs or spending.”
“While there has been a strong buy-the-dip mentality with investors having been rewarded for fading negative news this year, we think it’s best to pull back on risk,” said Andrew Tyler, JPMorgan Chase & Co.’s head of global market intelligence, who correctly predicted a multi-week stock rally back in April through this point. “Positioning indicates that irrespective of Israel-Iran, the market was setting up for a pullback,” he told clients this week.
“The economy is slowing with consumers nervous about exactly what lies ahead and are choosing to save overall rather than flash some cash at the shops and malls,” said Chris Rupkey, Fwdbonds chief economist.
Ross Mayfield at Baird thinks it’s “too late” for the central bank to change its course in response to the retail sales data, but he believes the weaker report could give the Fed some room to take a more dovish stance. “I definitely think that you want to see some dovish language acknowledge the economy cooling,” the investment strategist told CNBC. “July should be a live meeting, even though the fed funds futures aren’t pricing it in.”
“The Federal Reserve is navigating a narrow path,” said Seema Shah at Principal Asset Management. “We expect the Fed to wait until the fourth quarter before it reduces policy rates.”
What the Federal Reserve does with interest rates is less important that it used to be, according to Jurrien Timmer, director of global macro at Fidelity Investments. “What happens at the long end of the curve, which the Fed doesn’t directly control, is far more important,” Timmer said in an interview with “Squawk on the Street” Tuesday. “If the bond market concluded the Fed’s cut, if that’s what it does, is premature or ill founded, the curve could bear steepen and that would be an even bigger problem.” That is because institutions borrowing is based on the longer end of the curve, he noted. The 10-year Treasury yield is currently sitting around 4.4%. “Nothing good happens over 4.5%,” Timer said.
Investors may want to look beyond technology stocks given their high valuations, according to David Bianco, investing chief at DWS Group.
“They’ve delivered,” Bianco said on tech stocks on CNBC’s “Money Movers.” “The valuations are really expensive though, so we’re trying to find alternatives.” Bianco added that the market has used tech stocks as a “security blanket.” But looking ahead, he said traders should be looking at defensive stocks that have pricing power like utilities and growth potential such as health care. That can help investors protect their gains, he said. “The leadership of these tech stocks remains there,” he said. “It’s hard to shake investors out of these stocks when they’ve been made rich by owning these equities and sticking with them through thick or thin.”


Link to posts - Neil Sethi (@neilksethi) / X for more details/access to charts.
In individual stock action:
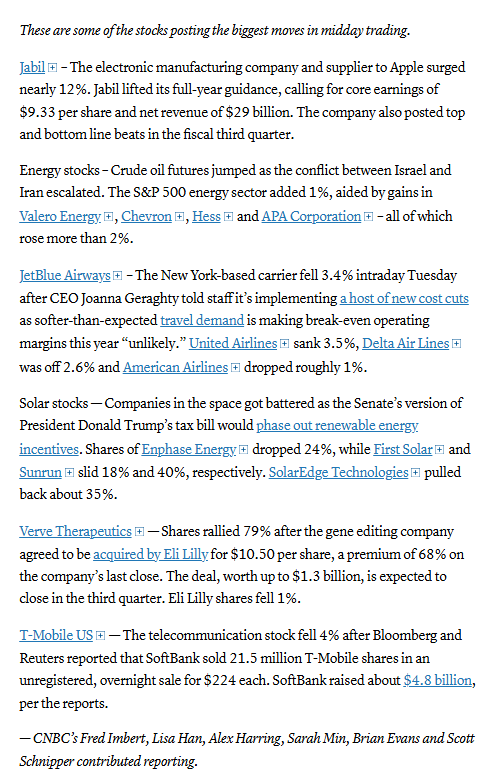
Shares of renewable-energy companies on Tuesday were diving on Wall Street after Senate Republicans on Monday detailed changes to the House's tax and spending bill that included fully phasing out solar and wind tax credits to businesses by 2028. Shares of Enphase Energy Inc. were leading the decline on the S&P 500, off 24.3%, while First Solar Inc.'s stock was tumbling nearly 18.5% and AES Corp.'s stock was dropping over 8%, according to FactSet data. Exchange-traded funds tracking renewable-energy stocks were also getting hammered on Tuesday. The iShares Global Clean Energy ETF was off 4.7%, while the Invesco Solar ETF was falling 9.3% and the Fidelity Clean Energy ETF was down 4.8%, according to FactSet.
Corporate Highlights from BBG:
India’s aviation safety regulator found no major safety concerns with Air India’s fleet of Boeing Co. 787 jets during ongoing inspections following a crash last week.
Solar companies fell sharply after Senate Republicans released a bill that would end clean energy tax credits earlier than expected, dashing hopes that major cuts passed by the House wouldn’t stick.
JPMorgan Chase & Co. will launch a pilot for a token called JPMD that represents dollar deposits at the world’s biggest bank, as financial institutions deepen their push into the digital-asset sector.
Eli Lilly & Co. agreed to buy gene-editing biotech company Verve Therapeutics Inc. for $1.3 billion, the drugmaker’s latest investment in an experimental medicine that could fuel its long-term growth.
UnitedHealth Group Inc. is cutting commissions for brokers on some Medicare Advantage plans, according to documents reviewed by Bloomberg News, a move that appears designed to discourage agents from selling those plans.
JetBlue Airways Corp. plans to hasten cost cuts by eliminating some flights, ending service to a number of cities and restructuring its leadership ranks as economic uncertainty feeds weaker-than-expected demand for travel, the company said in an internal memo.
Builder Lennar Corp.’s forecast for quarterly orders missed analyst estimates as affordability challenges and economic uncertainty hold back buyers.
Salesforce Inc. is increasing the price for many products, becoming the latest software maker to adjust its cost structure as it integrates artificial intelligence.
Amazon.com Inc. Chief Executive Officer Andy Jassy says he expects the company’s workforce to decline in the next few years as the retail and cloud-computing giant uses artificial intelligence to handle more tasks.
Adobe Inc. released a standalone Firefly mobile application for Android and iOS in an attempt to put a larger spotlight on its artificial intelligence-powered image generation and editing tools.
Penn Entertainment Inc. said its shareholders elected two new directors proposed by HG Vora Capital Management to its board at the company’s annual meeting Tuesday.
SoftBank Group Corp. raised around $4.8 billion through a sale of T-Mobile US Inc. shares, a move that helps fund the Japanese company’s grandiose plans for artificial intelligence.
Some tickers making moves at mid-day from CNBC:
In US economic data:
May retail sales fall more than expected -0.91% m/m (after -0.08% in Apr (rev’d down from +0.06%)), the most since Mar ‘23 and the first back-to-back drop since Oct/Nov ‘23 as auto sales drop -3.5% (after -0.6% in Apr), the most since June ‘24. Gasoline stations also continued to fall -2.0% (after -0.7% in Apr) due to falling gas prices (now down -6.9% y/y). Stripping those out though still saw core sales fall at -0.3% vs +0.2% expected (although in line with the -0.2% predicted by BoA) after +0.2% in Apr led by declines in home/garden -2.7% as well as smaller declines in grocery stores -0.8%, electronics/appliances -0.6%, health/personal care -0.1%, and bars/restaurants (the only service category -0.9%. That more than offset gains led by misc retailers +2.9%, sporting goods/hobbies +1.3%, home furnishings +1.2%, online (ecommerce) +0.9% apparel +0.8%, and general merchandise +0.1% (although dept stores were -0.4%). Key control group sales (which feed into #GDP (they exclude food services, auto dealers, building materials stores and gasoline stations (which were all negative))) though came in better than expected at +0.4% a tenth above expectations for +0.3%,
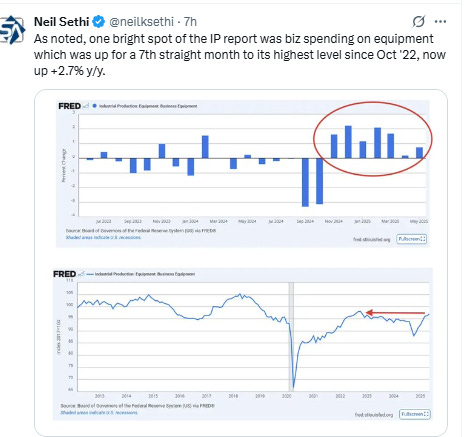
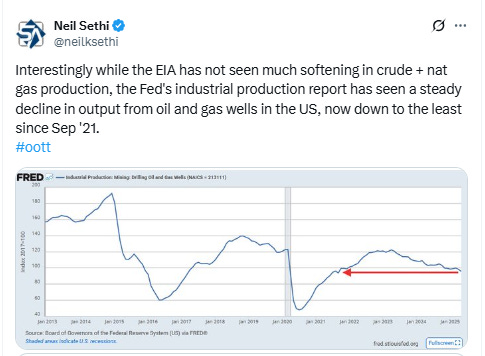
May industrial production falls -0.22% m/m, after gaining +0.07% in Apr (rev'd from -0.01%), below expectations for a flat read, but manufacturing (~80% of industrial production) comes in as exp’d at +0.12% (after -0.47% in Apr rev’d from -0.40%, with the drop due to auto production), the third increase in four months as durable good production rebounded +0.4% on the back of a +4.9% jump in autos (after -1.9% in Apr). Nondurable manufacturing though fell again (-0.2%) “with declines in the indexes for printing and support, for petroleum and coal products, and for food, beverage, and tobacco products”. Ex-autos, manufacturing dropped for a second month on declines in machinery and fabricated metals. Production of consumer goods, which includes cars, appliances and electronics, declined for a third month (-0.2%), but in a bright spot output of business equipment was up for a 7th month accelerating to +0.8%, now up +2.7% y/y.
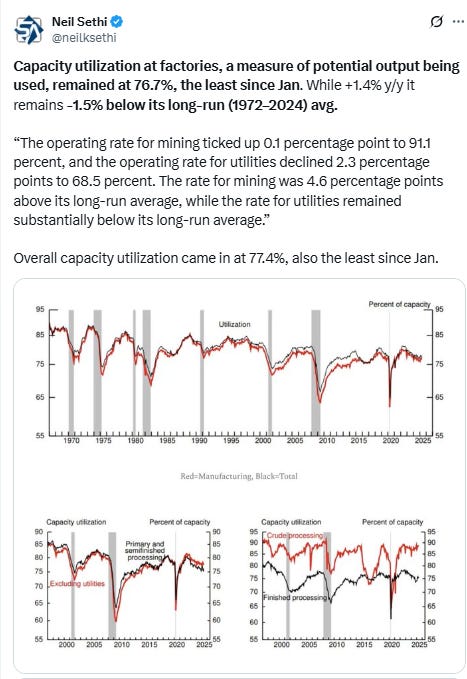
Capacity utilization at factories, a measure of potential output being used, remained at 76.7%, the least since Jan. While +1.4% y/y it remains -1.5% below its long-run (1972–2024) avg.
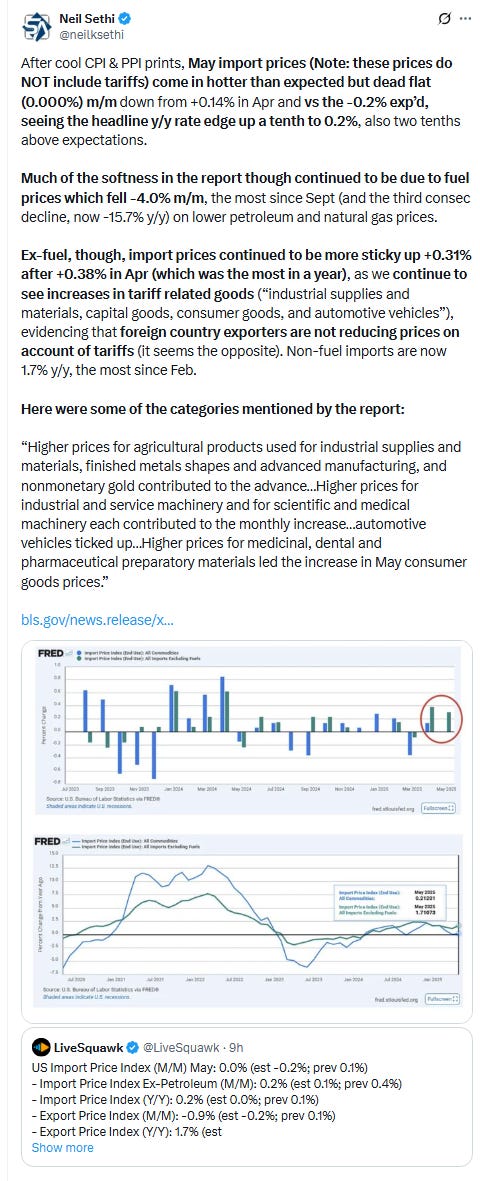
After cool CPI & PPI prints, May import prices (Note: these prices do NOT include tariffs) come in hotter than expected but dead flat (0.000%) m/m down from +0.14% in Apr and vs the -0.2% exp’d, seeing the headline y/y rate edge up a tenth to 0.2%, also two tenths above expectations. Much of the softness in the report though continued to be due to fuel prices which fell -4.0% m/m, the most since Sept (and the third consec decline, now -15.7% y/y) on lower petroleum and natural gas prices. Ex-fuel, though, import prices continued to be more sticky up +0.31% after +0.38% in Apr (which was the most in a year), as we continue to see increases in tariff related goods (“industrial supplies and materials, capital goods, consumer goods, and automotive vehicles”), evidencing that foreign country exporters are not reducing prices on account of tariffs (it seems the opposite). Non-fuel imports are now 1.7% y/y, the most since Feb.
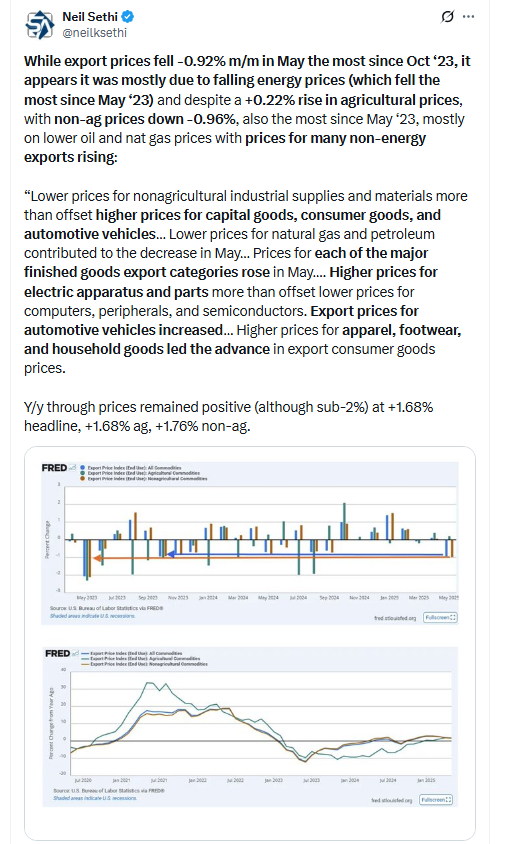
While export prices fell -0.92% m/m in May the most since Oct ‘23, it appears it was mostly due to falling energy prices (which fell the most since May ‘23) and despite a +0.22% rise in agricultural prices, with non-ag prices down -0.96%, also the most since May ‘23, mostly on lower oil and nat gas prices with prices for many non-energy exports rising:
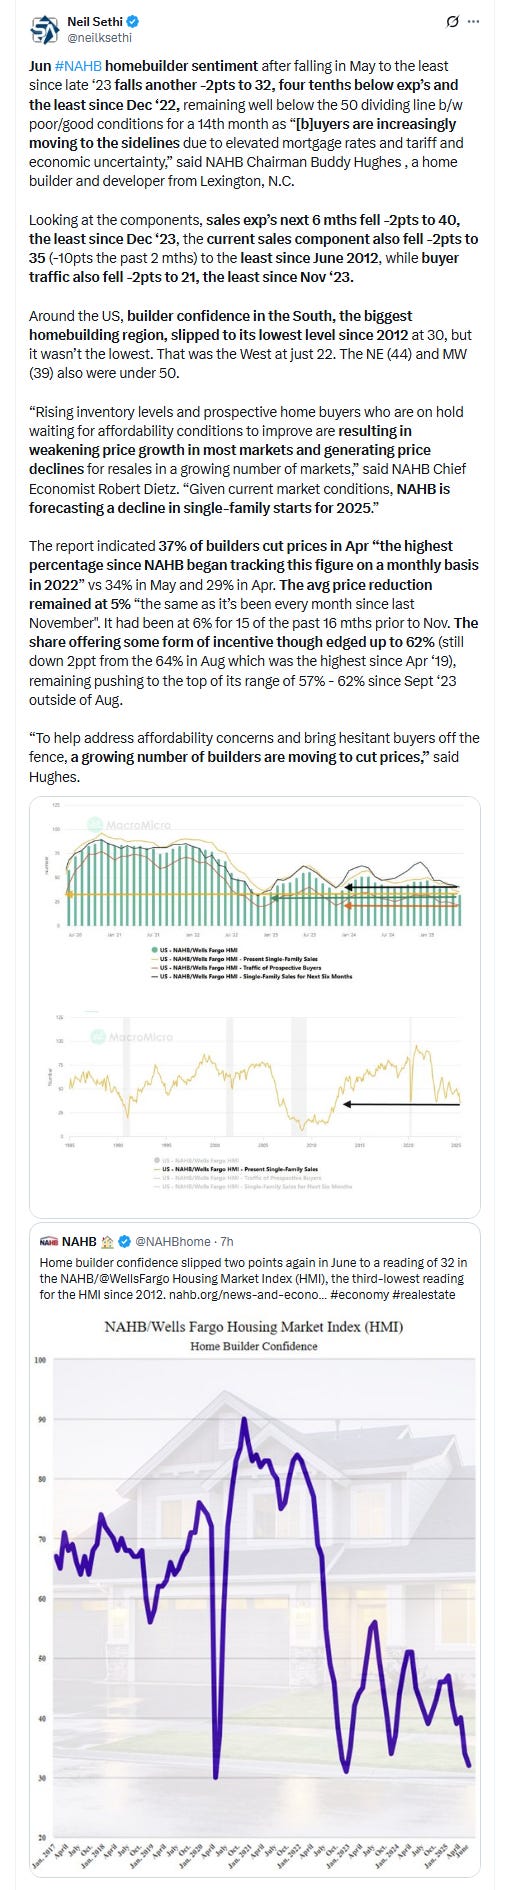
Jun #NAHB homebuilder sentiment after falling in May to the least since late ‘23 falls another -2pts to 32, four tenths below exp’s and the least since Dec ‘22, remaining well below the 50 dividing line b/w poor/good conditions for a 14th month as “[b]uyers are increasingly moving to the sidelines due to elevated mortgage rates and tariff and economic uncertainty,” said NAHB Chairman Buddy Hughes , a home builder and developer from Lexington, N.C.


Link to posts for more details/access to charts (all free) - Neil Sethi (@neilksethi) / X
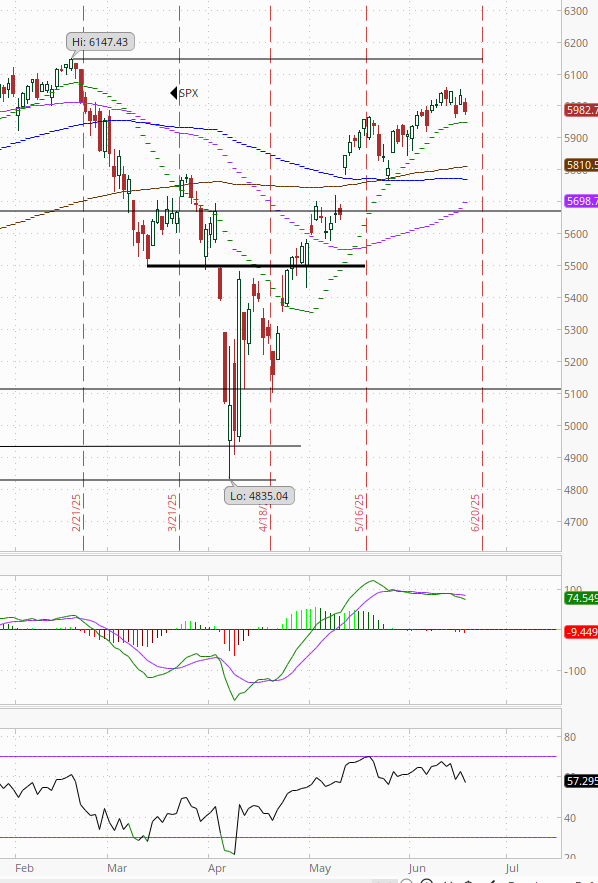
The SPX fell back but remained above Friday’s lows. Its daily MACD is starting to slip less positive, but the RSI remains above 50.

The Nasdaq Composite very similar setup.

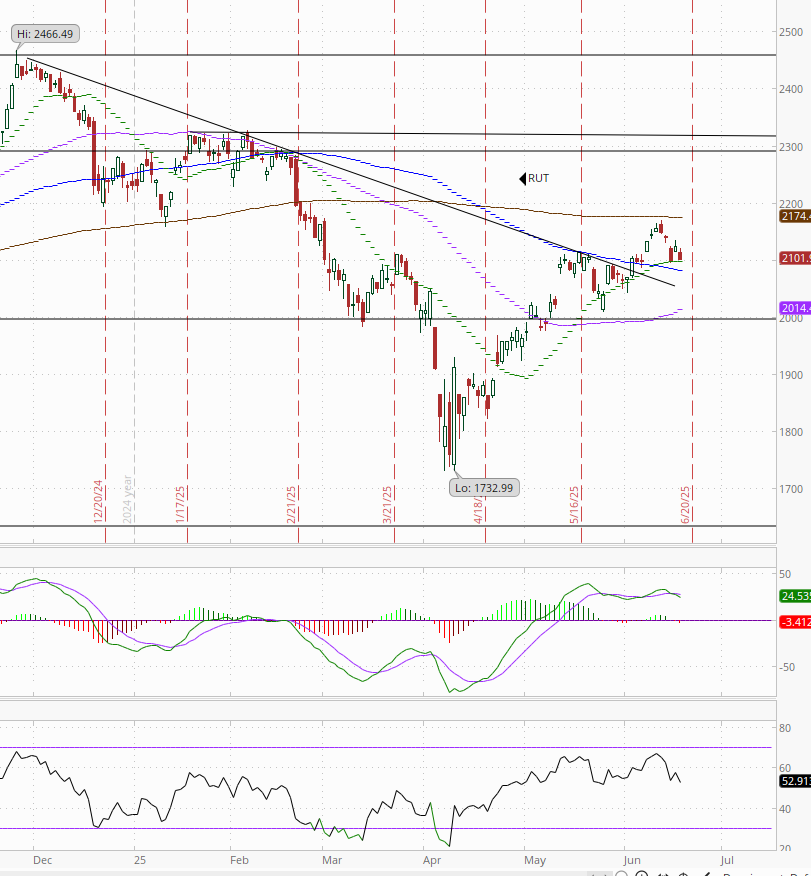
RUT (Russell 2000) fell back to its 20-DMA and 2100 level. Daily MACD has slipped to negative, but the RSI is still over 50.
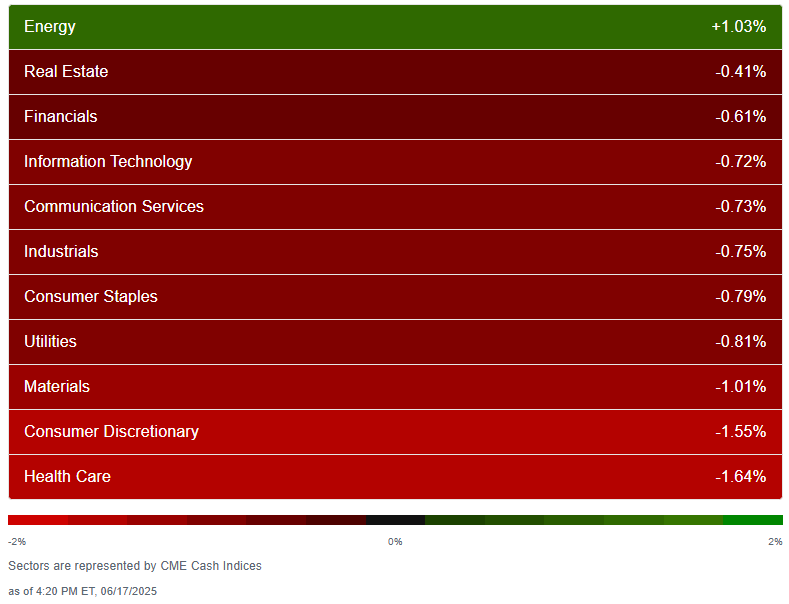
Sector breadth from CME Cash Indices deteriorated as you might expect to like Friday just one green sector (Energy) with every other sector down at least -0.4% and three down >-1%. No clear pattern in terms of style.
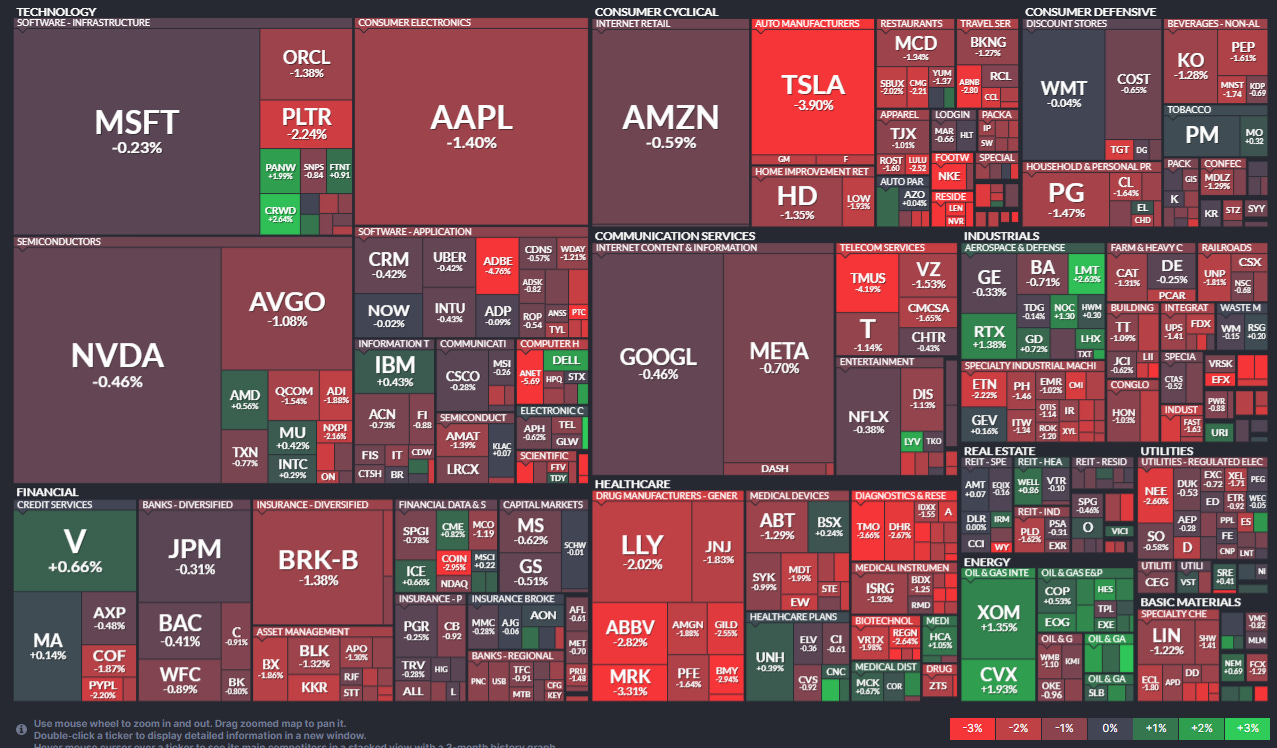
SPX stock-by-stock flag from Finviz consistent with lots of red and outside of energy and defense just a smattering of green. Drug and medical diagnostic manufacturers hit hard as were a number of consumer names. Every Mag-7 stock was lower (Mag-7 -1.1% today).
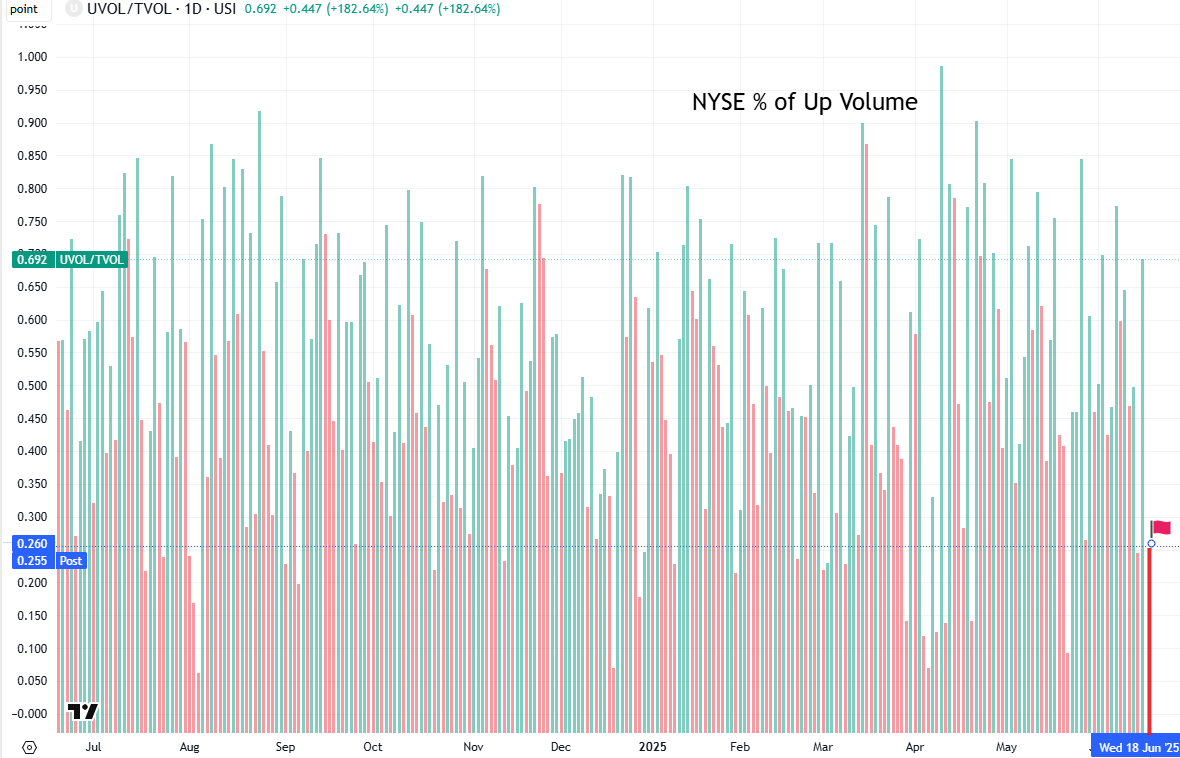
NYSE positive volume (percent of total volume that was in advancing stocks) which had been pretty solid the past few weeks but turned less so on Wednesday was weak Tuesday at 25.5%, not terrible considering the -0.84% loss in the NYSE Composite Index, but it was basically the same (24.5%) Friday with a larger -1.08% loss.
Nasdaq positive volume a little better at 37.5% from the joint highest since August on Monday, in line with the -0.91% loss in the index.

Positive issues (percent of stocks trading higher for the day) were mixed at 31 & 29% respectively.
New 52wk highs-new lows (red-black dotted line) also deteriorated to -12 on the NYSE, just above Friday’s low, and to -19 on the Nasdaq, also above Friday’s low, keeping them in their range over the past couple of months.
[Charts not updated yet].
Ahead of the #FOMC meeting, rate cut pricing shifted more cuts into 2026 as higher oil prices outweighed the miss on retail sales and industrial production and perhaps getting ready for a potential 1 cut SEP dot plot tomorrow with 2025 cuts -2bps to 45bps according to CME’s #Fedwatch tool, (down from 92bps on May 1st; they peaked this year at 103bps on Apr 8th, and the low was 36bps Feb 11th).
The probability of a cut at the June meeting is just 0.1% (meaning it’s not happening, and it was well over 50% at the start of May) and a cut by July is just 15% (down from 31% two weeks ago and 78% at the start of May) but a cut by the following meeting (Sept) is over four times July at 63% (on the idea that the Fed will feel that they don’t have enough data (especially now with the oil spike) to cut before that point, but will want/need to cut by Sept, although that is still down from 95% May 1st).
Chances of 2 cuts this year is 62% (around the least we’ve seen since Feb and down from 76% last week and 99% at the start of May), three is 22% (down from 92% May 1st), and four is 2% (from 76%). The chance of no cuts remains low at 8% (but up from under 1% May 1st).
2026 cuts through the Dec ‘26 meeting though increased +8bps to 72bps, seeing total cuts through Dec '26 at 116bps, +5bps from Friday but -32bps from the start of May.
I said after the big pricing out of cuts in January (and again in February) that the market had pivoted too aggressively away from cuts, and that I continued to think cuts were more likely than no cuts, and as I said when they hit 60 bps “I think we’re getting back to fairly priced (and at 80 “maybe actually going a little too far” which is back to where we probably were Apr 20th (a little too far) at 102bps). Seems like we’re getting back to “fairly priced,” and as of May 14th at 48bps perhaps starting to go a little too far in the other direction, but as I’ve said all year “It’s a long time until December.”
Also remember that these are the construct of probabilities. While some are bets on exactly two, three, or four cuts much of it is bets on a lot of cuts (5+) or just one or none.

10yr #UST yields also caught in the push pull of oil prices and weaker data -6bps to 4.39%, remaining in the middle of the range this year.

The 2yr yield, more sensitive to #FOMC policy, -3bps to 3.95%, also in the middle of its range this year. It is now -38bps below the Fed Funds midpoint, so continuing to call for a rate cut or two but around one less than it was at the beginning of May.
I had said when it was around 4.35% (in Jan & again early Feb) that I found the 2-yr trading rich as it was reflecting as much or more chance of rate hikes as cuts while I thought it was too early to take rate cuts off the table (and too early to put hikes in the next two years on), but then the 2yr fell to 3.65% past where I thought we’d see it, so I took some exposure off there. We got back there but I never added back what I sold, so I stuck tight. Ian Lygan of BMO saw it going to 3.5% by year’s end before all this tariff business.

$DXY dollar index (which as a reminder is very euro heavy (over 50%) and not trade weighted) got a bid up almost a percent back near the downtrend line from February that hasn’t yet been breached. The daily MACD and RSI turned more neutral.


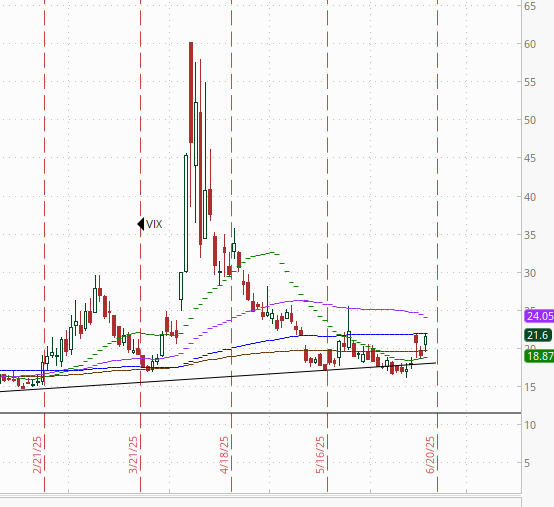
VIX back over 20 to 21.6 for the first time since May 23rd. That level is consistent w/~1.35% average daily moves in the SPX over the next 30 days.
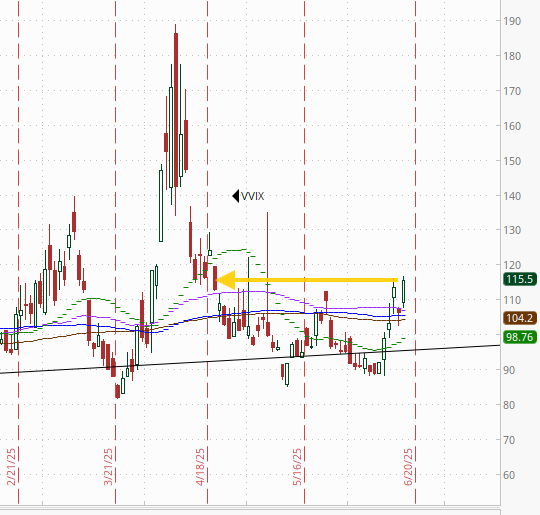
The VVIX (VIX of the VIX) jumped to 116, the highest close since Apr 22nd, pushing further above Nomura’s Charlie McElligott’s “stress level” of 100 (consistent now with “elevated” daily moves in the VIX over the next 30 days (normal is 80-100)).
And 1-Day VIX, also jumped higher in its case to 21.0, just a touch below Friday’s 21.7 which was the highest close since May 23rd. The current level is consistent with traders looking to hedge an ~1.31% move in the SPX Wednesday.

#WTI futures started the session lower but spent the entire day moving higher on Pres Trump’s escalatory talk to finish at 73.74, the highest close since January.
#oott


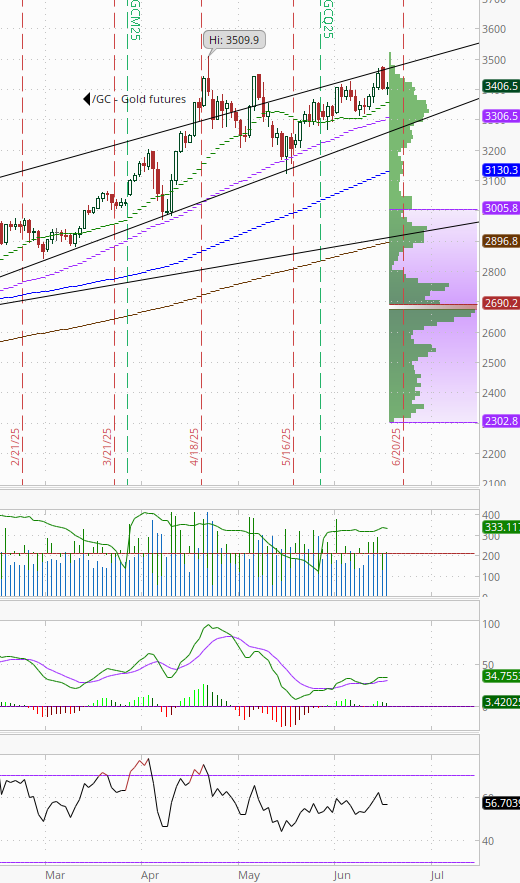
Gold futures (/GC) though didn’t benefit from the heightened risk premium today ending little changed, but still just off its all-time closing high Friday near the top of the uptrend channel from January. Daily MACD as noted Thursday has turned more positive and the RSI is above 50.

Copper (/HG) futures edged lower remaining between support and resistance lines. The daily MACD remains in “sell longs” positioning with the RSI around 50.

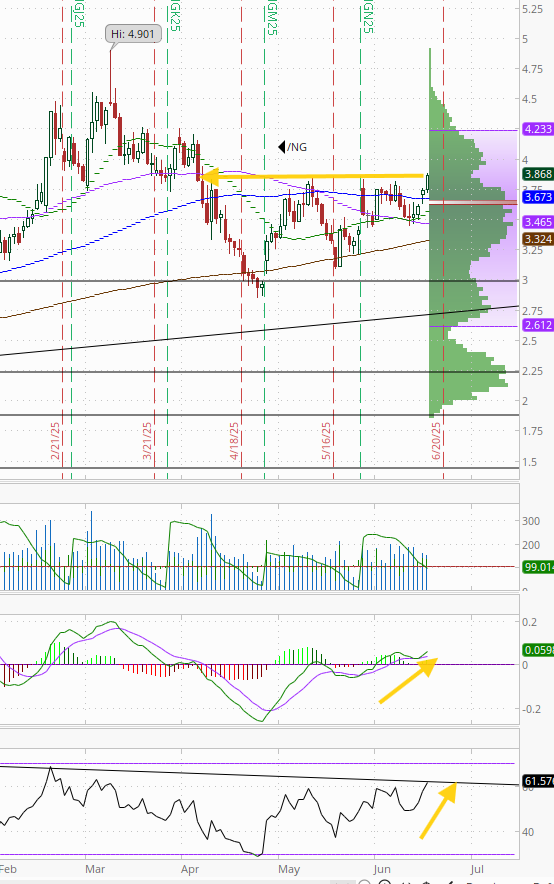
Nat gas futures (/NG) up 3.4% to the highest close since Apr 3rd back to the top of the range since mid-April. Daily MACD and RSI also are supportive. No real overhead resistance until the $4.25 area.
Bitcoin futures down -4.3% but remaining in its range since late May. As noted Monday, while the daily MACD is in “sell longs” positioning, it is not far from turning positive while the RSI remains around 50 for now.
As a reminder the last time daily RSI went from well over to well under 70 there was a a six-month period of consolidation (November), so we’ll see if this time is different (it needs to make and sustain a new high).

The Day Ahead
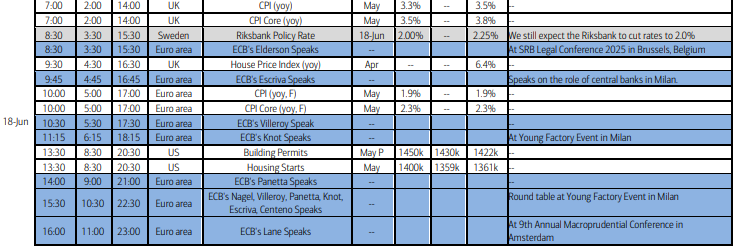
We’ll get more US economic data Wednesday ahead of the Fed with May housing starts & permits in addition to weekly jobless claims, mortgage applications, and EIA petroleum inventories.
No Treasury auctions, but we get the Fed policy decision and Powell press conference. My preview is below.
Earnings very light with no SPX reporters.
Ex-US DM we’ll also get a policy decision from Sweden along with Japan’s Tankan estimate from Reuters and export data, UK May CPI and house prices, and EU final May CPI among other reports.
In EM, the headliner Wednesday are also policy decisions, in this case from Indonesia and Brazil. We’ll also get South Africa CPI among other reports.
As a reminder US markets will be closed Thursday in observance of the Juneteenth holiday to commemorate the ending of slavery in the United States.


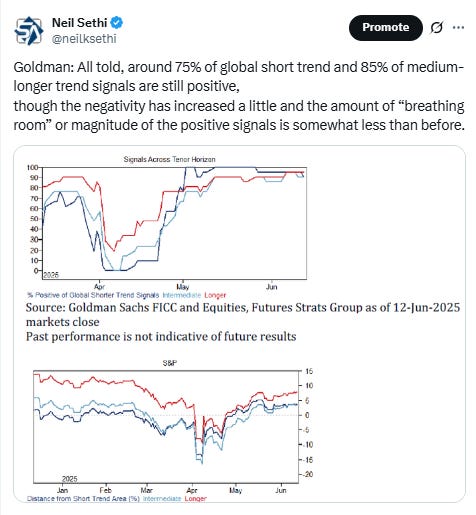
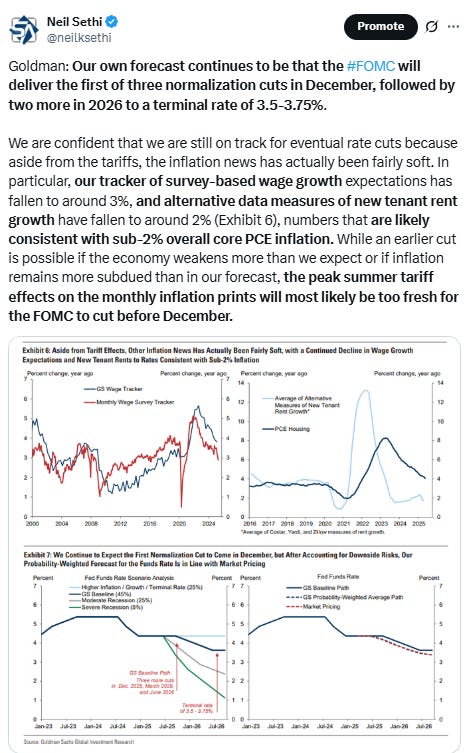
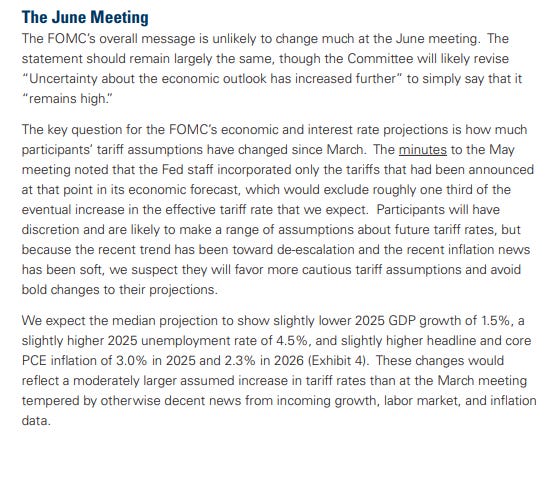
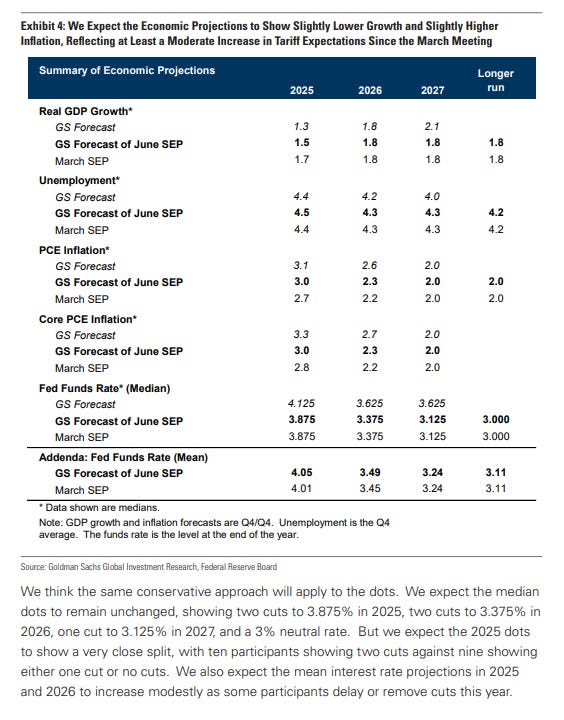
From Goldman:

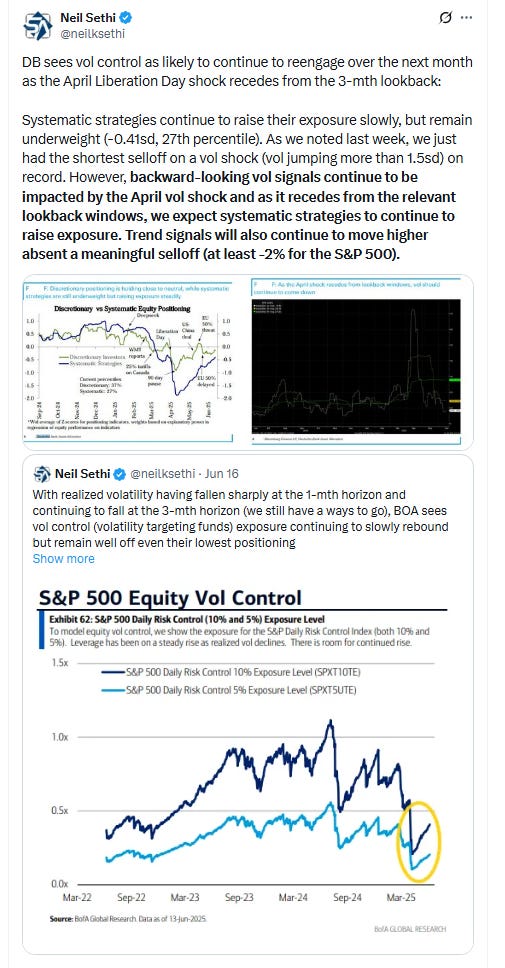
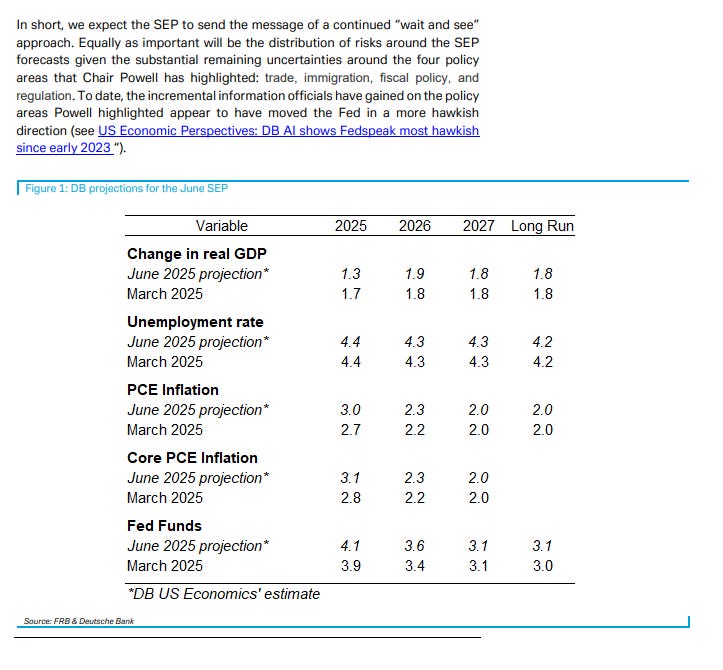
From DB:
Link to X posts - Neil Sethi (@nelksethi) / X
To subscribe to these summaries, click below (it’s free!).
To invite others to check it out,