


Markets Update - 6/20/25
Update on US equity and bond markets, US economic reports, the Fed, and select commodities with charts!

To subscribe to these summaries, click below (it’s free!).
To invite others to check it out (sharing is caring!),
Link to posts - Neil Sethi (@neilksethi) / X
Note: links are to outside sources like Bloomberg, CNBC, etc., unless it specifically says they’re to the blog. Also please note that I do often add to or tweak items after first publishing, so it’s always safest to read it from the website where it will have any updates.
Finally, if you see an error (a chart or text wasn’t updated, etc.), PLEASE put a note in the comments section so I can fix it.
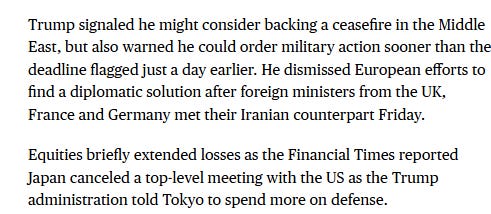
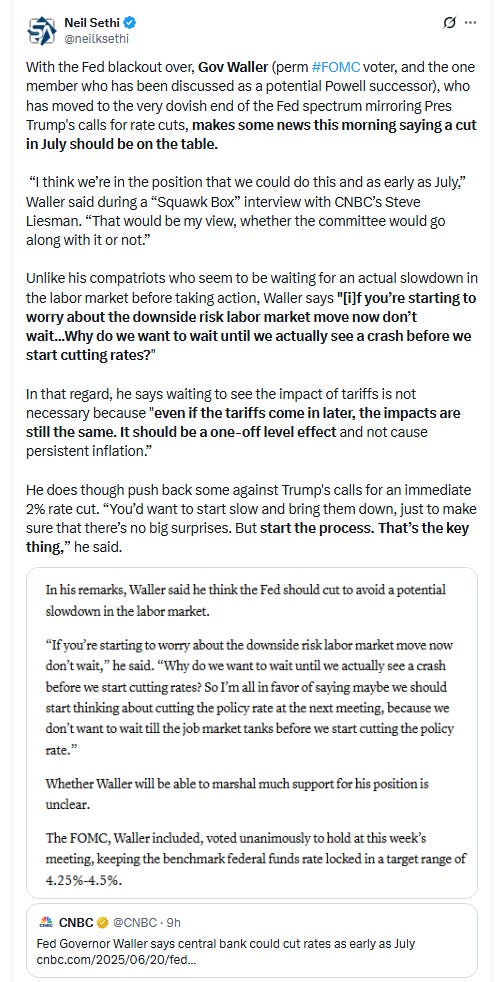
Major US equity indices started the day modestly higher after reversing declines in futures during Thursday’s holiday after President Trump dialed back near term risk of a US strike on Iran saying he had not yet made a decision but would in the next two weeks wanting to give a chance for further dialogue, and Fed Gov Waller told CNBC this morning he thought a rate cut in July should be on the table (see FOMC section). But unsurprisingly for a summer Friday with a conflict going on in the Mid-East, buying was tepid ahead of what could be a newsy weekend and equities fell back to finish with mild losses both for the day and week, weighed down Friday by weakness from many of the largest stocks with semiconductors seeing losses after a Wall Street Journal report the US may revoke waivers for allies with semiconductor plants in China.
Elsewhere, Treasury yields edged lower, while Fed rate cut expectations firmed following Waller’s comments. The dollar also edged lower as did gold, bitcoin, copper, and nat gas, while crude closed higher.
The market-cap weighted S&P 500 (SPX) was -0.2%, the equal weighted S&P 500 index (SPXEW) +0.2%, Nasdaq Composite -0.5% (and the top 100 Nasdaq stocks (NDX) -0.4%), the SOX semiconductor index-0.8%, and the Russell 2000 (RUT) -0.2%.


Morningstar style box showed muted gains/losses across styles with small caps outperforming.

Market commentary:
“With so much uncertainty going on in this world, who really wants to go long over the weekend,” said Sam Stovall, chief investment strategist at CFRA Research. He also pointed out that the S&P 500 is still trading at just around 3% below its recent 52-week high, saying that “prior highs act like rusty doors and require several attempts before finally swinging open.”
“If there’s a calming down of the geopolitical activities, then you know that could be helpful,” he continued.
"While geopolitical tensions typically spark a flight to safety — with risk assets plunging, safe havens rallying, and the dollar firming — markets thus far are signaling containment over contagion," Mark Hackett, chief market strategist at Nationwide wrote. "Still, the persistent risk of escalation remains a potent catalyst lurking beneath the surface."
Brian Mulberry, a portfolio manager at Zacks Investment Management, has a few thoughts about why stocks have struggled in recent trade. "I think a lot of people are asking who wants to be invested over the weekend when so many things can happen?" he told MarketWatch, adding that investors were still waiting to see whether the U.S. would get involved directly in the Israeli-Iran conflict. Some of the intraday swings were likely also related to Friday's "triple witching" options expiration, he added. "A lot of that adds up to intraday volatility."
“One must of course be aware of the potential for significant gapping risk at the Sunday night open, depending on how geopolitical tensions evolve over the weekend,” said Michael Brown, senior research strategist at Pepperstone Group Ltd. “Some trimming of risk, and squaring of positions, seems likely as today goes on.”
“There are several key questions to answer before we know how stocks will handle this geopolitical shock, including how much of Iran’s energy infrastructure will be impaired and for how long, whether Iran’s nuclear capabilities will be completely wiped out, and whether the current regime will remain in power,” said Jeff Buchbinder, chief equity strategist for LPL Financial.
“The recent air strikes pose risks to the new energy market landscape; however, further fallout for global energy prices seems, for now at least, limited,” said Kieran Calder, head of Asia equity research at Union Bancaire Privee in Singapore. “Markets tend not to price in geopolitical risks until there is a conflagration, and they are currently showing little sign of factoring in a worst-case outcome.”
"The risk is that Trump changes his mind. However, like reciprocal tariffs, Trump sets movable deadlines," said Kathleen Brooks, research director at XTB. "While the oil price is likely to maintain some geopolitical premium, Brent crude could move back below $75 per barrel, after touching $79 per barrel on Thursday, as fears of a major escalation in the conflict ease," she wrote.
“The market is dealing with a lot presently, from geopolitical tensions, tariff uncertainty and questions about the Federal Reserve’s next move,” said Brian Buetel at UBS Wealth Management. “While there are different risks on the horizon, stocks are a forward-looking barometer of economic growth, which we believe will hold up this year.”
Investors remain highly sensitive to all developments from the Middle East, and the geopolitical backdrop remains a significant driver of risk sentiment across global financial markets, said David Morrison, a London-based senior market analyst at financial-services provider Trade Nation. "With the Israel-Iran conflict intensifying and whispers of potential U.S. involvement growing louder, investor sentiment remains fragile," he wrote in an email. Complacency "may be short-lived and investors are likely to be cautious going into the weekend." Meanwhile, the Cboe Volatility Index, a popular measure of investor anxiety in the stock market, dropped this morning to below 20. "This suggests traders are still largely unconvinced that the Israel-Iran conflict will escalate," Morrison said.
Global stagflation concerns aren't the only risk investors face as summer trading kicks off Friday, according to Bob Savage, head of markets macro strategy at BNY. As bonds wobble "in their safe haven role," investors have turned to gold and the Swiss franc, while uncertainty around corporate margins and earnings could keep equities "stuck in the confessional season ahead of [second-quarter] earnings," Savage said in a Friday client note.
"There is no easy way to balance uncertainty from geopolitical and political risks in a market conditioned by years of monetary support and fiscal largesse," he said. "For many, today is the longest day of the year; for others, the lack of clarity makes it just the start of a longer, dry, hot journey. The dollar will likely become the key barometer for judging risk along the way."


Link to posts - Neil Sethi (@neilksethi) / X for more details/access to charts.
In individual stock action:
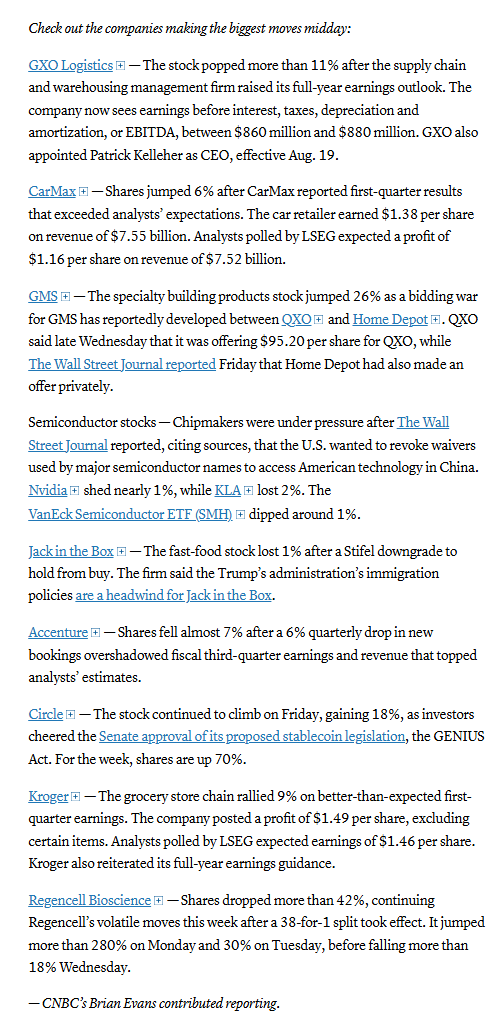
Chip stocks came under pressure following a report by The Wall Street Journal that the U.S. may revoke waivers for some semiconductor manufacturers. Nvidia was down more than 1%, while Taiwan Semiconductor Manufacturing slid nearly 2%. The VanEck Semiconductor ETF (SMH) was lower by nearly 1%.

Corporate Highlights from BBG:
Meta Platforms Inc. held discussions with artificial intelligence search startup Perplexity AI Inc. about a possible takeover before moving ahead with a multibillion-dollar investment in Scale AI, according to people familiar with the matter.
Tesla Inc. is set to open its first showrooms in India in July, people familiar with the discussions said, kicking off formal operations in the world’s third-biggest automobile market as the Elon Musk-led firm hunts for growth amid falling sales in Europe and China.
Musk’s artificial intelligence startup xAI Corp. offered investors sweeter pricing on its $5 billion debt offering Friday, as Morgan Stanley wraps up commitments for the deal.
Kroger Co.’s sales surpassed expectations during the latest quarter, a sign that consumers are still spending on groceries and other essentials despite economic turbulence.
Darden Restaurants Inc. is considering “strategic alternatives” for its Bahama Breeze chain, Chief Executive Officer Rick Cardenas said.
Aflac Inc. said a recent cybersecurity breach could have given intruders unauthorized access to customers’ personal information, including Social Security numbers, as well as health and claims data.
QXO Inc. won’t raise its $5 billion offer for building products distributor GMS Inc. after Home Depot Inc. reportedly made its own bid.
CarMax Inc. reported comparable sales and earnings per share that beat consensus estimates.
Accenture Plc reported results and gave an outlook. Analysts highlighted bookings as a weak spot of the print.
SoftBank Group Corp. founder Masayoshi Son is seeking to team up with Taiwan Semiconductor Manufacturing Co. to realize what could be his biggest bet yet — a trillion-dollar industrial complex in Arizona to build robots and artificial intelligence.
Temu’s sales decline in the US is deepening as the online marketplace drastically cuts spending on advertising targeting American consumers, signaling a shift in focus after President Donald Trump’s tariff barrage.
Some tickers making moves at mid-day from CNBC:
In US economic data:


Link to posts for more details/access to charts (all free) - Neil Sethi (@neilksethi) / X
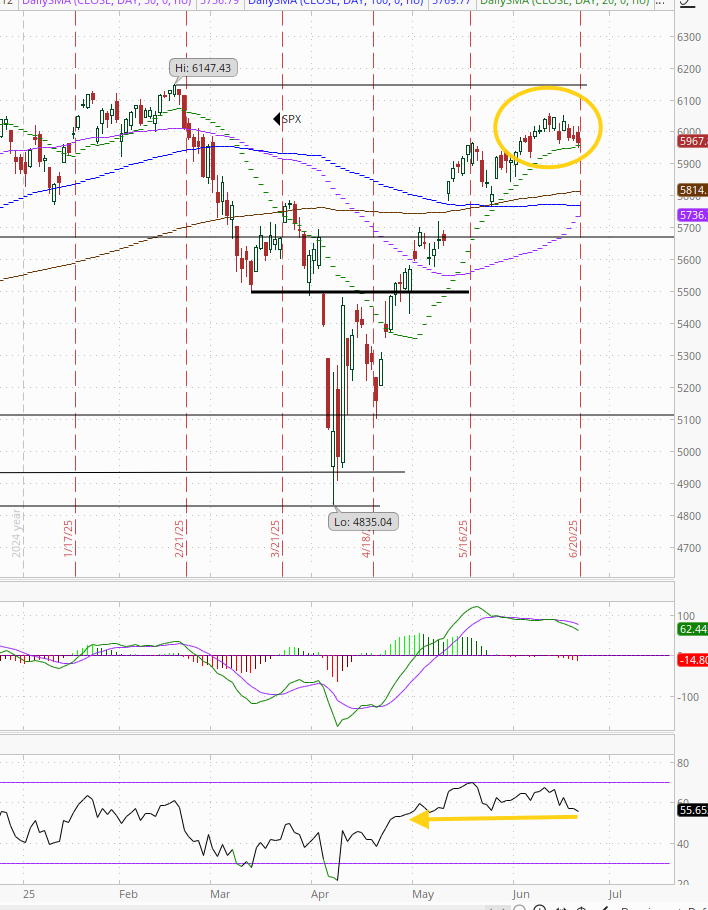
The SPX edged to two-week lows just above the 20-DMA. Its daily MACD though continues to slip less positive as does the RSI which slipped to the weakest since April although it remains above 50.
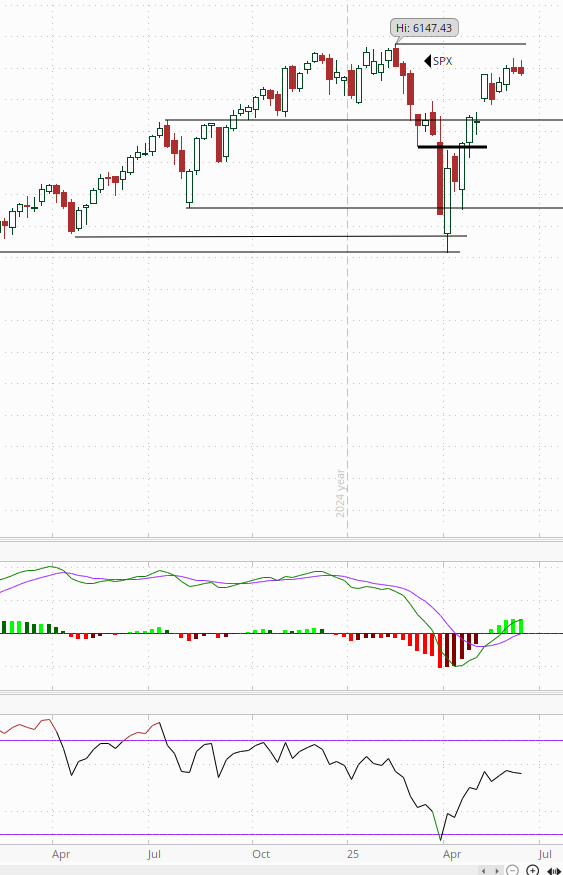
The weekly chart remains stronger.


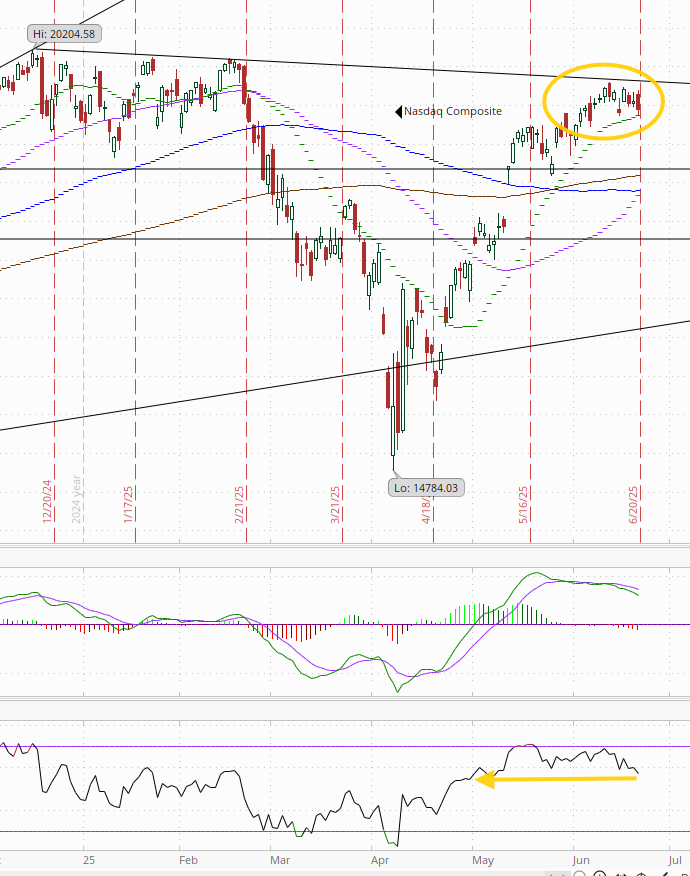
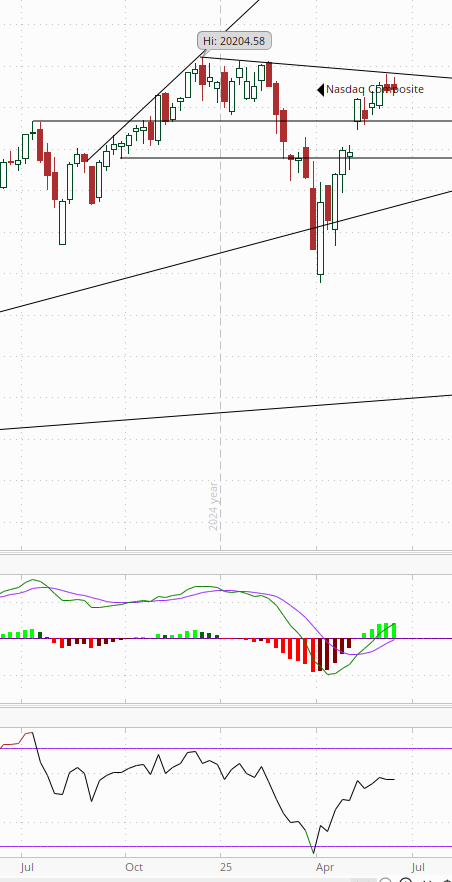
The Nasdaq Composite very similar setup.
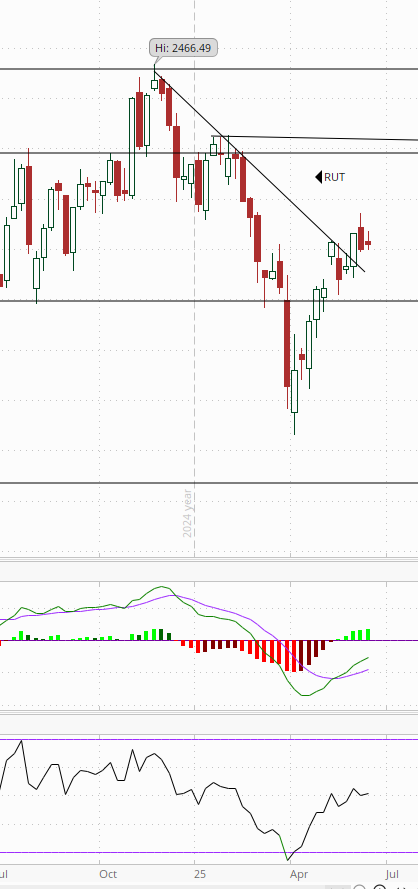
RUT (Russell 2000) as well although it remains also under its 200-DMA. It’s daily RSI also hasn’t deteriorated quite as much.

Sector breadth from CME Cash Indices similar to Wed with five green sectors (from four) with 9 of the 11 up or down less than 0.7%, but the two ends were more volatile with energy (which finished last Wed) up +1.1% while Comm Services was -1.8% on the back of a -3.8% drop in GOOGL & -1.9% in META.


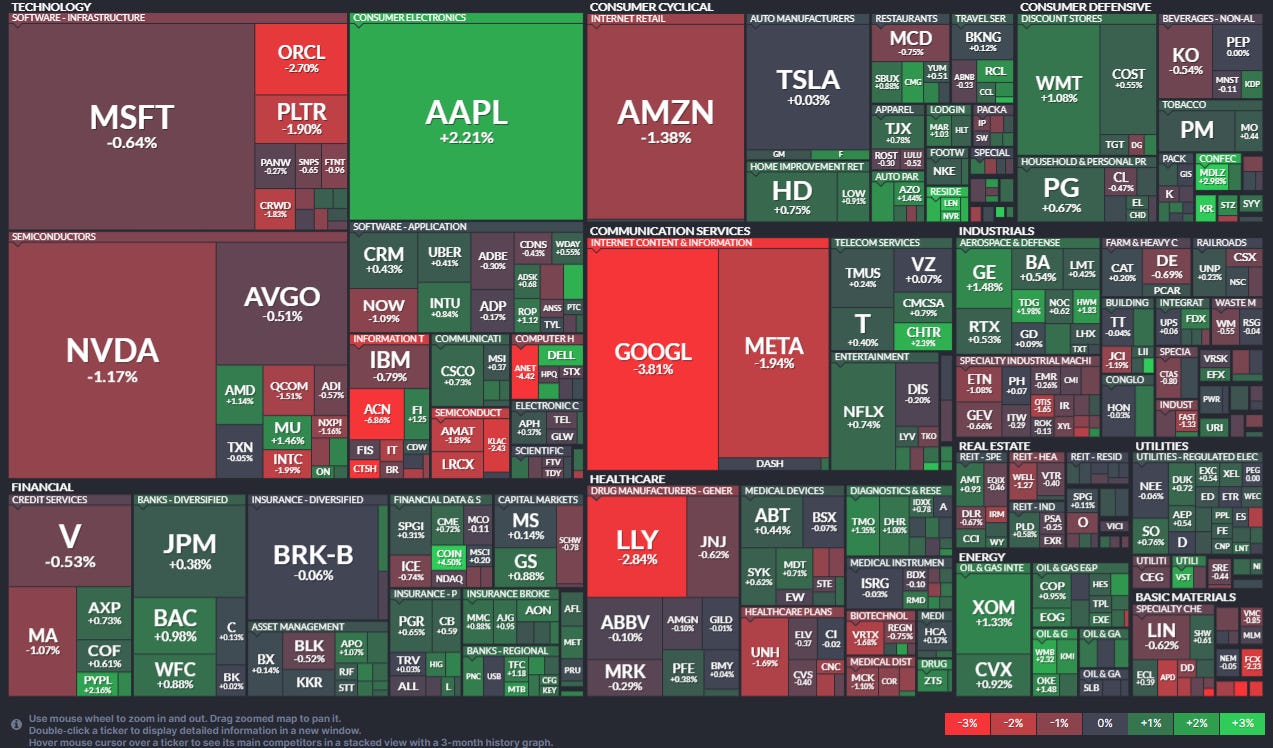
SPX stock-by-stock flag from Finviz seems consistent with pretty even mix of red and green although most of the big index movers were to the downside with GOOGL, META, LLY, ORCL, & PLTR all down around -2% or more. Of the Mag-7 only AAPL was higher. The BBG Mag-7 index was -1.0%. Aerospace did well as did many consumer, banking, and most energy names.
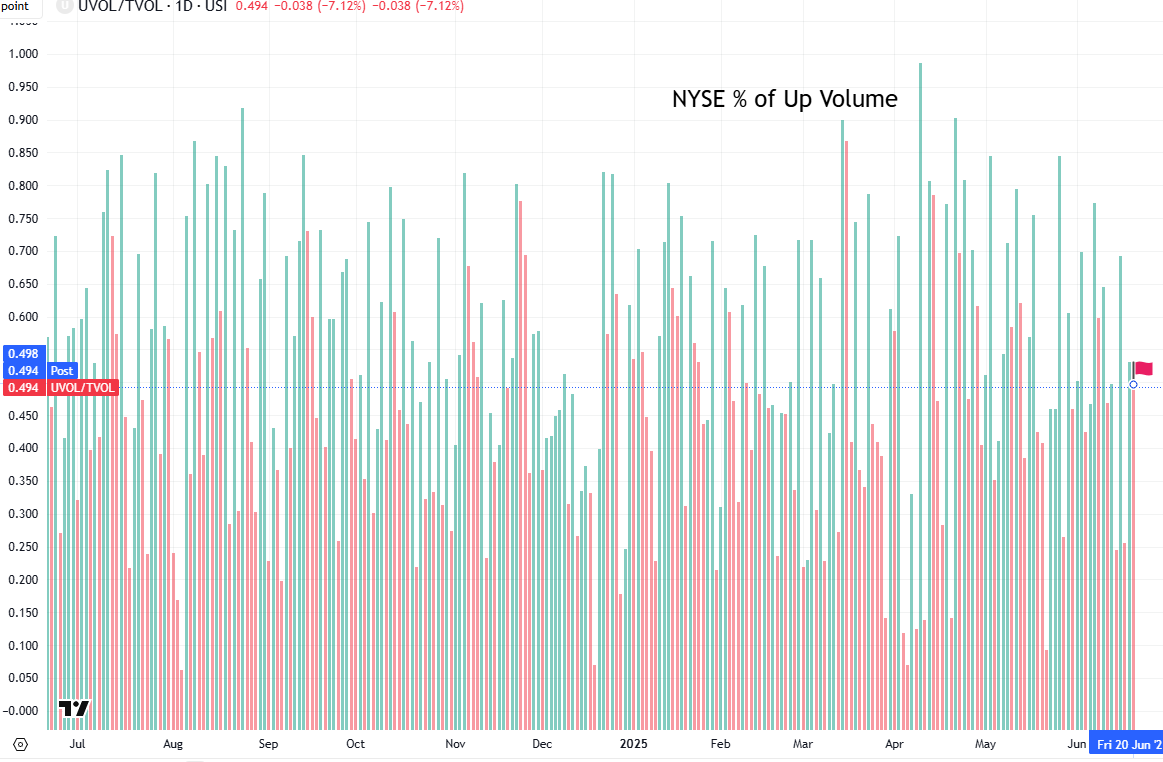
NYSE positive volume (percent of total volume that was in advancing stocks) which had been pretty solid the past few weeks but was generally less over the week leading into Wednesday has been not bad since then coming in Friday at 49.4% ok for the -0.16% loss in the NYSE Composite Index. Compare that with June 11th when it was just 46.9% despite a small +0.02% gain in the index (although this past Wednesday it was 53% with just a slightly smaller loss (-0.09%).
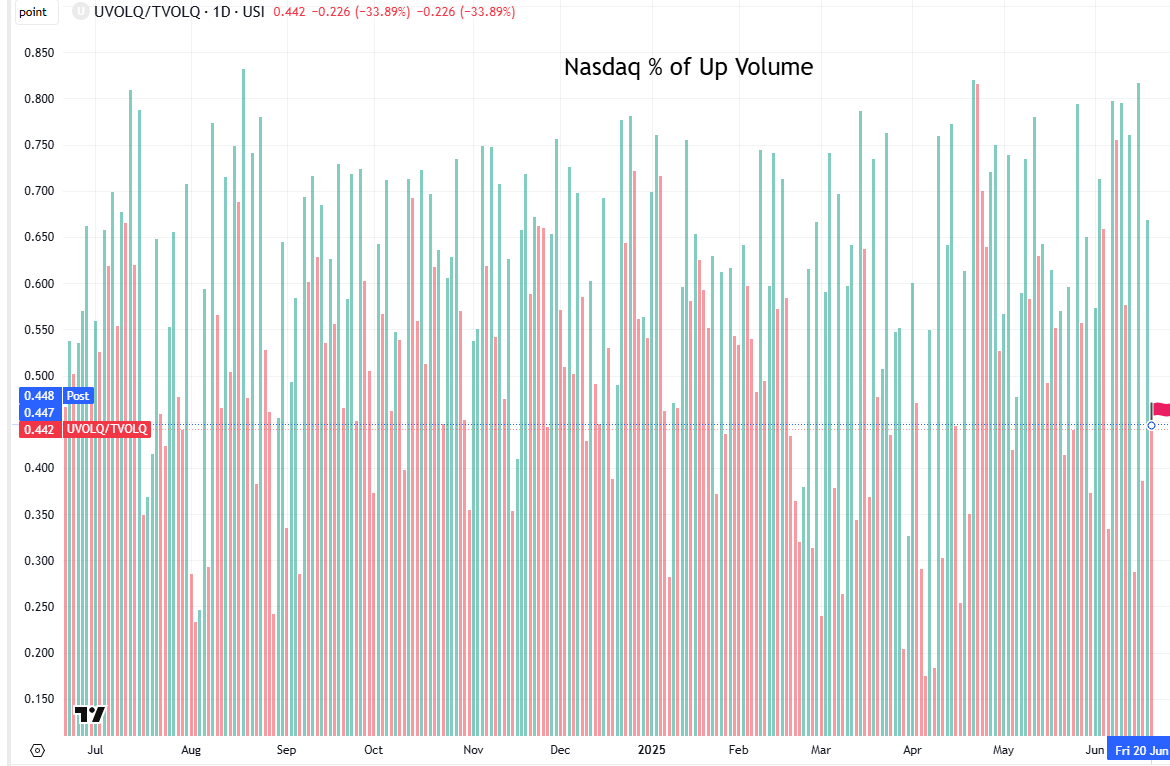
Nasdaq positive volume was similar falling below 50% to 44.7%, but not bad for the -0.5% loss in the index, but that said, it was 57% June 11th when the index as also down -0.5%.
Positive issues (percent of stocks trading higher for the day) were similar at 48 & 41% respectively.
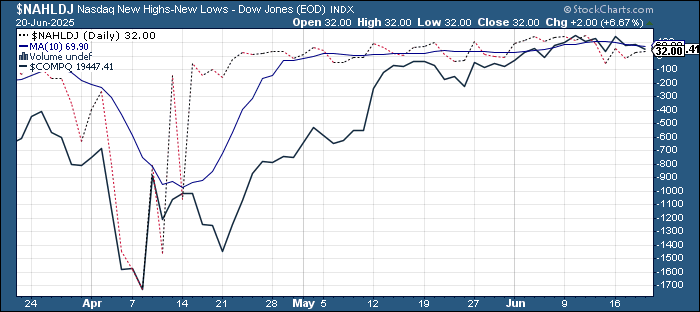
New 52wk highs-new lows (red-black dotted line) were little changed at 13 on the NYSE, and 32 on the Nasdaq, keeping them in their range over the past couple of months.

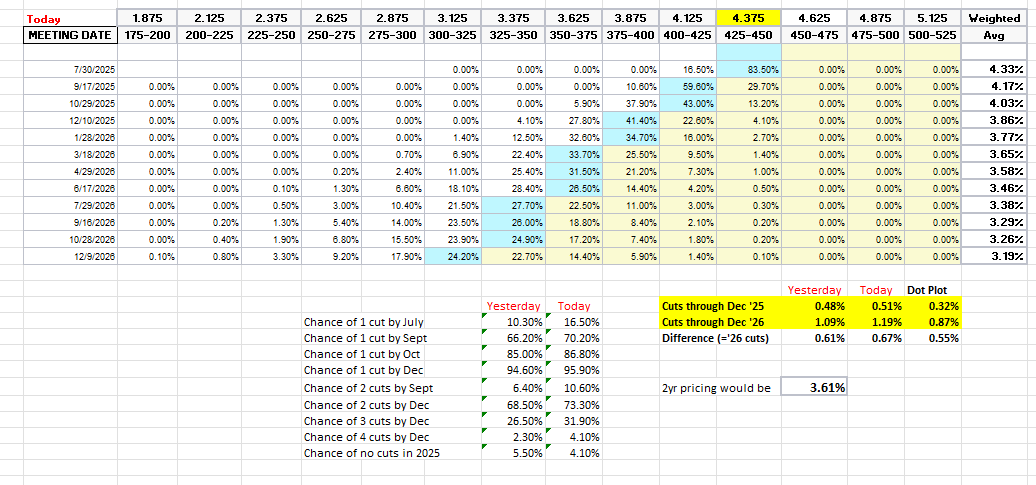
While pricing for 2025 #FOMC rate cuts firmed a bit following Gov Waller talking up the potential for a July rate cut, it didn’t even get back to levels from two weeks ago (let alone the start of May). Specifically, 2025 cuts were +3bps to 51bps according to CME’s #Fedwatch tool, (down from 92bps on May 1st; they peaked this year at 103bps on Apr 8th, and the low was 36bps Feb 11th).
The probability of a cut at the July meeting moved up to 17% (from 10% Wed, but down from 31% two weeks ago and 78% at the start of May) while a cut by the following meeting (Sept) is over four times July at 70% (on the idea that the Fed will feel that they don’t have enough data (especially now with the oil spike) to cut before that point, but will want/need to cut by Sept, although that is still down from 95% May 1st).
Chances of 2 cuts this year is 73% (up from 62% Tuesday which was around the least we’d seen since Feb and close to the 76% two weeks ago but down from 99% at the start of May), three is 32% (down from 92% May 1st), and four is 4% (from 76%). The chance of no cuts remains low at 4% (but up from under 1% May 1st).
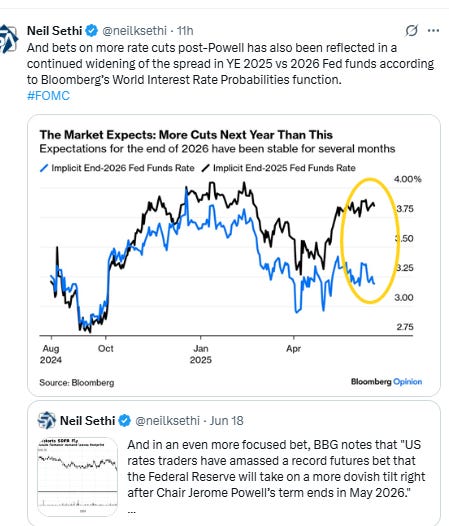
2026 cuts though jumped +6bps getting back a little more than half of Wednesday’s drop (likely on the expectation that the next Fed chair, like Waller, will be much more dovish than Powell) to 67bps, seeing total cuts through Dec '26 at 119bps, +10bps from Wed but -29bps from the start of May.
I said after the big pricing out of cuts in January (and again in February) that the market had pivoted too aggressively away from cuts, and that I continued to think cuts were more likely than no cuts, and as I said when they hit 60 bps “I think we’re getting back to fairly priced (and at 80 “maybe actually going a little too far” which is back to where we probably were Apr 20th (a little too far) at 102bps). Seems like we’re getting back to “fairly priced,” and as of May 14th at 48bps perhaps starting to go a little too far in the other direction, but as I’ve said all year “It’s a long time until December.”
Also remember that these are the construct of probabilities. While some are bets on exactly two, three, or four cuts much of it is bets on a lot of cuts (5+) or just one or none.


10yr #UST yields edged back -2bps to 4.38%, remaining in the middle of the range this year. They were also little changed for the week (-3bps).


The 2yr yield, more sensitive to #FOMC policy, also edged lower -3bps to 3.91%, a two-week low but also in the middle of its range this year. It finished the week -4bps. It is now -43bps below the Fed Funds midpoint, so continuing to call for a rate cut or two but around one less than it was at the beginning of May.
I had said when it was around 4.35% (in Jan & again early Feb) that I found the 2-yr trading rich as it was reflecting as much or more chance of rate hikes as cuts while I thought it was too early to take rate cuts off the table (and too early to put hikes in the next two years on), but then the 2yr fell to 3.65% past where I thought we’d see it, so I took some exposure off there. We got back there but I never added back what I sold, so I stuck tight. Ian Lygan of BMO saw it going to 3.5% by year’s end before all this tariff business.

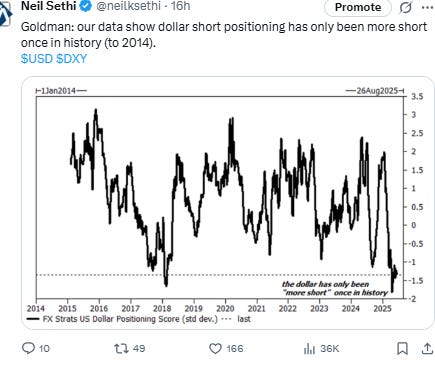
$DXY dollar index (which as a reminder is very euro heavy (over 50%) and not trade weighted) again tested the downtrend line from February that hasn’t yet been breached but fell back a touch. The daily MACD and RSI as noted Tuesday turned more neutral.

On the weekly chart the MACD remains in “go short” positioning and the RSI is weak.


VIX little changed remaining just over 20. That level is consistent w/~1.25% average daily moves in the SPX over the next 30 days.


The VVIX (VIX of the VIX) edged up to 109, just over Nomura’s Charlie McElligott’s “stress level” of 100 (consistent now with “elevated” daily moves in the VIX over the next 30 days (normal is 80-100)).

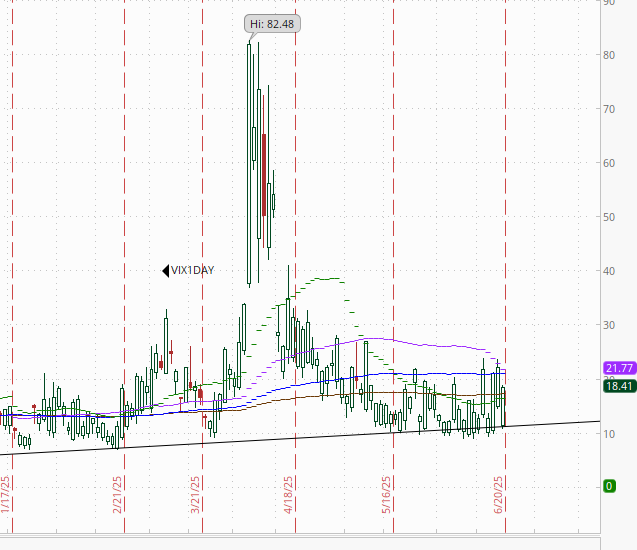
1-Day VIX fell back to 18.4 from the highest close since May 9th, still though consistent with traders implying an ~1.15% move in the SPX Friday.
#WTI futures edged to the highest close since January as risks regarding supply disruptions remained heightened. The daily MACD is strongly positive while the RSI is just above 70.
#oott
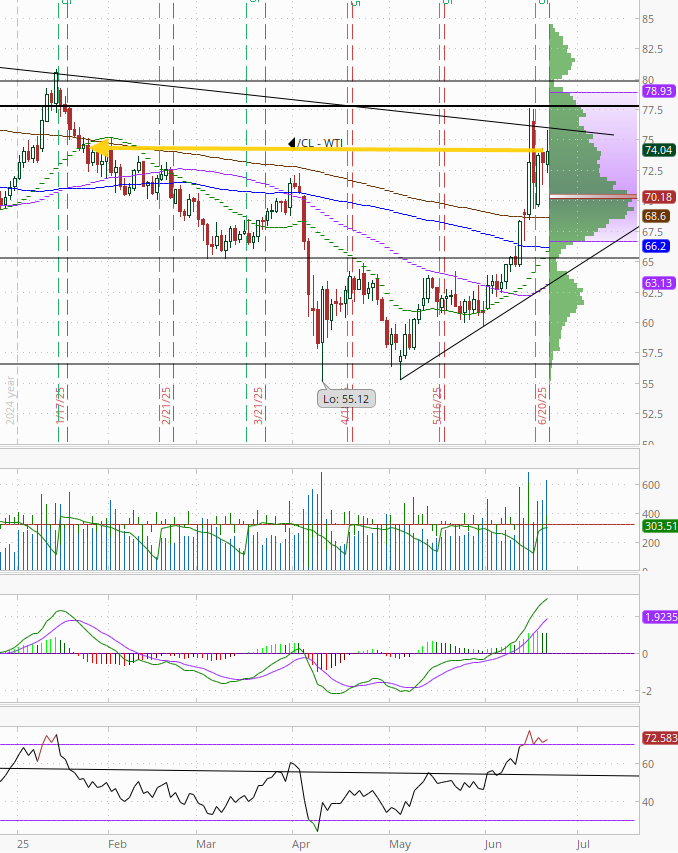
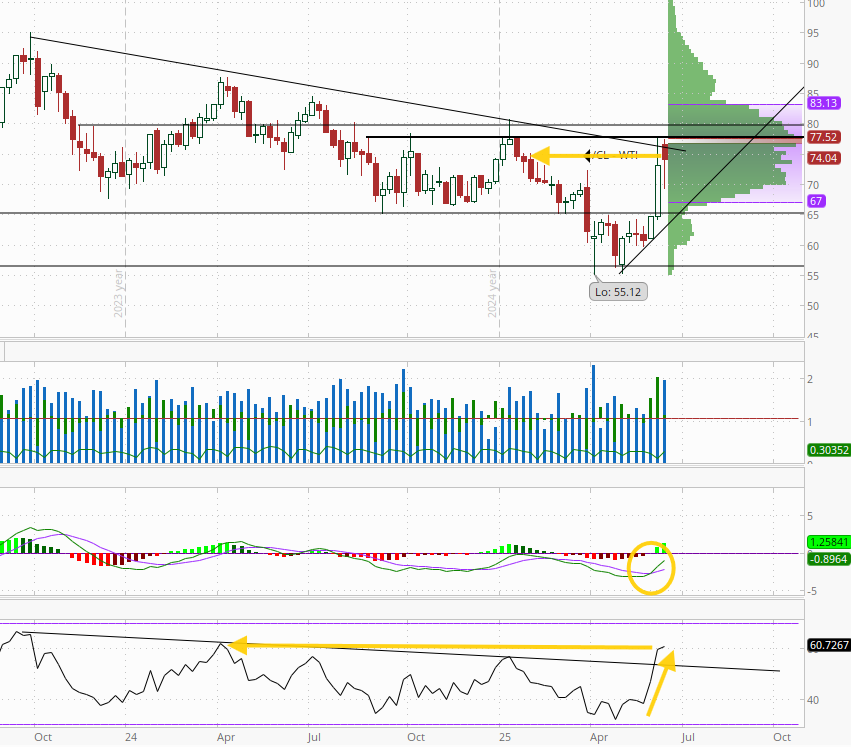
On the weekly chart, the MACD has crossed to “cover shorts” (circle) and the RSI jumped to the highest since Apr ‘24.
Gold futures (/GC) down modestly now closer to the middle of the uptrend channel from January. Still not far from the all-time closing high hit a week ago. Daily MACD and RSI are back to neutral.

On the weekly chart, the MACD just remains in go long positioning but the RSI is showing signs of a loss of momentum.


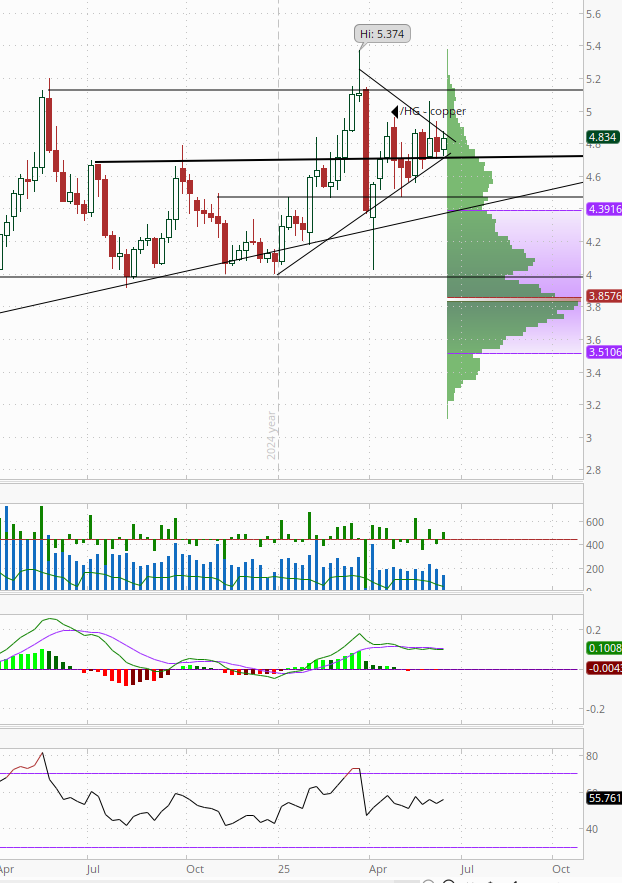
Copper (/HG) futures remained towards to the top of the now narrow wedge they have been in since March. The daily MACD and RSI remain relatively neutral.

Weekly chart is very similar.
Nat gas futures (/NG) up another 2.8% Wednesday, taking their 4-day run to nearly 10%, to the highest close since Apr 3rd. Daily MACD and RSI also are supportive. As noted Tuesday, no real overhead resistance until the $4.25 area.
Weekly chart shows basically a range trade since last November between $3 and $5. MACD and RSI are neutral.

Bitcoin futures fall to the lowest close in two weeks overall remaining in their range since late May. The daily MACD remains in “sell longs” positioning, and it has deteriorated over the past week while the RSI has fallen under 50.
As a reminder the last time daily RSI went from well over to well under 70 there was a a six-month period of consolidation (November), so we’ll see if this time is different (it needs to make and sustain a new high). So far it’s been 3 weeks.

The Day Ahead
Have a great weekend. In the US next week is a busy one. US data is headlined by the personal income and spending report (with core PCE prices) on Friday, but before that we’ll get flash PMI’s, new, existing, and pending home sales and home prices, consumer confidence (both Conf Bd and UMich), goods trade balance and durable goods orders, another look at Q1 GDP and the normal weekly reports.
Also, the Fed will be back on the speaking circuit, so we’ll get plenty of that.
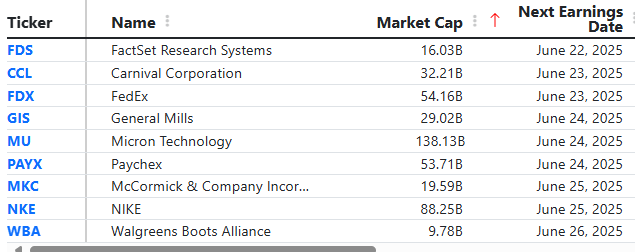
Earnings will be headlined by FedEx, Micron, and Nike.
In Washington, we’re in the middle of the “two week” windows for Trump administration decisions on Iran, reciprocal tariffs, and the July 4th deadline Trump gave for getting his Big Beautiful Bill passed.


Note earnings date listed listed is one day in advance for some reason. From WallStNumbers.com.
Link to X posts - Neil Sethi (@nelksethi) / X
To subscribe to these summaries, click below (it’s free!).
To invite others to check it out,