


Markets Update - 6/26/25
Update on US equity and bond markets, US economic reports, the Fed, and select commodities with charts!

To subscribe to these summaries, click below (it’s free!).
To invite others to check it out (sharing is caring!),
Link to posts - Neil Sethi (@neilksethi) / X
Note: links are to outside sources like Bloomberg, CNBC, etc., unless it specifically says they’re to the blog. Also please note that I do often add to or tweak items after first publishing, so it’s always safest to read it from the website where it will have any updates.
Finally, if you see an error (a chart or text wasn’t updated, etc.), PLEASE put a note in the comments section so I can fix it.
Major US equity indices started the day higher and moved up from there never hitting negative territory but stopped just short of record highs for the SPX and Nasdaq and breaching the 200-DMA for the Russell 2000 getting a late day push from WH Press Sec Leavitt saying the July 9th tariff deadline date "is not critical.... Perhaps it could be extended, but that’s a decision for the president to make.” They all are within 0.1% of those levels.
Elsewhere, Treasury yields and the dollar fell again as crude stabilized. Gold was also little changed while copper, bitcoin and nat gas rose.
The market-cap weighted S&P 500 (SPX) was +0.8%, the equal weighted S&P 500 index (SPXEW) +0.8%, Nasdaq Composite +1.0% (and the top 100 Nasdaq stocks (NDX) +0.9%), the SOX semiconductor index +0.9%, and the Russell 2000 (RUT) +1.7%.

Morningstar style box turned back to positive but small caps outperformed today.

Market commentary:
“The takeaway from this morning’s mixed data is that the economy is slowing, but remains resilient,” said Chris Larkin at E*Trade from Morgan Stanley. “While the numbers as a whole don’t necessarily make a compelling case for bulls or bears, for the time being, the market appears fixated on tech strength and the S&P 500’s potential return to record levels.”
“The markets are looking forward, seeing lower interest rates, less regulation in the banking sector, a shift from austerity to stimulus in Europe, and a less biting inflation and tariff environment,” said Jamie Cox, managing partner at Harris Financial Group. “This sure isn’t the stagflation story we’ve been told to brace for.”
“The stock market is back at record highs as various uncertainties start to fade,” said Paul Stanley at Granite Bay Wealth Management. “The market is betting on continued progress on trade, and a de-escalation of tensions in the Middle East is giving investors confidence.”
“In mid-July, earnings season begins, and that will act as a more concrete gauge on how companies have grappled with tariff uncertainty during the months of April and May, which were months with extreme headline risk,” he said. “The biggest risk right now isn’t missing out — it’s overreacting to short-term news, which could cause harmful investing mistakes.”
“The economy is slowing, but remains resilient,” said Chris Larkin at E*Trade from Morgan Stanley. “While the numbers as a whole don’t necessarily make a compelling case for bulls or bears, for the time being, the market appears fixated on tech strength and the S&P 500’s potential return to record levels.”
Bret Kenwell at eToro says investors want to see two things come out of the second quarter: Better-than-expected earnings growth and a rebound to positive annualized GDP growth. “If the latter is achieved, the US will avoid the technical definition of a recession,” Kenwell said. “Further, if management tells a good story about the consumer and current business trends, it should give investors further reassurance.”
“The safe bet on the outlook for the US economy is that it’s uncertain,” said Neil Birrell at Premier Miton Investors.
“Messaging from a dovish incoming Chair could potentially overshadow the hawkish skew to Powell’s wait-and-see signals,” said Ian Lyngen and Vail Hartman at BMO Capital Markets. “That certainly appears to be how the market is interpreting the risks as evidenced by the grinding bid for Treasuries.”
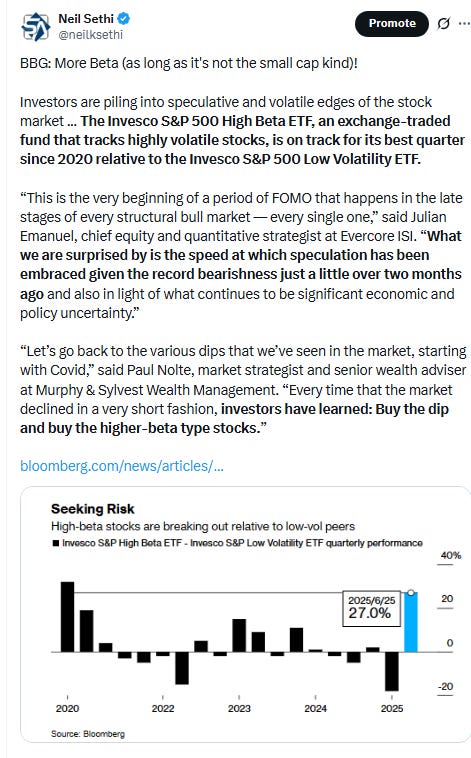
“This is the very beginning of a period of FOMO that happens in the late stages of every structural bull market — every single one,” said Julian Emanuel at Evercore ISI. “What we are surprised by is the speed at which speculation has been embraced given the record bearishness just a little over two months ago and also in light of what continues to be significant economic and policy uncertainty.”
“The markets are very overbought on a short-term basis and leadership is concentrated heavily toward S&P 500 and Nasdaq 100,” said Dan Wantrobski at Janney Montgomery Scott. “If breadth does not follow the breakouts in S&P and Nasdaq, then we will be on the watch for a correction.”
“Once the tariffs kind of de-escalated, investors came back to the dominant theme, which is AI,” said Keith Lerner, co-chief investment officer at Truist Advisory Services. “In a time of uncertainty around earnings, investors are gravitating towards areas that have more of a secular theme,” he said.
At Barclays Plc, strategists led by Ajay Rajadhyaksha expect stocks to outperform bonds despite the impacts from the trade war. They say equity investors’ focus is set to shift to economic data and AI from the twin topics of tariffs and the tax bill.
Stock-market volatility is likely to remain higher in the second half of the year given lingering macro and policy uncertainty, according to Goldman Sachs Group Inc. strategists. The team led by Andrea Ferrario says stagflationary shocks remain a key risk for balanced portfolios amid tariff-induced inflation risks.
“The various macro factors that I’m looking at seem to suggest that there’s no way this situation can continue,” Komal Sri-Kumar, president of Sri-Kumar Global Strategies, said on CNBC’s “Power Lunch” Wednesday, citing the Israel-Iran conflict as well as President Donald Trump’s tariffs and the impact of the “One Big Beautiful Bill Act” on the fiscal deficit.
Markets are now keenly focusing on medium-term issues on Capital Hill, according to Deutsche Bank. “With markets holding steady, we’re now at a point where the focus is turning to several important catalysts over the next two to three weeks,” macro strategist Henry Allen wrote on Thursday. “The first is the US tax bill, which is currently working its way through the Senate, and the administration is trying to get it passed by Independence Day on July 4.” ″[T]he focus is set to swiftly turn back to tariffs, as the 90-day extension to the reciprocal tariffs ends in less than two weeks’ time on July 9,” he added. “As it stands, it’s still unclear what will happen at that point, although several countries remain in negotiations with the U.S.”
As the S&P 500 has clawed its way back from this year's tariff-induced selloff, speculative areas of the market have outperformed by a greater degree than usual, according to Ned Davis Research. High-beta areas like growth stocks, dividend nonpayers and low quality have been ahead of the pack, which isn't unusual when stocks are initially recovering from a major correction, the NDR team said. However, the magnitude of this recovery has been strong relative to earlier similar examples highlighted by NDR, as has the degree by which these speculative stocks have outperformed. If there is one major difference this time around, it is that small-cap stocks have lagged. "The bottom line is that the rebound since the April 8 lows has been stronger than average and led by high-beta areas. The biggest exception has been small-caps, which have been replaced by large-cap Growth," NDR said.
June has been hectic on the policy and geopolitical fronts, but still good for the stock market. July, however, will see three potential events emerge front and center, according to Wells Fargo Investment Institute strategists: tariffs, the budget bill and the U.S. debt ceiling. What could go wrong? "We believe that the One Big Beautiful Bill Act could be debated until the end of July, just ahead of an approaching August deadline for a debt-ceiling increase," strategist Jennifer Timmerman and Gary Schlossberg wrote in a Thursday client note. They also note that the July 9 and August 12 tariff pauses bookend the debt-ceiling issue.
The S&P 500 could reclaim record territory today, tomorrow, next week or next month (which is also next quarter). But it's more about what comes afterward that really matters, according to Anthony Saglimbene, chief market strategist at Ameriprise Financial. He pointed to the self-imposed Republican deadline of July 4 for getting President Trump's signature tax-and-spending bill passed, the July 9 deadline for handling "reciprocal" tariffs on U.S. trade partners (other than China), as well as the start of second-quarter earnings season as areas of focus. Less attention has been on the expected deluge of Treasury supply in the wake of the budget bill, which has the potential to push up bond yields and weigh on stocks. Saglimbene said that has potential to be "part of the script" for the second half of 2025.


Link to posts - Neil Sethi (@neilksethi) / X for more details/access to charts.
In individual stock action:
Tech giants helped lift the broad market index on Thursday as they have during the comeback, with AI play Nvidia rising 0.5% to touch a fresh all-time high. Shares of Meta Platforms added more than 2%, while Alphabet climbed 1.7%.
Banks climbed as veteran analyst Mike Mayo said that as long as there’s no recession, it’s “game on” for the shares.
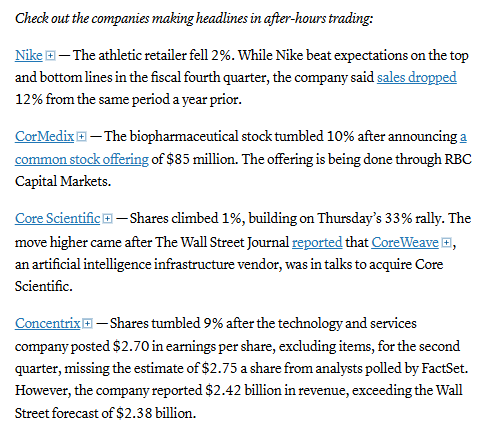
Companies making the biggest moves after-hours from CNBC:
Corporate Highlights from BBG:
Nike Inc. sales surpassed analysts’ expectations, showing the world’s largest sportswear company is recovering as it clears inventory to make way for fresher designs.
Meta Platforms Inc. is in advanced talks to acquire PlayAI, a small startup using artificial intelligence to replicate voices, part of the social media company’s push to nab top talent and catch up in the AI race.
Apple Inc. had its price target cut at JPMorgan Chase & Co. to $230 from $240 on the iPhone 17’s incremental lineup launch.
Micron Technology Inc., the top-performing chipmaker on Wall Street this year, delivered an outlook that wasn’t quite rosy enough to keep its 2025 rally going.
Salesforce Inc. Chief Executive Officer Marc Benioff said his company has automated a significant chunk of work with AI, another example of a firm touting labor-replacing potential of the emerging technology.
Coinbase Global Inc. shares closed at the highest level ever, capping off a rally fueled by growing acceptance of the cryptocurrency industry on Wall Street and in Washington.
The leader of UnitedHealth Group Inc.’s Optum Health care delivery unit has left the role, an early indication of management changes under Stephen Hemsley, UnitedHealth’s new chief executive officer.
Walgreens Boots Alliance Inc. reported quarterly profit that beat Wall Street’s expectations, a hopeful sign as the pharmacy giant prepares to transform into a private company after its market value plummeted due to retail competition and lower prescription drug payments from insurance companies.
Impossible Foods Inc. hopes to add its plant-based burgers to European menus this year, bringing to a close a six-year quest to enter the world’s biggest market for meat alternatives.
Some tickers making moves at mid-day from CNBC:
In US economic data:
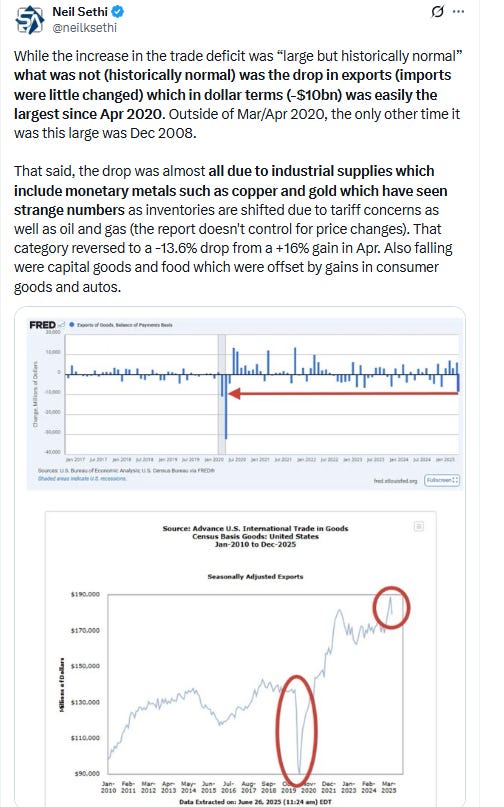
After the goods trade deficit jumped in March to a new $162bn all time high on record imports (which are ~30% larger than exports) ahead of Trump tariffs, then reversing all of that in April seeing the balance shrinking almost in half (-45%) to $87.0bn, taking it back all the way back to levels last seen in Dec ‘23, the goods trade deficit saw a large but more “normal” historically 11% move to $96.6bn in May. While the increase in the trade deficit was “large but historically normal” what was not (historically normal) was the drop in exports (imports were little changed) which in dollar terms (-$10bn) was easily the largest since Apr 2020. Outside of Mar/Apr 2020, the only other time it was this large was Dec 2008.
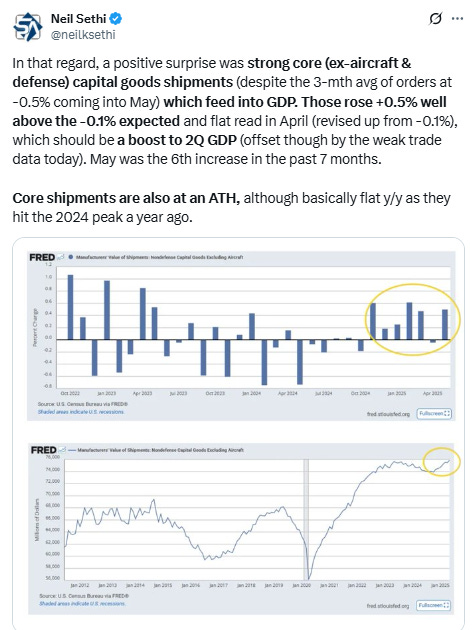
May durable goods orders (goods lasting >3yrs) jump 16%, the largest increase since July 2014(!) to an ATH, after -6.6% in Apr (rev’d from -6.3%), well above exp’s for +8.5%, as transportation orders continued to be very lumpy jumping 48.3% (also the most since July 2014, after falling -17.6% in Apr but rising 23.5% in March), on the back of nondefense aircraft (which are almost entirely Boeing orders) jumping +231% in May (the most since July but barely missing a decade high as well), after -52% in Apr but +159% in March). Autos (which are the largest component of transportation orders) were +0.6% after falling -3.2% in Apr (+1.6% in March). Ex-transp orders though were still a solid +0.5%, the best since September, also to an ATH, and better than the flat read expected, up from a flat read in Apr (revised from +0.2%), although all of that was due to defense orders which jumped +38.7% (after +26.8% in Apr (but -15% in March). Excluding those as well, ex-transp & defense orders were down -0.14%).. The key core capital goods orders (a proxy for biz cap ex) component also very strong at +1.7%, the best since Jan & second best since Jan ‘22), but after a weak -1.4 in Apr (rev’d from -1.5%), which is some good potential news for shipments (which factor into GDP) which have been softening.
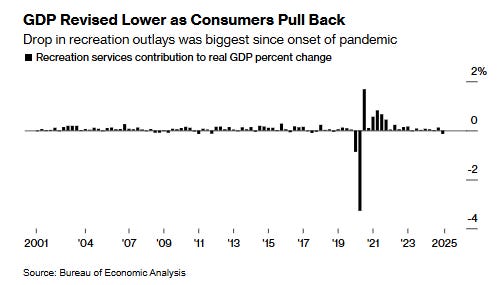
US consumer spending grew in the first quarter at the weakest pace since the onset of the pandemic on a sharp deceleration in outlays for a variety of services.
Spending on services contributed 0.3 percentage point to gross domestic product in the first three months of the year, the least since the second quarter of 2020, according to Bureau of Economic Analysis figures published Thursday. That was down sharply from a previously reported 0.79 point boost. Overall consumer spending increased at a 0.5% pace, instead of the previously reported 1.2%. GDP declined at a downwardly revised 0.5% annualized rate in the first quarter as a result.
Pending sales of previously owned homes in the US picked up in May after a sharp decline a month earlier, although overall activity remained subdued headed into summer. An index of contract signings rose 1.8% last month to 72.6, a mild gain after dropping in April by the most since 2022, data released Thursday by the National Association of Realtors show. That beat the median estimate of economists surveyed by Bloomberg, who expected the index to rise 0.1%. Signings picked up in all four US regions, most notably in the West, which rose by the most since December 2023.
Initial jobless claims (SA) in wk through June 21st edge back another -10k to 236k now down -14k from the highest level since October hit two weeks ago remaining in the range over the past yr, just +49k above the 50-yr lows in Oct '23 (187k). Four-wk moving avg edges -1k to 245k (+10k y/y), from the highest since Aug ‘23. This is consistent with the note two weeks ago that there have been modest moves higher in initial claims in early summer the past two years which eventually subsided. Continuing claims (SA) in wk through June 14th (1-wk lagged) though continued to hit new cycle highs +37k to 1.974mn, the highest since Nov ‘21, now materially over the 1.8-1.9mn range it had been in since June for a 3rd week. The 4wk moving avg up to 1.941mn, also the highest since Nov ‘21, +113k y/y, evidencing that while layoffs have remained very low, workers are having a little harder time finding a new job.


Link to posts for more details/access to charts (all free) - Neil Sethi (@neilksethi) / X
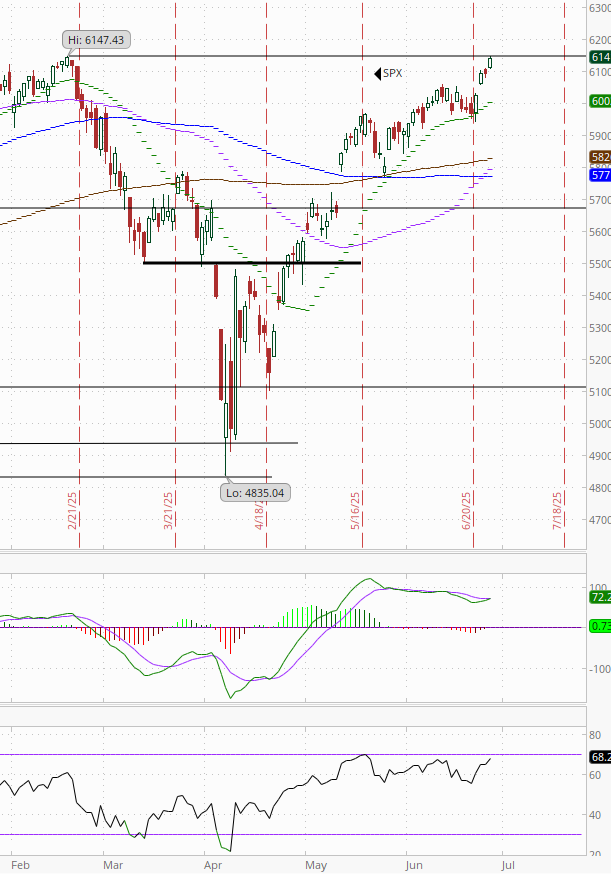
The SPX as noted on the cusp of an ATH. Its daily MACD is also turning more positive and the RSI remains over 60.


The Nasdaq Composite very similar setup.

RUT (Russell 2000) as noted just under its 200-DMA but lots of resistance above that. Still the highest since February.

Sector breadth from CME Cash Indices much better Thurs with 10 green sectors (so outside of Wed when there was just 3, we’ve had at least 9 green sectors every other day this week) with megacap growth sectors outperforming again with Comm Services and Cons Discr taking two of the top three spots (with Energy) while defensives were generally weak again with RE finishing last and Staples next for a second day. Utilities though had a much better day Thurs.

SPX stock-by-stock flag from Finviz consistent with a lot more green today and plenty of stocks up over 2% (although not many up more than 3%) while very few were down that much (ABT, EQIX, and FICO were all I noticed).

NYSE positive volume (percent of total volume that was in advancing stocks) which has been mixed the last couple of weeks was much better Thurs at 79.3%, the best since May 27th, very good even considering the +0.84% gain in the NYSE Composite Index. In comparison it was 69.9% on Tuesday despite a +1.05% gain in the index.

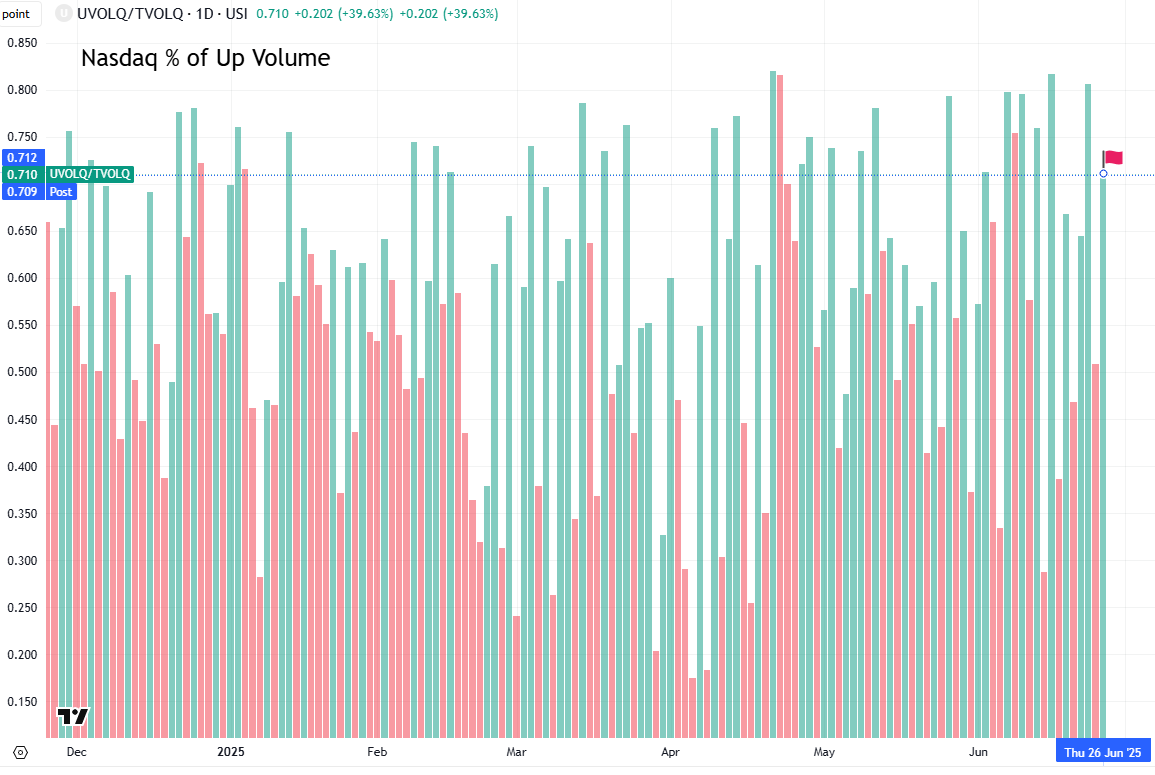
Nasdaq positive volume also very solid at 71.0%, but clearly not as good and not even the best of the week (but in fairness the index gain was smaller at +0.97% today. Still in comparison on Monday it was just 63.7% with a similar gain in the index.
Positive issues (percent of stocks trading higher for the day) were not far off at 79 and 68% respectively.
New 52wk highs-new lows (red-black dotted line) also improved to 86 on the NYSE which was the best since January and to 136 on the Nasdaq a little below the 155 hit Tues which was the best since December.


While the Fed speakers today were able to cut back the chances of a July rate cut, pricing for 2025 #FOMC rate cuts continued to firm adding another +3bps to 65bps according to CME’s #Fedwatch tool, (still though down from 92bps on May 1st; and the peak this year at 103bps on Apr 8th (the low was 36bps Feb 11th)).
The probability of a cut at the July meeting is now 20% (from 25% Wed but 10% a week ago (it was 78% at the start of May)) while a cut by the following meeting (Sept) is now at 93% (up from 68% a week ago and now almost to the 95% May 1st).
Chances of 2 cuts this year is 92% (up from 62% on FOMC Day which was around the least we’d seen since Feb also closing in on the 99% at the start of May), three is 58% (so better than 50-50), and four is 10%. The chance of no cuts has fallen to 0.4% (down from 8% FOMC Day and almost the least since May 1st).
Even more notable though 2026 cuts jumped +10bps to 73bps (so now nearly three additional cuts next year), seeing total cuts through Dec '26 at 138bps, +29bps from FOMC Day and now just -10bps from the start of May.
I said after the big pricing out of cuts in January (and again in February) that the market had pivoted too aggressively away from cuts, and that I continued to think cuts were more likely than no cuts, and as I said when they hit 60 bps “I think we’re getting back to fairly priced (and at 80 “maybe actually going a little too far” which is back to where we probably were Apr 20th (a little too far) at 102bps). Seems like we’re getting back to “fairly priced,” and as of May 14th at 48bps perhaps starting to go a little too far in the other direction, but as I’ve said all year “It’s a long time until December.”
Also remember that these are the construct of probabilities. While some are bets on exactly two, three, or four cuts much of it is bets on a lot of cuts (5+) or just one or none.


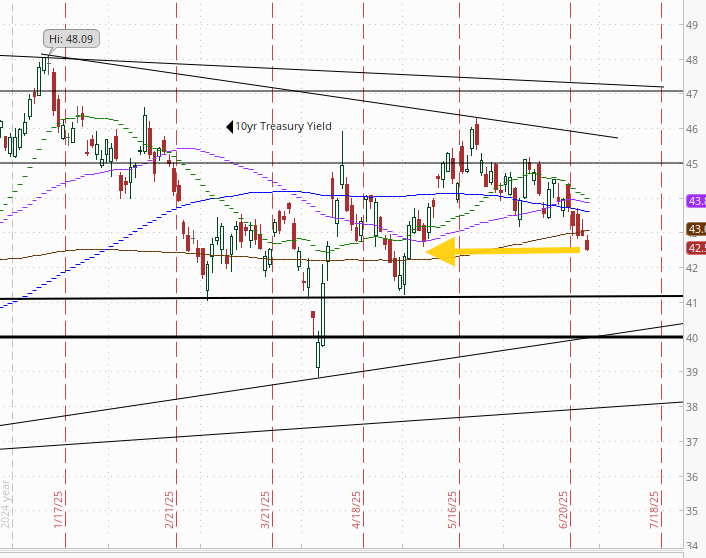
10yr #UST yields resumed their declines Thurs down another -4bps to 4.25%, the lowest close since May 7th, but still remaining not far from the middle of the range this year.


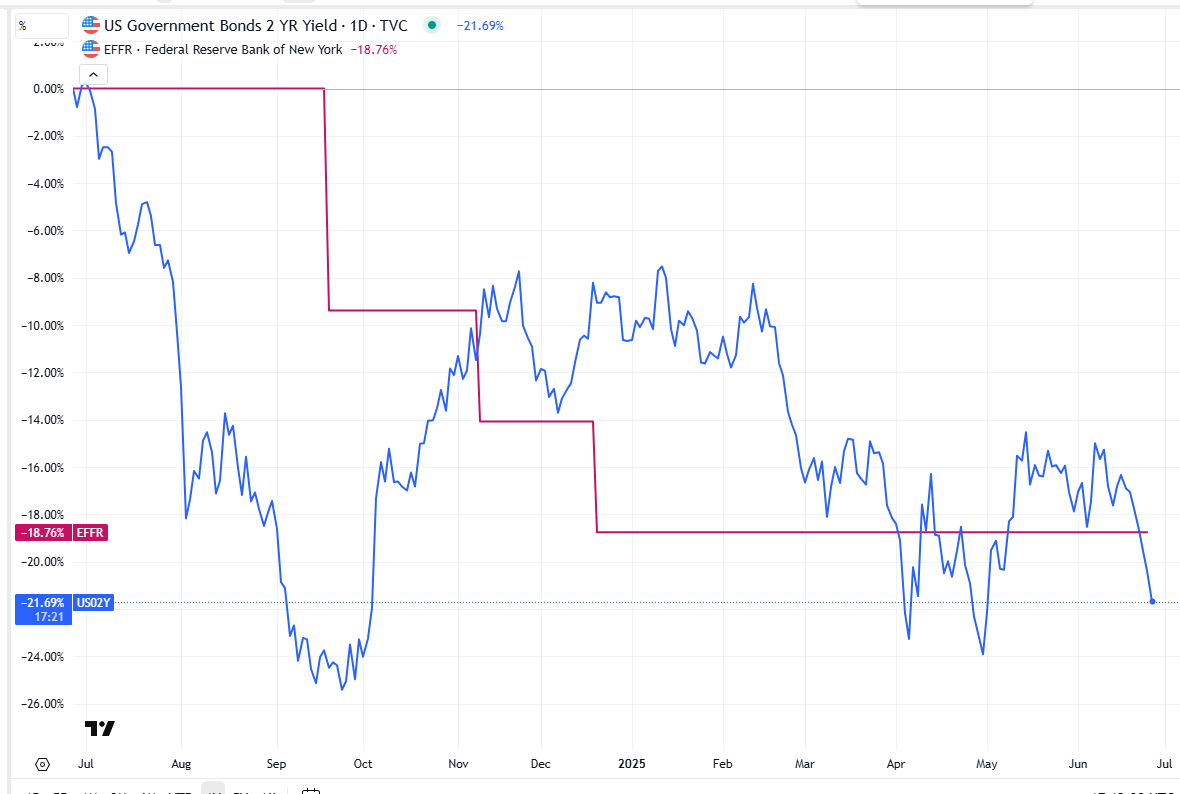
The 2yr yield, more sensitive to #FOMC policy, fell another -6bps to 3.71%, the least since May 1st as Fed rate cut bets through next year are approaching those levels. It is now -61bps below the Fed Funds midpoint, so calling loudly now for rate cuts. It is now down -32bps since June 6th.
I had said when it was around 4.35% (in Jan & again early Feb) that I found the 2-yr trading rich as it was reflecting as much or more chance of rate hikes as cuts while I thought it was too early to take rate cuts off the table (and too early to put hikes in the next two years on), but then the 2yr fell to 3.65% past where I thought we’d see it, so I took some exposure off there. We got back there but I never added back what I sold, so I stuck tight. Ian Lygan of BMO saw it going to 3.5% by year’s end before all this tariff business.
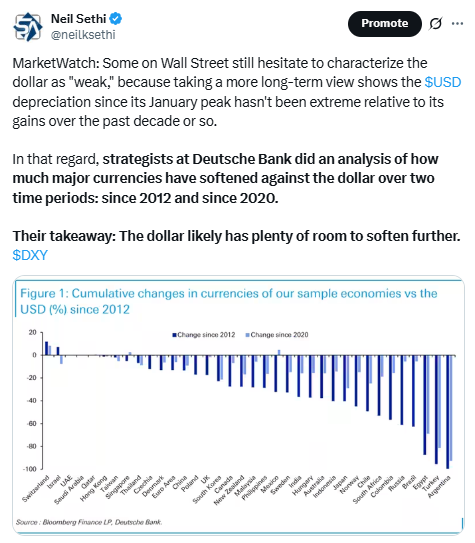
$DXY dollar index (which as a reminder is very euro heavy (over 50%) and not trade weighted) continued its reversal after touching the 50-DMA Monday to a fresh 3+ yr low. The daily MACD and RSI are starting to tilt more negative.


VIX little changed but only after touching the lowest levels since late Feb finishing at 16.6. That level is consistent w/~1.04% average daily moves in the SPX over the next 30 days.

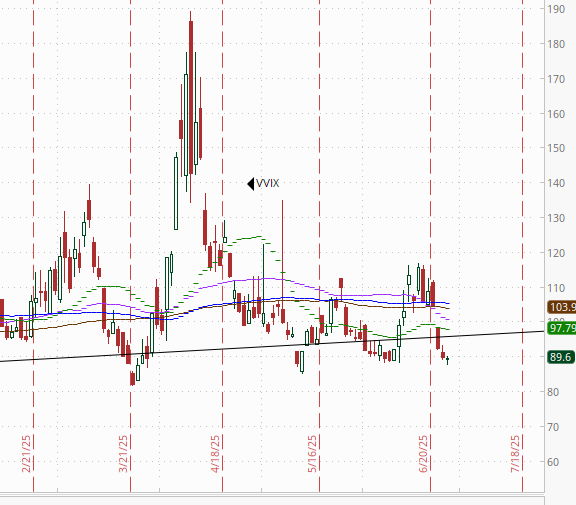
The VVIX (VIX of the VIX) similarly little changed at 90, under Nomura’s Charlie McElligott’s “stress level” of 100 (consistent now with “moderate” daily moves in the VIX over the next 30 days (normal is 80-100)).
1-Day VIX like the VIX hit the lowest levels since Feb 20th today but closed a touch above Wed at 11.1, remaining under that uptrend line from December. It’s consistent with traders implying an ~0.69% move in the SPX Thurs.

#WTI futures managed to again hold the uptrend line from the May lows to finish just above the $65 area which I said I thought would hold on Monday. So far it has for the most part.
As noted Tuesday though the daily MACD has now though crossed to “sell longs” positioning and the RSI has plunged from over 70 to under 50.
#oott

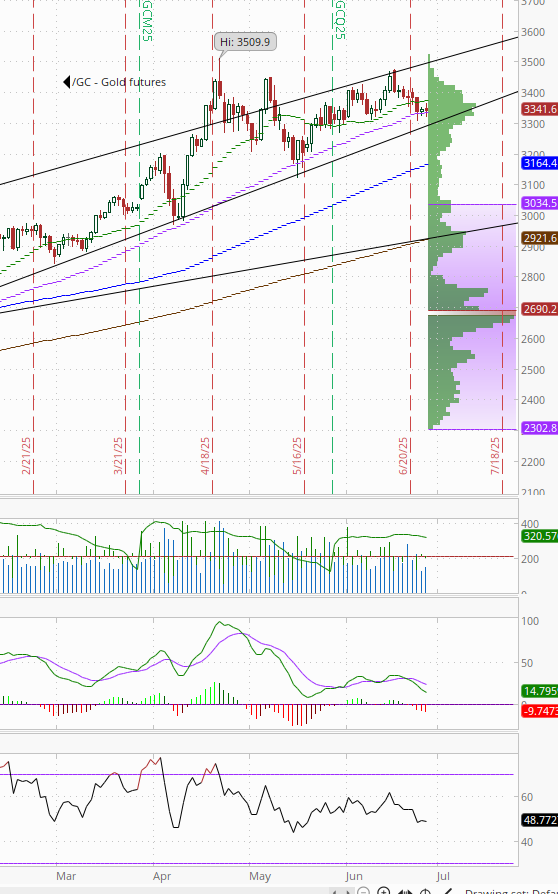
Gold futures (/GC) little changed remaining on the 50-DMA and in the middle of the uptrend channel from January. Daily MACD and RSI have turned more negative though as noted Wed.

Copper (/HG) futures shot up nearly 4% to the $5.15 resistance level it has closed over only twice ever (in March) on the back of Goldman warning that copper shortages due to inventory mismatches caused by tariff concerns could see prices spike (although they were referring more to LME copper where inventories have fallen 80% this year). It wasn’t able to push through though and fell back to finish a little under. Still the highest close since March. The daily MACD and RSI now more strongly positive.

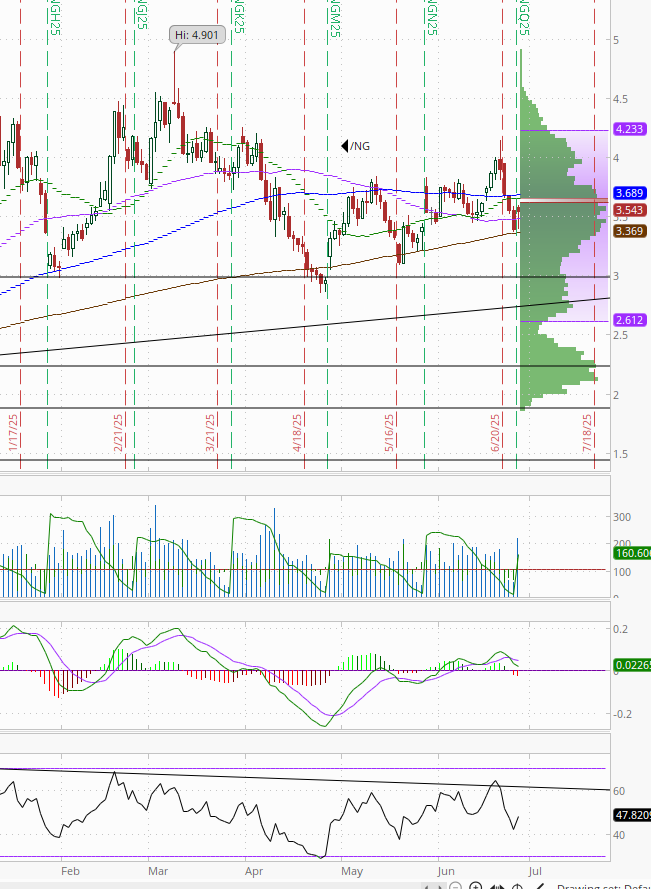
Nat gas futures (/NG) got back Wed’s -4.4% drop despite a larger than expected storage build moving off the 200-DMA. As noted Wed, that level has more or less held all year. Daily MACD and RSI have turned negative though as noted previously.

Bitcoin futures paused their rebound from the $100k level remaining in their range since late May. The daily MACD remains in “sell longs” positioning, while the RSI is around 50 but both are improving.
As a reminder the last time daily RSI went from well over to well under 70 there was a a six-month period of consolidation (November), so we’ll see if this time is different (it needs to make and sustain a new high). So far it’s been 3 weeks.


The Day Ahead
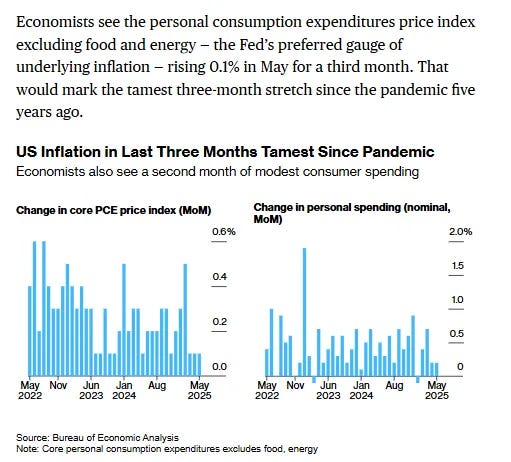
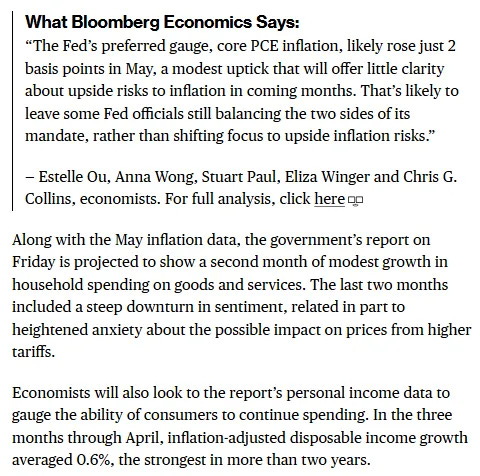
US economic data continues to be hot and heavy Friday as we get our premier release of the week in the personal income and spending report (with core PCE prices, the Fed’s key inflation metric which is expected to show a third straight month of muted readings - the lowest three-month stretch since the pandemic) our most holistic look at incomes, spending, and prices. We’ll also get the final UMich consumer sentiment read.
In terms of Fed speakers we’ve got Gov Cook and regional Fed presidents Williams and Hammack both of which we’ve heard from multiple times this week.
In earnings, no SPX reports tomorrow and light day overall.
Ex-US DM we’ll get Japan’s Tokyo CPI (has a very high correlation with the full country number), unemployment, and retail sales, French and Spanish preliminary June CPI, EU consumer and biz confidence, along with a number of ECB speakers, and Canada GDP.
In EM we’ll get a policy decision from Columbia along with India industrial production and Brazil unemployment and inflation (sorry I put those in yesterday by mistake) among other reports.


Link to X posts - Neil Sethi (@nelksethi) / X
To subscribe to these summaries, click below (it’s free!).
To invite others to check it out,