


Markets Update - 7/15/25
Update on US equity and bond markets, US economic reports, the Fed, and select commodities with charts!

To subscribe to these summaries, click below (it’s free!).
To invite others to check it out (sharing is caring!),
Link to posts - Neil Sethi (@neilksethi) / X
Note: links are to outside sources like Bloomberg, CNBC, etc., unless it specifically says they’re to the blog. Also please note that I do often add to or tweak items after first publishing, so it’s always safest to read it from the website where it will have any updates.
Finally, if you see an error (a chart or text wasn’t updated, etc.), PLEASE put a note in the comments section so I can fix it.
Major US equity indices started the day modestly higher after a fifth straight beat on core CPI as modest services and falling vehicle prices offset some strength elsewhere in core goods. Tech shares were also boosted by reports that the White House will permit renewed sales of Nvidia and AMD chips to China. And while tech was a solid performer today (+1.3%) every other sector deteriorated as yields rose as analyst parsing of the CPI report revealed what appeared to be the start of some tariff inflation along with a weak read-through to the PCE prices metric, the Fed’s preferred inflation gauge (which makes tomorrow PPI all the more important). We also got another “wait and see” speech from a Fed voter (Collins) which further pushed up yields and pressured stocks. At the end of the day only the Nasdaq (on the back of Tech) stayed in the green. The Russell 2000 small cap index saw the worst of the selling ending -2% lower (I guess maybe we’re not going to see that big CTA buying after all).
Elsewhere, Treasury yields as noted pushed higher as did the dollar, as did nat gas, while bitcoin, gold, crude, and copper were lower.
The market-cap weighted S&P 500 (SPX) was -0.4%, the equal weighted S&P 500 index (SPXEW) -1.4%, Nasdaq Composite +0.2% (and the top 100 Nasdaq stocks (NDX) +0.1%), the SOX semiconductor index +1.3%, and the Russell 2000 (RUT) -2.0%.

Morningstar style box showed the weakness outside of the large growth stocks.

Market commentary:
“The market is more focused on this year-over-year number,” said Scott Wren, senior global market strategist at Wells Fargo Investment Institute. “But the fact that for 5 straight months the month-over-month headline CPI number has come in below expectations, that is meaningful.”
Kay Haigh, global co-head of fixed income and liquidity solutions in Goldman Sachs Asset Management, says: “While today’s CPI release showed some early signs of tariff impact, on the whole underlying inflation remained muted. Price pressures, however, are expected to strengthen over the summer and the July and August CPI reports will be important hurdles to clear. For the time being the Fed remains in wait-and-see mode. Should underlying inflation, however, continue to prove benign the path remains open to a resumption of the Fed’s easing cycle in the autumn.”
To Tiffany Wilding at Pacific Investment Management Co., despite a firmer core CPI in June relative to May, Fed officials will likely welcome this report – higher tariff related goods inflation justifies their more cautious stance, while continued disinflation across services categories should support rate cuts in September and beyond. “We believe the fact that inflation is more concentrated in core goods categories will make it easier for the Fed to communicate why they are cutting rates while inflation is above target,” she noted.
Given recent trade policy developments, the Fed will likely look to stay patient as inflation impacts continue to materialize, according to Oscar Munoz and Gennadiy Goldberg at TD Securities. “Today’s report showed the beginning of the tariff passthrough into core goods inflation, and as long as the labor market remains strong, the Fed can afford to wait and see how inflation and inflation expectations evolve over the summer,” they said.
“The latest U.S. inflation report practically confirmed that President Trump’s tariffs acted to push up consumer prices in June,” said Matthew Ryan, head of market strategy at global financial services firm Ebury. “While there was a mild miss in the core number, both the main and underlying inflation measures are now printing at their highest levels in four months. The big fear for Fed officials is that stormier waters lie ahead, as not only is there a time lag between the tariffs and an increase to prices, but additional tariff hikes on 1st August would almost certainly herald further inflationary pressures ahead,” Ryan added.
Skyler Weinand, chief investment officer of Regan Capital, said it was a relief to see Tuesday’s CPI report coming in-line with expectations, but that “it’s highly likely that a tariff-driven inflation reckoning is coming.”
Ian Lyngen, the head of US rates strategy at BMO Capital Markets says it’s tough to imagine this CPI report moves the needle on a Fed cut before September given the present environment around tariffs. The lackluster performance in Treasuries after the release likely reveals as much: “In a typical environment, one would expect this report would start conversations about a Fed cut. Alas, the looming Aug 1 round of tariffs will keep the Fed on hold for now. From here, there is a variety of Fedspeak scheduled for the session and investors will be attuned for any near-term policy hints — even if such guidance is unlikely at the moment.”
“The big question for the inflation picture is tariffs. It’s taking some time for tariffs to show up in the data, but it’s highly likely that a tariff-driven inflation reckoning is coming,” said Skyler Weinand at Regan Capital. “The Fed will want to watch the next several inflation and jobs reports before it makes any moves on rates.”
To Ellen Zentner at Morgan Stanley Wealth Management, inflation has begun to show the first signs of tariff pass-through. While services inflation continues to moderate, the acceleration in tariff-exposed goods is likely the first of greater price pressures to come, she said, adding the Fed will want to hold steady as it awaits more data.
“If you believe the economy is hobbling along, then you have a case for thinking price pressures will disappear soon,” said Callie Cox at Ritholtz Wealth Management. “But for now, they’re here, and curious minds may start wandering down the rabbit hole of how far inflation could go.”
Cox says the next few weeks could shift these summer markets into a higher gear.
“It’s time for the bulls to bring the receipts before we settle in for another sleepy August,” she said. “Eventually, we need to see fundamentals back up these prices. I’m interested to see if the data can get us there.”


Link to posts - Neil Sethi (@neilksethi) / X for more details/access to charts.
In individual stock action:
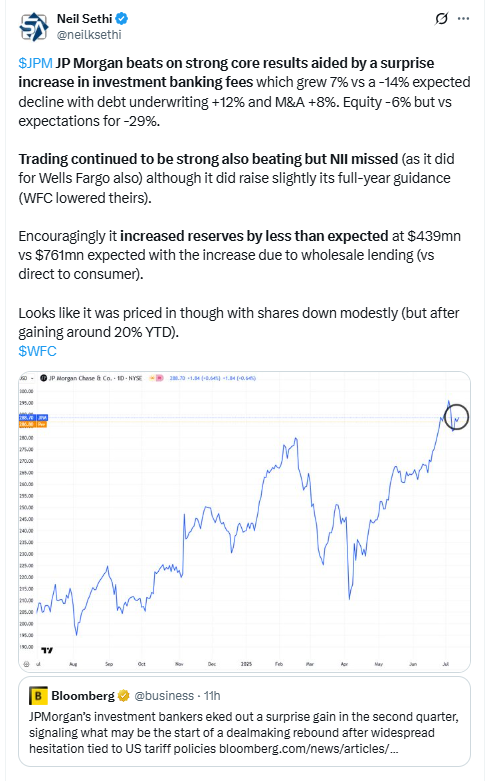
On the earnings front, reports from several financial heavyweights failed to impress investors. Wells Fargo beat earnings, but a reduction in net interest income guidance sent shares lower by more than 5%. Shares of JPMorgan Chase edged lower even though the bank posted better-than-expected second-quarter results driven by strong trading and investment banking revenue. Asset manager BlackRock slipped nearly 6% on a quarterly revenue miss. Citigroup bucked the negative trend in financials, rising more than 3% after the bank topped second-quarter estimates.
Tech shares jumped on news Nvidia Corp. and Advanced Micro Devices Inc. will resume some chip sales to China.


Corporate Highlights from BBG:
Apple Inc. has struck a $500 million deal to buy rare-earth minerals from MP Materials Corp., the US producer that just last week secured backing from the Pentagon.
Tesla Inc. opened its first India showroom, showcasing Model Y cars with a starting price of nearly $70,000, as Elon Musk’s electric-vehicle maker looks to tap new markets and offset slowing sales where it’s already well established.
Air taxi startup Joby Aviation Inc. plans to double aircraft output capacity at its main production site in California, just weeks after completing piloted test flights in Dubai.
CoreWeave Inc., a provider of AI computing power to companies including OpenAI Inc. and Microsoft Corp., said it plans to invest as much as $6 billion to set up a data center in Lancaster, Pennsylvania, as the firm expands its capacity across the US.
BlackRock Inc.’s revenue and performance fees missed estimates, even as the world’s largest money manager hit a record $12.5 trillion in assets.
Bank of New York Mellon Corp.’s second-quarter profit surpassed analyst expectations as the bank continued to reinvest maturing securities at higher yields, fueling a 9% increase in revenue.
Uber Technologies Inc. and Baidu Inc. plan to launch robotaxis on the ride-sharing platform in several markets outside of the US and mainland China through a multiyear partnership.
Georgia regulators approved a plan that opens the door for Southern Co. to boost spending by as much as $15 billion to deliver a projected surge of electricity for data centers, new factories and electric vehicles.
Albertsons Cos. raised its sales forecast for the full year, but left its earnings outlook unchanged amid pressure on margins.
Some tickers making moves at mid-day from CNBC:

In US economic data:
US June CPI comes in as expected at the headline (not beating m/m for the first time in four months) at +0.3% (+0.29% unrounded up from +0.08% in May)) as expected, while y/y it comes in a tenth hot at +2.7% (vs +2.6% exp’d, unrounded it was +2.67%, up from 2.38% in May, the second month of increasing y/y figures), but core does beat for a fifth straight month by a tenth at +0.2% (+0.23% (so a small beat) from +0.13% in May), with core y/y rising for the first time this year to +2.91% from +2.77% in May (which was the least since Mar 2021).
With headline CPI accelerating to +0.3%, real weekly earnings (average weekly pay adjusted for inflation), an important economic metric, fell to the least of the year at -0.36%, which cut the y/y number nearly in half to +0.74%, the least since Jan, from 1.44% in May (and 1.80% in Apr which was the best since Mar ‘21).


Link to posts for more details/access to charts (all free) - Neil Sethi (@neilksethi) / X
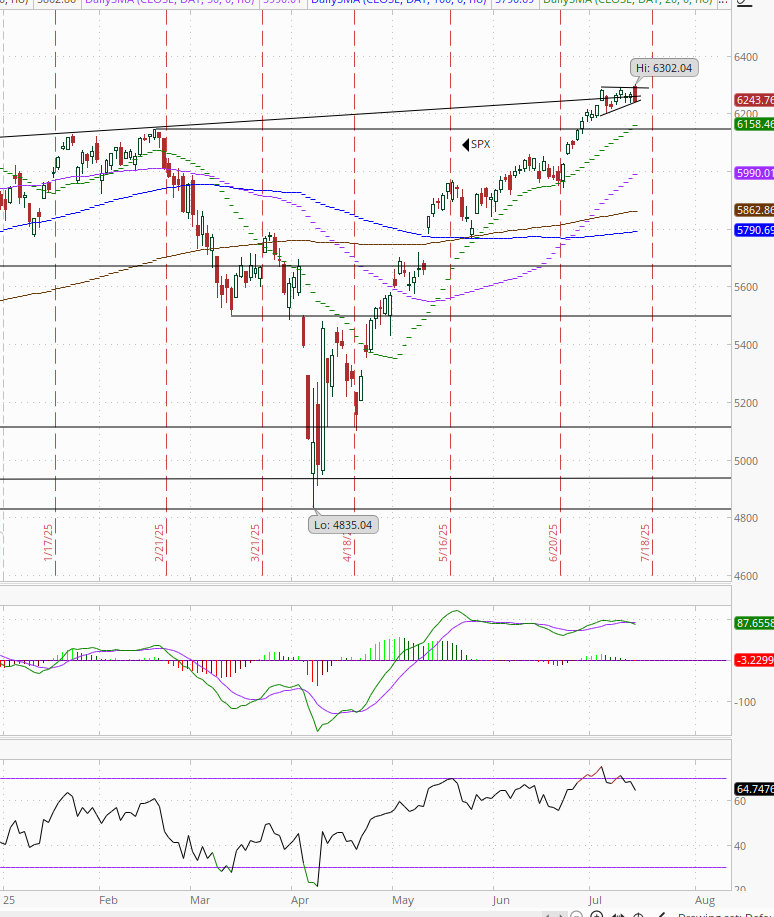
The SPX hit an ATH before falling back as it continues to trade mostly sideways over the past eight sessions. Its daily MACD has turned negative, and the RSI is starting to deteriorate.


The Nasdaq Composite a little more favorable picture.

RUT’s (Russell 2000) “clear path to move at least to the 2300 level” per my note three weeks ago has gone from “gotten choppy,” as I noted Friday, to “in jeopardy” Tuesday as it falls back to its trendline and the 22000 level. MACD remains positive but is deteriorating, as is the RSI.

Sector breadth from CME Cash Indices down to just one green sector, the worst in weeks, and that was mostly a semiconductor story which led Tech to a +1.3% gain. Every other sector down at least -0.6% with six down >-1%.

SPX stock-by-stock flag from @FINVIZ_com relatively consistent with a LOT more red today. In fact outside of tech as noted very few stocks were up. Citi was a standout up 3%.
Lots of stocks down that much with particular weakness in asset managers (but most of financials saw a big sell the news reaction), drugs, home improvement and specialty retailers, and oil exploration.

NYSE positive volume (percent of total volume that was in advancing stocks), which had been relatively strong the last couple of weeks but just “ok” Friday and Monday was weaker on Tuesday at just 21.4%, the least since May 21st (when the index lost -1.68%) not completely out of line though with the -1.01% loss.

Nasdaq positive volume also fell back but remained more elevated than the NYSE at 48.8% but still weak considering there was a +0.18% gain in the Nasdaq index.
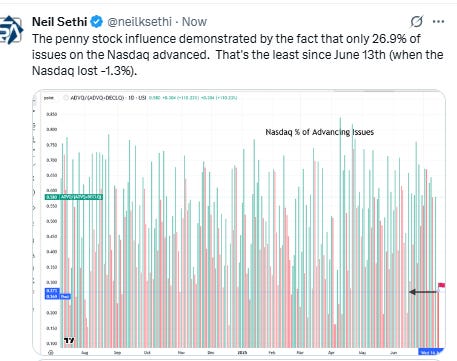
Penny stock volumes continued to edge back but still we had 7 of the top 13 stocks by volume today sub $2 (down though from 9 Monday and 12 Friday) while the total volume in those stocks came in at 1.2bn or 14% of total Nasdaq volume down from 16% Monday.
That might also explain why the performance today was very weak compared to some days last week. For example, Thursday we saw 76.1% positive volume on just a +0.09% advance in the index.


Positive issues (percent of stocks trading higher for the day) were weaker (much weaker on the Nasdaq) at 20 & 27% respectively.
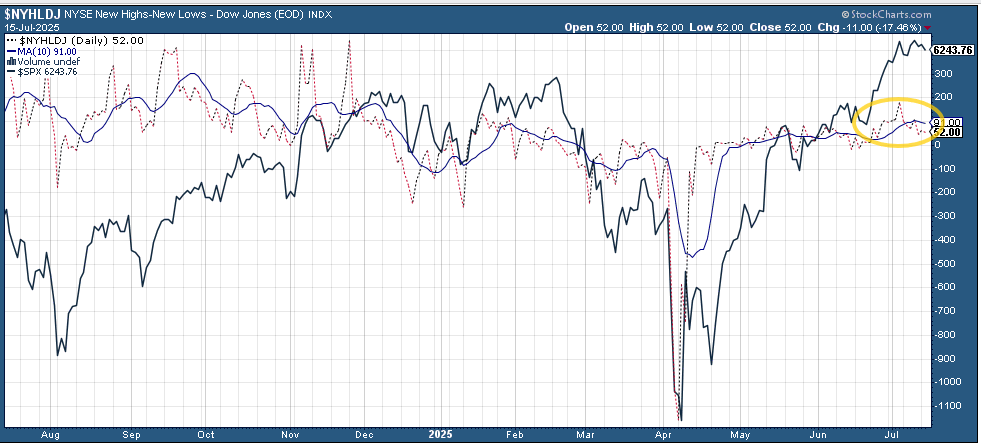
New 52-wk highs-new lows (red-black dotted lines) were mixed with the NYSE falling back towards 3-wk lows at 51 while the Nasdaq moved up to 99 (but that is down from 265 on July 3rd).

Fed rate cut bets fell despite the fifth cooler than expected core CPI print, as Fed speakers continued to push the “wait and see” line on tariffs and perhaps due to the evidence of some tariff inflation working its way into the numbers with pricing for 2025 #FOMC rate cuts another -4bps to 44bps according to CME’s #Fedwatch tool, (down -10bps the past week and down from 64bps July 2nd before the June NFP & from 92bps on May 1st (the peak this year was at 103bps on Apr 8th, the low was 36bps Feb 11th)).
The probability of a cut at the July meeting is 3% down from 23% pre-NFP (and from 78% at the start of May) while a cut by the following meeting (Sept) is now just 56% from 94% pre-NFP and the lowest since February.
Chances of 2 cuts this year is 62% (down from 90% pre-NFP and also the lowest since February), three is 20% (down from 55%), and four is 0.5% (from 10%). The chance of no cuts low at 7% but still up from 0.6% pre-NFP (almost to the highest since February).
2026 cuts also fell back -7bps to 64bps, seeing total cuts through Dec '26 at 108bps, the least since February and -38bps from the start of May.
I said after the big pricing out of cuts in January (and again in February) that the market had pivoted too aggressively away from cuts, and that I continued to think cuts were more likely than no cuts, and as I said when they hit 60 bps “I think we’re getting back to fairly priced (and at 80 “maybe actually going a little too far” which is back to where we probably were Apr 20th (a little too far) at 102bps). Seems like we’re getting back to “fairly priced,” and as of May 14th at 48bps perhaps starting to go a little too far in the other direction, but as I’ve said all year “It’s a long time until December.”
Also remember that these are the construct of probabilities. While some are bets on exactly two, three, or four cuts much of it is bets on a lot of cuts (5+) or just one or none.


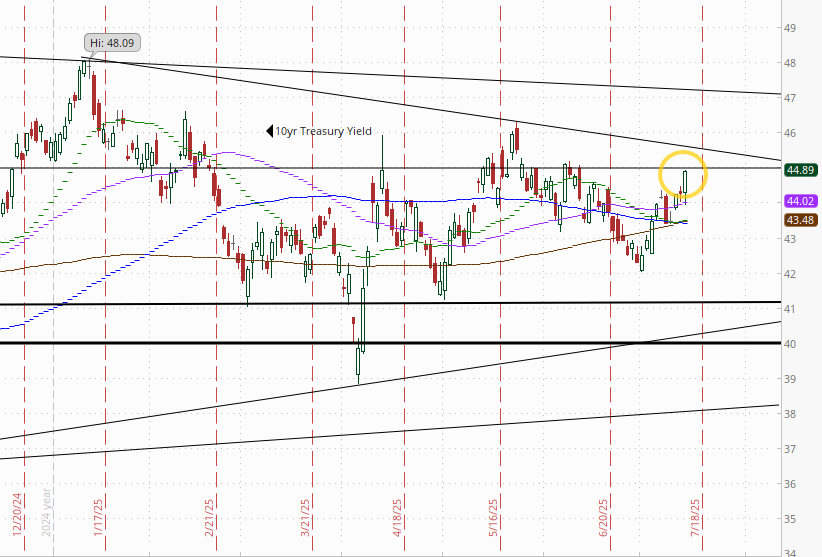
10yr #UST yields up +6bps Friday to 4.49%, the highest close since June 6th, and now back up to the 4.5% target from last week. We’ll see if it can push through as it did back in May (briefly).


The 2yr yield, more sensitive to #FOMC policy, +5bps to 3.95% near a 1-mth high. It is -38bps below the Fed Funds midpoint, so still calling for rate cuts but also up +23bps this month.
I had said when it was around 4.35% (in Jan & again early Feb) that I found the 2-yr trading rich as it was reflecting as much or more chance of rate hikes as cuts while I thought it was too early to take rate cuts off the table (and too early to put hikes in the next two years on), but then the 2yr fell to 3.65% past where I thought we’d see it, so I took some exposure off there. We got back there but I never added back what I sold, so I stuck tight. Ian Lygan of BMO saw it going to 3.5% by year’s end before all this tariff business but now thinks it’s at fair value at around 3.75% so I took some more off at the end of June.

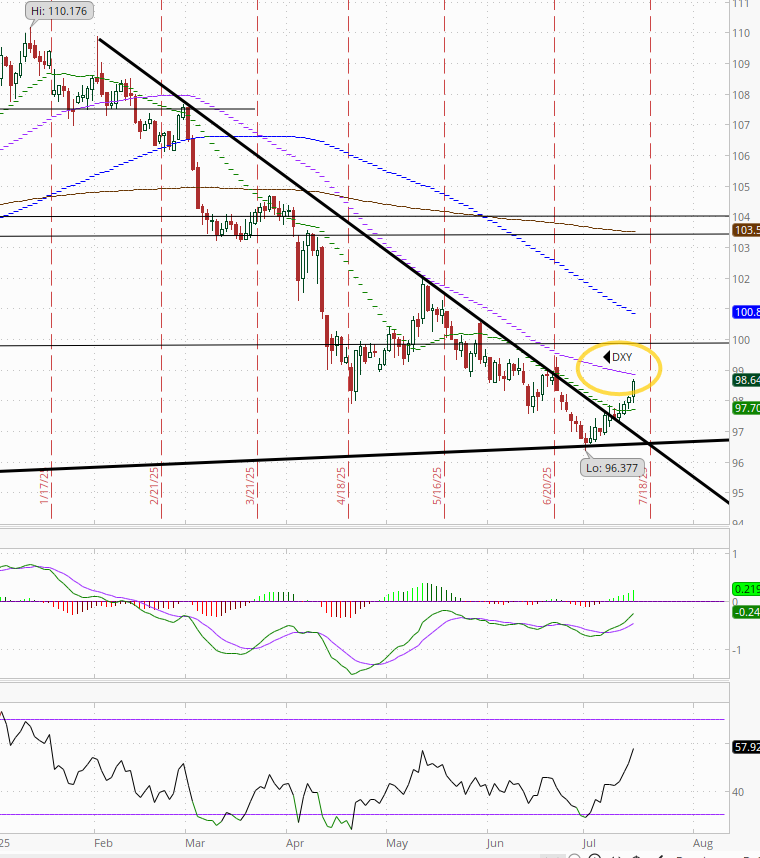
$DXY dollar index (which as a reminder is very euro heavy (over 50%) and not trade weighted) was up for a 4th day (and 8th in 10) up towards the 50-DMA at $98.85 noted just yesterday.
The daily MACD as noted last Monday crossed over to “cover shorts” while the RSI is now the highest in nearly two months and over 50 after having moved from under to over 30, which can be a signal of a reversal of a downtrend, “so it’s got a lot of boxes checked for a move higher,” as I noted Monday.

VIX edged up to 17.4, overall remaining in the same narrow range it’s been in for almost three weeks. The current level is consistent w/~1.09% average daily moves in the SPX over the next 30 days.

Remember, though, we’re in a seasonally strong period for the VIX. Chart from July 9th.

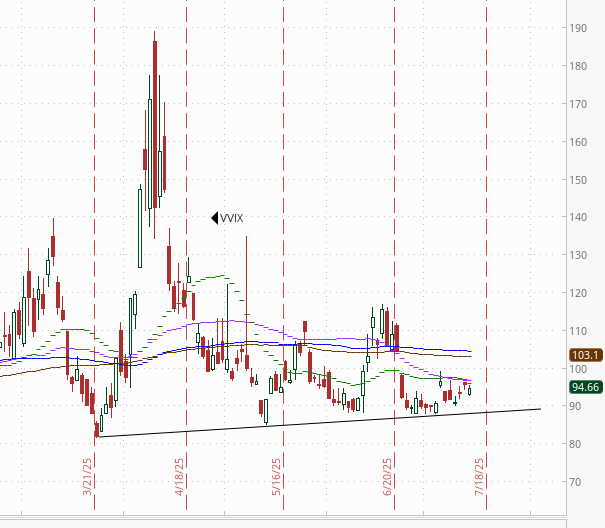
The VVIX (VIX of the VIX) fell back a touch bur like the VIX remained in the area it’s traded in the past fourteen sessions at 94.6, still under Nomura’s Charlie McElligott’s “stress level” of 100 (consistent with “moderate” daily moves in the VIX over the next 30 days (normal is 80-100)).
1-Day VIX remained around the highest in a week at 12.2, consistent with traders implying a ~0.77% move in the SPX next session.

#WTI futures edged lower testing the uptrend line from the May lows as they continue to struggle with the 200-DMA resistance. The daily MACD remains in “sell longs” positioning but is close to turning more positive while the RSI fluctuates around 50.
#oott

Gold futures (/GC) edged back another ~half percent Tuesday. They remain around the bottom of the uptrend channel from January right on the 50-DMA. Daily MACD remains negative as noted two weeks ago but is very close to flipping positive, while the RSI fluctuates around 50.

Copper (/HG) futures had their third straight down session since spiking higher last week on the Trump tariff threat, now down -2.2%, but remaining well into record territory pre-last week.

Nat gas futures (/NG) continued to move higher after breaking out of the short-term falling wedge they’ve been trading in the past month, which as I noted “would commonly be associated with more good things to come for the bulls,” moving back over the 200-DMA, which as noted three weeks ago has for the most part held since last August.
Overall they remain in their range this year. Daily MACD and RSI tilt negative but are improving.

Bitcoin futures fell back -3.2% from record highs after crypto legislation failed to advance in Congress. The daily MACD and RSI remain positive, and the latter though going from over to under 70.

The Day Ahead
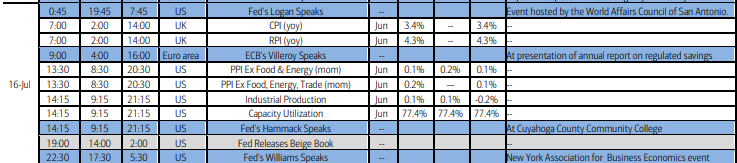
US economic data gives us our second piece to the PCE prices puzzle (the Fed’s preferred inflation gauge) with PPI. We’ll also get industrial production, which is our most wholistic look at the manufacturing side of the economy plus weekly mortgage applications and EIA petroleum inventories.
We’ll also get the Fed Beige Book ahead of the July FOMC meeting at the end of the month. And of course more Fed speakers ahead of the blackout. In terms of Fed Governors (generally considered more influential with 14-yr terms who vote every year) we’ll get Barr again. In terms of regional Fed Presidents (who serve 5-yr terms (up to 10 yrs) and vote on a rotating schedule (except the NY Fed Pres (Williams) who votes every year) we’ll get Hammack (again), Barkin (again), but most importantly Williams (who will be making an outlook speech which could give some clues as to how the center of the Fed is looking at things).
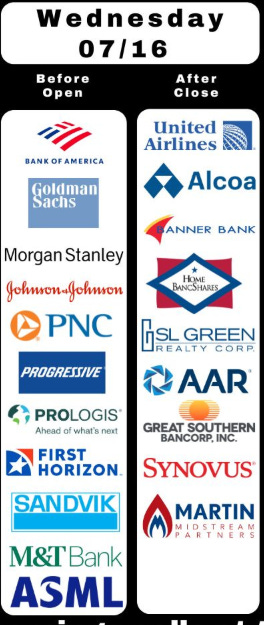
And 2Q earnings season will roll on with another 11 SPX reports (seven >$100bn in market cap (JNJ, BAC, ASML MS, GS, PGR, PLD (in order of market cap)). Not sure why BoA didn’t have ASML on their list.
Ex-US DM we’ll get UK CPI, among other reports.
In EM, we’ll get a policy decision from Indonesia, S Korea trade data


Link to X posts - Neil Sethi (@nelksethi) / X
To subscribe to these summaries, click below (it’s free!).
To invite others to check it out,