


Markets Update - 7/17/25
Update on US equity and bond markets, US economic reports, the Fed, and select commodities with charts!

To subscribe to these summaries, click below (it’s free!).
To invite others to check it out (sharing is caring!),
Link to posts - Neil Sethi (@neilksethi) / X
Note: links are to outside sources like Bloomberg, CNBC, etc., unless it specifically says they’re to the blog. Also please note that I do often add to or tweak items after first publishing, so it’s always safest to read it from the website where it will have any updates.
Finally, if you see an error (a chart or text wasn’t updated, etc.), PLEASE put a note in the comments section so I can fix it.
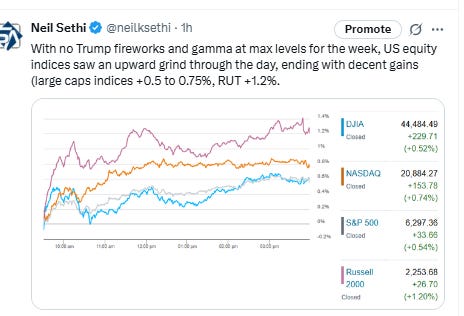
Major US equity indices started the day modestly higher (as they’ve been every session this week) after a stronger than expected retail sales report and lower than expected jobless claims and import prices. The market was also buoyed by a raise to sales guidance from contract chipmaker TSMC which confirmed AI spending remains solid. With no Trump fireworks and gamma at max levels for the week, US equity indices saw an upward grind through the day, ending with decent gains (large caps indices +0.5% to 0.75%, RUT +1.2%). It was enough though for new ATH’s for the SPX and Nasdaq.
Elsewhere, Treasury yields were little changed while the dollar pushed back to 3-wk highs. Crude was also higher, while gold, nat gas, and copper were modestly lower. Bitcoin was little changed.
The market-cap weighted S&P 500 (SPX) was +0.5%, the equal weighted S&P 500 index (SPXEW) +0.8%, Nasdaq Composite +0.8% (and the top 100 Nasdaq stocks (NDX) +0.8%), the SOX semiconductor index +0.7%, and the Russell 2000 (RUT) +1.2%.
Morningstar style box showed better gains Thurs across all styles again led by small caps.

Market commentary:
“The consumer came back to life in June after a weak performance in May,” said David Russell at TradeStation. “Other data like initial jobless claims and Philly Fed also painted the picture of a strong economy. While it’s good for growth overall, it makes it harder to justify interest rate cuts.” In such an environment, Russell says that could also help put a floor under the US dollar following a big selloff in the first half of the year.
“As long as the economy continues to expand and unemployment remains low, then people will continue to spend and the flywheel can keep generating higher profits, which is the engine for higher stock prices,” said Chris Zaccarelli at Northlight Asset Management.
“A reassuring retail sales result comes at the perfect time as earnings season kicks into gear,” said Bret Kenwell at eToro. “In the last earnings go-around, management reassured investors that consumer trends were solid through April and May. However, there was a worry that consumer spending was beginning to weaken after back-to-back declines in retail sales.” If earnings are more upbeat than expected and if management continues to tell a reassuring story about consumer spending, stocks could react favorably — even after a rally to record highs that some investors may view as overextended, Kenwell noted. “If tariffs start to weigh on consumer spending in the months ahead, that could present risks in the second half of the year,” he said. “For now though, consumers are still spending — and stocks can continue to rally, particularly if earnings reflect continued underlying strength in America’s largest engine: the consumer.”
To Neil Dutta at Renaissance Macro Research, while retail sales beat estimates, enthusiasm ought to be tempered somewhat given the pick-up in consumer goods prices over the month.
At Bloomberg Economics, Estelle Ou says that given price increases in several goods categories, it’s difficult to untangle whether most of the rebound is due to price increases or solid underlying demand. She thinks the former is more likely, given low business sentiment and signs of weakness in other discretionary services spending.
To Jamie Cox at Harris Financial Group, consumers seem to be over the tariff shock in April and are back at it with spending. “Now we just need to see if the Federal Reserve has enough inflation data to communicate more clearly that September will restart the rate cutting cycle,” he said.
Morgan Stanley’s Mike Wilson says he sees a bull market building in stocks. But first the S&P 500 may drop 5% to 10% this quarter as the impact of trade policies gets reflected on corporate balance sheets. He thinks the decline will be short lived, giving investors an attractive entry point to a rally driven by improving earnings expectations.
After Thursday's release of data showing lower-than-expected initial jobless claims for last week, some observers see reason to remain cautious about whether overall labor-market conditions can continue to hold up. "The uncertainty caused by trade policy and unknown specifics in the administration's deregulation effort, in addition to scars from previous bouts of inflation, are driving business and consumer sentiment lower," said Jefferies economist Thomas Simons and analyst Sam Saliba. In an email, they added: "We remain of the view that if higher tariffs result in weaker labor market conditions and declines in real income, higher inflation will not be sustainable ... Our base case remains that the damage in the labor market will be perceptible, but limited, and that the Fed will cut rates 3 times starting in September."
To Michael Green, chief strategist at Simplify Asset Management, Wednesday’s stock rebound indicates that the market may have already moved past Powell’s potential ousting. “The only real piece of information, I would argue, that you got today is that firing Powell is not that big of a deal,” he said to CNBC. Instead, Green said that at least in the near term, investors would likely continue to direct most of their attention toward upcoming earnings reports as the market’s most important catalyst. “I would be very surprised if we don’t get relatively positive reports out of the tech leaders. Not impossible, but surprised. Overall, that would suggest that the markets are going to experience some relief associated with earnings season not being as bad as people think,” Green said.


Link to posts - Neil Sethi (@neilksethi) / X for more details/access to charts.
In individual stock action:
PepsiCo shares jumped more than 7% on the back of better-than-expected earnings. United Airlines gained 3% after the airline beat earnings estimates.
Tech gained as a bullish outlook from Taiwan Semiconductor Manufacturing Co. bolstered confidence in artificial-intelligence spending. In late hours, Netflix Inc. reported strong earnings and raised its forecast.


Corporate Highlights from BBG:
United Airlines Holdings Inc. said the second half of the year has become more predictable and suggested it may be able to beat its earnings targets.
International growth helped buoy PepsiCo Inc.’s second quarter earnings, as the snacks and beverage giant said it plans to lean into higher-protein offerings and smaller portion sizes.
Amazon.com Inc. is cutting jobs in its cloud-computing division, the latest big tech company to pare its headcount amid rising costs for artificial intelligence.
T. Rowe Price Group Inc. is making a business-wide round of job cuts as the Baltimore-based asset manager grapples with outflows and other pressures.
General Electric Co. boosted its full-year financial guidance and topped Wall Street’s profit estimates for the second quarter after rebounding demand in the aviation market softened the impact of a global trade war.
Chevron Corp. is on the cusp of reaching a production plateau in the largest US oil field, allowing it to reap billions of dollars of additional cash flow in the next few years.
Meta Platforms Inc. investors say they have reached a settlement with current and former directors at the company to end a multibillion-dollar case in Delaware.
Uber Technologies Inc. is teaming up with electric vehicle maker Lucid Group Inc. and self-driving tech startup Nuro Inc. to launch a robotaxi fleet.
Waymo is more than doubling its service territory in Austin as the driverless taxi firm looks to fend off competition from Tesla Inc.
U.S. Bancorp reported net interest income that missed estimates in the first earnings report under new Chief Executive Officer Gunjan Kedia.
ManpowerGroup Inc. posted quarterly profit and revenue that beat estimates and indicated the global labor market is stabilizing.
Elevance Health Inc. cut its profit guidance for the year on higher medical costs in Affordable Care Act plans and lagging reimbursement from Medicaid, the latest in a series of disappointments from health insurers in recent months.
Roblox Corp. is adding new safety features, including an age-estimation tool that relies on video selfies, in an effort to better protect its kid-heavy user base.
Abbott Laboratories shares sank after the company lowered the top end of its full-year guidance.
Some tickers making moves at mid-day from CNBC:

In US economic data:
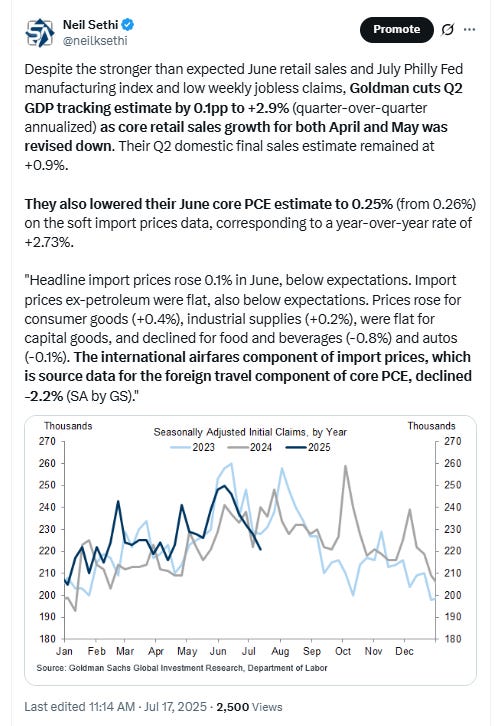
Initial jobless claims (SA) continue to remain tame in wk through July 12th edging back another -7k to 221k now down -29k from the highest level since October hit four weeks ago, overall remaining in the range over the past yr, just +34k above the 50-yr lows in Oct '23 (187k). Four-wk moving avg edges -6k to 230k (-4k y/y), down -15k from the highest since Aug ‘23 from three weeks ago. This is consistent with the note 5 weeks ago that there have been modest moves higher in initial claims in early summer the past two years which eventually subsided. Continuing claims (SA) in wk through July 5th (1-wk lagged) though remained the highest since Nov ‘21 at 1.956mn +2k w/w (after a -12k revision to the prior week), remaining over the 1.8-1.9mn range it had been in since June for a 6th week. The 4wk moving avg up +5k to 1.958mn, also the highest since Nov ‘21, +100k y/y, evidencing that while layoffs have remained very low, workers are having a little harder time finding a new job.
June retail sales come in much stronger than expected +0.64% m/m (after -0.87% in May which was the most since Mar ‘23) on a broad advance led by a rebound in auto sales to +1.2% from a -3.8% drop in May. Gasoline stations came in flat, the first non-negative number since Jan. Stripping those out though still saw core sales very healthy at +0.55% above expectations for +0.3% and up from -0.047% in May led by increases in building material/garden +0.9%, apparel +0.9%, grocery +0.5%, health care +0.5%, gen merch +0.5%, “misc” +1.8%, and bars/restaurants, the only services category which rebounded to +0.6% from -0.1% in May. Online sales, a large component, were +0.4%.
June import prices (Note: these prices do NOT include tariffs) come in cooler than expected (blue lines) at +0.07% vs +0.3% exp’d (but up from -0.42% in May (revised from a flat read)) with both months pulled lower by falling fuel prices (-0.7% in June and -5.0% in May). Still, ex-fuel prices (green lines) were subdued at +0.08% in June after a flat read (0.00%) in May (revised down from +0.31%), perhaps some evidence that tariffs are at least preventing prices from rising even if they’re not falling.
July #NAHB homebuilder sentiment after falling in June to the least since Dec ‘22 edges up one point to 33 as expected, remaining (well) below the 50 dividing line b/w poor/good conditions for a 15th month as “[t]he passage of the One Big Beautiful Bill Act provided a number of important wins for households, home builders and small businesses” said NAHB Chairman Buddy Hughes , a home builder and developer from Lexington, N.C.


Link to posts for more details/access to charts (all free) - Neil Sethi (@neilksethi) / X
The SPX pushed over the 6300 level to an ATH, but overall continues to trade mostly sideways over the past 10 sessions. Its daily MACD and RSI are neutral.

The Nasdaq Composite a similar but little more favorable picture.

RSI most overbought since last July.

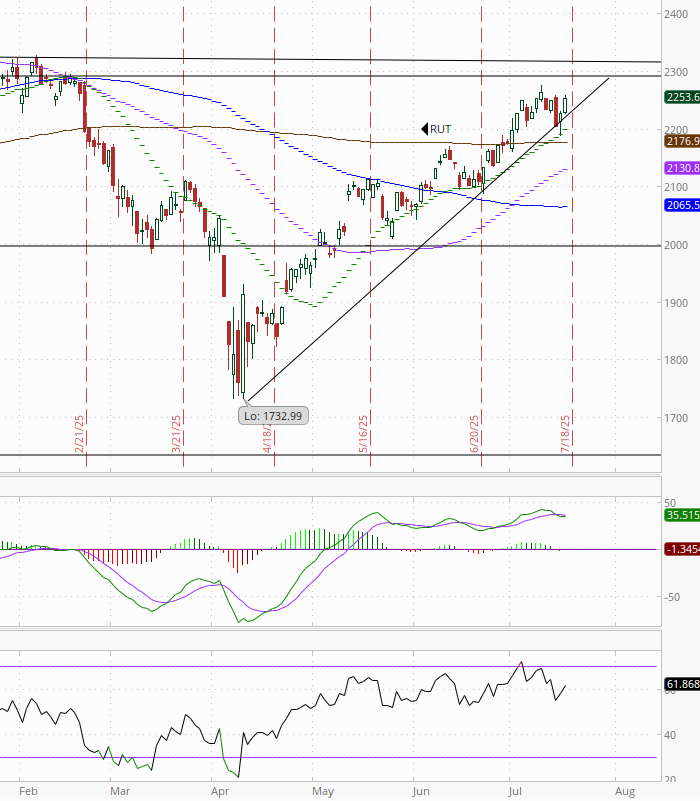
RUT’s (Russell 2000) “clear path to move at least to the 2300 level” per my note three weeks ago which had gone from “gotten choppy,” as I noted Friday, to “in jeopardy” as I noted Tuesday looked back on track Thursday although it’s now less than 50 pts from that 2300 target. Daily MACD is relatively neutral while the RSI still tilts a bit negative.

Sector breadth from CME Cash Indices remained solid improving to 9 of 11 sectors in the green (from eight Wed and just one Tues, the worst in weeks), although none up over 1% (vs two Wed). One sector down that much (Health Care).
Styles were dispersed although Comm Services and Cons Discr were in the bottom four for a second day.

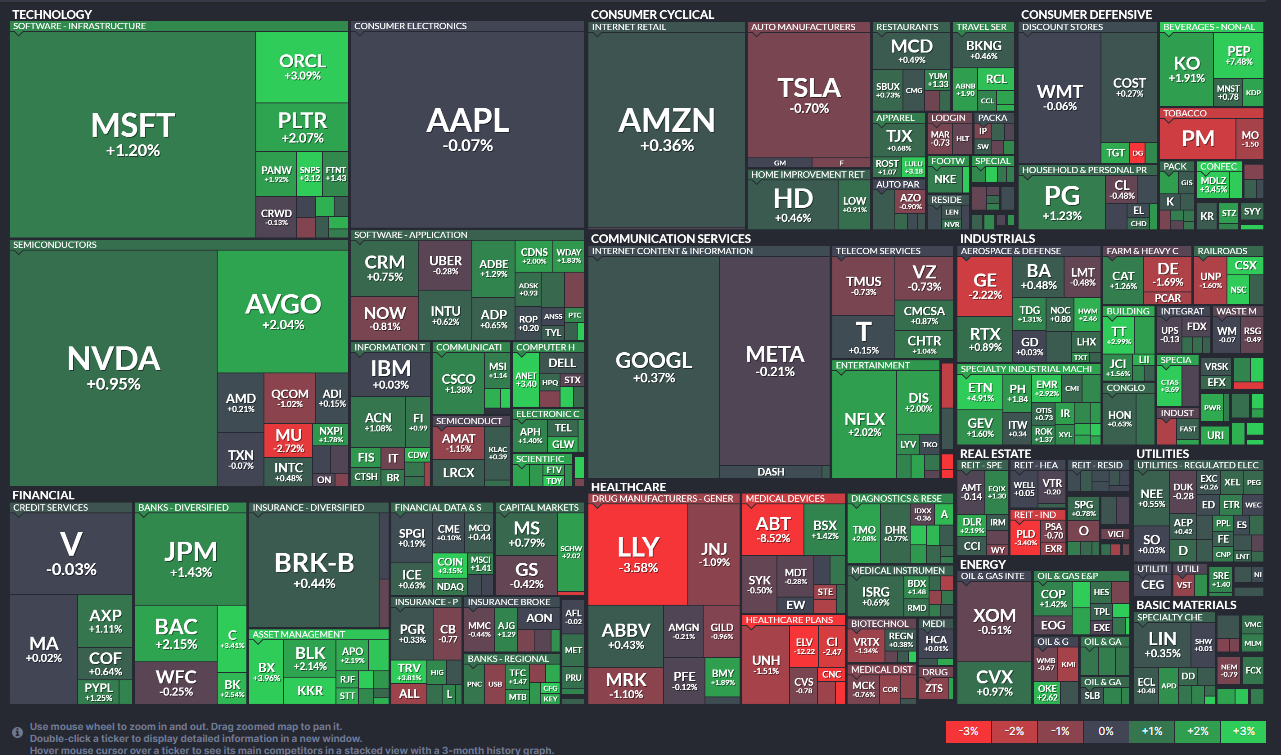
SPX stock-by-stock flag from @FINVIZ_com relatively consistent with again a lot more green than red, and a lot more up over up over 3% today (45 vs 12 Wed). Some notables were PEP (best day since pandemic), ETN, HSY, ANET, a number of asset managers (for a second day), and a number of E&P companies.
Fewer stocks down that much but there were nine in the SPX (same as Wed), with notable weakness in some health care stocks (ELV -12%, ABT -8.5%, MOH -5.5%, CNC -4.2%, LLY -3.6%).
NYSE positive volume (percent of total volume that was in advancing stocks), which had been relatively strong the last couple of weeks but weaker since Friday, improved Thurs to 69.7%. A very good result for the +0.51% gain in the index. Compare that to Wed when it was 61.2% on a slightly larger gain of +0.55% (circle).

Nasdaq positive volume also good and remaining more elevated than the NYSE at 74.1%, but that was actually a touch below 75.5% Wed despite a larger gain Thurs (+0.74% vs +0.25%).
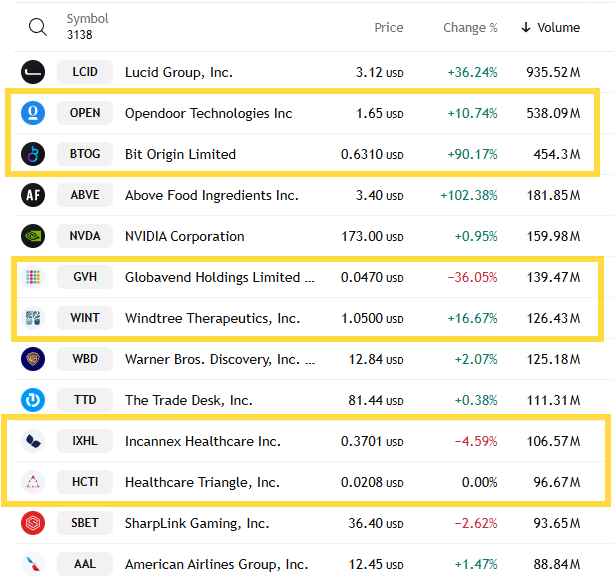
At least in part that was due to penny stock volumes (which I treat as sub $2) while remaining elevated falling to the lows of the week, accounting for just 6 of the top 13 stocks by volume (down from 7 Wed & Tuesday, 9 Monday and 12 Friday) while the total volume in those stocks came in at 1.46bn or 14.6% of total Nasdaq volume down from 17.6% Wed and 16% Monday (around the 14% Tuesday).

Positive issues (percent of stocks trading higher for the day) were a little weaker at 66 & 68% respectively.
New 52-wk highs minus new 52-wk lows (red-black dotted lines) saw notable improvement from 1-mth lows with the NYSE up to 88 from just 8 while the Nasdaq improved to 192 from 49. Still they remain under the highs of the year hit two weeks ago.


Following the better than expected retail sales and relatively hawkish speech from Gov Kugler, #FOMC rate cut pricing for 2025 fell to the least since February -3bps to 43bps according to CME’s #Fedwatch tool (down from 64bps July 2nd before the June NFP & from 92bps on May 1st (the peak this year was at 103bps on Apr 8th, the low was 36bps Feb 11th)).
The probability of a cut at the July meeting is 3% down from 23% pre-NFP (and from 78% at the start of May) while a cut by the following meeting (Sept) fell to just 54% (so edging closer to a coin flip) the lowest since February from 94% pre-NFP.
Chances of 2 cuts this year is 61% (down from 90% pre-NFP and also the lowest since February), three is 19% (down from 55%), and four is 0.5% (from 10%). The chance of no cuts low at 7.6% but still up from 0.6% pre-NFP (almost to the highest since February).
2026 cuts also -2bps to 71bps, seeing total cuts through Dec '26 at 114bps, still up from the least since February (108) hit last week but -29bps from the start of May.
I said after the big pricing out of cuts in January (and again in February) that the market had pivoted too aggressively away from cuts, and that I continued to think cuts were more likely than no cuts, and as I said when they hit 60 bps “I think we’re getting back to fairly priced (and at 80 “maybe actually going a little too far” which is back to where we probably were Apr 20th (a little too far) at 102bps). Seems like we’re getting back to “fairly priced,” and as of May 14th at 48bps perhaps starting to go a little too far in the other direction, but as I’ve said all year “It’s a long time until December.”
Also remember that these are the construct of probabilities. While some are bets on exactly two, three, or four cuts much of it is bets on a lot of cuts (5+) or just one or none.


10yr #UST yields again tested the 4.5% target/resistance but closed unchanged at 4.46%.


The 2yr yield, more sensitive to #FOMC policy, +2bps to 3.91%. It is -42bps below the Fed Funds midpoint, so still calling for rate cuts but also up +19bps this month.
I had said when it was around 4.35% (in Jan & again early Feb) that I found the 2-yr trading rich as it was reflecting as much or more chance of rate hikes as cuts while I thought it was too early to take rate cuts off the table (and too early to put hikes in the next two years on), but then the 2yr fell to 3.65% past where I thought we’d see it, so I took some exposure off there. We got back there but I never added back what I sold, so I stuck tight. Ian Lygan of BMO saw it going to 3.5% by year’s end before all this tariff business but now thinks it’s at fair value at around 3.75% so I took some more off at the end of June.

DXY dollar index (which as a reminder is very euro heavy (over 50%) and not trade weighted) up for the 5th day in 6 (and 10th in 12) but again couldn’t get over the 50-DMA/$99 level.
The daily MACD as noted last Monday crossed over to “cover shorts” while the RSI is just off the highest in nearly two months and over 50 after having moved from under to over 30, which can be a signal of a reversal of a downtrend, “so it’s got a lot of boxes checked for a move higher,” as I noted Monday. We’ll see if it can get through Friday.

VIX remained right around 16 for the 16th straight session at 16.5 The current level is consistent w/~1.03% average daily moves in the SPX over the next 30 days.

Remember, though, we’re in a seasonally strong period for the VIX. Chart from July 9th.

The VVIX (VIX of the VIX) like the VIX remained in the area it’s traded in the past 16 sessions at 92.9, still under Nomura’s Charlie McElligott’s “stress level” of 100 (consistent with “moderate” daily moves in the VIX over the next 30 days (normal is 80-100)).

1-Day VIX edged to the lowest close in a week at 10.8, consistent with traders implying a ~0.67% move in the SPX next session.

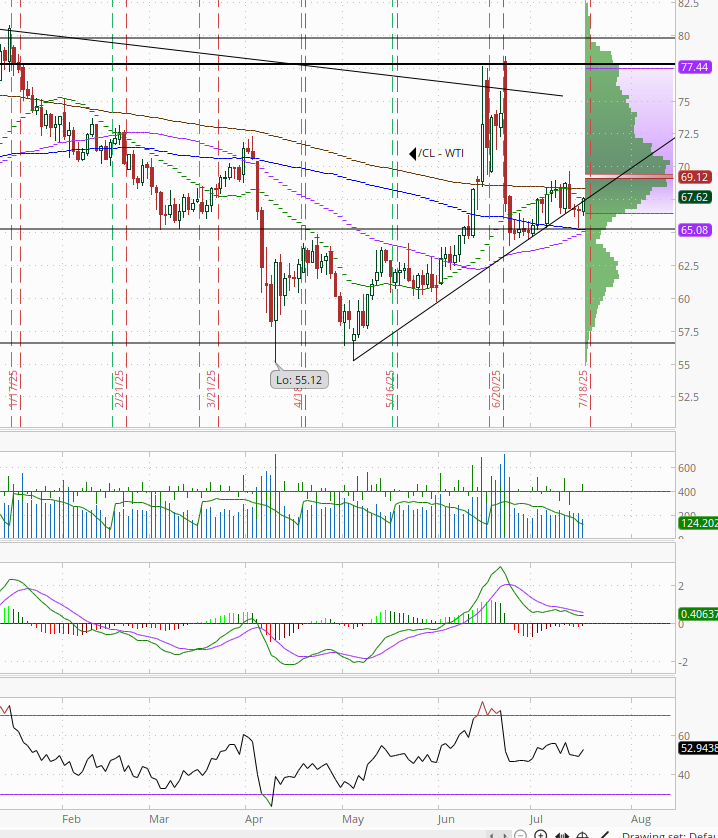
#WTI futures rebounded for a small gain but remained under the uptrend line from the May lows. As noted Wed they’ll have to get through that before they can try again at the 200-DMA resistance they spent a week trying to clear. The daily MACD remains in “sell longs” positioning while the RSI fluctuates around 50.
#oott
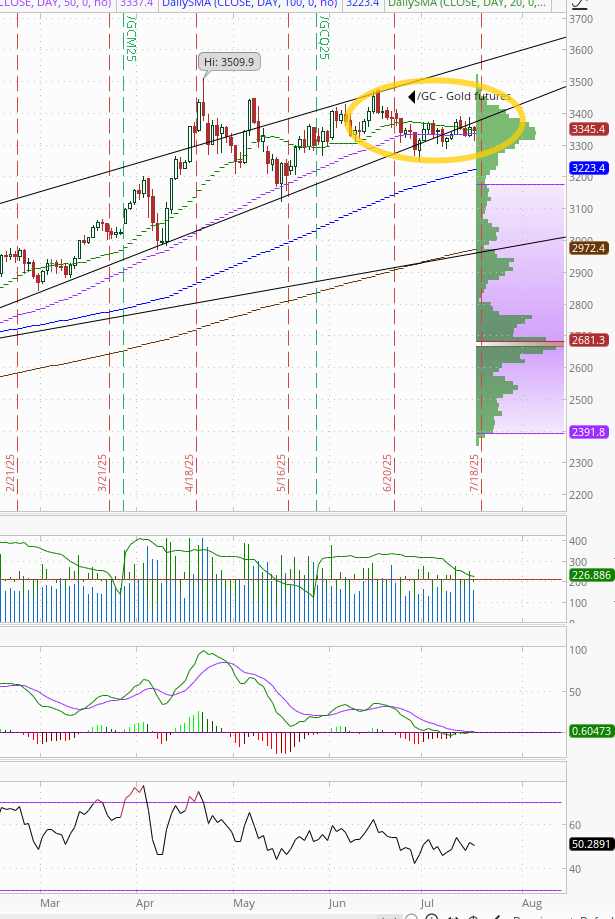
Gold futures (/GC) little changed as they continued to drift in the same range over the past three weeks. They remain around the bottom of the uptrend channel from January right on the 50-DMA. Daily MACD remains negative as noted two weeks ago but is very close to flipping positive, while the RSI fluctuates around 50.
Copper (/HG) futures little changed for a third session as they form a wedge pattern that’s gotten very narrow since spiking higher last week on the Trump tariff threat. We’ll see which way it breaks (RSI would say lower).

Nat gas futures (/NG) paused their small run higher after breaking out of the short-term falling wedge they’d been trading in the past month, which as I noted “would commonly be associated with more good things to come for the bulls,” but now back over the 200-DMA, which as noted three weeks ago has for the most part held since last August. We’ll see if it has any more gas in the tank (no pun intended).
Overall they remain in their range this year. Daily MACD and RSI have also turned more positive.

Bitcoin futures little changed perhaps too late in the day to react to Congress passing the stablecoin legislation (or perhaps sell the news?) but seem to be forming a flag pattern not unlike what we say during their climb back in April/May. The daily MACD and RSI remain positive, the latter though going from over to under 70.

The Day Ahead
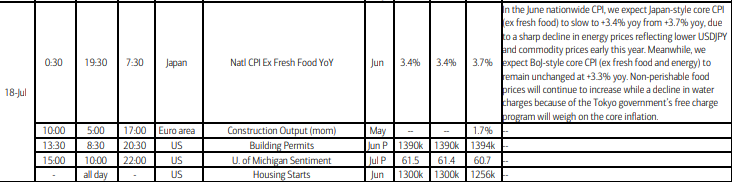
US economic data Friday gives us a final (smaller) piece to our economic puzzle this week with the June housing starts and permits report. We’ll also get UMich July preliminary consumer sentiment.
And it looks like we’ll enter the Fed blackout with Gov Waller getting the last word tonight at 6.30 ET.
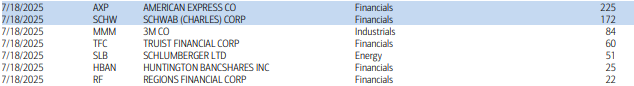
And it may be a summer Friday, but we’ll still get some earnings of note with another 7 SPX reports (two >$100bn in market cap (AXP, SCHW (in order of market cap)).
Ex-US DM we’ll get Japan CPI among other reports.
In EM, no reports or central bank decisions of note.


Link to X posts - Neil Sethi (@nelksethi) / X
To subscribe to these summaries, click below (it’s free!).
To invite others to check it out,