


Markets Update - 7/31/25
Update on US equity and bond markets, US economic reports, the Fed, and select commodities with charts!

To subscribe to these summaries, click below (it’s free!).
To invite others to check it out (sharing is caring!),
Link to posts - Neil Sethi (@neilksethi) / X
Note: links are to outside sources like Bloomberg, CNBC, etc., unless it specifically says they’re to the blog. Also please note that I do often add to or tweak items after first publishing, so it’s always safest to read it from the website where it will have any updates.
Finally, if you see an error (a chart or text wasn’t updated, etc.), PLEASE put a note in the comments section so I can fix it.
Major US equity indices deviated from their pattern over the past couple of weeks of a modestly higher indicated open with today large caps seeing stronger gains than we’d been seeing on the back of the strong earnings reports from MSFT & META (as well as a number of other names), but small caps lower. It also came on the heels of another round of economic data which came in mostly as expected. But all steadily deteriorated as the day wore on with rally attempts sold, finishing near the lows although all down less than -1%. Despite the down day, they all finished higher for the month, the third straight for the SPX.
Elsewhere, Treasury yields edged higher as did the dollar. Gold and nat gas saw mild gains while crude, bitcoin, and copper were all lower.
The market-cap weighted S&P 500 (SPX) was -0.4%, the equal weighted S&P 500 index (SPXEW) -0.9%, Nasdaq Composite -0.03% (and the top 100 Nasdaq stocks (NDX) -0.6%), the SOX semiconductor index -3.1%, and the Russell 2000 (RUT) -0.9%.


Morningstar style box all varying degrees of red.

Market commentary:
“This rally is certainly due for a pause or a pullback, but any declines will likely be shallow and short-lived,” said Chris Murphy, co-head of derivatives strategy at Susquehanna.
“While we expect equities to advance over the next 12 months, investors should be mindful of potential market swings in the coming weeks,” said Mark Haefele at UBS Global Wealth Management. “We think capital preservation or phasing-in strategies can be effective in navigating near-term volatility.”
“There’s a lot of good news priced in, so I think little things on the margin can have a bigger impact when you’ve had such a run, like slightly hawkish comments in the FOMC presser,” Mayfield said to CNBC. “Sentiment has shifted back to a pretty bullish tenor, and I think the market needs to consolidate and take a breather, and it’ll grab on to whatever it needs to as an excuse.”
“These market reactions—despite strong earnings, capex, and buyback activity —are becoming increasingly difficult to justify,” said Joseph Cusick, senior vice president and portfolio manager at Calamos Investments. “At the same time, downside moves have been relatively contained.”
“Weaker consumer spending and an upturn in goods prices due to tariffs could further complicate Fed policy,” Sal Guatieri, senior economist at BMO Capital Markets, said in a note. “We will need to see either calmer inflation figures or weaker growth/softer job conditions to spur a rate cut on September 17.”
“Inflation remains sticky and justifies the Fed’s decision to keep interest rates unchanged at Wednesday’s meeting,” said Clark Bellin at Bellwether Wealth. “The stock market doesn’t need rate cuts in order to move higher and has already posted strong gains so far this year without any rate cuts.”
"Economists had anticipated a rise in year-over-year inflation — and not only did it materialize, but this month’s PCE data also exceeded expectations. Core PCE climbed to its highest level since February, while last month’s figures were revised slightly higher, which may lend support to the Fed’s current wait-and-see approach," Kenwell said. However, the data didn't have much of an impact on markets, even as futures traders continued to dial back the expected probability of a Federal Reserve interest-rate cut in September. There's probably a good reason for that, Kenwell said. "Rate cuts are nice, but they are not necessary for U.S. stocks to continue higher. Instead, earnings continue to drive the narrative — and today that narrative is focused on Microsoft and Meta’s results — while forward expectations for S&P 500 earnings are back to record highs."
“We expected the FOMC meeting outcome to be hawkish, and Chair Powell did not disappoint,” Anshul Pradhan, head of US rates strategy at Barclays, wrote in a note with colleagues. The bank has argued “for some time” that the market should put more weight on a later start for cuts and expects a move only in December.
Rather than seeing any specific drivers for this bout of late-morning stock-market weakness, Nationwide's Mark Hackett told MarketWatch that investors were simply taking a breather following a rapid comeback rally. "We've had the run, and now you just need to take a breath," Hackett told MarketWatch in a phone interview on Thursday. "When the market starts high and fades throughout the day, that is an indication that there is a little bit of exhaustion in the market." He also pointed out that, if one excludes the contribution from Microsoft and Meta, Thursday has actually been a pretty lousy day for stocks. This morning's PCE Price Index, which reflected a slightly stronger whiff of inflation, likely didn't help. "I think we're on track for a bit of a pullback here," Hackett added.
The U.S. stock market can keep climbing on the back of the latest economic data, technology companies’ earnings and a potential lowering of interest rates by the Federal Reserve later this year, according to Chris Zaccarelli, chief investment officer at Northlight Asset Management. “Boom times are back — at least for now — as GDP is running at 3%, unemployment is low and inflation remains in check,” Zaccarelli said in emailed comments Thursday. He described the Fed as having “a bias to cut rates,” despite being on hold, and pointed to “tech firms blowing out their earnings reports.” But Zaccarelli also expressed concern over valuations in the stock market and cautioned that the full impacts of tariffs on the economy are still ahead. “We are priced for perfection as they say, and that is a risk, but one that will likely be ignored by the market as long as corporate profits are still growing,” he said. On the economic front, “the situation is very fluid and we have yet to see the full impact of tariffs flowing through to inflation.”


Link to posts - Neil Sethi (@neilksethi) / X for more details/access to charts.
In individual stock action:
“Magnificent Seven” titans Microsoft and Meta respectively rose about 4% and 11% on the back of better-than-expected quarterly earnings. Software giant Microsoft said that annual revenue from its cloud computing service Azure exceeded $75 billion. Meta issued an upbeat third-quarter sales outlook, surpassing the Street’s estimates. Microsoft’s strong earnings print propelled the company to a $4 trillion market capitalization.
In late hours, Apple Inc. reported sales that beat estimates. Amazon.com Inc.’s outlook underwhelmed traders.


Companies making the biggest moves after-hours from CNBC.

Corporate Highlights from BBG:
Alphabet Inc.’s Google lost its appeal of a judge’s order requiring an overhaul of the technology giant’s app store policies in an antitrust case filed by Fortnite-maker Epic Games Inc.
The Swedish telecom equipment maker Ericsson AB is in talks to invest hundreds of millions of dollars in Intel Corp.’s networking infrastructure business, according to people familiar with the matter.
Boeing Co. has offered a new contract to the union representing some 3,200 factory workers in the St. Louis area, including the same 20% raise that members resoundingly rejected in an earlier deal while voting to strike.
Figma Inc. shares jumped 250% in their public debut after the design software maker and some of its shareholders raised $1.2 billion in an IPO, with the trading valuing the company far above the $20 billion mark it would have reached in a now-scrapped merger with Adobe Inc.
Days before a new ownership team takes control of the company, Paramount Global reported second-quarter earnings that beat analysts’ estimates, crediting lower costs and growth in streaming profit.
Coinbase Global Inc., the largest US crypto exchange, reported lower-than-forecast second-quarter revenue amid a drop in digital-asset market volatility.
Illumina Inc. raised its financial guidance for the year, driven by faster growth from labs and medical centers that use its DNA sequencing machines to diagnose diseases.
A judge in California ordered Phillips 66 to pay an additional $195 million in punitive damages on top of an earlier $604.9 million trade secret theft verdict for what he called “reprehensible” conduct that nearly destroyed a much smaller fuel company.
Mastercard Inc. reported earnings that topped analysts’ estimates and gave a more optimistic forecast for this year’s revenue on continued momentum in consumer spending.
Moderna Inc. is cutting about 10% of its workforce, part of an effort by the struggling biotech company to reduce spending as sales of its Covid vaccine decline.
Bristol Myers Squibb Co. slid as investors questioned whether the drugmaker has done enough to spur future sales growth in the face of an aging drug portfolio, even after lifting its full-year guidance and beating Wall Street’s quarterly sales and profit estimates.
A trial of Eli Lilly & Co.’s blockbuster diabetes drug Mounjaro fell short of expectations that it would do a better job of preventing heart attacks and strokes than its older medicine Trulicity.
Biogen Inc. raised its full-year financial guidance as growing sales of its Alzheimer’s drug helped the biotech company beat Wall Street’s expectations.
CVS Health Corp. raised its 2025 profit guidance on strong results in its health insurance and pharmacy businesses, an encouraging sign after a spate of missteps by rival insurers.
Some tickers making moves at mid-day from CNBC:

In US economic data:
Initial jobless claims (SA) continue to remain tame in wk through July 26th edging up +1k from a 3-mth low to 218k, overall remaining in the range over the past yr, just +31k above the 50-yr lows in Oct '23 (187k). Four-wk moving avg edges -3.5k to 221k (-14.5k y/y), down -34.5k from the highest since Aug ‘23 hit five weeks ago. This is consistent with the note 7 weeks ago that there have been modest moves higher in initial claims in early summer the past two years which eventually subsided. Continuing claims (SA) in wk through July 19th (1-wk lagged) though remained near the highest since Nov ‘21 at 1.946mn (highest was 1.964mn June 14th) unch w/w (after a -9k revision to the prior week). The 4wk moving avg -2.5k to 1.949mn, asing off the highest since Nov ‘21, +87k y/y, evidencing that while layoffs have remained very low, workers are having a little harder time finding a new job (although the y/y number has been easing the past couple of months).
Personal income, after falling in May (-0.4%) m/m for the first time since Sep ‘21 on a large drop in gov’t transfer payments (due to social security payments being cut from the Social Security Fairness Act), improved in June rising +0.3% but while May was penalized by transfer payments, June was boosted by them +1.0%. That masked weakness elsewhere, particularly wages which decelerated to +0.1%, the least in a year. Compensation came in at +0.2% (boosted by “supplements) still at +0.17% unrounded it was also the least since July ‘24. No category other than transfer payments was over +0.2%. That said on a y/y basis compensation came in at +4.93%, the best of the year continuing to rebound from the 4-year low in March.
June PCE prices came in as expected at the headline level m/m at +0.3% (although a “cool” +0.3% at +0.28%) up from a cool +0.2% in May (+0.16%) but a tenth hot y/y at 2.6% (2.58%) (up from 2.4% (2.42%) in May (revised up a tenth)), while core also came in at +0.3% (but even a “cooler” one at +0.26%) as expected up from +0.21% in May (revised from +0.18%) while the y/y also came in a tenth hot at 2.8% (2.79%) which matched an upwardly revised May (revised to 2.76%).


Link to posts for more details/access to charts (all free) - Neil Sethi (@neilksethi) / X
The SPX fell to the lowest in a week just above the 20-DMA. Its daily MACD and RSI are starting to slip more negative.

SPX monthly looks pretty good with the MACD crossing back over to “go long”.

The Nasdaq Composite a similar picture although a bit stronger.

Monthly chart is similar as well.

RUT’s (Russell 2000) chart continues to deteriorate having lost the uptrend line from the April lows, “increasing the chances of a longer consolidation” as I noted Tuesday. Daily MACD and RSI continue to soften.

Monthly chart not as strong.

Sector breadth from CME Cash Indices deteriorated to just two green sectors (down from three Wed, four Tues) although one was up over 1% (in fact Comm Services was up over 2% on the back of META’s 11% gain). Two sectors down more than -1% and Health Care was down nearly -3% taking back to May levels. Tech wasn’t able to make it into the green despite a +4% day from MSFT.

SPX stock-by-stock flag from FINVIZ_com consistent tilted even more red today.
51 SPX components down more than -3% today (vs 39 Wed, 11 Tues, 12 Mon, 7 Fri) with five down more than -10% (and two down more than -20%) led by ALGN -37%(!). The others were BAX, IP, CI, EXR. Largest stocks down >-3% were TSLA, UNH (again), MRK, NOW, PEP, ISRG, QCOM, TXN, DHR, AMAT, KLAC, LRCX, PANW (again), MU, SBUX (all >$100bm in market cap).
21 SPX components were up over 3% (up from 15 Wed, 11 Tues, & 9 Mon but down from 25 Fri, 24 last Thurs, 44 last Wed & 65 last Tues). And five were up over 10% today in EBAY, CHRW, META, XUL, WDC. META clearly the largest up over 3%.

NYSE positive volume (percent of total volume that was in advancing stocks) remained weak although did improve to 31.2%, up from 27.3% Wed even with the index down a larger -0.84% (vs -0.63% Wed).

Nasdaq positive volume though fell back to 35.3%, the least since June 17th and very weak considering the basically flat (-0.03%) index performance. Compare to Tues when it was 38.8% on a much bigger -0.38% loss.
Given that discrepancy you might think perhaps the meme/sub-$2 stock volumes have continued to slow, and you’d be right as they eased back for a sixth session.
In total again 9 of the top 15 stocks by volume were in that category but the total volume in those stocks down to 2.1bn from 2.4bn Wed, 2.8bn Tues, 3.7bn Mon, 4.5bn Fri and 5.5bn Thurs and accounting for 20.7% of total Nasdaq volume down from 26.3% Wed, 27.2% Tuesday, 35.1% Monday, 40.2% Friday & 43.8% Thurs, and the least since the 13.2% July 18th.
Meme stock Opendoor $OPEN now down to 109mn shares traded half of Tuesday and a small fraction of the 1.86bn on July 21st). So as noted Monday “while the penny/meme stock action continues, maybe it is on the way back down after spiking last week.”


Positive issues (percent of stocks trading higher for the day) not as inflated by the penny stock volume were mixed lower on the Nasdaq at 32%, better on the NYSE at 39%.
New 52-wk highs minus new 52-wk lows (red-black dotted lines) edged lower for a fifth day on the NYSE after hitting the second best level of the year on both exchanges last week at 28 while the the Nasdaq edged up to 41 from a 1-mth low.


#FOMC rate cut pricing for 2025 continued to wither falling another -5bps (so now down -13bps the past two days or a half of a cut) to 35bps now the least of the year according to CME’s #Fedwatch tool (down from 64bps (so over one full cut) since the start of the month & from 92bps (so two full cuts) on May 1st (the peak this year was at 103bps on Apr 8th)).
A Sept cut is now down to 39% (from 66% pre-FOMC, it was 94% at the start of the month). Chances of 2 cuts this year is 41% (down from 62% pre-FOMC, 90% at the start of the month), three is 8% (which is Goldman’s current call and down from 55% at the start of the month). The chance of no cuts now up to 17%, the highest since Feb, and up from 0.6% at the start of the month.
But pricing for 2026 cuts jumped +14bps to 86bps, but I have a feeling that will normalize back tomorrow as the December ‘26 contract has not been the most stable at times. If that was correct, total cuts through Dec '26 would be 118bps, down -28bps from the start of May (meaning cuts have in part just been shifted into 2026).
I said after the big pricing out of cuts in January (and again in February) that the market had pivoted too aggressively away from cuts, and that I continued to think cuts were more likely than no cuts, and as I said when they hit 60 bps “I think we’re getting back to fairly priced (and at 80 “maybe actually going a little too far” which is definitely where we were Apr 20th (a little too far) at 102bps). Now it seems like we’re perhaps getting back to too few cuts. But as I’ve said all year “It’s a long time until December.”
Also remember that these are the construct of probabilities. While some are bets on exactly two, three, or four cuts much of it is bets on a lot of cuts (5+) or just one or none.


10yr #UST yields up +1bps to 4.36%, overall remaining in the middle of the range since last November.

The 2yr yield, more sensitive to #FOMC policy was +2bps to 3.96% also in the middle of the range since November but now at a 1-mth high. It is -37bps below the Fed Funds midpoint, so still calling for rate cuts.
I had said when it was around 4.35% (in Jan & again early Feb) that I found the 2-yr trading rich as it was reflecting as much or more chance of rate hikes as cuts while I thought it was too early to take rate cuts off the table (and too early to put hikes in the next two years on), but then the 2yr fell to 3.65% past where I thought we’d see it, so I took some exposure off there. We got back there but I never added back what I sold, so I stuck tight. Ian Lygan of BMO saw it going to 3.5% by year’s end before all this tariff business but now thinks it’s at fair value at around 3.75% so I took some more off at the end of June.

DXY dollar index (which as a reminder is very euro heavy (over 50%) and not trade weighted) outdid Monday for the best day since May, its 6th straight gain, now up 3% in that time and now just over the 100 level, the highest close since May 16th. The daily MACD and RSI are supportive with the latter the highest of the year. I had thought we’d see it run if it broke 100, but so far not doing that.


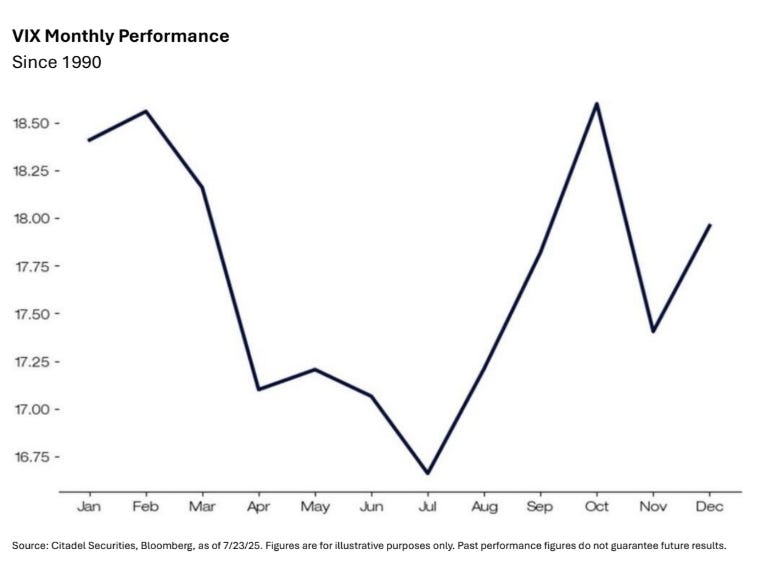
VIX remained right around 16 for the 26th straight session but back over that level. The current level is consistent w/~1.04% average daily moves in the SPX over the next 30 days.

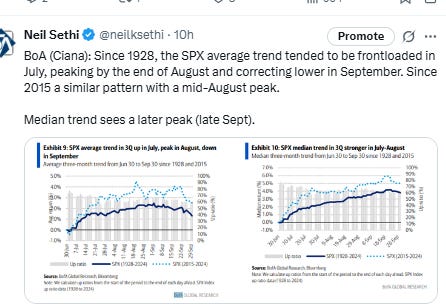
Remember, though, we’re in a seasonally strong period for the VIX. Chart from July 9th.

The VVIX (VIX of the VIX) like the VIX remained in the area it’s traded in the past 26 sessions at 98, but unlike the VIX hadn’t fallen to the lows of that period last week and is closer to the highs, still though under Nomura’s Charlie McElligott’s “stress level” of 100 (consistent with “moderate” daily moves in the VIX over the next 30 days (normal is 80-100)). It’s also maintained the uptrend line from the March lows.

With arguably the most important day of the week tomorrow between the Aug 1st tariff deadline (although that has been significantly derisked) and the bevy of economic data headlined by NFP, 1-Day VIX moved to the highest close since the start of the month at 16.8, consistent with traders implying a ~1.05% move in the SPX next session.

#WTI futures disappointingly not able to build on their +7.7% three session run, instead falling back -1.3%. The daily MACD remains in "go long" positioning, and the RSI remains over 50, “so it has some nice technical momentum” as noted Tuesday.
#oott

Gold futures (/GC) higher but remain in the wedge they’ve been in since May. The MACD remains in a neutral positioning and the RSI fluctuates around 50.

US copper futures (/HG) fell another -4.3% taking the two day drop to over -22% now under the $4.50 level at the lowest close since April 10th.

Nat gas futures (/NG) again able to hold the the key $3 level despite a weak storage report remaining near the bottom of their range since November. Daily MACD and RSI remain negative the latter just off the least since April.


Bitcoin futures remain in their flag pattern not unlike what we saw during their climb back in April/May. The daily MACD and RSI are neutral but starting to tilt more negative.

The Day Ahead
The firehose of US economic data culminates Friday with out busiest day of the week with a packed schedule of NonFarm Payrolls (some expectations are below), manufacturing PMIs, UMich final July consumer sentiment, construction spending, and vehicle sales.
No Fed speakers on the calendar, but as I noted yesterday I’d be very surprised if you don’t hear from any Friday.
The crush of earnings eases off though (we’re on the downslope now in terms of market cap) with 15 SPX reporters of which three are >$100bn in market cap in XOM, CVX, & LIN (from largest to smallest).
Ex-US DM highlighted by final July manufacturing PMIs. We’ll also get EU July CPI among other reports.
In EM, highlights are also manufacturing PMIs, South Korea exports, Brazil industrial production, and Mexico economist survey among other reports.


Link to X posts - Neil Sethi (@nelksethi) / X
To subscribe to these summaries, click below (it’s free!).
To invite others to check it out,