


Markets Update - 7/3/25 (w/July 4th update)
Update on US equity and bond markets, US economic reports, the Fed, and select commodities with charts!

To subscribe to these summaries, click below (it’s free!).
To invite others to check it out (sharing is caring!),
Link to posts - Neil Sethi (@neilksethi) / X
Note: links are to outside sources like Bloomberg, CNBC, etc., unless it specifically says they’re to the blog. Also please note that I do often add to or tweak items after first publishing, so it’s always safest to read it from the website where it will have any updates.
Finally, if you see an error (a chart or text wasn’t updated, etc.), PLEASE put a note in the comments section so I can fix it.
Major US equity indices started the day modestly higher as they digested a mixed NFP report which showed a solid headline beat on the employer payrolls survey and the household survey also returning to job growth after May’s big decline, but under the hood the results were weaker with job growth concentrated in health care and state/local government, the labor force dropping again (which was the predominant reason for the drop in the unemployment rate (along with rounding)), and wage growth slowing.
Markets were also looking forward to the likely passage of Pres Trump’s signature tax and spending bill which had cleared a key procedure vote in the House early this morning (it did end up passing after the market close following a record-breaking speech (in length) by minority leader Jefferies). On what is seasonally the second best day of the year, markets followed that pattern moving higher from the start and ending the day with solid gains in the neighborhood of +1% led by the Nasdaq and Russell 2000, the latter of which made it into positive territory for the year. It capped a second week of gains, and fourth in six, with the indices all finishing up at least 2% (RUT was over 3%).
An update on July 4th is at the very end.
Elsewhere, Treasury yields jumped higher following the payrolls beat as did the dollar. Bitcoin was also higher, but crude, gold, , nat gas, and copper all fell (perhaps related to the dollar rise).
The market-cap weighted S&P 500 (SPX) was +0.8%, the equal weighted S&P 500 index (SPXEW) +0.5%, Nasdaq Composite +1.0% (and the top 100 Nasdaq stocks (NDX) +1.0%), the SOX semiconductor index +0.6%, and the Russell 2000 (RUT) +1.0%.


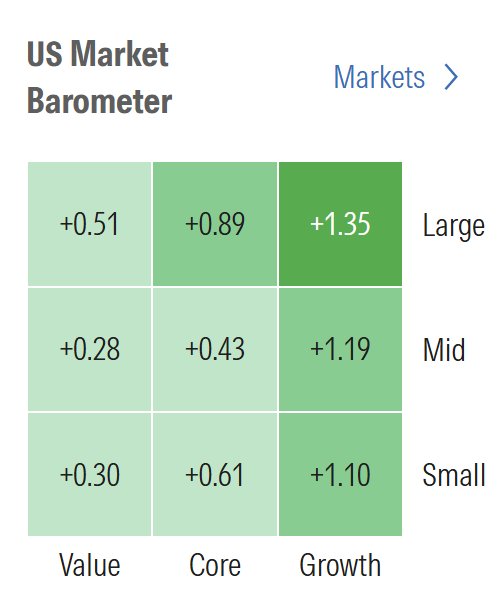
Morningstar style box was all green with growth back to outperforming.
Market commentary:
Seema Shah, chief global strategist for Principal Asset Management, who wrote in a note to clients that she doesn’t see the Fed cutting until late 2025 after today’s report. “A few Fed speakers have shown their inclination to cutting interest rates as early as this month. Today’s data of higher than expected payrolls, a drop in the unemployment rate, and a fall in jobless claims completely dispels their case for imminent rate cuts and implies that there is absolutely no urgency for Fed support.”
“The biggest implication from the employment report would seem to be there’s no way the Fed’s cutting rates in July, and it’s a question mark as to whether rates are cut at all this year,” Jed Ellerbroek, portfolio manager at Argent Capital Management, said in an interview with CNBC. While the market trading at all-time high levels leaves it open to downside, especially if Trump chooses to be “really tough” in negotiations, Ellerbroek believes the market is ultimately taking a more optimistic view. “We will see a real tariff impact for a lot of businesses, but the market is going to digest that without too much trouble,” he also said.
“The June jobs report is like a summer blockbuster — plenty of action and a surprise twist,” said Gina Bolvin at Bolvin Wealth Management Group. “For investors, this is a green light to lean into opportunity, but stay diversified. The economic engine is still humming, but now’s the time to tune up your portfolio before fall volatility rolls in.”
To Sameer Samana at Wells Fargo Investment Institute, there are enough positive macro and fundamental drivers for markets to make additional gains, but there may be some near-term volatility as issues like tariffs need to be resolved.
“While today’s report points to still firm job creation, we don’t think the underlying details of the report are as supportive as suggested by the top-line beat,” said Oscar Munoz and Gennadiy Goldberg at TD Securities. “The story of a low-fire, low-hire labor market continues to hold for now.”
Jeffrey Rosenberg, a senior portfolio manager at BlackRock, says on Bloomberg TV that the reliance on state and local governments here actually shows that the June payrolls gain was weaker than expected. “The story here is not the headline,” which is what the market is reacting to. “This is a slowdown and a little bit of a disappointment,” on the private-sector side. Overall the report indicates “this is the slowing that we were expecting.”
"The jobs report’s headlines overstate the strength of the job market," said Bill Adams, chief economist for Comerica Bank in Dallas. "The details of the payrolls report were considerably weaker than the headline." In an email, Adams added: "It seems clear that job creation will be in low-gear near term as the private sector digests tariff increases."
According to James Knightley, chief international economist at ING.
Job growth has been lacking in the traditional sectors usually linked to a strong and healthy economy, while the government, leisure & hospitality, as well as private-education and healthcare-services sectors have contributed 87% to all the jobs added in the past 2 1/2 years, Knightley wrote in a Thursday note.
However, such sectors may start to lose steam through the year and even hinder job growth later this year and into 2026, according to Knightley.
“Private healthcare jobs are vulnerable to the healthcare spending cuts that are part of President Trump's One Big Beautiful Bill Act and if consumers do start to become more cautious in their spending, reflecting the steep falls in sentiment, then discretionary spending on eating and drinking in bars and restaurants and other entertainment tends to be the first thing that gets cut,” Knightley wrote.
“Once again, the labor market defies expectations, showing not just resilience but real strength. It may be time to stop calling it surprising and start calling it solid,” said Karen Manna, investment director and portfolio manager at Federated Hermes. “Markets may begin to reprice in response to this momentum. With a series of near-term events on the calendar likely to narrow the range of possible outcomes, the fog of uncertainty is beginning to lift.”
With the Fed likely waiting until later this quarter or the next one before cutting rates, the stock market is likely to ignore the greater macroeconomic picture in the short run and focus much more on the start of the earnings season in mid July, said Chris Zaccarelli at Northlight Asset Management.
“We have been encouraged by the rapid recovery of the stock market these past three months, but are concerned that valuations are high and that a lot of the good news is already priced in,” he noted. “So the market is much more vulnerable to negative surprises at this point.”
To David Laut at Abound Financial, valuations aren’t a concern right now as “the market has too much inertia and there is room for valuations to expand.”
“We are sticking with the winners, which includes growth stocks, which have led the market since the April lows,” he said. “Growth has led us out of the downturn and we would expect this category to broaden out across company market caps, especially as interest rates decline.”
“Investors should be cautious before buying any dips next week,” said Michael O’Rourke, chief market strategist at JonesTrading LLC. “The S&P 500 is essentially at record highs and trading at an expensive valuation while the economy appears to be softening. That backdrop leaves the index vulnerable to a larger correction.”
“I think [July 9th] will be a hodgepodge — some agreements and some freak outs,” said Jay Hatfield, chief executive officer of Infrastructure Capital Management. “The tariffs have been blown massively out of proportion, we don’t really view it as material if we end up with 16-17%.”


Link to posts - Neil Sethi (@neilksethi) / X for more details/access to charts.
In individual stock action:
Shares of the Silicon Valley-based chip designers Synopsys and Cadence Design Systems rallied more than 4% each at mid-day after the U.S. government lifted restrictions on exporting chip design software to China, according to announcements from companies in the industry.
Datadog, the cloud monitoring provider, surged more than 12% after S&P Global added it to the S&P 500 index, effective before trading starts July 9. The move will force passive index funds to buy Datadog shares to reflect the composition of the underlying benchmark index.
Stocks with ether (ETH) treasury ambitions extended gains a second day amid a surge of renewed interest in stablecoins and stock tokenization, both of which are largely supported by the Ethereum network. Bit Digital rose 6% at mid-day , while betting platform SharpLink Gaming jumped 2%. Bitmine Immersion Technologies soared 35%, and has surged more than 1,000% since announcing its own ETH treasury plans Monday.
Corporate Highlights from BBG:
President Donald Trump’s administration has lifted recent export license requirements for chip design software sales in China, as Washington and Beijing implement a trade deal for both countries to ease some restrictions on critical technologies.
CoreWeave Inc. said it has received the market’s first artificial intelligence server system based on the newest, high-end Nvidia Corp. chip, a sign of its rising stature in the competitive AI cloud-computing space.
Rivian Automotive Inc. and Lucid Group Inc. rallied as BNP Paribas sees the EV makers benefiting Trump’s tax and spending bill ending electric-vehicle tax credits.
United Parcel Service Inc. plans to offer voluntary buyouts to union-represented delivery drivers for the first time in the company’s history as part of an effort to boost profit by slimming down its operations.
BlackRock Inc. is considering a sale of its stake in the leasing rights to Saudi Aramco’s natural-gas pipeline network back to the energy giant, according to people familiar with the matter.
Volkswagen AG’s Audi won’t increase prices in the US in July after its sales there nosedived in the second quarter.
Zurich Insurance Group AG agreed to buy BOXX Insurance Inc, a Canadian cyber risk management firm, marking the Swiss insurer’s latest push into the insurance technology sector.
Some tickers making moves at mid-day from CNBC:

In US economic data:
NFP shows employer payrolls come in above exp's for a fourth straight month at +147k vs +106k exp’d (and well above the “whisper” number from BBG of closer to 100k), and April and May were revised up by +11k and +5k to +158k and +144k, respectively, bringing the 3-mth avg to a much stronger than expected +150k. The beat was due to a much larger than expected jump in state and local government jobs (+47k & +33k respectively) while services slowed to +68k from +141k in May with almost all of that health care +59k (after +81k in May). Leisure & hospitality +20k, no other service sector up over +7.5k. Goods industries +6k but all construction (+15k). Mining (-2k) and manufacturing (-7k) both fell as did Fed gov’t jobs -7k. Avg hourly earnings a tenth cooler than expected m/m (and two tenths lower than May) at +0.2% m/m, also y/y at 3.7%. Unemployment rate drops two tenths to 4.1% on the back of a further -130k drop in the labor force (after -375k (revised down though from -625k)) and employment rebounding to +93k from -696k in May.
I’ve highlighted some underlying weakness in the June NFP report, and another was what I consider the most important metric - the index of aggregate weekly payrolls - on a y/y basis fell to the least since Mar ‘21 (it represents aggregate take home income for all workers (it is just total # of jobs*hourly earnings*workweek)) after coming in unchanged m/m, the least since July 2024. Nick Timiraos calls it “a good monthly proxy for nominal income growth and correlates well with nominal GDP growth,”
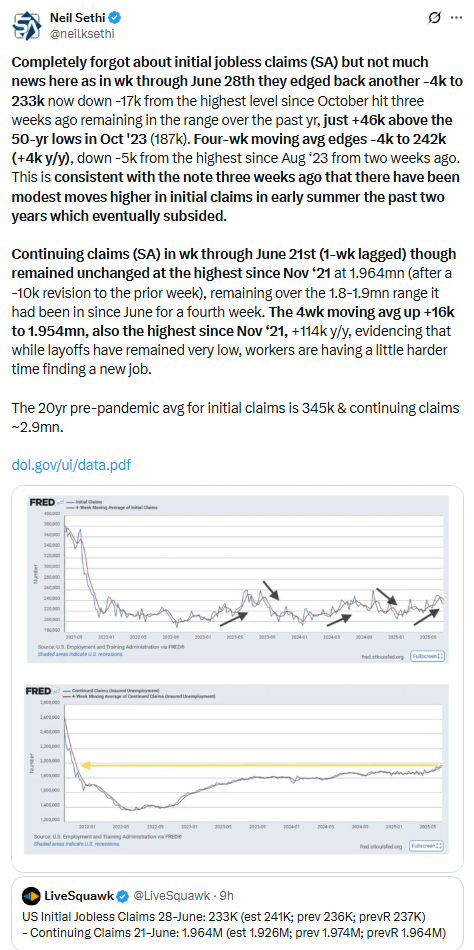
initial jobless claims (SA) but not much news here as in wk through June 28th they edged back another -4k to 233k now down -17k from the highest level since October hit three weeks ago remaining in the range over the past yr, just +46k above the 50-yr lows in Oct '23 (187k). Four-wk moving avg edges -4k to 242k (+4k y/y), down -5k from the highest since Aug ‘23 from two weeks ago. This is consistent with the note three weeks ago that there have been modest moves higher in initial claims in early summer the past two years which eventually subsided. Continuing claims (SA) in wk through June 21st (1-wk lagged) though remained unchanged at the highest since Nov ‘21 at 1.964mn (after a -10k revision to the prior week), remaining over the 1.8-1.9mn range it had been in since June for a fourth week. The 4wk moving avg up +16k to 1.954mn, also the highest since Nov ‘21, +114k y/y, evidencing that while layoffs have remained very low, workers are having a little harder time finding a new job.
June final S&P US services #PMI confirms a 29th mth (since Feb ‘23) of expansion at 52.9 although slowing from the 53.7 in May (but up from Apr’s 50.8 (which was the weakest since Nov ‘23)) down two tenths from the flash read, “represent[ing] a slightly slower, but still solid, increase in activity.” This left the composite PMI also at 52.9 down a tenth from May’s 53.0 as the deceleration in services was mostly offset by an acceleration in manufacturing.
June ISM services #PMI rejoined S&P’s version in expansion territory after falling into contraction in May for just the 4th time in the last 59 mths and the first time since June ‘24, reaccelerating to 50.8 from 49.9 (S&P decelerated to 52.9 from 53.7), above exp’s for 50.6, still though below the 2024 and 12-mth averages (both 52.4), and according to the report consistent w/an annual real GDP of just 0.7% (SAAR).


Link to posts for more details/access to charts (all free) - Neil Sethi (@neilksethi) / X
The SPX extend further into ATH territory. Its daily MACD remains positive, and the RSI is pushing further into overbought territory (most since last July) which as noted Tuesday is actually not a bad place to be (it’s when it falls out that you have to be more cautious).


The Nasdaq Composite a similar setup.

RUT (Russell 2000) has continued the run per my note last Friday that “it has a clear path to move at least to the 2300 level”. Has another 50pts to go. MACD is positive, and RSI is overbought the most since November. As mentioned last week, CTAs are modeled to be big buyers which is likely supporting the move.


Sector breadth from CME Cash Indices back to the 9+ green sectors we had seen for five of six sessions heading into Wed (which still had 7) with 10 higher today (with Materials coming in flat), although three were up less than 0.2%. Two were >1% (vs three Wed). Defensives showed relative weakness for a second day.


SPX stock-by-stock flag from FINVIZ_com relatively consistent with much more green today. Back to what we saw earlier this week with a good amount of stocks over 2%, but not many over 3% (mostly in tech) with almost none down that much (DHI, LEN, BG, CPB only names I saw down more than -2%).
NYSE positive volume (percent of total volume that was in advancing stocks) which has been better this week remained so Thursday although fell back to 68.8% from 70.9% Wed despite a larger gain in the index Thursday (+0.63% vs +0.27%).
Still compare that to June 23rd when it was 61.8% on a +0.70% gain in the index.

Nasdaq positive volume a similar story coming in at 74.0%, down a tenth from Wed despite a slightly bigger gain (+1.02% vs +0.94%) in the index.
But in comparison it was 63.7% on June 23rd on a +0.94% gain in the index.

Positive issues (percent of stocks trading higher for the day) were mixed today at 72 & 65% respectively.
New 52-wk highs-new lows (red-black dotted lines) also improved to the best since December & November on the NYSE & Nasdaq respectively at 179 & 265.


Fed rate cut bets were cut sharply Thursday following the beat on headline payrolls with pricing for 2025 #FOMC rate cuts falling -13bps to 51bps according to CME’s #Fedwatch tool, (down from 92bps on May 1st; and the peak this year at 103bps on Apr 8th (the low was 36bps Feb 11th)).
The probability of a cut at the July meeting dropped to 5% from 23% (now below where it was following the June FOMC meeting, and from 78% at the start of May)) while a cut by the following meeting (Sept) fell to 69% from 94% (back now to where it was on FOMC Day).
Chances of 2 cuts this year is 75% (down from 90% Wed although still up from 62% on FOMC Day), three is 32% (down from 55%), and four is 1% (from 10%). The chance of no cuts rose to 4% from 0.6% (still down from 8% FOMC Day).
2026 cuts though edged up +3bps to 69bps (seeing close to 3 cuts), with total cuts through Dec '26 at 120bps (now under over 5 cuts), still +10bps from FOMC Day but -29bps from the start of May.
I said after the big pricing out of cuts in January (and again in February) that the market had pivoted too aggressively away from cuts, and that I continued to think cuts were more likely than no cuts, and as I said when they hit 60 bps “I think we’re getting back to fairly priced (and at 80 “maybe actually going a little too far” which is back to where we probably were Apr 20th (a little too far) at 102bps). Seems like we’re getting back to “fairly priced,” and as of May 14th at 48bps perhaps starting to go a little too far in the other direction, but as I’ve said all year “It’s a long time until December.”
Also remember that these are the construct of probabilities. While some are bets on exactly two, three, or four cuts much of it is bets on a lot of cuts (5+) or just one or none.

10yr #UST yields up for a third day Thursday +5bps to 4.34% as they continue to rebound from the lowest close since April on Monday making it to my target of the downtrend line from the May peak (which held). They were +7bps on the week.

The 2yr yield, more sensitive to #FOMC policy, also rose for a third day Thursday +8bps to 3.87%. It is still -46bps below the Fed Funds midpoint, so still calling for rate cuts, but it was up +13bps on the week.
I had said when it was around 4.35% (in Jan & again early Feb) that I found the 2-yr trading rich as it was reflecting as much or more chance of rate hikes as cuts while I thought it was too early to take rate cuts off the table (and too early to put hikes in the next two years on), but then the 2yr fell to 3.65% past where I thought we’d see it, so I took some exposure off there. We got back there but I never added back what I sold, so I stuck tight. Ian Lygan of BMO saw it going to 3.5% by year’s end before all this tariff business but now thinks it’s at fair value here. I will probably take some more off this week.

$DXY dollar index (which as a reminder is very euro heavy (over 50%) and not trade weighted) edged further away from the 3+ yr low hit Tuesday as it continues to hold that long term trendline that runs back to 2010. The daily MACD and RSI remain negative but the RSI has now moved from under to over 30, which can be s signal of a reversal of a downtrend.

VIX little changed for a 7th session as it holds just above the 16 level finishing Thursday at 16.4. That level is consistent w/~1.03% average daily moves in the SPX over the next 30 days.
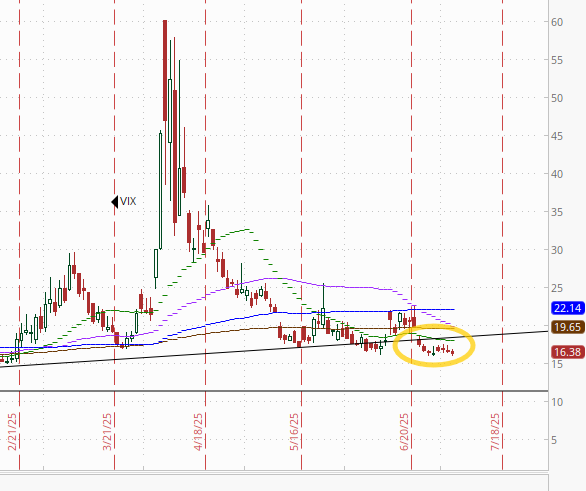

The VVIX (VIX of the VIX) also little changed at 91 remaining under Nomura’s Charlie McElligott’s “stress level” of 100 (consistent now with “moderate” daily moves in the VIX over the next 30 days (normal is 80-100)).

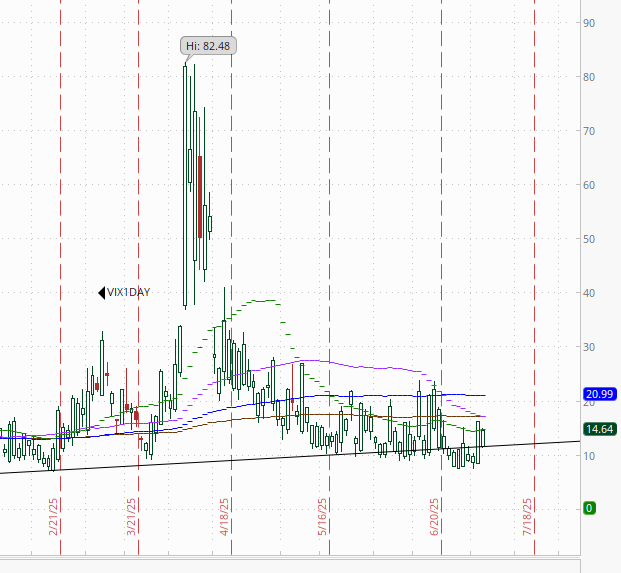
1-Day VIX fell back Thursday but remained above Tues’s level, which was the lowest since Feb 19th, perhaps due to the long holiday weekend. It closed at 14.6, consistent with traders implying a ~0.91% move in the SPX next session.
#WTI futures not able to build on their +3% jump Wed edging back a half percent. As noted Tuesday the daily MACD has crossed to “sell longs” positioning but the RSI is back over 50.
#oott

Gold futures (/GC) edged back to the bottom of the uptrend channel from January, which it fell under briefly earlier in the week. Daily MACD remains negative as noted last Wed, while the RSI fluctuates around 50.


Copper (/HG) futures also fell back but remained above the $5.10 resistance level it has never been able to hold over for more than six or seven sessions. So far it’s five. The daily MACD and RSI are positive as noted last Thursday.

Nat gas futures (/NG) fell back again to the 200-DMA, which as noted last week has for the most part held since last August, overall remaining in the middle of its range this year. Daily MACD and RSI tilt negative.

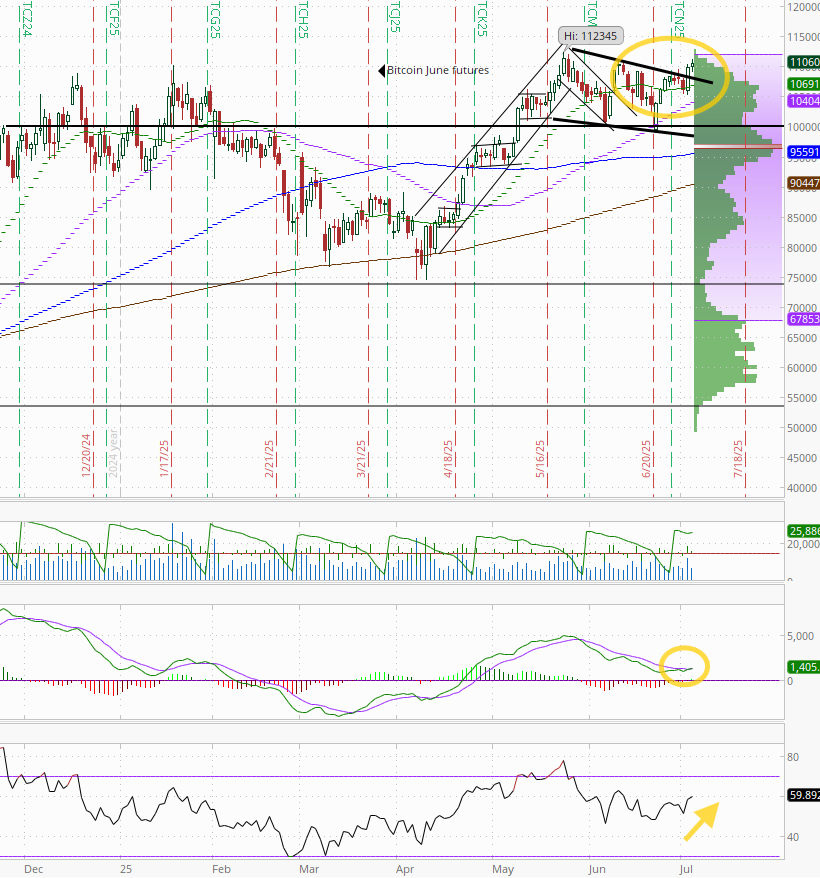
Bitcoin futures continued to extend out of the larger flag formation. Also the daily MACD has flipped to “go long” positioning, and the RSI is extending over 50.
As a reminder the last time daily RSI went from well over to well under 70 there was a a six-month period of consolidation (November), so we’ll see if this time is different (it needs to make and sustain a new high). So far it’s been 4 weeks.
The Day Ahead
Friday brings us a market holiday in the US, but strangely the rest of the world doesn’t take a day off on July 4th.
Ex-US DM we’ll get Germany factory orders among other reports and more central bank speakers.
In EM we’ll get Brazil trade and Mexico consumer confidence among other reports.
Looking to next week it’s a light calendar for US economic data with all of the inflation reports (which we normally get the second week of the month) shifted to the third week (which is packed, so take advantage of the light week). We’ll just get reads on consumer and small biz sentiment, consumer credit, and the standard weekly reports along with minutes from the June FOMC meeting.
I’m sure there will be plenty of FOMC speakers (just a couple are listed at this point), and we’ll move closer to the unofficial start of Q2 earnings season July 15th (JP Morgan) with what should be a relatively light slate of reports.
And of course, next week includes July 9th, the expiration of the 90-day pause on the initially imposed US reciprocal import tariffs. How that is sorted out between announced trade deals, “letters” to be sent setting tariff rates, and/or extensions of the current pause will be a major focus next week.


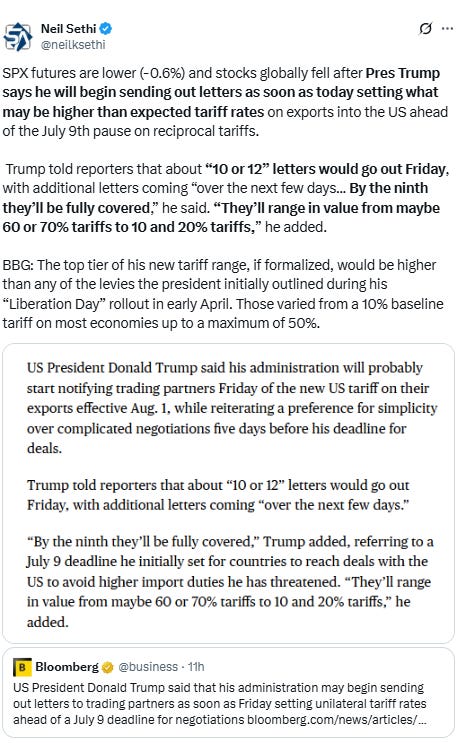
Brief update on July 4th. US futures finished lower after Pres Trump says he will begin sending out letters as soon as today setting what may be higher than expected tariff rates on exports into the US ahead of the July 9th pause on reciprocal tariffs.
SPX futures finished -0.6% lower, NDX -0.7%, RUT -1.1%.
Risk assets fell broadly as did the dollar:
Dollar was -0.2%, WTI -1%, gold +0.3%, bitcoin -2.2%, copper -1.4%, nat gas -0.5%.

“There’s a little bit of doubt creeping in, especially after the bump up this week,” said Neil Wilson, investor strategist at Saxo UK. “Today’s a good day to take a little bit of risk off. But I don’t think there’s a fundamental shift, it’s all on the margins at the moment.”
“It would take a shocking set of trade outcomes to overwhelm the slew of good news we’ve recently had. All the more so, given that the bullishness of institutional investors has been tempered by constant threats, leaving them relatively underexposed to a market at record highs.” — Mark Cudmore, BBG Markets Live Executive Editor
“Overbought markets can stay overbought as greed is harder to conquer than fear,” according to Michael Hartnett of Bank of America Corp wrote in a note where he nevertheless advised that investors consider trimming their holdings once the index climbs beyond 6,300.


Link to X posts - Neil Sethi (@nelksethi) / X
To subscribe to these summaries, click below (it’s free!).
To invite others to check it out,