


Markets Update - 8/8/25
Update on US equity and bond markets, US economic reports, the Fed, and select commodities with charts!

To subscribe to these summaries, click below (it’s free!).
To invite others to check it out (sharing is caring!),
Link to posts - Neil Sethi (@neilksethi) / X
Note: links are to outside sources like Bloomberg, CNBC, etc., unless it specifically says they’re to the blog. Also please note that I do often add to or tweak items after first publishing, so it’s always safest to read it from the website where it will have any updates.
Finally, if you see an error (a chart or text wasn’t updated, etc.), PLEASE put a note in the comments section so I can fix it.
Major US equity indices started the day modestly higher as they have most every day the past few weeks but like Thursday diverged with the Nasdaq leading (+1% to a record high) and the Russell 2000 (RUT) lagging (but at least positive +0.2%). SPX was +0.8% finishing 0.32pts from a record closing high (0.005%). For the week, the indices stayed in positive territory throughout. The DJIA lagged (still +1.4%). RUT & Nasdaq were tied at Thursday's open, but RUT faded to finish even with the SPX +2.4%. The Nasdaq extended to a +3.9% weekly gain.
Elsewhere, Treasury yields edged higher for a fourth session and the dollar finally joined them. Gold and copper were higher, crude and nat gas lower, bitcoin was little changed.
The market-cap weighted S&P 500 (SPX) was +0.8%, the equal weighted S&P 500 index (SPXEW) +0.1%, Nasdaq Composite +1.0% (and the top 100 Nasdaq stocks (NDX) +1.0%), the SOX semiconductor index +0.8%, and the Russell 2000 (RUT) +0.2%.


Morningstar style box mostly finished in the green showing value outperforming which is in contrast to the index performances.

Market commentary:
Going forward, the main area of focus for investors continues to be watching Trump’s trade policies play out, said Thomas Martin, senior portfolio manager at Globalt Investments. “There’s less turbulence with tariffs, but there’s still plenty of turbulence. There’s still plenty of questions out there as to how they’re going to affect companies’ decision making, supply chains, costs, margins, pricing, how it’s going to affect consumers and whatnot,” Martin told CNBC. “So I think there’s still a lot of a lot of uncertainty associated with the tariffs. It’s still the most important thing, at this point, that just has to be worked out.”
Andrew Sheets, head of corporate credit research at Morgan Stanley, said on a company-produced podcast that markets handling of tariffs may be a "a bit like a wide receiver celebrating on the 5-yard line." There were always two-fold impacts from tariffs -- both on inflation and activity -- and recent data has the hallmarks of stagflation. His firm's economists forecast slower activity and higher inflation from here. "This would be a different pattern of data that we've seen so far this year," he said.
“Since the tariff agreement between the U.S. and the European Union, some clarity has emerged, but confusion around its implementation is just beginning to surface,” Stanzl said. “In Japan, there is relief today upon hearing that the various tariffs will not be cumulative. However, it remains unclear whether the same rules apply for Japan and the EU. The complexities surrounding tariffs highlight the unpredictability in implementation, as evidenced by the recent surge in gold prices.”
“The market’s reaction to the April 2 announcement kind of shows how markets feel about tariffs,” Ross Mayfield, Baird investment strategist, said. “Investors are largely anticipating the administration not following through on hyper aggressive tariff plans, so it’s kind of like chicken-and-egg, and I think we’re still kind of in the later stages of figuring that out.”
“If markets anticipate that but don’t react because they’re waiting for the capitulation, the administration could possibly take it that the market is enforcing the policy rather than anticipating a change, so it is kind of a tricky dynamic,” he continued.
“Second-quarter earnings confirm corporate resilience continues. Overall, margins have been steady while firms’ commentary indicates that corporates have been largely adept at managing the impact from tariffs so far,” said Barclays Plc strategists led by Emmanuel Cau. “That doesn’t mean tariff uncertainty has gone away completely given Trump policy making remains erratic.”
Bret Kenwell at eToro noted momentum has been strong in equities, and more than 80% of S&P 500 firms have beaten earnings expectations this quarter. The technicals and the fundamentals have been working in bulls’ favor, he said.
“While an unexpected risk could develop in the second half of 2025, earnings have been better-than-expected and the Fed is inching closer to lower interest rates,” Kenwell noted. “As long as the economy holds up, there are catalysts in play for stocks to continue higher.” Still, Kenwell says that it would be a healthy price action for stocks to consolidate after a big rally — either by pulling back or digesting the move by trading sideways. “This pullback would likely be viewed as an opportunity for investors to buy the dip rather than run for the hills,” he said.
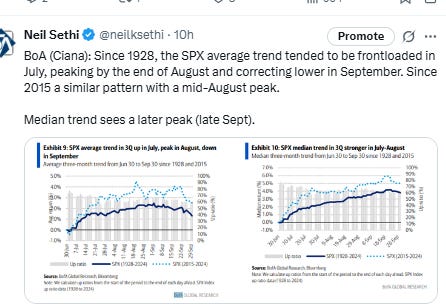
At Piper Sandler, Craig Johnson says that while the summer doldrums often lead to modest pullbacks in August and September, investors who have doubted this rally are now forced to “buy the dips… and not sell the rips.”
“Markets rebounded strongly this week with a clear ‘buy on the dip’ mentality,” said Florian Ielpo at Lombard Odier Investment Managers. “While market sentiment appeared to be waning last week, with subdued reactions to earnings beats, this week clearly demonstrated a different trend.”
And that begs the question: are we close to a solid ceiling? “Our risk appetite indicator shows improvement from last week but clearly has room to grow,” Ielpo said.
The next significant directional move in the market will be driven by fundamentals, either through macro resilience driving earnings estimates higher or further cracks in the labor market driving increased recession concerns, according to Mark Hackett at Nationwide. “Given the moderation in technical indicators and the sluggish seasonal shift, a period of consolidation is not unexpected or unhealthy,” he said.
“With the major indexes at or near record highs, valuations are rich, and stock selection and diversification are more important than ever,” said Daniel Skelly at Morgan Stanley’s Wealth Management Market Research & Strategy Team.
On the macro front, BofA’s Michael Hartnett said a majority of the bank’s clients are betting on a “Goldilocks” outcome, which implies an economy that’s running neither too hot nor too cold. He said investors expect a scenario where lower rates would fuel a rally in equities.
“Having a more dovish Federal Reserve governor on the table is definitely better,” Ivy Ng, a CIO at DWS, said in a Bloomberg TV interview. “But in the end, the Federal Reserve is still more data driven, so we focus a lot on the economic data.”


Link to posts - Neil Sethi (@neilksethi) / X for more details/access to charts.
In individual stock action:
Apple lifted both the S&P 500′s tech sector and the Nasdaq. The iPhone maker surged 13% this week after announcing plans to spend about $600 billion over four years in the U.S. in a bid to appease President Donald Trump. The stock notched its best week since July 2020. Apple’s latest surge kicked into high gear as Trump announced earlier this week that he would impose a 100% tariff on imported semiconductors and chips, with an exemption for companies that are “building in the United States.” Shares advanced another 4.2% Friday.
Fannie Mae and Freddie Mac soared on reports the US is preparing to sell shares in an offering that could start as early as this year.


Companies making the biggest moves after-hours from CNBC.
None today
Corporate Highlights from BBG:
Meta Platforms Inc. has selected Pacific Investment Management Co. and Blue Owl Capital Inc. to lead a $29 billion financing for its data center expansion in rural Louisiana as the race for artificial intelligence infrastructure heats up, according to people with knowledge of the matter.
Tesla Inc. is disbanding its Dojo team and its leader will leave the company, according to people familiar with the matter, upending the automaker’s effort to build an in-house supercomputer for developing driverless-vehicle technology.
Intel Corp. Chief Executive Officer Lip-Bu Tan said he’s got the full backing of the company’s board, responding for the first time to US President Donald Trump’s call for his resignation over conflicts of interest.
SoftBank Group Corp. is the buyer taking ownership of Foxconn Technology Group’s electric vehicle plant in Ohio, a move aimed at kick-starting the Japanese company’s $500 billion Stargate data center project with OpenAI and Oracle Corp.
Taiwan Semiconductor Manufacturing Co. reported a 26% growth spurt in July, adding to evidence of accelerating spending on artificial intelligence.
Expedia Group Inc. raised its full-year sales target after reporting strong second-quarter bookings, fueled mainly by its enterprise business as well as improved demand from US consumers.
Pinterest Inc. reported second-quarter sales that beat analysts’ expectations, but earnings for the second quarter were less than Wall Street expected and user growth in the US and Canada, the company’s most lucrative market, was flat.
Under Armour Inc. forecast worse-than-expected sales and profit for the current quarter, stalling a turnaround plan that was taking hold.
Gilead Sciences Inc. lifted its full-year outlook after strong HIV drug sales in the second quarter helped revenue and earnings modestly beat analyst expectations.
Wendy’s Co. cut its full-year sales guidance after posting a bigger-than-expected quarterly decline, highlighting the economic pressures weighing on the chain’s US business.
Instacart posted its strongest order growth since 2022 for a second straight quarter and beat earnings estimates for the current period, a sign of resilience in its core delivery business after it rolled out initiatives to cater to price-conscious consumers.
Trade Desk Inc. reported second-quarter results that spurred multiple downgrades. Firms note growing concerns about competition from Amazon.com Inc.
Sweetgreen Inc. slashed its sales guidance after a second straight quarter of disappointing results, highlighting the salad chain’s struggles to sell $15 salads to budget-strained diners.
Mid-day movers from CNBC:

In US economic data:


Link to posts for more details/access to charts (all free) - Neil Sethi (@neilksethi) / X
The SPX moved to just under its all-time closing high. Its daily MACD and RSI are mixed with the former negative but the latter more positive.

The Nasdaq Composite a similar but slightly more favorable picture.

RUT’s (Russell 2000) remains stalled at the “heavier resistance” I noted Tuesday. Daily MACD and RSI are more negative here but improving.

Weekly charts show SPX and Nasdaq remain in very solid shape. The RUT definitely less so with that overhead resistance the primary issue.


Sector breadth from CME Cash Indices improved to 8 of 11 green sectors (best since Monday), with two over +1% (vs one Thurs but three Wed), but no sectors were down more than -1% (closest was RE -0.8%). Megacap growth outperformed taking the two top spots (Tech & Comm Services).

SPX stock-by-stock flag from FINVIZ_com consistent with the most green since Monday, with just RE and Utilities seeing broad weakness. Restaurants and travel also weak, while LLY continued its no good, very bad week (-18%, the worst since Sep ‘08). On the flip side, lots of green in Financials, semiconductors, Health Care (ex-LLY & VRTX). AAPL had its best week since July ‘20 (+13%).
Still just 16 SPX components were up over 3% (down from 24 Thurs and just above the 13 Wed and 14 Tues and well under the 43 Monday (and the recent high of 65 July 30th)), and for a second day none were up over 10%. GILD, MU, AAPL the only >$100bn market cap components up over 3% (in order of percentage gains).
But just 15 SPX stocks were down more than -3% (vs 26 Thurs, 31 Wed, 26 Tues, 4 Mon, but 64 last Fri). Two were down more than -10% in TTD (-39% (it’s second drop up over -30% this year)) & GDDY. The >$100bn in market caps down >-3% were DASH, UBER & IBM (in order of percentage losses).

NYSE positive volume (percent of total volume that was in advancing stocks) after a very solid Monday (the best since May 27th), “not bad” Tuesday, “weak” Wednesday, and “improved” Thursday was disappointing Friday oddly remaining at exactly 49.5% despite a +0.29% gain in the index vs Thursday’s -0.11% loss.

Nasdaq positive volume in contrast did improve although at 61.7% was pretty weak for the +0.98% index gain. Compare that to July 9th (circle) when it was 74.3% on a +0.94% index gain.
And the weaker positive volume number can’t be ascribed to a less meme/sub-$2 stock volume which was slightly higher.
While just 6 of the top 15 stocks by volume were in that category (just above the 5 Wed (the least since I started tracking a few weeks ago)), and the total volume in those stocks was 1.77bn, in line with Thurs’ 1.79bn (up from 1.50bn Wed, 1.57bn Tuesday and 0.9bn Mon (the least since I started tracking), although still well below the peak of 5.5bn July 24th), accounting for 20.2% of total Nasdaq volume, up from 19.8% Thurs, 17.5% Wed, 19.4% Tues, and 12.4% Monday (but well below the peak of 43.8% July 24th).


Positive issues (percent of stocks trading higher for the day) not as inflated by the penny stock volume continued to see a lower figure on the Nasdaq at 52%, while on the NYSE it was 53%.
New 52-wk highs minus new 52-wk lows (red-black dotted lines) were mixed with the NYSE falling to 36 but the Nasdaq improving to 53, remaining though well below the highs of the year on July 23rd (131 & 271 respectively).


#FOMC rate cut pricing continued to fluctuate with 2025 -3bps to 58bps remaining down a little from where we were at the start of July at 64bps and further down from 92bps on May 1st (and the peak this year at 103bps on Apr 8th)).
A Sept cut is now 90% (just off the the highest since May (95%)) up from 39% pre-NFP. Chances of 2 cuts now at 88% (just off the the highest since May (93%)) from 41% pre-NFP, three is 44% (a little more off the the highest since May (53%)) up from 8% pre-NFP. The chance of no cuts (which is still the call from some like BoA (they reiterated that this week) and Ed Yardeni) at 0.8% from 17% pre-NFP.
Pricing for 2026 cuts +2bps to 71bps. Total cuts through Dec '26 are 129bps, -18bps from the start of May.
I said after the big pricing out of cuts in January (and again in February) that the market had pivoted too aggressively away from cuts, and that I continued to think cuts were more likely than no cuts, and as I said when they hit 60 bps “I think we’re getting back to fairly priced (and at 80 “maybe actually going a little too far” which is definitely where we were Apr 20th (a little too far) at 102bps). I said Thursday “now it seems like we’re perhaps getting back to too few cuts”, but I didn’t think it would reverse in one day. Now seems we’re back to “fairly priced”. But as I’ve said all year “It’s a long time until December.”
Also remember that these are the construct of probabilities. While some are bets on exactly two, three, or four cuts much of it is bets on a lot of cuts (5+) or just one or none.


10yr #UST yields edged higher for a fourth day +5bps to 4.29%, ending the week +7bps from the lowest since April.


The 2yr yield, more sensitive to #FOMC policy +4bps to 3.76%, up +8bps on the week from the least since May. It is still -57bps below the Fed Funds midpoint, so still calling for rate cuts.
I had said when it was around 4.35% (in Jan & again early Feb) that I found the 2-yr trading rich as it was reflecting as much or more chance of rate hikes as cuts while I thought it was too early to take rate cuts off the table (and too early to put hikes in the next two years on), but then the 2yr fell to 3.65% past where I thought we’d see it, so I took some exposure off there. We got back there but I never added back what I sold, so I stuck tight. Ian Lygan of BMO saw it going to 3.5% by year’s end before all this tariff business but now thinks it’s at fair value at around 3.75% so I took some more off at the end of June. I will cut a little more off if it falls much further (Aug 1st).

DXY dollar index (which as a reminder is very euro heavy (57%) and not trade weighted) up for only the second session in six remaining though just off a 1-week low. The daily MACD has now crossed to “sell longs” while the RSI is just under 50.

Weekly chart remains more constructive.


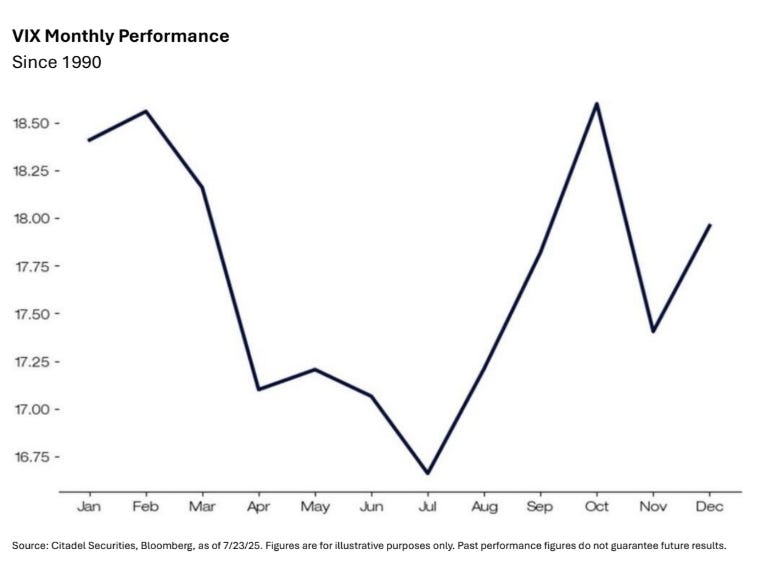
VIX remained in the 16 area (15.2) where it has been for the most part since May, sliding to a 1-week low. That level is consistent w/~0.96% average daily moves in the SPX over the next 30 days. I noted last Friday it had gotten up to 20 before post-April but never been able to close above 22.

The VVIX (VIX of the VIX) like the VIX has been more volatile but for now remains subdued at 93, under Nomura’s Charlie McElligott’s “stress level” of 100 (consistent with “moderate” daily moves in the VIX over the next 30 days (normal is 80-100)).

1-Day VIX edged down to a 1-week low of 10.9, consistent with traders implying a ~0.68% move in the SPX next session.

#WTI futures down for a 7th session Friday and moving further under the key $65 level (which I raised as a risk on Monday and said “uh oh” on Wed when they slipped below) to the lowest close in two months (June 5th). As noted Tuesday, the daily MACD has crossed to less positive (now into “go short” territory) and the RSI is the least since May.

Weekly chart deteriorating as well.

Gold futures (/GC) a bit of a wild session on the inclusion of certain gold bars in the Switzerland tariffs that the White House later said would be clarified seeing what was a bigger rally turn fall back, still though just above the wedge they’d been in since May until pushing out Thursday. The MACD and RSI which I noted a week ago remain positive.

Weekly chart remains less favorable, but is improving.


US copper futures (/HG) edged up to 1-week highs, still though not far from the lowest close since April.

Weekly chart a bit of a mess.

Nat gas futures (/NG) fell back to the $3 level Friday. Daily MACD and RSI remain negative, although are very close to turning more positive.

Weekly chart move of the range trading we’ve seen. This is why a break of $3 makes $2.30 likely.

Bitcoin futures little changed remaining in the flag pattern they’d been in for a couple weeks until Friday when they fell out for a few days. The daily MACD and RSI are mixed.

Weekly chart continues to look pretty good.

The Day Ahead
The US economic data calendar picks up next week with many of our normal second and third week highlights jammed together in July CPI, PPI & import prices (which should give us a very good idea of what core PCE will be at the end of the month), retail sales and industrial production. We’ll also get July NFIB small biz sentiment and the preliminary UMich Aug survey along with the normal weekly reports (jobless claims, mortgage applications, and EIA petroleum and nat gas inventories).
Several Fed appearances on the calendar (and there’s always more) although three of them are Richmond Fed Pres Barkin (not a voter until 2027) in addition to the Atlanta Fed’s Bostic (who we’ve heard from a few times recently) and Chicago Fed’s Goolsbee.
Earnings reports will continue but a much lighter week for SPX components with just 2% of the earnings power reporting (a total of 7 companies with three >$100bn in market cap (CSCO, DE, AMAT).
International a lighter week highlighted by Japan and UK GDP and policy decisions in Australia and Norway as well as China’s monthly “data dump” of retail sales, industrial production, fixed asset investment, property sales, and employment.
We’ll also get the Aug 12th deadline for the pause in China import tariffs.


Link to X posts - Neil Sethi (@nelksethi) / X
To subscribe to these summaries, click below (it’s free!).
To invite others to check it out,