Markets Update - 9/20/24
Update on US equity and bond markets, US economic reports, the Fed, and select commodities with charts!
To subscribe to these summaries, click below (it’s free!).
To invite others to check it out (sharing is caring!),
Link to posts - Neil Sethi (@neilksethi) / X (twitter.com)
Note: links are to outside sources like Bloomberg, CNBC, etc., unless it specifically says they’re to the blog.
US equities started the day lower after Thursday’s surge to a record high (for the S&P 500) and fell through the morning before rebounding on an interview with Fed Governor Waller where he seemed open to further more aggressive rate cuts. They hit their best levels of the day about 15 minutes before the close but fell sharply on what was likely the result of a combined options expiration and rebalance of the S&P 500 and constituent ETF’s. Still the SPX ended the week up for the 5th week in 6 and just off all-time highs (the Dow though did end at a new closing high). Small caps were weaker today, with the Russell 2000 breaking its 7-day win streak.
Bond yields were little changed as were the dollar, crude, and bitcoin. Gold pushed to another ATH, natgas to a 2mth high, but copper fell back from its own 2mth high.
The market-cap weighted S&P 500 was -0.2%, the equal weighted S&P 500 index (SPXEW) -0.4%, Nasdaq Composite -0.4% (and the top 100 Nasdaq stocks (NDX) -0.2%), the SOX semiconductor index -1.3%, and the Russell 2000 -1.1%.
Basically all the gains for the week were between the close on Wednesday and the open on Thursday.
Morningstar style box shows the broad weakness.
Market commentary:
“For all the optimism in markets right now, it’s clear that a few concerns still lie under the surface,” said Jim Reid, a strategist at Deutsche Bank AG. “In particular, futures are continuing to price in a more aggressive pace of cuts than was implied by the Fed’s dot plot on Wednesday, so investors think they might need to accelerate those rate cuts if downside risks materialize.”
“Investors viewed the aggressive rate cut as positive catalyst,” said Nationwide chief of investment research Mark Hackett. “The Fed was able to effectively convince investors that the sizable cut is a proactive measure to sustain economic momentum, rather than a reactive move to stabilize it. The strong market reaction indicates investors have confidence in the Fed and have a ‘glass half full’ mentality,” Hackett added.
“A sustained melt-up in risk is unlikely into peak election uncertainty that may generate a soft patch in the data,” Evercore ISI’s Krishna Guha wrote. “Investors should view the gains in risk post-Fed as a down payment, with a check in the mail for the balance after election day.” Evercore ISI’s vice chairman sees another half-point cut as possible if labor or inflation data come in weak.
For Bank of America Corp.’s Michael Hartnett, the optimism in equity markets following the Fed’s move is stoking the risk of a bubble, making bonds and gold an attractive hedge against any recession or renewed inflation.
The strategist said stocks are now pricing in more Fed easing and about 18% earnings growth for the S&P 500 by end-2025. It doesn’t “get much better than that for risk, so investors are forced to chase” the rally, Hartnett wrote in a note. He also said stocks outside the US and commodities were a good way to play a possible soft economic landing, with the latter being an inflation hedge. International equities are cheaper and starting to outperform US peers, according to Hartnett.
The record-high levels for the stock market seem unstable given the economy and valuations, and the S&P 500 is likely to slide before the end of the year, according to Stifel strategist Barry Bannister.
“Our instruments tell us to expect an S&P 500 correction to the very low 5,000s by 4Q24,” Bannister said in a note to clients. If the index hit 5,000, it would be a decline of about 12% from where it was trading midday Friday.
Bannister pointed to slowing job growth as a sign that the market still has recession risk and said valuations for growth stocks seem too high.
“Today’s near three-generation high S&P 500 P/E and Growth vs. Value relative out-performance sounds rosy, but trend peaks for those two variables (as now) have always presaged a recession and bear market...at least for the past 90 years,” the note said.
In individual stock action, Intel (INTC 21.84, +0.70, +3.3%) jumped in afternoon trade following news that Qualcomm (QCOM 168.92, -5.00, -2.9%) is interested in a takeover deal, according to The Wall Street Journal. Elsewhere though semiconductors were weak with the PHLX Semiconductor Index (SOX) -1.3%. FedEx Corp. plunged -15% after the economic bellwether missed profit estimates and cautioned that its business would slow. Lennar Corp. slipped after quarterly home orders fell short of Wall Street expectations. On the other hand, Constellation Energy (CEG 254.98, +46.48, +22.3%), surged to a record high after announcing a 20-year power purchase agreement with Microsoft that will include the restart of Three Mile Island Unit 1, and Nike (NKE 86.52, +5.54, +6.8%) also saw strong gains after announcing last night that Elliott Hill will become President and CEO, effective October 14, 2024.
Some tickers making moves at mid-day from CNBC.
No US economic data today.
Link to posts - Neil Sethi (@neilksethi) / X (twitter.com) for more details.
The SPX down but holds its breakout level. With the daily MACD & RSI positive as noted last Friday it’s still got clear sailing ahead from a technical standpoint.
The Nasdaq Composite fell back from just under the Aug highs, but its daily MACD & RSI remain very supportive.
RUT fell back from the highest close since July. Its daily MACD & RSI remain very positive as well.
Equity sector breadth from CME Indices weakened as would be expected by the down day in the indices, but just 3 green sectors (from 8 yesterday) & just 1 up >0.5% (utilities which ripped +2.9%). Good news is no sector was down by more than -0.7%. Tech was -0.5% despite the est’d $40bn in rebalance flows.
Stock-by-stock SPX chart from Finviz confirms with a lot more red today than yesterday scattered across most of the chart.
Positive volume Fri fell back as might be expected with the down day in the indices to 41% & 46% resp on the NYSE & Nasdaq. Nothing special about that one way or the other, so overall breadth I’d say was weaker this week than the previous one. Issues were worse though at 34 & 33% resp.
New highs-new lows (charts) which had been very solid the last few days fell back pretty sharply to 228 & for NYSE & Nasdaq resp, from 409 & 309 Thurs, crossing under the 10-DMAs (less bullish).
FOMC rate probabilities from CME’s Fedwatch tool saw some movement following the comments from Gov Waller that he is open to more 50bps rate cuts, which I guess outweighed those of dissenting Gov Bowman who clearly would not be on board with another one, as the chance of 50bps in Nov moved to 50% (from 38%). That said, pricing for 75bps by Dec was little changed at 74%, and 99bps of cuts are now priced for this yr (from 98), 216bps through Sep ‘25 (unch).
Treasury yields were little changed today. The 10-yr note yield settled down 1 basis point at 3.73% (it drifted a bp higher post-cash settle) as it struggled with the resistance of the 3.80% level (still up 8 bps for the week despite the dovish FOMC), while the 2-yr note yield was unch at 3.60% interestingly up 1bps on the week.
Dollar was little changed again holding just over the key 100.5 level. Daily MACD & RSI remain mixed with the latter rolling over and the former still in ok shape.
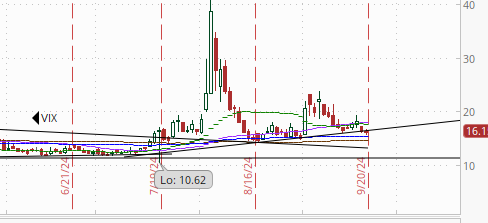
VIX falls back again threatening to breach its its uptrend line back to July, still though at a 16 level (consistent with 1% daily moves over the next 30 days), while VVIX falls further under its own uptrend line and the 100 level flagged by Charlie McElligott on the Odd Lots podcast for the 1st time this month, a sign potentially for volatility calming down in coming days/weeks.
1-Day VIX falls back as would be expected, but stubbornly refuses to move into the single digits, remaining elevated compared with its history at 11, but that’s just a 0.7% move on Monday, pretty ordinary.
WTI edged higher but just can’t seem to get over the 20-DMA, a little surprising as that hasn’t been an issue previously this year (but was in late 2023 I guess). It still has the support of the daily MACD & RSI so we'll see if it can get over that resistance next week.
Gold another strong session to push firmly into ATH territory. As noted last Friday, its 14-day RSI & daily MACD have turned more positive supporting prices.
Copper down for only the 6th day in 8 as it struggles with the 100-DMA. As I noted last Friday, the daily MACD & RSI remain very constructive, and it’s spent enough time going sideways that I think it could break out, but falling back here towards the August lows would also be consistent with history (see post).
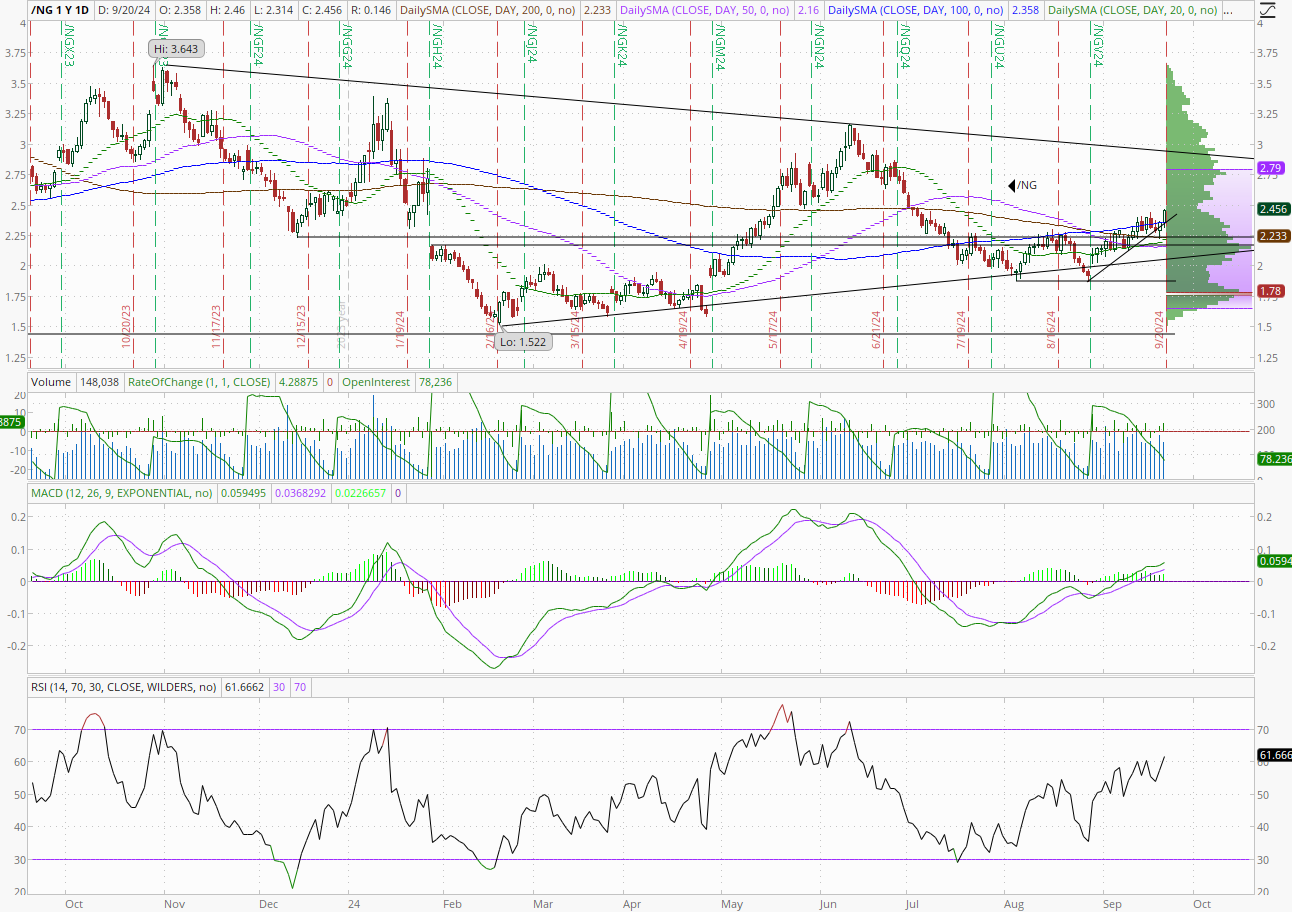
Nat gas back on track today with a 4% move that puts it at the highest since the beginning of July. Daily MACD & RSI continue to be very supportive. As I’ve noted the past week, not much resistance between here and $3.
Bitcoin futures followed risk assets again Friday finishing mildly down after hitting near a 1mth high Thursday. As noted then, the daily MACD & RSI have broken out showing underlying momentum, so we’ll see if it can make it up to that downtrend line next week.
More on Sunday.
Link to today’s posts - Neil Sethi (@neilksethi) / X (twitter.com)
To subscribe to these summaries, click below (it’s free!).
To invite others to check it out,


