Please excuse typos. Mornings are tilted more international, evenings more U.S. Continuing to try to make this more digestible for those who are not as familiar with the markets, lingo, etc. Feel free to leave your thoughts in the comments section, they are appreciated. Also, I don't discuss crypto extensively as I don't consider myself knowledgeable enough to talk intelligently on the subject (and there are plenty of other sources for that).
A small glossary. Feel free to inquire about any other terms used.
SPX = S&P 500 Naz = Nasdaq Composite NDX = Nasdaq 100 (100 largest stocks in the Naz) RUT = Russell 2000 (smaller stocks) DMA = Daily Moving Average (the moving average over the given time period (20, 50, 100, 200 days normally)) MACD = Moving Average Convergence Divergence (basically a trend indicator) RSI = Relative Strength Index (basically what it sounds like)
Also, on my charts, the lines are 20-DMA (green), 21-DEMA (red), 50-DMA (purple), 100-DMA (blue), 200-DMA (brown)
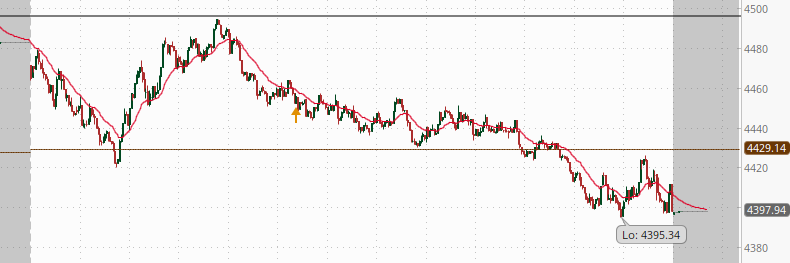
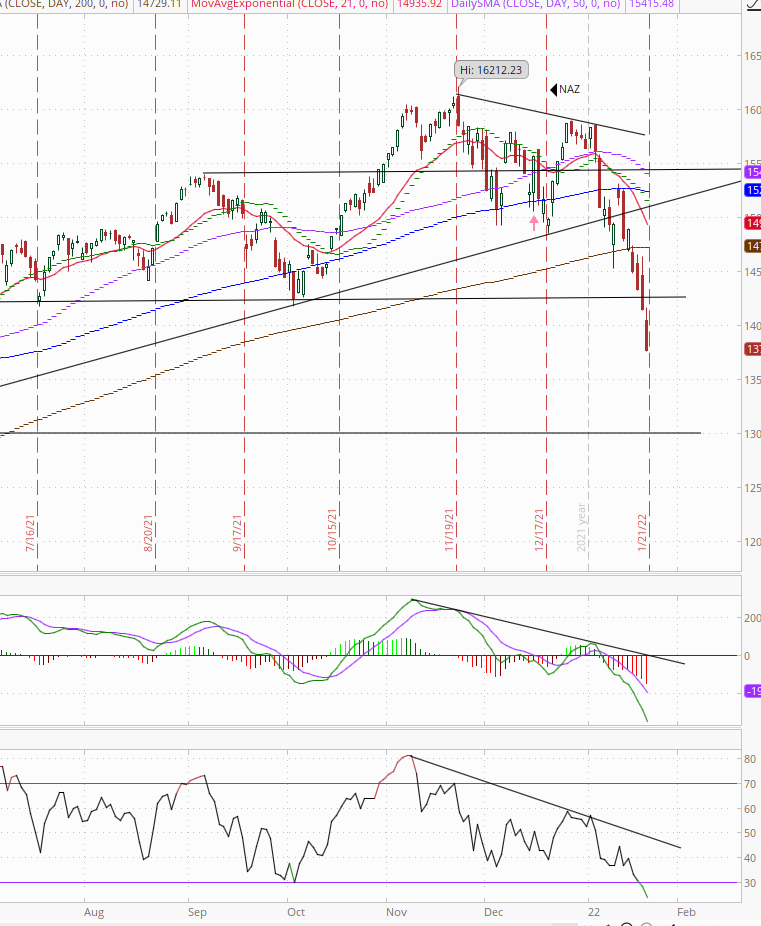
Stocks started the day a little different, but after about 11 am it was a familiar story. Equities started the day lower (they’ve been working higher each morning the last few days) before bouncing when the SPX hit the 200-DMA. They made it basically back up to even levels (some indices were even green) but they stopped right when the SPX made it to the level of the December lows when they turned again, falling all afternoon and finishing near the lows and beneath the key 200-DMA. Here was a chart of the SPX today (200-DMA is the brown line (lower line); the black line is the level of the December lows).
As I’ve said the past couple of days, it’s pretty clear we’re into a period of technical selling as we’ll again talk about more below (again). And the problem is, as I’ve noted repeatedly now, these things sort of go until they stop, so now we’re in no small part at the mercy of algorithms. It doesn’t help that we’re in the middle of the corporate buyback blackout period, so we’re missing a big buyer that would soften things, nor does it help when you have a former high flyer in Peloton and a fan favorite (and huge market cap stock) in Netflix dropping like penny stocks.
But the headlines were a little more correct today as while there was was broad based selling with even energy falling -2%, tech got the worst of it today. In index terms Naz and NDX were down -2.75%, RUT was down -1.8% and the SPX -1.9%. This capped the worst week since March 2020. The SPX fell -5.7% in four days. Thank goodness the markets were closed Monday (yeah, MLK day seems like weeks ago to me too).
More than $1.7 trillion in value has been erased from the Nasdaq 100 in January. Many of the biggest are due to report next week. Maybe that can help change the narrative, but if they miss… look out below.
Commodities were mostly red, and the dollar was stronger. Longer yields fell for a third day and finished the week down for the first week in five. We’ll go through all of this in more detail below.
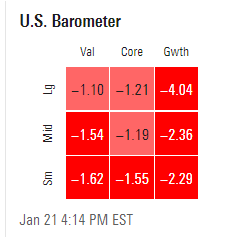
Style box deteriorated again today, with big cap growth hammered (although I wonder how much is due to NFLX).
And Charlie McElligott did confirm that it was indeed systematic strategies at play again yesterday and this morning which pushed things lower started by the Peloton news. HR.
“[U]nicorn books are finally getting an MTM ‘come-to-Jesus’ which is crushing performance for many funds instead of previously carrying it,” he said. The Peloton news thus injected a new dose of unadulterated fear into richly-valued growth names. From there, things snowballed. Around 20 minutes later, the 100-DMA fell for minis, which McElligott described as the “first ‘ruh roh.'” Until then, dealer hedging was supportive for equities.
At that point, Nomura’s “internal Equities Futures ‘pressure’ / imbalance monitors began showing [the] same heavy ongoing ‘VWAP-style’ de-risking seen in prior days, hitting bids, particularly in ‘large lots,’ meaning big institutional / asset manager-type size,” McElligott went on to say, noting large sell programs starting around 2:30 ET and escalating into the cash close.
The “kill shot,” he wrote, was the S&P’s approach to the CTA sell trigger level noted here on Thursday morning. McElligott flagged that level earlier in the day. Apparently, his BBG chats lit up on the approach. “Traders were clearly keying on it and front-running it,” he said Friday, adding that once 4,507 fell (possibly triggering some $25 billion in estimated CTA de-leveraging), 4,500 was a sitting duck. That was the largest gamma strike. “[T]hat spot level also saw us near [Thursday’s] point of Dealer ‘max short Gamma,’ in the area of -$22B per 1%,” Charlie remarked, before calling the Netflix guidedown the “coup de grace.”
And traders probably want to buckle up for Monday as today we dropped $2B in net delta according to Brent Kochuba of options analytic service SpotGamma. Single stock options totaling about $1.28 trillion were set to expire today. That represents nearly 40% of the total open interest on a notional basis. RTRS. As we’ve discussed previously, a big drop in net delta (which should mean a big drop in gamma) will “free” the markets to move more which can lead to bigger moves in both directions. Not that we haven’t been seeing that already this week.
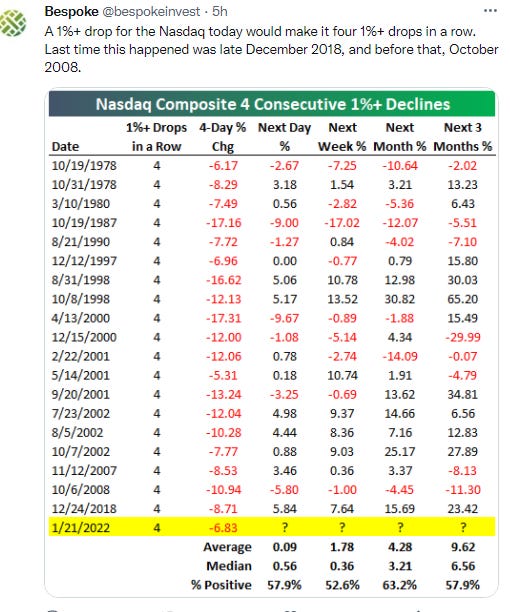
And if you’re wondering “when was the last time the Naz was down -1% four days in a row?” Bespoke has your answer.
But looking on the bright side (sort of) the VIX has inverted which has presaged reversals in the past. BBG.
Selling has gotten intense enough in stocks that volatility indexes are pricing more turbulence in the here and now than in the future. The setup, known as an inverted VIX, is sometimes viewed as a positive for those hoping markets will calm. Such an inverted curve has occurred four other times in the past year and all coincided with market bottoms.
“Into the open today, we were looking for indications of panic readings for a more tradeable bottom ahead,” said Alon Rosin, Oppenheimer & Co.’s head of institutional equity derivatives. “Between the TICK/TRIN readings during the morning flush and VIX inversions, it is possible that fear, panic has finally arrived.”
Major Market Technicals
SPX fell beneath the 200-DMA as noted above. Daily technicals remain negative, but RSI now as oversold as it’s been since February 2020.
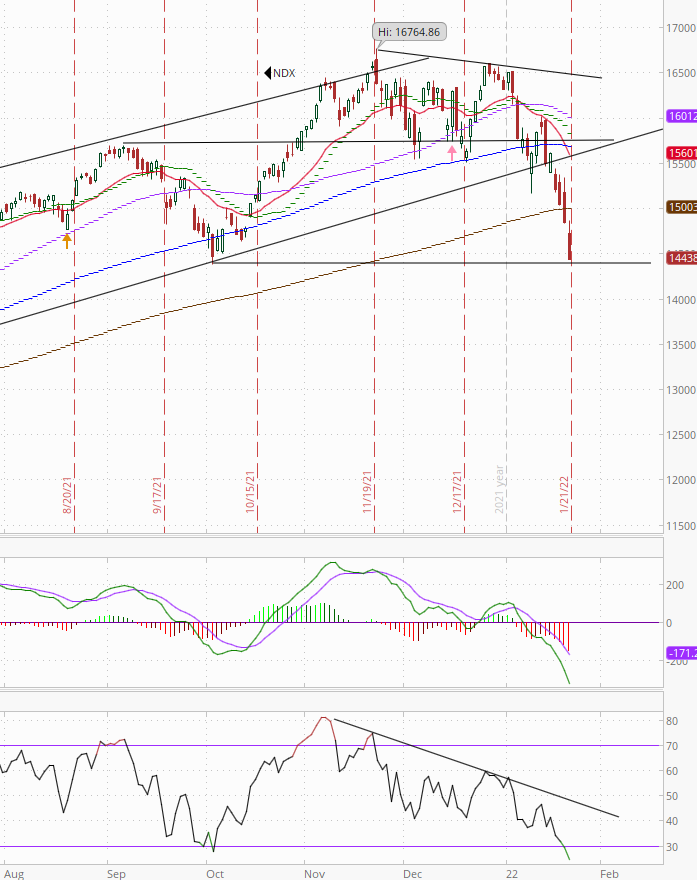
NDX well under the 200-DMA and is coming up on the October lows. Daily technicals very negative with its RSI actually just below the Feb 2020 levels. Wow.
Naz fell below that support level we noted. Technicals negative here also, but it’s also as oversold as it’s been since Feb 2020. Not a lot of support anywhere close.
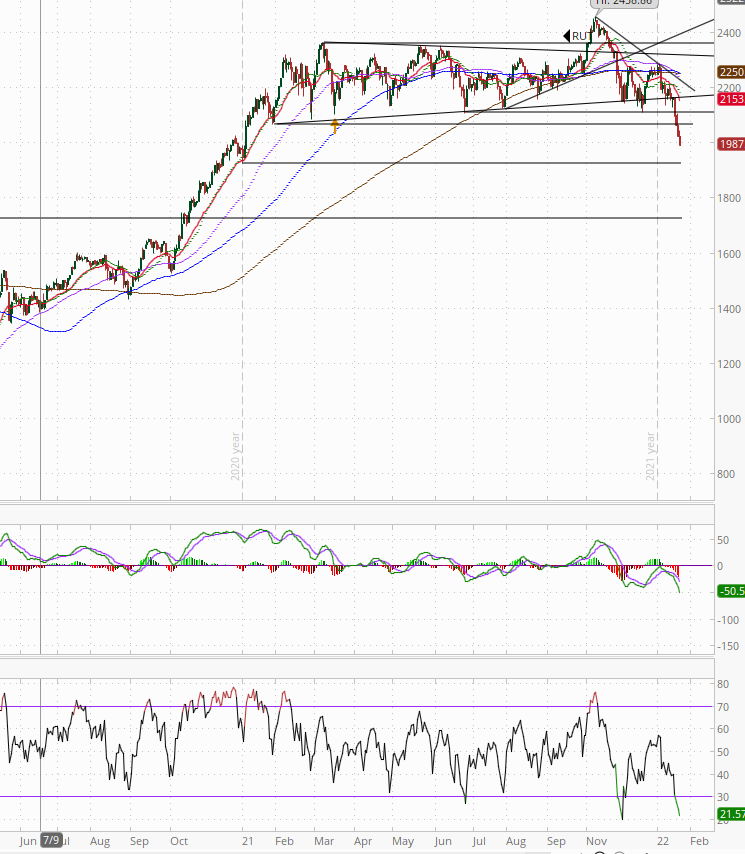
RUT remains in free fall. As you can see from this longer term chart, not a great place for it to naturally bounce from. Daily technicals negative.
SPX Sector Flag
Another weak SPX sector flag. No green sectors, eight sectors down around -1% or more (five yesterday) and while none were down more than -2% yesterday, six were down at least -1.9% today and two were down over -3%. Every sector other than energy is down YTD.
SPX Sector Technicals Rankings
These are NOT necessarily in the order that I like them for investment but how their underlying technical fundamentals stack up with a focus on resistance levels, MACD, and RSI. I do often buy calls though when I upgrade a sector. Going to keep playing with the groupings so bear with me. Changes are in bold.
More deterioration but no changes. Comm’s though very close to being moved to the lowest rung, I’ll give it another couple of days. Weekly technicals ok for energy, utes, and staples, all the rest are negative.
- Sectors with good/ok technicals, above all significant resistance.
XLE - Energy - MACD go long, RSI negative divergence, above all MA’s.
- Sectors with mediocre to poor technicals but above all/most resistance.
- Sectors that look to have bottomed with positive technicals but below significant resistance.
- Sectors regrouping (negative technicals, short-term downtrend, long-term still positive/uptrend).
XLV - Health care - MACD go short, RSI negative, below 20, 50, 100-DMA.
XLK - Tech - MACD go short, RSI negative oversold, under 20, 50, 100-DMA.
XLY - Discretionary - MACD go short, RSI negative oversold, below all DMA’s.
XLC - Communications - MACD go short, RSI neutral, under all DMAs. On watch for downgrade.
- Sectors in poor shape (negative technicals in intermediate or long term downtrends (so expect further weakness for a while (bear market))).
None.
Key Subsectors
SOX (semis), IYT (transp), XBI/IBB (smaller/larger bios (smaller are more a general "tell" on speculative activity as opposed to health care)), XHB (homebuilders), XRT (retail)
All down again today (third day in a row), but losses were a little less today which is good. All were down between -1 and -2% except for XBI which was a little more than -2%.
And analysts say homebuilders might continue to struggle in the short term even though they have strong secular tailwinds. BBG.
Rate increases may weigh on the stocks of builders like D.R. Horton Inc. and Lennar Corp. as a leap in borrowing costs has the potential to deter homebuyers, who are also facing lofty housing prices. This helps explain why the S&P’s Supercomposite Homebuilding Index, which soared 49% in 2021 compared with a 27% jump in the S&P 500, has sunk more than 14% since the start of the year compared with a 4.9% drop in the broader market gauge through Wednesday’s close.
Analysts say the demand boom that’s boosted the real estate market won’t necessarily be dented, depending on how far and how fast rates climb. But the stocks may still face pressure. “We think history shows that a rising rate environment could be an overhang on stock performance,” Janney Montgomery Scott analyst Tyler Batory writes in a Thursday note about the stocks’ performance when 10-year yields increase. “However, we think there is less of an impact on housing fundamentals, which could present a buying opportunity for the sector.” As Evercore analyst Stephen Kim put it in a recent outlook note, “the specter of rising rates has the potential to overshadow the group’s impressive results” despite strong industry fundamentals. Kim, who has an outperform rating on all the builders he covers, added, “By year-end, we expect stronger earnings across the group to prevail, but the path forward for the stocks will be volatile, as pressure on valuation ebbs and flows with rate sentiment.”
Historically, homebuilder stocks have fallen during the Federal Reserve’s tightening cycles, according to KeyBanc Capital Markets analyst Kenneth Zener. In a note downgrading a handful of homebuilder and building products stocks, Zener pointed out that since 1969 builders have declined in 16 of 18 tightening cycles. They “face a Wall of Worry,” he writes, “as inflation concerns supersede favorable housing fundamentals.”
The rates for 30-year mortgages have at least another 50 basis points of room -- to approximately the 4% range -- before “we see some pause from buyers,” Wells Fargo analyst Deepa Raghavan said in a message last week, adding that level may not be reached before the midterm elections in the fall. “So no change to my bullish view of 2022 at all.” Builders are on fundamentally solid ground to face the potential oncoming rates storm, according to Reading. “Though growth may moderate, we expect absolute demand to remain steady and think still-solid pricing can offset costs,” he wrote. “Housing can absorb rising rates, assuming the increases are modest and gradual.”
Breadth
Breadth weak again. On NYSE volume was 22% positive and issues 24%. Naz was 33% positive volume, issues 28%. So still no positive divergence here. Just lots of selling.
But one positive is the new lows on the Naz decreased the last two days. So that is a positive divergence.
Commodities/Currencies/Bonds
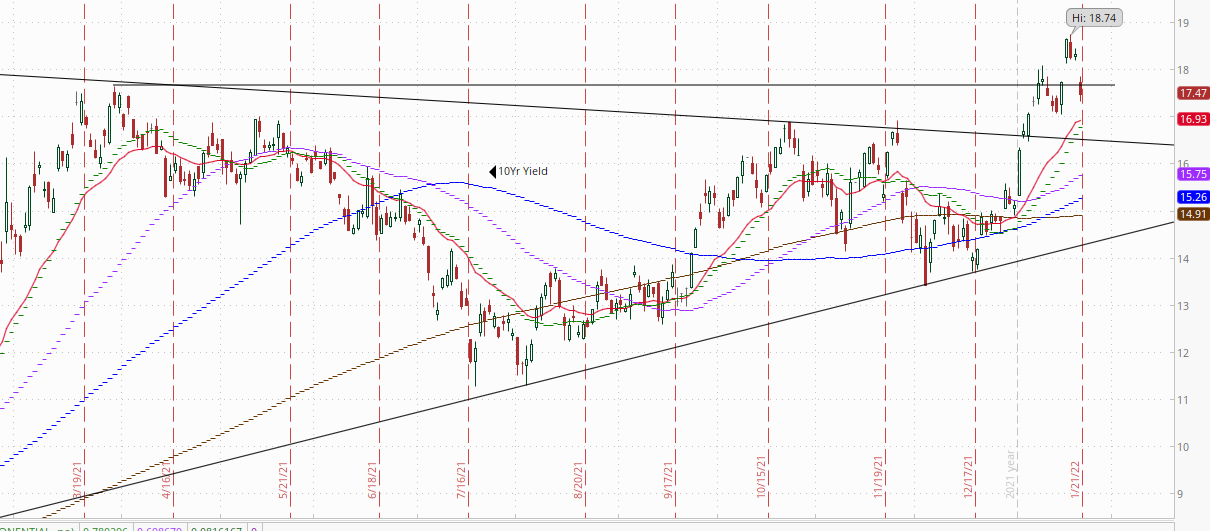
Bonds - As noted, shorter bond yields rose flattening the curve. 2-year yields were up four basis points to 1.08% (new post-Feb 2020 closing high), 5-year yields were flat at 1.62% (1.65% is post-pandemic high), 10-year yields also flat at 1.83% (1.87% is highest since Jan 2020), and 30-year yields also flat at 2.14% which remains in the middle of the range of 2021 (low is 1.64%, high was 2.52%). The inversion with the 20-year at five basis points (remains below the high of 2021 of nine).
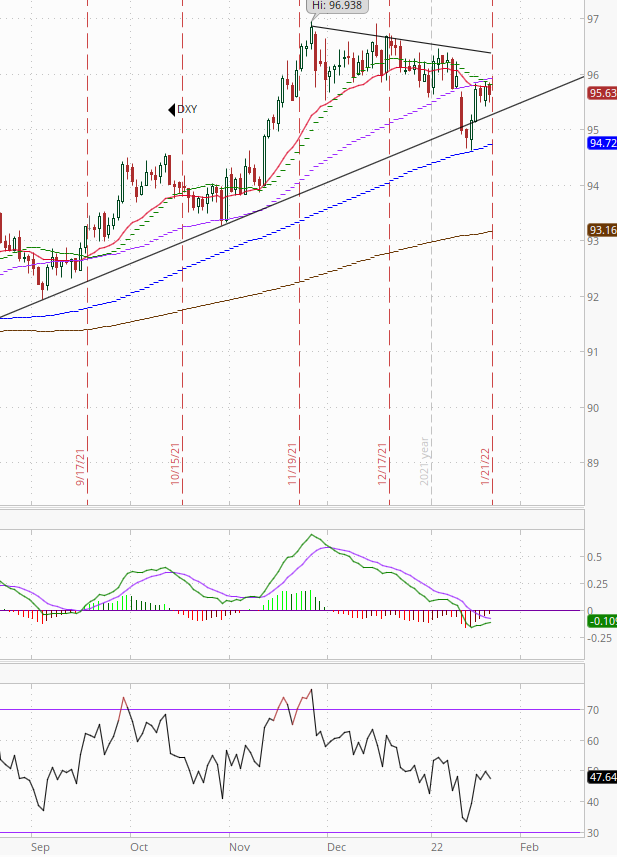
Dollar (DXY) - Down a little today remaining capped by the 20 and 50-DMAs. Finished at $95.64. Intermediate-term uptrend. Daily technicals negative but improving.
VIX - Finally pushed up to the 30 area (high was 29.79. Finished at 28.85.
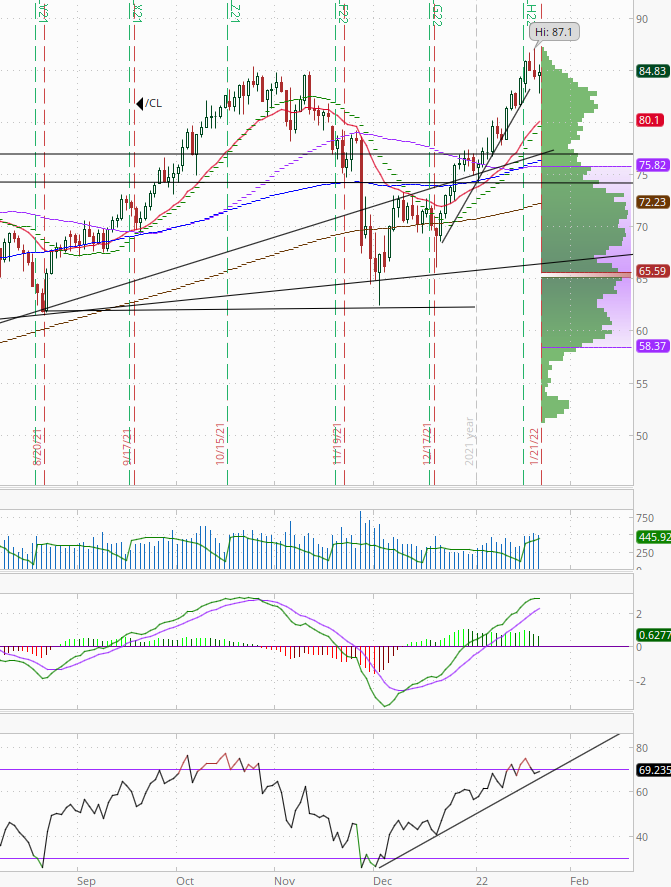
Crude (/CL) - Ended down but well off the lows and up for the week, the fifth straight. Finished at 84.83 WTI. Daily technicals remain positive.
As the better weather forecasts, which have pummeled natural gas this week, also hit diesel futures as the oil for heating trade loses steam. BBG.
The premium on the nearest U.S. diesel contract collapsed on Thursday by the most since April 2020 as milder weather next month may reduce its demand for heating. The so-called prompt spread between front-month and next-month diesel futures traded 1.16 cents lower at about 4.43 cents per gallon at 3:15 p.m. on the New York Mercantile Exchange. That’s just one day after it reached the most bullish structure since 2015. The narrowing spread could signal a possible break in diesel’s rally, with temperatures expected to rise by early next month, reducing demand for the petroleum distillate that’s used both to fuel trucks and heat homes. But diesel stockpiles have remained low on the East Coast despite rising imports, which supports prices. U.S. refiners also cut diesel yields last week in favor of making more gasoline. U.S. diesel retail prices hit $3.643 per gallon Thursday, approaching the highest level since October, 2014, according to auto club AAA.
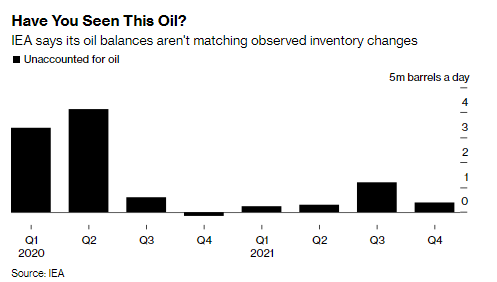
As IEA searches for the missing barrels. BBG.
The International Energy Agency is trying to figure out where 200 million barrels of oil went. The adviser to energy-consuming nations said on Wednesday that observable global oil inventories plunged by more than 600 million barrels last year. That would be fine were it not for the fact -- based on its estimates of supply and demand -- that the decrease should only have been 400 million. There is always a gap between the two, but the 200 million barrel discrepancy means the oil market could be tighter than previously thought.
The gap could be a result of underreporting of demand or over-reporting production, the IEA said. While the balance of supply and demand may be one cause of the mismatch, there could be others too. The agency uses satellite data to track oil stockpiles, for example -- but that doesn’t extend to the barrels used to fill pipes or those stored in huge underground caverns. There are also issues with reporting. While huge emphasis is placed on stockpiles in OECD nations -- the IEA’s core reporting area -- there are burgeoning volumes outside the region that go unreported, particularly in China.
And a little more on the Morgan call for $100 oil noted this morning.
Jan 21 (Reuters) - Morgan Stanley expects Brent crude oil prices to advance to $100 a barrel in the second half of this year, with the market heading for a simultaneous “triple deficit” of inventories, spare capacity and investment. “The key oil products markets (gasoline, jet fuel and gasoil/diesel) all show strong crack spreads, steep backwardation and inventories that have fallen to low levels. None of this signals weakness,” it said in a note.
The bank raised its price forecasts for Brent crude to $100 a barrel for the last two quarters of the year, up from the $90 and $87.50 previously estimated for the third and fourth quarters respectively. Morgan Stanley’s projection chimes with those of other investments banks, including Goldman Sachs, in predicting oil prices could hit $100 per barrel this year.
Nat Gas (/NG) - Bounced back after falling -11% previous two days, but remained below the 20 and 200-DMAs. Finished at $3.96. Daily technicals positive for now.
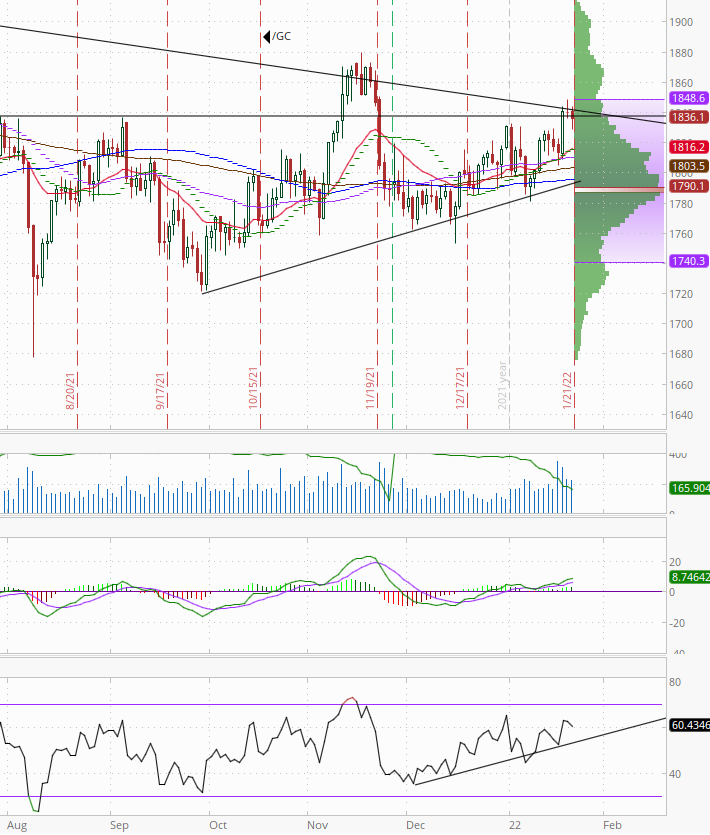
Gold (/GC) - Fell back for a second day. Finished at $1836. Daily technicals positive.
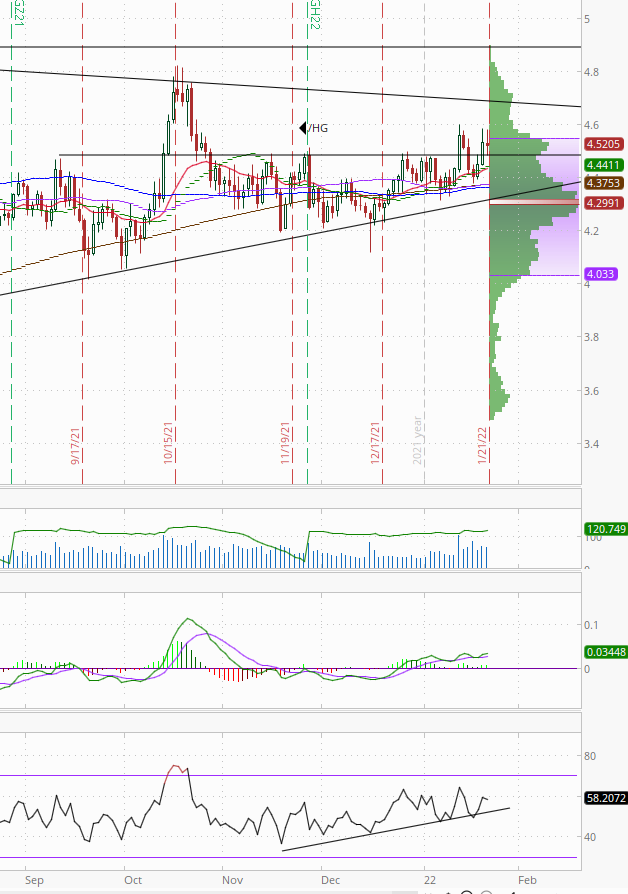
Copper (/HG) - Down today but remains in the “new” range of the last week. Daily technicals tilt positive.
U.S. Data
Did report on Leading Economic Indicators for December.
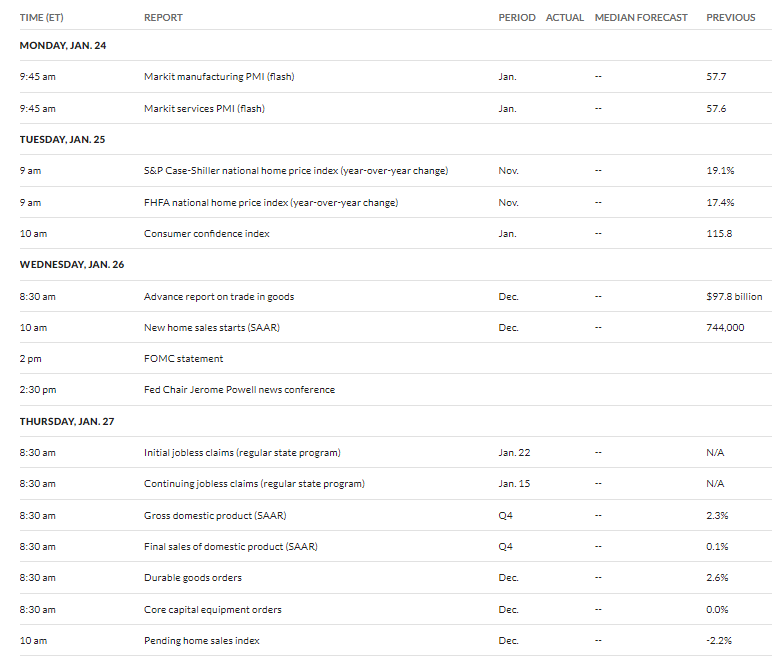
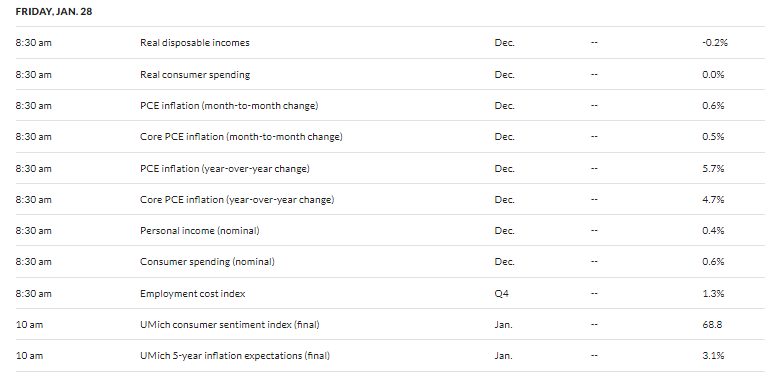
The headline event for next week will be the Fed statement and press conference on Wednesday. I’m looking at that as a potentially bullish catalyst (I would be very surprised if they were somehow more hawkish than current expectations). But we also get key data points with flash PMI’s, consumer confidence, new home sales, first look at Q4 GDP, and personal income and spending along with PCE (prices). I’m thinking these might disappoint based on what we’ve seen in recent reports.
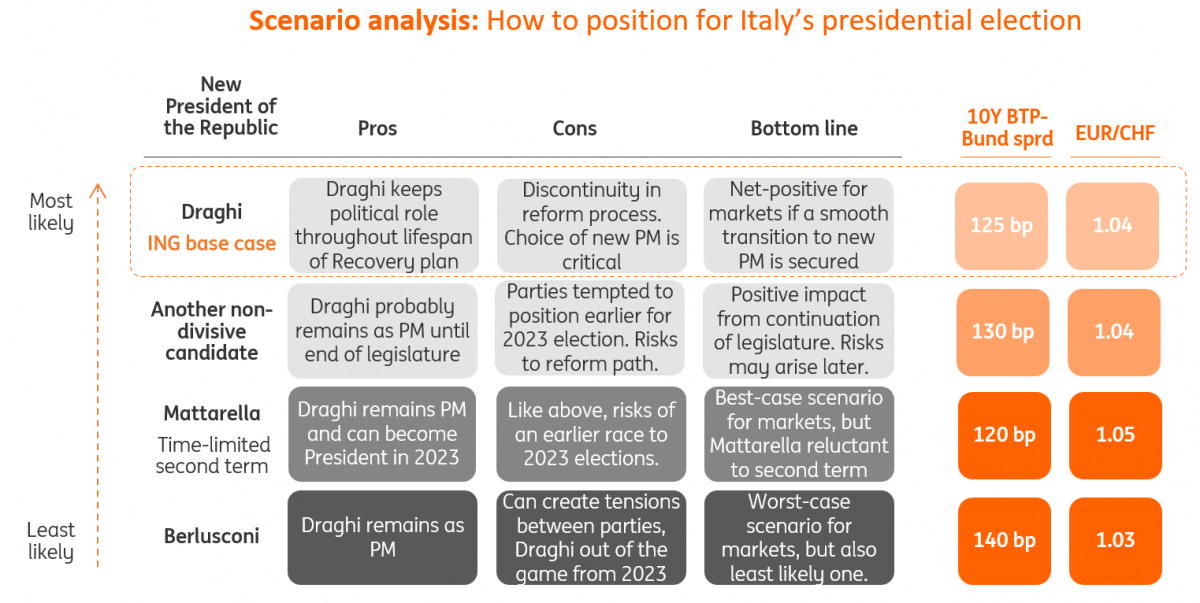
Internationally, a big focus will be the Italian Presidential elections which begin on Monday. Mario Draghi is the odds-on favorite. Note this was from early in the week, and I believe Berlusconi has pulled out. ING.
The voting process involves all MPs from both branches of the Italian parliament and representatives from regional administrations, with a total of 1,008 “great electors”. The electoral process, with a secret ballot every day, will end once a candidate manages to reach the required majority. In the first three ballots, a qualified majority of at least two-thirds of potential votes (673 votes) will be needed to win, from the fourth ballot onwards the absolute majority (505 votes) will be enough.
Typically, the outcome of presidential elections has been the result of cross-party agreements, which do not necessarily materialise at the very start of the voting process. Only twice in the Italian republican history has a winner come out in the first ballot, and one of them was the election of Carlo Azeglio Ciampi, former governor of the Bank of Italy and prime minister.
To give some context, the president of the Italian Republic has no political decision-making power, although it is a role that can become increasingly important in periods of political instability (such as in the past few years) as it is ultimately the president that gives the mandate to a specific political leader to form a government. The president also has a say on the choice of ministers.
As we write, no agreement has yet been reached on a name that is acceptable to an ample spectrum of parties. We believe that the most likely outcome will be the choice of a non-divisive candidate, with a strong institutional background, and, possibly, with strong international credibility. Such a candidate could get sufficiently ample parliamentary support. Mario Draghi would probably best fit these requirements, but other names could eventually emerge as alternatives.
Other international items will be flash PMI’s, IFO business survey, Bank of Canada’s meeting (Wednesday), and French and German GDP.
And earnings season will move up another gear. I believe next week is the biggest week for reports in terms of market cap (if not it’s the following week) but I’ll have a list of key reports on Monday. Importantly, I believe we will get a lot of the big tech companies reporting. That may serve as a positive (or negative) catalyst to either stop (or fuel) the selling in growth stocks.
Overall
So in hindsight I did a really bad job this week, and I apologize if anyone tried to step in front of this train based on my incessant calling for an oversold bounce (which we in fairness did get but you had to be very nimble to do anything with). I guess I’m just a little out of practice on a “real” selloff (not the little dips we saw last year). The funny thing is I was pretty sure a period like this was coming (average pullback in a midterm year is -16% and we’re overdue for a 10+% correction), but I was expecting it later in the year when the Fed actually said they were implementing balance sheet runoff and more than three rate hikes, not on market speculation. That said, we’re still not even down -10% on the SPX (-8.7% from the highs), so at this point it’s just a little bigger than what we saw last year.
But in thinking more about this, I should have known that the market always takes things to the extreme incorporating a discount for the worst possible outcome (which at this point sounds like it’s five or six rate hikes and balance sheet runoff in 2022?). The good news, as I indicated yesterday, is that this gives the Fed plenty of opportunity to be less hawkish than feared which is what I think might be what’s required to get us back on track (solid earnings next week wouldn’t hurt either) shorter term.
As it appears the repeated selling of attempted rallies now has investors in a different mindset:
“It used to be fear of missing out, now it’s fear of bag holding,” said Danny Kirsch, head of options at Cornerstone Macro LLC. “Investors are using any sort of rally to exit stocks, as opposed to chasing higher.”
It will take something very positive to break through that if that is in fact how investors will navigate for the time being. And with January data likely to be disappointing due to Omicron and supply chain impacts, if the Fed and earnings don’t do it, it could be into next month before we really can get some traction to the upside.
But, anyway, turning to more immediate matters, as noted above we dropped a lot of gamma today which “frees” markets to move even more next week. My fear is that we’ve flipped so many systematic strategies into sell mode that we will go further before it exhausts itself, especially as volatility continues to move higher with these -1% moves.
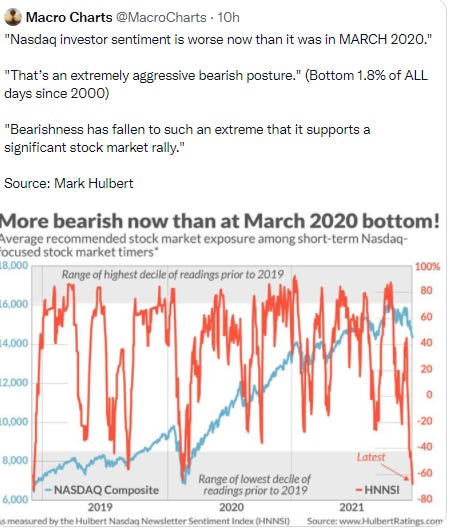
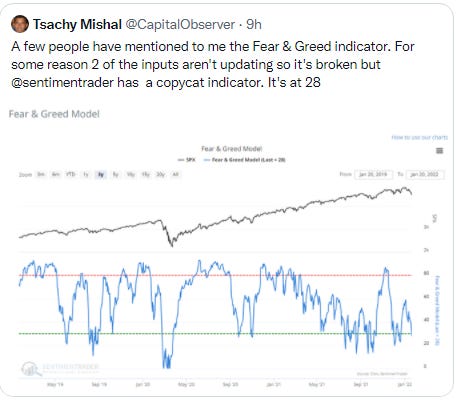
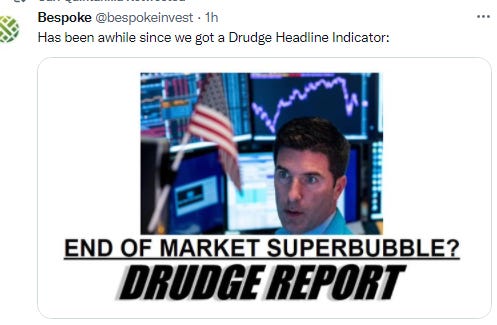
At least we did finally get a VIX moving to around the 30 level (I’d imagine it will spike higher on Monday), and we’ve got lots of the types of things you see near bottoms (and if you’ve been checking the Fear and Greed indicator definitely read the one tweet):
And we talked about the AAII and II surveys yesterday. And as I mentioned in the technical section, the RSI’s are at or below the level of February 2020. So, again, the ingredients are all there for some type of bounceback. Just need to see if we can those ingredients to bake (or mix or whatever, I don’t cook much so not sure what the right metaphor is here). Anyway, rest up, next week will not suffer for things to move the markets.
Misc.
Other random stuff.
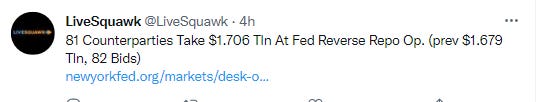
As repos push over $1.7T, highest of the year edging closer to their record spike on Dec 31st to just over $1.9T.
As new evidence confirms the vaccines provide great protection against severe disease from Omicron and decrease chances of symptoms. BBG.
Booster doses of Covid-19 vaccines increased protection against both the delta and omicron variants in three studies that looked at infections, hospital admissions and deaths in thousands of U.S. patients. Third doses of messenger RNA vaccines made by Moderna Inc. and the partnership of Pfizer Inc. and BioNTech SE were at least 90% effective in preventing hospitalizations during both the delta and omicron periods, according to an analysis of hundreds of thousands of hospitalizations and clinic visits. The shots’ protection against Covid deaths was diminished after omicron’s rise, but remained significant, according to a separate study from the U.S. Centers for Disease Control and Prevention.
The hospitalization study, published in CDC’s Morbidity and Mortality Weekly Report, analyzed more than 300,000 visits for Covid-like illness in emergency departments, urgent care clinics, and hospitalizations in 10 states between August and January. Boosters reduced hospitalization risk by 94% in the delta era, and by 90% after omicron’s rise. In the other study published by CDC, unvaccinated people had 53 times greater risk of death from Covid during October and November compared with those who were vaccinated and boosted. The increase in risk for the unvaccinated fell to 13 times during the rise of omicron, which has shown ability to evade the protection offered by vaccines.
Boosters were further supported by a third study that found the extra doses provide significant protection against symptomatic Covid caused by both delta and omicron. People who received a third dose were less likely to seek care for symptomatic infections than those who received just two or none, according to the study in the JAMA medical journal.
And Germany not only won’t send weapons to Ukraine, but it also has blocked Estonia from doing so. WSJ.
Germany is blocking North Atlantic Treaty Organization ally Estonia from giving military support to Ukraine by refusing to issue permits for German-origin weapons to be exported to Kyiv as it braces for a potential Russian invasion. Unlike the U.S., Britain, Poland and other allies, the German government has declined to export lethal weapons directly to Ukraine. In the case of Estonia, a small country on Russia’s northern border, Berlin is also refusing to allow a third country to send artillery to Ukraine because the weaponry originated in Germany, according to Estonian and German officials. The issue is being seen by Western security specialists and Ukraine as a test of Berlin’s arms-transfer policy during a mounting crisis in Europe and points to the difficulties the U.S. and its European allies are facing in forging a common response to Russia’s military buildup near Ukraine and demands. German officials said the impasse results from a longstanding policy regarding arms exports to tense regions.
As Canadian retail sales also weak in December and missed estimates for November.
To see more content, including summaries of most major U.S. economic reports and my morning and nightly updates go to Neil’s Newsletter | Neil Sethi | Substack for newer posts or https://sethiassociates.blogspot.com for the full history.