Please excuse typos. Mornings are tilted more international, evenings more U.S. Continuing to try to make this more digestible for those who are not as familiar with the markets, lingo, etc. Feel free to leave your thoughts in the comments section, they are appreciated. Also, I don't discuss crypto extensively as I don't consider myself knowledgeable enough to talk intelligently on the subject (and there are plenty of other sources for that).
A small glossary. Feel free to inquire about any other terms used.
SPX = S&P 500 Naz = Nasdaq Composite NDX = Nasdaq 100 (100 largest stocks in the Naz) RUT = Russell 2000 (smaller stocks) DMA = Daily Moving Average (the moving average over the given time period (20, 50, 100, 200 days normally)) MACD = Moving Average Convergence Divergence (basically a trend indicator) RSI = Relative Strength Index (basically what it sounds like)
Also, on my charts, the lines are 20-DMA (green), 21-DEMA (red), 50-DMA (purple), 100-DMA (blue), 200-DMA (brown)
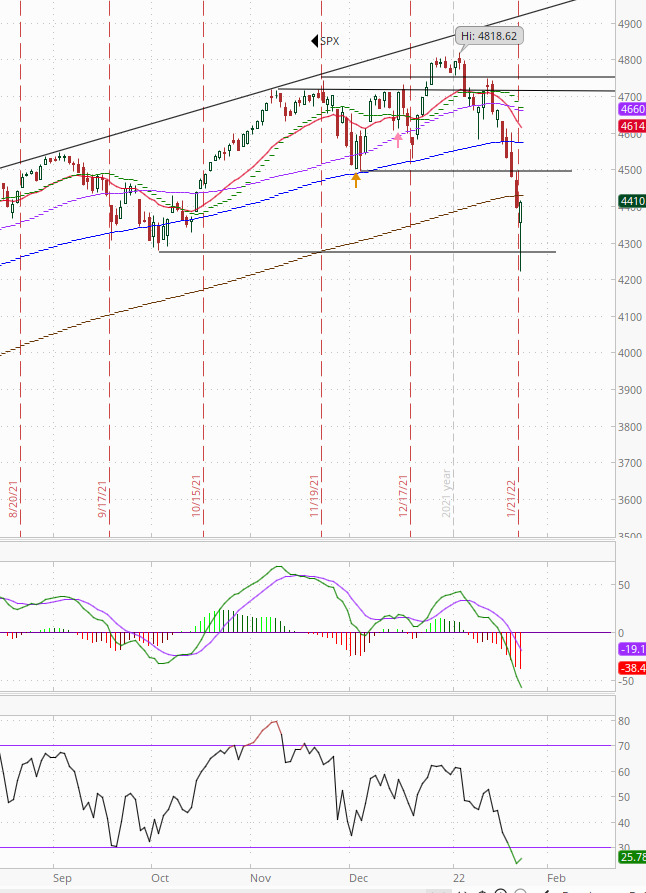
Well, that was quite a day wasn’t it? I recommended on Friday to “rest up, next week will not suffer for things to move the markets.” In case you’re just checking in from being off the grid all day, I’ll give you a quick reprise. As we saw Friday, stocks started the day lower (chalked up to the same issues as last week with a kicker of increased Russia/Ukraine tensions), fell until around 10 am when they tried a rally which was sold (like Friday), and from there they headed south (like Friday) but this time they picked up steam with the major indices all falling to 3-4% losses on the day by the noon hour (EST). But today we saw something a little different as equities rallied from that point to end the day with gains led by small caps. Here was a chart of the SPX today (200-DMA is the brown line (top line); the black line is the level of the October lows).
I had said (based on Charlie McElligott’s work) that the dropping of the large amount of options delta on Friday meant today could be volatile, but this was certainly more than I was expecting. I also have noted previously that systematic selling sort of goes until it doesn’t (i.e., until enough hedges have been monetized, etc., that the selling dries up). So was the low today the point of the selling being “done”? More on that later, but the short answer is I really have no idea. What I do think, though, is that things will likely remain volatile at least through the Fed meeting.
At the end of the day it was the RUT leading up a slightly amazing 2.3%, Naz was up six tenths of a percent, NDX half percent, and SPX around three tenths. At the lows today the SPX was in a technical correction (down over -10% from the highs(-12.4%)) and the RUT a bear market (down -20%). Naz couldn’t quite get to the bear market territory, down -19.2% at the lows, but close enough for me.
Commodities were mixed, and the dollar was stronger. Bonds were surprisingly little changed. We’ll go through all of this in more detail below.
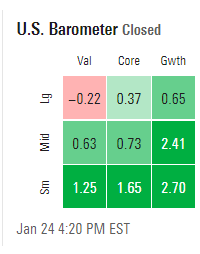
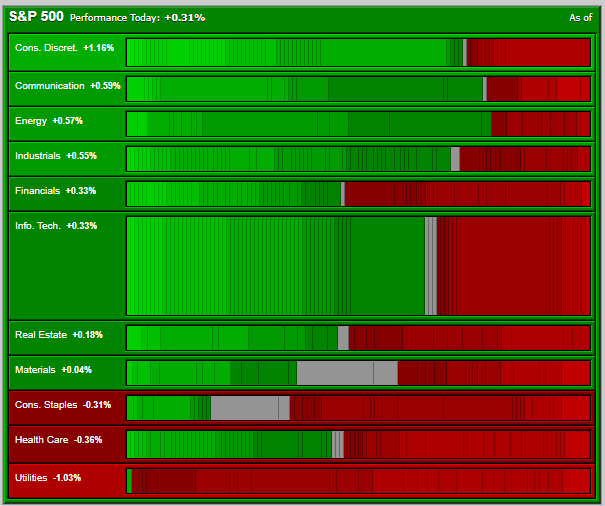
Style box tilted to beta today (growth and small caps).
As not helping sentiment in the morning was the fact that hours before a big miss on the flash PMI’s (more on that below) the increasingly bearish Mike Wilson of Morgan Stanley was out with a note entitled “Winter is Here” where he said that falling PMIs evidencing flagging growth would lead equities down. BBG (the BBG article also noted the take from David Kostin of Goldman, so I added that also).
One after the other, stock market bears say their calls have finally been vindicated. Morgan Stanley’s Michael Wilson is the latest to claim his warnings were spot on. The strategist, who has long been a skeptic of the rally that pushed U.S. equities to successive records, said Monday that January’s rout “fits nicely” with his so-called fire and ice narrative, according to which markets were set for a drawdown amid tighter monetary policy and decelerating growth. If anything, the retreat has further to go, Wilson and his colleagues wrote in a note, borrowing again from Game of Thrones to warn that “winter is here,” with concerns about a slowing economy due to the “natural ebbing of the cycle” poised to take over from jitters over Federal Reserve policy as the main force pulling stocks lower. “We have been monitoring PMIs and earnings revisions breadth for signs the slowdown is bottoming, but it has quite a bit further to go, in our view, and equity markets are not yet priced for it,” the Morgan Stanley strategists said. “It’s too early to get bullish.”
Meanwhile, the earnings season so far has failed to assuage growing pessimism about the macroeconomic outlook. Goldman Sachs Group Inc. strategists said Monday that guidance for the months ahead has been “disappointing,” as only one S&P 500 company -- Micron Technology Inc. -- has both beaten earnings estimates and raised its outlook. Markets are increasingly concerned that a more hawkish shift from the Fed could hit earnings growth, Goldman strategists led by David Kostin wrote in a note. “Investors will require a catalyst in the near-term to add length, but few obvious catalysts are evident in the near-term,” they said.
When it comes to places to hide amid a deteriorating backdrop, Morgan Stanley’s Wilson reiterated his recommendation for value stocks with a defensive bias. Goldman’s team favors stocks with high pricing power, while JPMorgan Chase & Co.’s Mislav Matejka said European and U.K. stocks that are less vulnerable to rising rates are “looking interesting” versus the U.S.
And here’s a graph from the report courtesy of HR. He also noted Wilson’s concerns about double ordering as a potential issue, and a line not in the BBG piece - investors should “hunker down for a few more months of winter as slowing growth overtakes the Fed as the primary concern.”
And other strategists who were calling for selling see more ahead. BBG.
With the S&P 500 sliding more than 10% from recent records, bears from the likes of Mizuho International Plc and Bank of America Corp. warn of fresh selling to come as growth momentum eases just as the Federal Reserve amps up borrowing costs. “There’s probably more downside over the next few months as the market adjusts to the reality of the Fed removing accommodation, earnings slowdown and much less federal stimulus,” said Ed Clissold, the chief U.S. strategist at Ned Davis Research, who late last year predicted a double-digit drop in stocks and today is warning of a correction on the order of 20% from the early January peak. The S&P 500 could slide another 12% as a “tightening tantrum” gathers pace, according to Mizuho strategists who came into 2022 warning of a 10% to 15% plunge in the second quarter, if not sooner.
“We can see this downward pressure on the equity markets being relatively sticky unless there is a catalyst for a much less hawkish Fed and general global central bank reaction,” said Peter Chatwell, head of multi-asset strategy at Mizuho. “The market stress scenario is what we think is happening now.” The first half of the year could see the S&P 500 plumb a bottom as low as 3,800, down 12% from current levels. The Nasdaq 100 may trough around the 12,000 level, a fall of about 15%, Chatwell said.
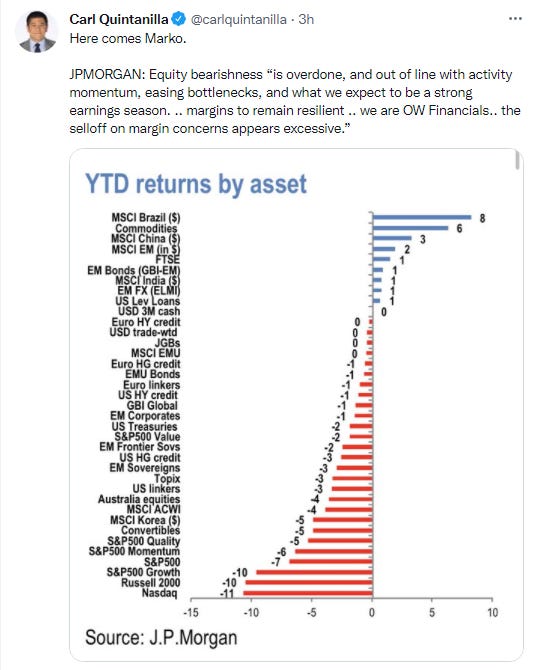
But Marko Kolanovic continues to stay constructive.
Major Market Technicals
SPX fell beneath the October lows before rallying with a ridiculous looking candle (lots of those today). Wasn’t able to get over the 200-DMA though. Daily technicals remain negative, but RSI is looking to turn up from deeply oversold levels.
NDX also fell under the October lows before recovering them. Daily technicals similar to SPX.
Naz fell close to May lows before recovering.
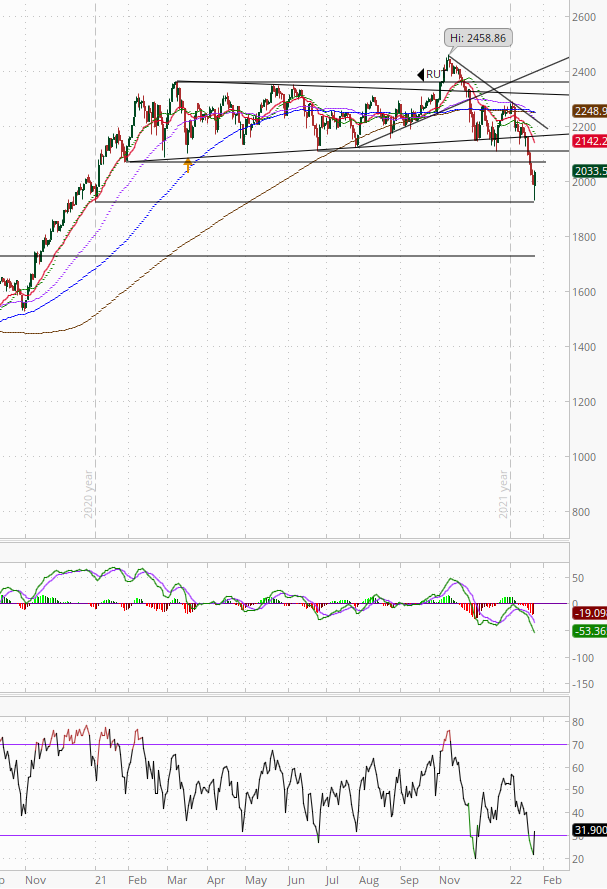
RUT bounced near the January 2021 lows.
SPX Sector Flag
Decent SPX sector flag with eight green sectors (none on Friday). One (discretionary) was up over 1%. One sector was down -1% which was interestingly utilities. All three red sectors were defensives.
SPX Sector Technicals Rankings
These are NOT necessarily in the order that I like them for investment but how their underlying technical fundamentals stack up with a focus on resistance levels, MACD, and RSI. I do often buy calls though when I upgrade a sector. Going to keep playing with the groupings so bear with me. Changes are in bold.
Huge reversal candles on all of the sectors but none were really able to change the overall negative technical conditions.
- Sectors with good/ok technicals, above all significant resistance.
XLE - Energy - MACD go long, RSI negative divergence, above all MA’s.
- Sectors with mediocre to poor technicals but above all/most resistance.
- Sectors that look to have bottomed with positive technicals but below significant resistance.
- Sectors regrouping (negative technicals, short-term downtrend, long-term still positive/uptrend).
XLV - Health care - MACD go short, RSI negative, below all-DMAs.
XLK - Tech - MACD go short, RSI negative oversold, under 20, 50, 100-DMA.
XLY - Discretionary - MACD go short, RSI negative oversold, below all DMA’s.
XLC - Communications - MACD go short, RSI neutral, under all DMAs. On watch for downgrade.
- Sectors in poor shape (negative technicals in intermediate or long term downtrends (so expect further weakness for a while (bear market))).
None.
Key Subsectors
SOX (semis), IYT (transp), XBI/IBB (smaller/larger bios (smaller are more a general "tell" on speculative activity as opposed to health care)), XHB (homebuilders), XRT (retail)
All were down early and were able to rally to good to great gains. Retail led up 6%(!). Homebuilders up over 3%, XBI up over 2%, semi’s up over 1% and IBB and transports up just under 1%.
Breadth
Breadth was not great for a solidly green day but it was a crazy one so I’m not reading too much into it. Still, breadth has been very weak coming in, so this doesn’t change the overall negative breadth picture. On NYSE volume was 44% positive and issues 42%. Naz was 52% positive volume, issues 46%. So still no positive divergence here. Just lots of selling.
And while not related to breadth, there was quite a bit of volume today.
Commodities/Currencies/Bonds
Bonds - Shorter yields declined marginally while longer yields were flat steepening the curve a bit. 2-year yields were down two basis points to 0.99% (1.08% is post-pandemic high), 5-year yields were down one to 1.53% (1.65% is post-pandemic high), 10-year yields flat at 1.75% (1.87% is highest since Jan 2020), and 30-year yields up three to 2.10% which remains in the middle of the range of 2021 (low is 1.64%, high was 2.52%). The inversion with the 20-year at five basis points (remains below the high of 2021 of nine).
And we had a pretty strong 2-year auction today which traded through (lower yield) the when issued by a full basis point. Also bid-cover much higher than previous.
Dollar (DXY) - Up today as it continues to track the rising 50-DMA. Finished at $95.89. Intermediate-term uptrend. Daily technicals just turning positive.
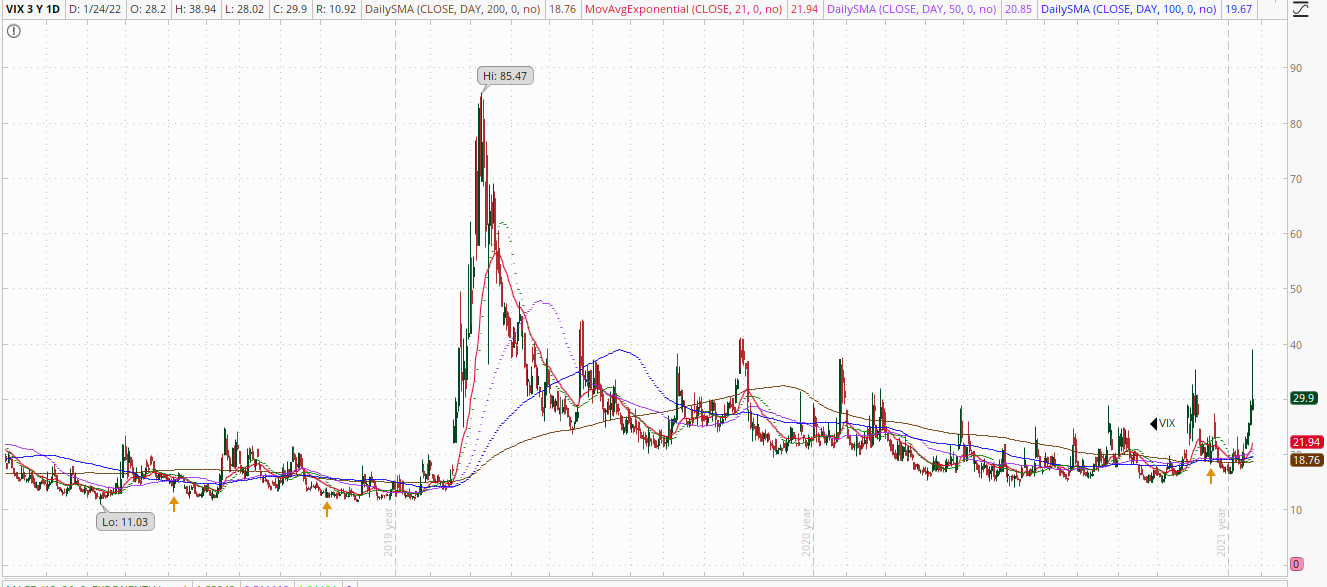
VIX - Spiked to almost 40 today before falling back under 30. That high was the highest since October 2020. Finished at 29.90. Here is a 3-year chart. I am leaning towards that near 40 print being the high for this spike.
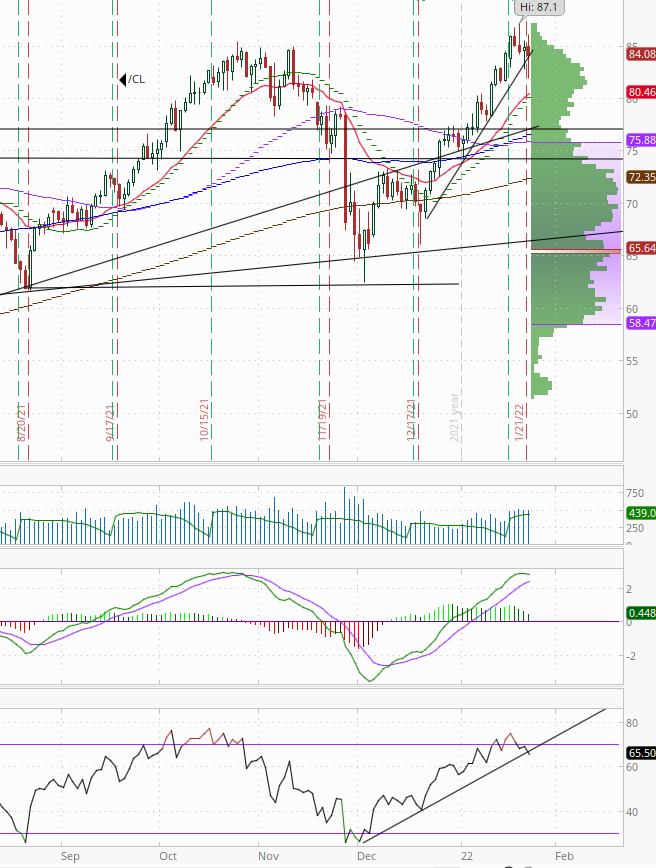
Crude (/CL) - Ended down but well off the lows recovering the uptrend line area. Finished at $84.08 WTI. Daily technicals remain positive for now.
As US exports have been fueled by increasing int’l demand.
NEW YORK, Jan 21 (Reuters) - U.S. crude exports are ramping up due to increasing demand from Asia and Europe and recovering U.S. production from the lows of the coronavirus pandemic. U.S. seaborne crude exports have increased in recent weeks and are close to 3 million barrels per day so far this month, according to Matt Smith, lead oil analyst for the Americas at Kpler. That's just under the 3.2 million bpd average in crude exports in December, which was the strongest month since February 2020, he said.
Cargoes booked for February are headed to numerous countries including China, South Korea and India, Refinitiv Eikon shipping data showed. Those three are among the largest regular buyers of U.S. crude. Increased vehicle traffic means lighter barrels from the United States, which produce a higher volume of gasoline, are attractive to buyers.
"The exports are underpinning the market now," said John Kilduff, a partner at Again Capital Management in New York. "I expect the 3 million-per-day number to sort of become the norm."
As US refiners expect a resurgent 2022. Argus.
US refiners are set for a shift back toward pre-pandemic profits in 2022, with many expecting Covid-19 restrictions to taper amid rebounding demand for products this year. An emerging consensus points to a smoother road ahead for US refiners in 2022 as governments take a more cautious approach to pandemic travel, work and gathering curtailments.
Facilities able to weather the storm of the past few years are set to cash in. US bank Wells Fargo earlier this week raised earnings-per-share estimates for US refiners for a second consecutive quarter, on expectations that refinery closures across the last few years will leave survivors with less competition. The bank expects combined refinery utilization levels in the US to match levels last seen in 2018, when refineries averaged 93.1pc utilization, according to the Energy Information Administration (EIA).
Refining economics in 2022 should also offer robust support for middle distillate cracks, as a continued reliance on home deliveries spurs concomitant tightness in diesel and jet fuel stocks. Resistant demand, tight stocks and a smaller field of refiners should lead to decade-high refining margins in 2022 before markets become oversupplied late in the year, according to Argus Consulting's January Crude and Refined Products Outlook. Argus Consulting forecasts US Gulf coast crack spreads for ultra-low sulfur diesel vs LLS to average $19.10/bl in the first quarter — the highest average for the first quarter dating back to 2014. Jet fuel cracks in the US Gulf coast vs LLS are forecast to average $14/bl, a 131pc increase over the same quarter in 2021 and the highest quarterly mark since 2019. The industry seems happy to concur with this bullish outlook. Phillips 66's Garland is "constructive" on 2022 refining, as the company expects that jet fuel demand finally comes back to 2019 levels this year.
Covid-19 disruptions and high natural gas prices could spoil any forward-looking statements about the year ahead for US refiners, and high costs for renewable fuel blending remain a foremost headache for the sector. High natural gas prices push up hydrogen values that can weigh on desulphurization economics for refineries. While gross refining margins may reach multi-year highs in 2022, prices for the renewable identification numbers (RINs) obligated parties use to comply with the US renewable fuel blending program have multiplied over the last few years. The Argus Renewable Volumes Obligation — an assessment of the per-gallon cost refiners and importers face for US Renewable Fuel Standard compliance — averaged 16.19¢/USG in 2021, nearly a sixfold increase over 2.86¢/USG average recorded in 2019 and nearly triple prices paid in 2020.
As less than half of the projected amount of renewable diesel will actually be reached by 2025 according to a new study.
(Reuters) - U.S. refiners and biofuel companies are likely to reach less than half the renewable diesel production projected by the U.S. government for 2025 due to policy and feedstock constraints, according to a study released Tuesday from consultancy Cerulogy. Numerous petroleum refiners across North America are planning to convert facilities to process waste and vegetable oils into renewable fuels, a small but growing market backed by government incentives. The Energy Information Administration estimates renewable diesel production capacity in the United States could increase fivefold by 2024 from 1 billion gallons currently to more than 5 billion gallons per year. But Cerulogy estimated the projects are more likely to yield approximately 2 billion gallons of total renewable diesel production capacity in 2025, meaning at least 2 billion gallons of already announced capacity additions are likely be delayed, canceled or downsized. Achieving EIA predictions would be “exceedingly difficult” and would likely require relying heavily on feedstock imports and a very significant reduction in production of biodiesel - a biofuel made from similar feedstocks but blended with petroleum-based diesel - according to Chris Malins, who authored the report backed by the International Council on Clean Transportation.
As gasoline demand fell to the lowest since last March in the US.
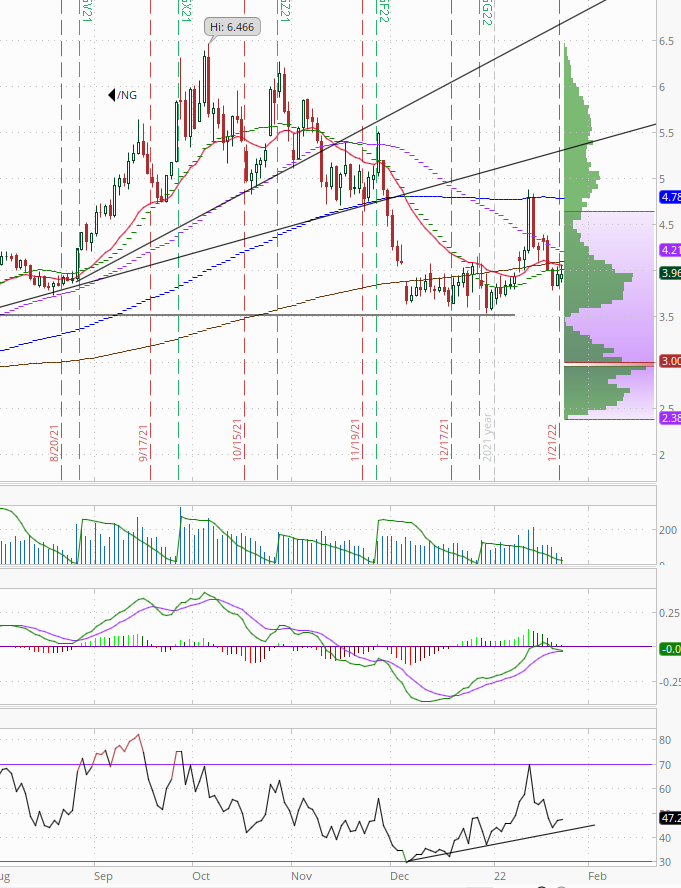
Nat Gas (/NG) - Down a little today as it stays trapped under the 20 and and 200-DMAs. Finished at $3.97. Daily technicals positive for now.
Gold (/GC) - Up today to highs of last week. Finished at $1844. Daily technicals positive.
Copper (/HG) - Down today but remains in the “new” range of the last week. Daily technicals tilt positive.
U.S. Data
Did reports on Markit flash PMI’s for January and Chicago NFI for December.
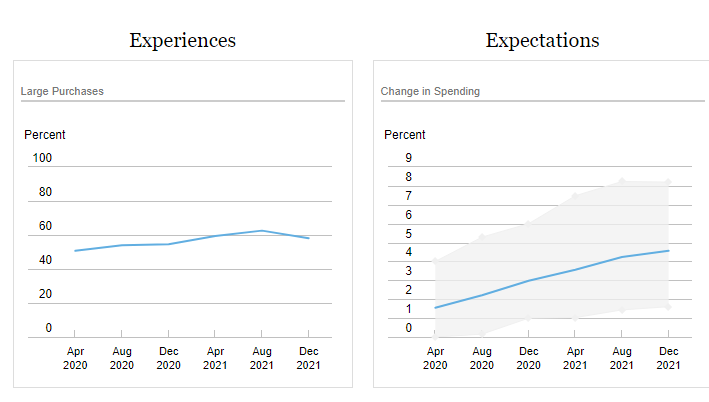
Also the NY Fed released their December 2021 Survey of Consumer Expectations (SCE) Household Spending, which provides information on individuals’ experiences and expectations regarding household spending. It found “a continued rise in monthly household spending growth, with spending growth moving well above pre-pandemic levels.” Also, “[y]ear-ahead overall household spending growth expectations continued its steady rise since an initial fall at the onset of the pandemic, reaching its highest reading since the start of the series in August 2015.” But it appears it will be more on essentials and less on “large purchases” - “Median year-ahead expected growth in essential household spending also rose to a new series high. In contrast, households report a lower likelihood of making large purchases over the next four months, which points to the likely contribution of elevated inflation expectations.”
Here’s more details:
Experiences
The median increase in monthly household spending compared to a year ago rose to 5.1% in December 2021, from 4.7% in August and 1.6% in December 2020. The current reading is the highest since the beginning of this series in December 2014. The increase from December 2020 levels was broad-based across age, education, and income groups.
Some 58.1% of households in December 2021 reported making at least one large purchase in the last four months, below the 62.6% reading in August but remaining above the December 2020 level of 54.6%.
The shares reporting making a large purchase on home repairs, furniture, homes, and vehicles all declined in December 2021 returning to within 1 percentage point of December 2020 readings, which in turn were comparable to December 2019 levels. While the share reporting spending on vacations fell to 19.6% in December 2021 from 27.8% in August, remaining substantially higher than the series low of 8.4% recorded in December 2020, but falling below the pre-pandemic December 2019 reading of 25.2%.
The reported degree of month-to-month variability in household income was relatively unchanged in December 2021 compared to its August 2021 and December 2020 readings.
Expectations
Median expected growth in monthly overall household spending over the next year increased to 4.6% in December from 4.2% in August, its highest reading since the start of the series in August 2015. The increase was driven by those with a college degree.
Median year-ahead expected spending growth on clothing (3.7%), food (5.8%), housing (2.7%), transportation (5.4%), and utilities (4.5%) all reached new series highs in December.
Differentiating spending on essential and non-essential items, the median year-ahead expected change in everyday essential spending (daily living expenses) rose to 5.4% in December from 5.2% in August, its highest reading since the beginning of this series in August 2015, and well above its December 2020 (2019) level of 4.1% (3.0%). The median expected change in spending on non-essential items, such as hobbies, leisure, or vacation, over the next year instead declined slightly to 2.5% in December from 2.6% in August, while remaining well above its December 2020 reading of 1.6%.
While households expect a bigger increase in overall spending dollars over the next 12 months, the average reported likelihood of making a large purchase over the next four months decreased in December for vacations, home repairs, home appliances, furniture, and vehicles, compared to August. Despite the decline from August, the average likelihood of spending on a vacation over the next four months in December (at 22.4%), remains considerably above its depressed December 2020 level of 13.0%, and is comparable to its December 2019 reading of 25.5%.
Reported expected spending responses to an unexpected 10% increase in income show an average 31.4% would be used by households to pay down debt (down from 36.3% in December 2019), 48.8% would be saved or invested (up from 44.5% in prior year), and 19.7% would be spent or donated (up from 19.2% in prior year).
Next 24
Tomorrow we’ll get will receive the Conference Board's Consumer Confidence Index for January, the S&P Case-Shiller Home Price Index and FHFA Housing Price Index for November, and Richmond Fed manufacturing index for January.
International data highlighted by S Korean 4QGDP, Australian CPI and confidence, German Ifo business confidence, and UK CBI industrial orders for January.
And earnings kicks up another gear this week, tomorrow and Thursday in particular. Hopefully they come in strong and help sentiment.
Earnings spotlight: Tuesday, January 25 Verizon (NYSE:VZ), Johnson & Johnson (NYSE:JNJ), Lockheed Martin (NYSE:LMT), American Express (NYSE:AXP), Microsoft (MSFT), Capital One (NYSE:COF), F5 Networks (NASDAQ:FFIV) and Texas Instruments (NASDAQ:TXN).
Earnings spotlight: Wednesday, January 26 AT&T (NYSE:T), Boeing (NYSE:BA), Abbott Labs (NYSE:ABT), Intel (INTC), Tesla (TSLA) and Lam Research (NASDAQ:LRCX).
Earnings spotlight: Thursday, January 27 Tesla (TSLA), Intel (INTC), Comcast (NASDAQ:CMCSA), Dow (NYSE:DOW), McDonald's (MCD), Mastercard (NYSE:MA), Altria (NYSE:MO), Southwest Airlines (NYSE:LUV), Apple (AAPL), Robinhood Markets (HOOD), Mondelez International (NASDAQ:MDLZ), Visa (NYSE:V) and Western Digital (NASDAQ:WDC).
Earnings spotlight: Friday, January 28 Chevron (NYSE:CVX), Phillips 66 (NYSE:PSX), Charter Communications (NASDAQ:CHTR), Caterpillar (NYSE:CAT) and Colgate-Palmolive (NYSE:CL).
Overall
As I indicated at the top, the big question (to me at least) is what the big systematic sellers and major institutions do next couple of days. I don’t have a good feel for that. It seems too early for systematic strategies to be buying as realized volatility has been very high and we haven’t gotten over key levels which would see tend followers jump back in. So my feeling is today was likely just short covering with some dip buying. I will be much more constructive next week when we’re past the Fed meeting and the corporate buybacks recommence (and hopefully volatility has calmed down a little). For now, though, I’m remaining very cautious.
But that doesn’t mean I see us necessarily moving any lower than today’s lows. We got the VIX spike, and we did get a clear reversal today. We also had put/call ratios and new lows hitting the highest levels since the pandemic sell-off on Friday. So it feels like we perhaps do have those ingredients for at least a short term bottom as I mentioned on Friday. And I still believe Wednesday has the potential to be a big day that helps us form a bottom. But even if that’s all right, I’m not so sure it’s up and away from here. But unless Wednesday goes very poorly, I’m inclined to think today’s lows hold. Tomorrow will be instructive.
Misc.
Other random stuff.
As repos fall back under $1.7T (high was Dec 31st at just over $1.9T).
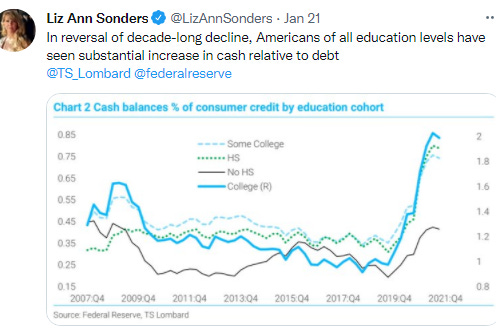
And household cash balances as % of credit outstanding remains at well above any earlier level in the cycle except for those without high school who are where they were back in 2007.
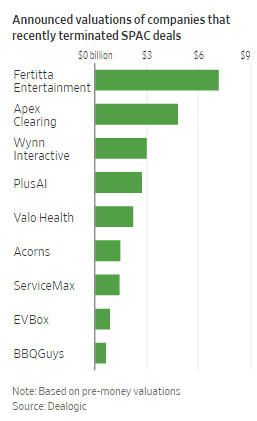
As an increasing number of announces SPAC deals are getting unwound.
A number of companies are now withdrawing from previously announced SPAC deals, even though they sometimes have to pay millions of dollars to the SPAC for backing out. Savings and investing app Acorns Grow Inc. was the latest to do so, ending its roughly $2.2 billion SPAC agreement on Tuesday and becoming the 10th company to terminate a SPAC deal since early November, according to Dealogic. There were 13 SPAC-deal terminations in the first 10 months of last year.
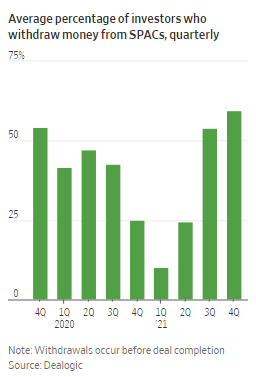
And more investors are pulling their money early.
If shares of a SPAC trade below $10 before a deal closes, many hedge funds and other professional investors automatically choose to pull their money out to eliminate the possibility of taking a loss on the trade or lock in a risk-free return. Since most SPACs are trading poorly, the average withdrawal rate soared to about 60% last quarter from 10% early last year, Dealogic data show. That often leaves companies that complete deals with much less cash on hand from their mergers. The smaller cash proceeds to expand the business can then add even more pressure to the stock price.
Which is coming at a bad time as SPACs are up against the clock to get deals done before they have to return funds to investors.
The market pullback is pressuring many SPAC creators, who typically have two years to do a deal before they must return money to investors. Not finding a deal also means creators forfeit the lucrative incentives that make them millions of dollars on the average SPAC deal, even if shares tumble and other investors lose money. Banks that help launch SPACs also forfeit some of their fees if the blank-check firm doesn’t complete a merger. Some analysts now worry that the pressure to finish a deal before the deadline and competition among SPACs for the same mergers will result in overvalued transactions. Nearly 250 companies that together hold more than $75 billion face deadlines in the first quarter of next year, according to Dealogic.
Of course deal announcement is no guarantee of success either as more investors are declining to participate following an announcement.
As Senator Sanders is on board with breaking up BBB. BBG.
Senator Bernie Sanders said it’s time for Democrats to change course on Joe Biden’s agenda and have senators vote on portions of the president’s key economic bill, then seek to pass what remains as a package. After six months of “so-called negotiating” with Democratic senators Joe Manchin and Kyrsten Sinema, “we need to start voting,” Sanders said on CNN’s “State of the Union” on Sunday. “We need to bring important pieces of legislation that impact the lives of working families right on to the floor of the Senate.”
“I have the feeling that we will be able to get 50 votes or more on some of these issues,” said Sanders, a Vermont Independent who caucuses with Democrats. “We could put that piece together and then pass something that’s very significant.”
To see more content, including summaries of most major U.S. economic reports and my morning and nightly updates go to Neil’s Newsletter | Neil Sethi | Substack for newer posts or https://sethiassociates.blogspot.com for the full history.