
PPI - Feb 2026
Feb PPI comes in over 2x expectations and most since July boosted by food, energy, and services prices

All figures m/m unless otherwise noted. As a reminder, this report breaks prices down into two components, final demand goods (those which are then sold to retailers/wholesalers) and intermediate demand goods (which are in various stages of becoming final goods). All the headline numbers reported, news services quotes, etc., are final demand, but I’ll go through both separately. This report is considered the “pig in the python”, particularly in terms of intermediate goods which by definition are still moving through the chain to final goods. If final goods prices move higher that either gets passed along to consumers (increasing CPI) or is eaten by companies (impacting margins).
US PPI Final Demand (M/M) Feb: 0.7% (est 0.3%; prev 0.5%)
- PPI Final Demand (Y/Y): 3.4% (est 3.0%; prev 2.9%)
- PPI Ex Food And Energy (M/M): 0.5% (est 0.3%; prev 0.8%)
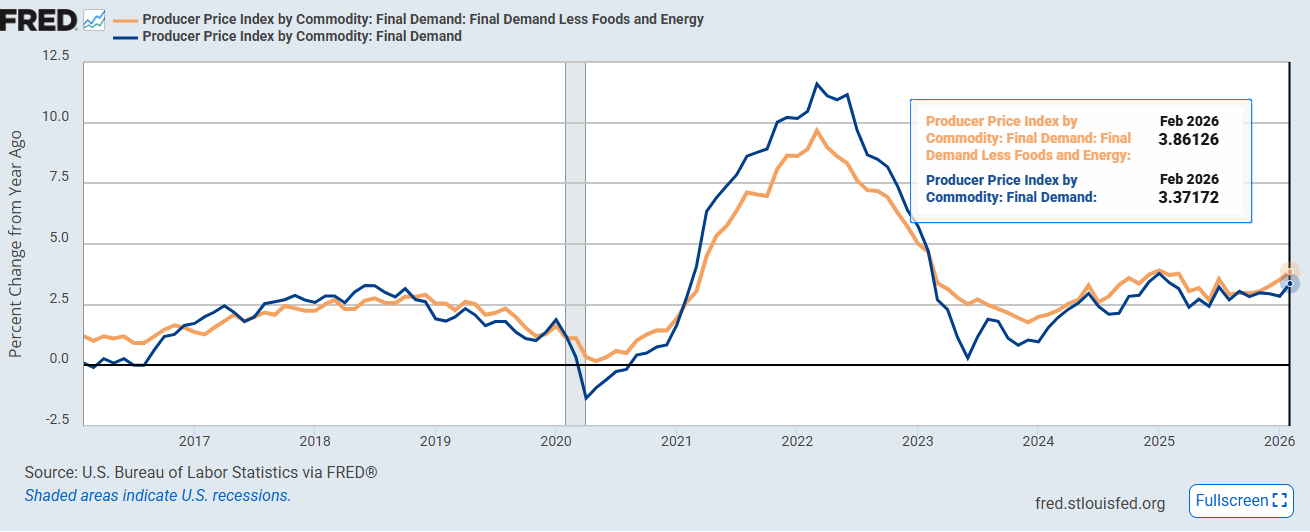
- PPI Ex Food And Energy (Y/Y): 3.9% (est 3.7%; prev 3.6%)
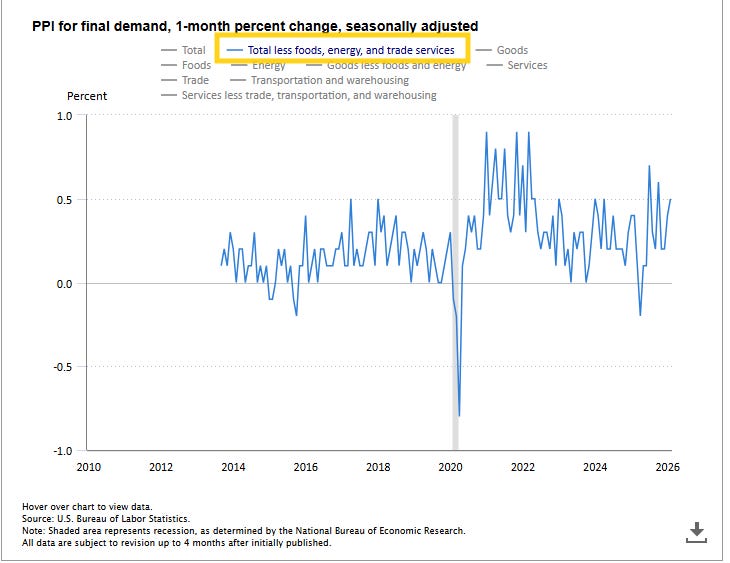
- PPI Ex Food, Energy And Trade (M/M): 0.5% (est 0.3%; prev 0.3%; prevR 0.4%)
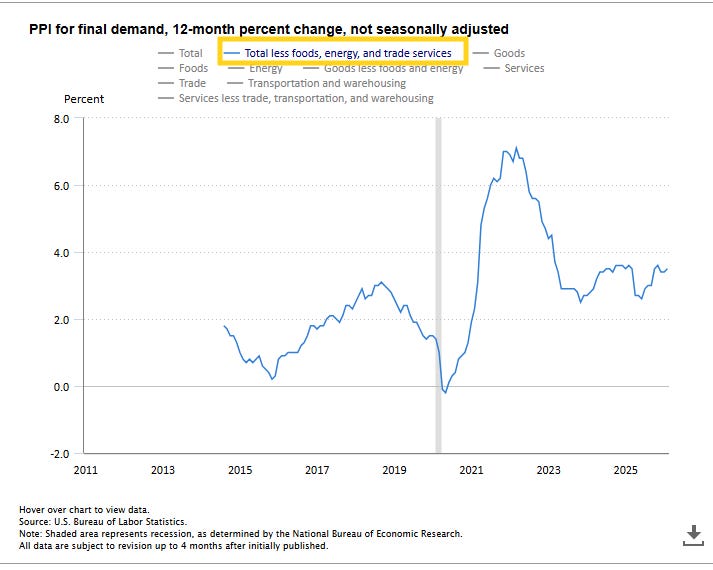
- PPI Ex Food, Energy And Trade (Y/Y): 3.5% (est 3.4%; prev 3.4%)
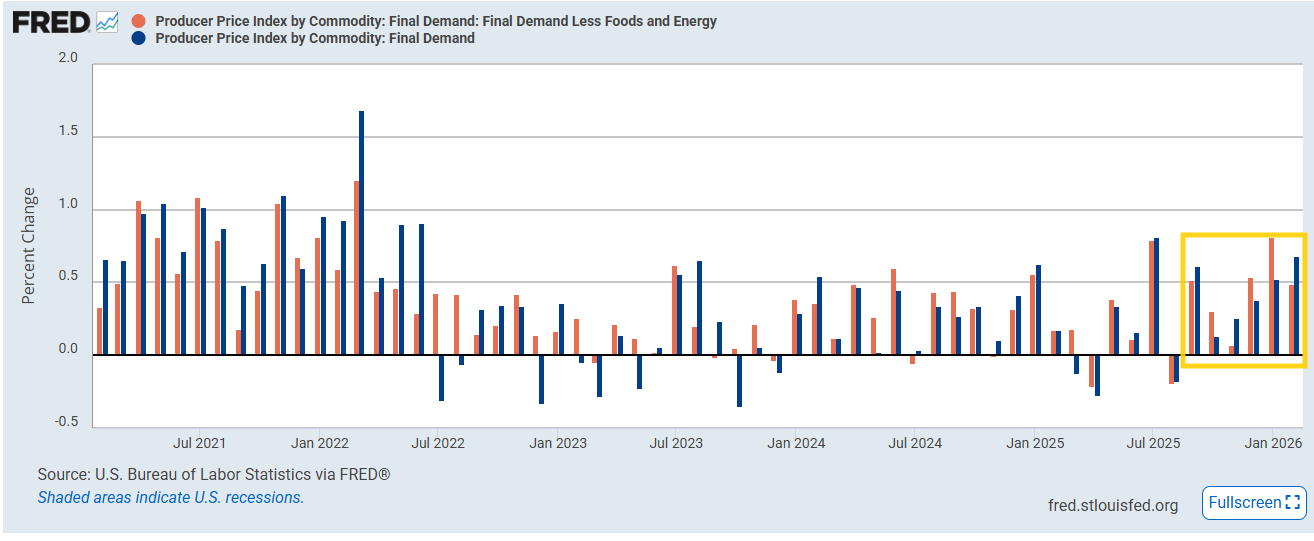
Feb final demand PPI (wholesale prices, blue lines) comes in well above expectations at +0.68% m/m, the most since July and over double expectations for +0.3% driven by a surge in food and energy prices as well as continued strength in sticky services prices. It follows an also elevated +0.52% read in January boosted by trade services (wholesaler margins).
Goods prices jumped +1.1%, the largest increase since August 2023, 40% of which was due to food prices which jumped +2.4%, the most since May 2021 (and 20% specifically by a +48.9% surge in fresh and dry vegetables).
Energy was +2.3% (boosted by diesel, gasoline, and jet fuel prices) a big turnaround after -2.3% in Jan.
Excluding food and energy, core final demand PPI (orange lines) was +0.49% m/m after +0.81% in Jan which was the most since Mar ‘22 boosted by trade services (noted below).
Core PPI includes another volatile category in trade services (wholesaler/retailer margins), which give us some evidence of tariff pressures (decreasing margins means prices are going up less than costs to acquire the goods (including tariffs)) which came in at +0.4% — a meaningful deceleration from January’s +2.2% surge (after +1.9% in December but -0.8% prints in both October and November). So that indicates more limited pass-through in February.
Stripping those out as well gives us so-called “core-core” final demand PPI which was +0.53%, the joint-highest since July, and the tenth consecutive monthly advance, meaning underlying wholesale pressures remain elevated.
Headline services (roughly 66% of the headline index) rose +0.5%, the third straight advance and a sharp reversal from a flat January print. More than half the increase came from “core core” final demand services (ex-trade, transportation, and warehousing) which increased +0.6%. The report noted prices for traveler accommodation services jumped +5.7%, accounting for roughly 20% of the services advance. Food and alcohol wholesaling, securities brokerage/investment advice, and inpatient care also moved higher. Airline passenger services and gaming receipts declined.
Headline goods prices were +1.1%, as noted, fueled by food and energy with core goods prices a more moderate +0.3%, a third consecutive month at that level.
Y/y final demand prices increased +3.37%, the largest 12-month advance in a year, from 2.84% in January. Core (ex-food, energy) y/y was +3.86%, and core-core (ex-food, energy, and trade services) was +3.5% y/y, just off the 3.6% in November which was the highest since 2023.
BBG: “The large upside surprise to the PPI in February confirms that stronger inflationary pressures were already making their way through supply chains even prior to the surge in oil prices,” Thomas Ryan, North America economist at Capital Economics, said in a note.
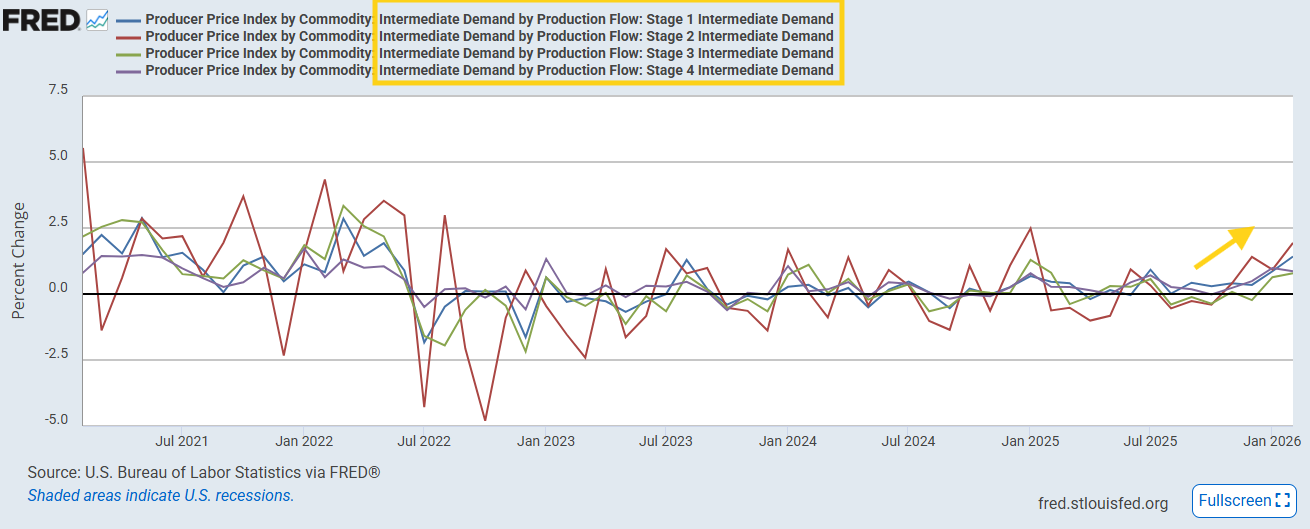
📝 Note — Intermediate Demand: Intermediate demand (which as noted at the top are goods that are “in process” to becoming final demand goods was quite hot in February and warrants watching although much was also due to energy.
Processed goods for intermediate demand rose +1.6%, the largest since August 2023, driven by a +5.5% surge in processed energy goods (diesel +13.9%) and +0.8% in core processed materials.
Unprocessed goods jumped +3.1%, the largest since January 2025, led by natural gas (+10.9%) and crude petroleum.
Services for intermediate demand rose +0.8%, largest since January 2024.
On a production-flow basis (see chart below), all stages increased notably with Stage 1 (earliest stage) +1.4%, the largest since May 2022, Stage 2 +1.8%, the largest since January 2025, Stage 3 +0.7%, the most since July, and Stage 4 (the closest to becoming a final good/service) was +0.9% the most since January 2024.
This is perhaps a meaningful pipeline signal and argues for continued elevated reads in final demand prices, particularly with tariff and now energy cost effects still working through the chain.
https://www.bls.gov/news.release/archives/ppi_03182026.htm
To subscribe to these summaries, click below.
To invite others to check it out,