
Productivity - 1Q 2026
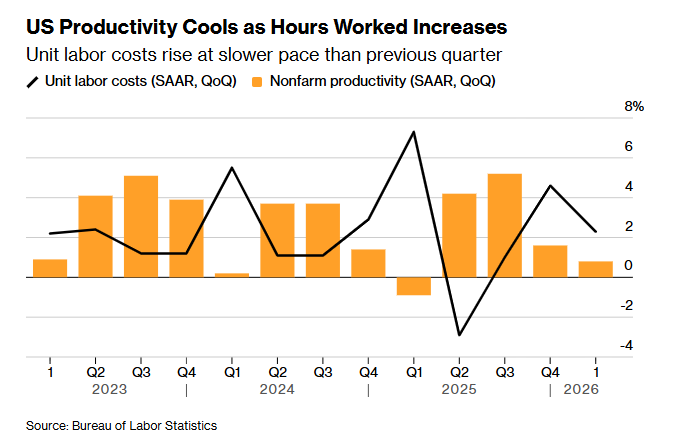
Productivity decelerates but remains positive with the y/y rate the best since Q3 2024. Labor costs decelerate and y/y falls to the least since Q3 2023 but so does y/y real compensation.

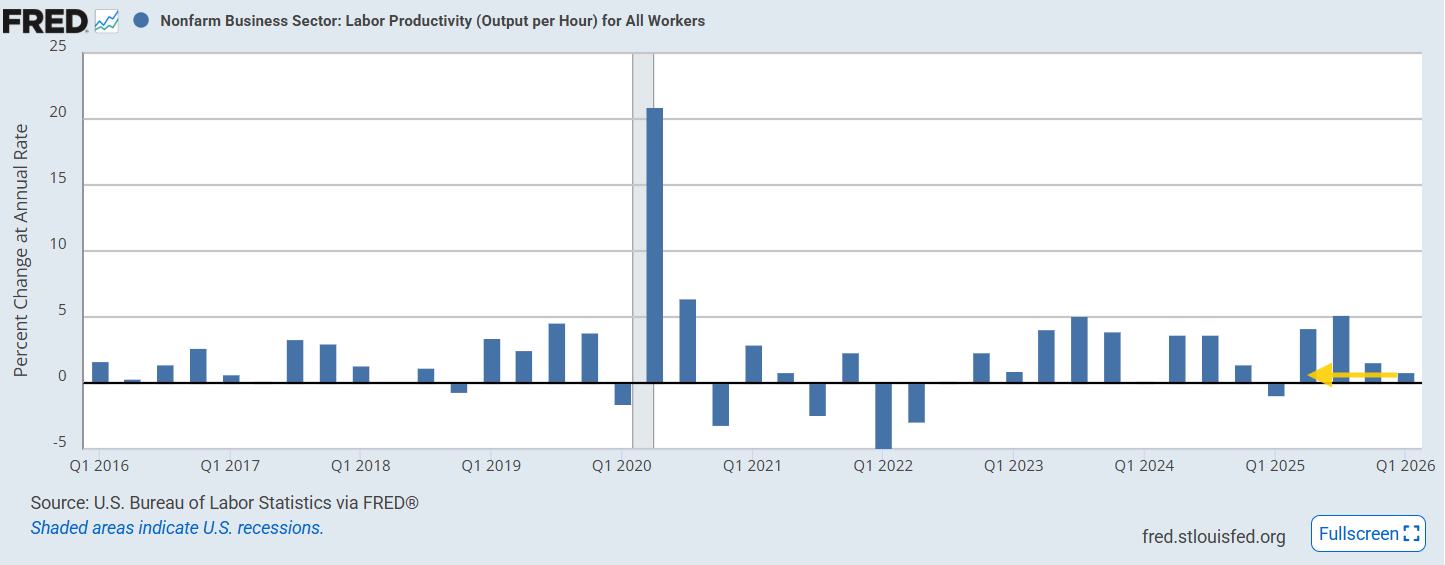
US Nonfarm Productivity: 0.8% (est 0.6%; prev 1.8%; prev R 1.6%)
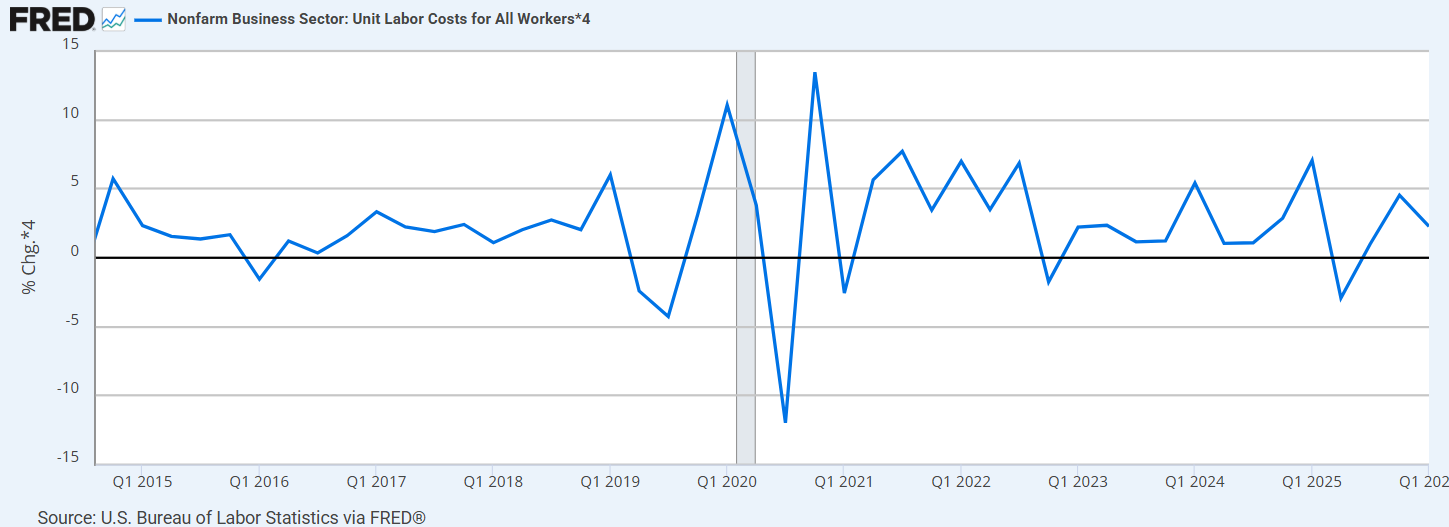
Unit Labor Costs Q1 P: 2.3% (est 2.5%; prev 4.4%; prev R 4.6%)
Productivity, a metric closely followed by the Fed, is one which has heightened importance today given the avowed feeling from some Fed members (and incoming Fed chair Warsh) that like the 1990’s productivity may be the key to allowing for rate cuts even while maintaining strong growth and a healthy labor market while also seeing inflation hopefully moderate as we get past the Iran conflict (it’s been described by some economists as “fairy dust”).
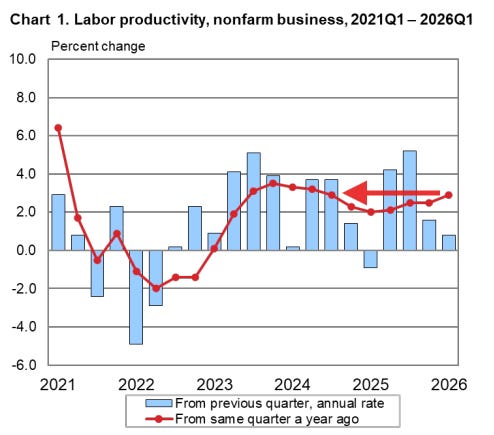
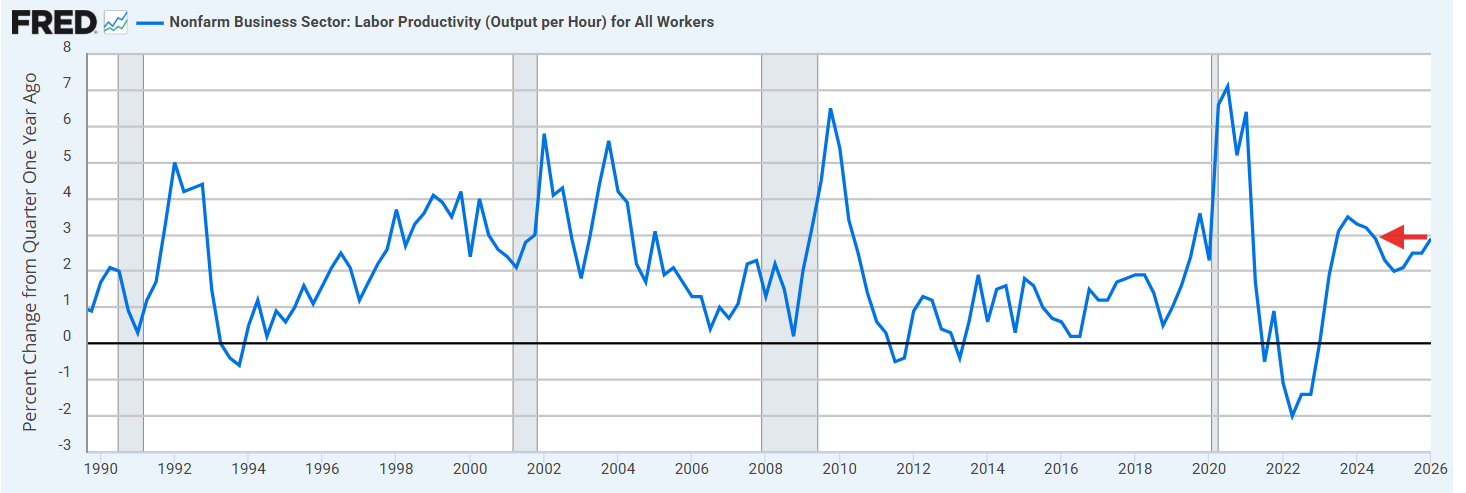
With that intro, the 1Q 2026 preliminary number came in at +0.8% Q/Q SAAR, positive for a fourth consecutive quarter, but the least in a year and slowing from a downwardly revised +1.6% in Q4 (from the previously reported +1.8%). On a y/y basis though productivity climbed +2.9%, the best since Q3 ‘24 and well above the 10-year prepandemic average. For full year 2025, productivity was unrevised at +2.1%.
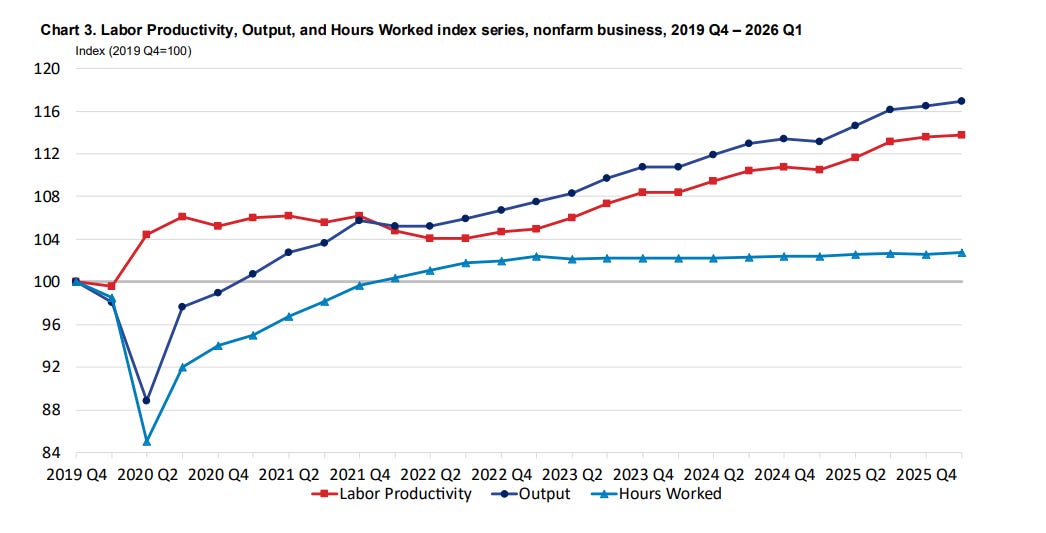
The good news the drop in productivity was from an increase in output of +1.5% along with hours worked rising +0.7% (the latter a reversal from the -0.2% decline in Q4).
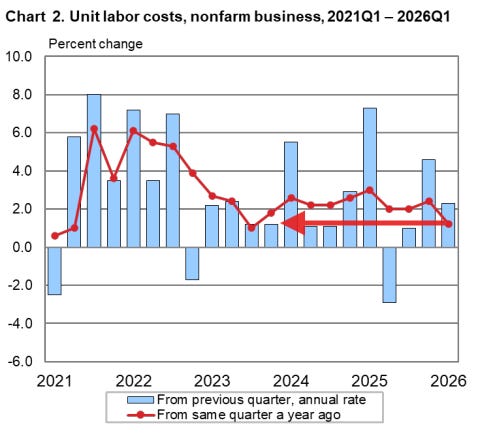
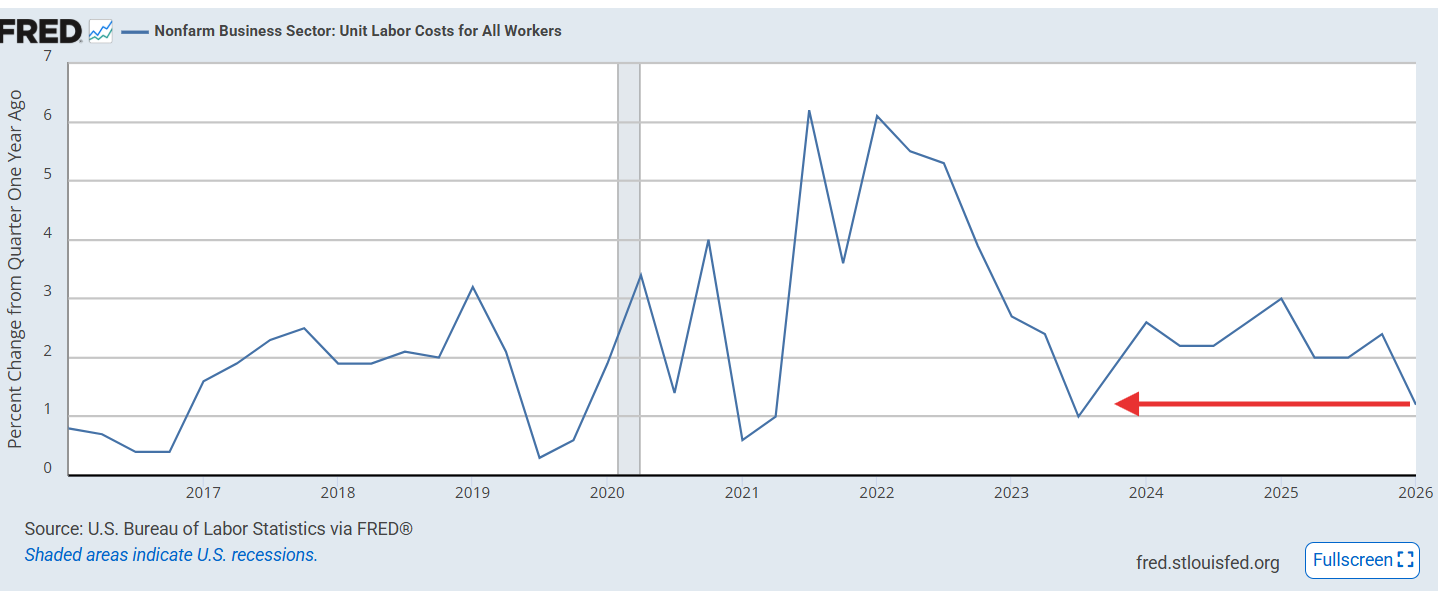
Also positively (for inflation) unit labor costs (ULC), a key component of wage pressures, moderated to +2.3% in Q1 from the upwardly revised +4.6% in Q4 (from +4.4%) reflecting a +3.1% rise in hourly compensation against the modest +0.8% productivity gain. On a y/y basis unit labor costs came in at +1.2%, the least since Q3’23 consistent with the Fed’s 2% inflation target.
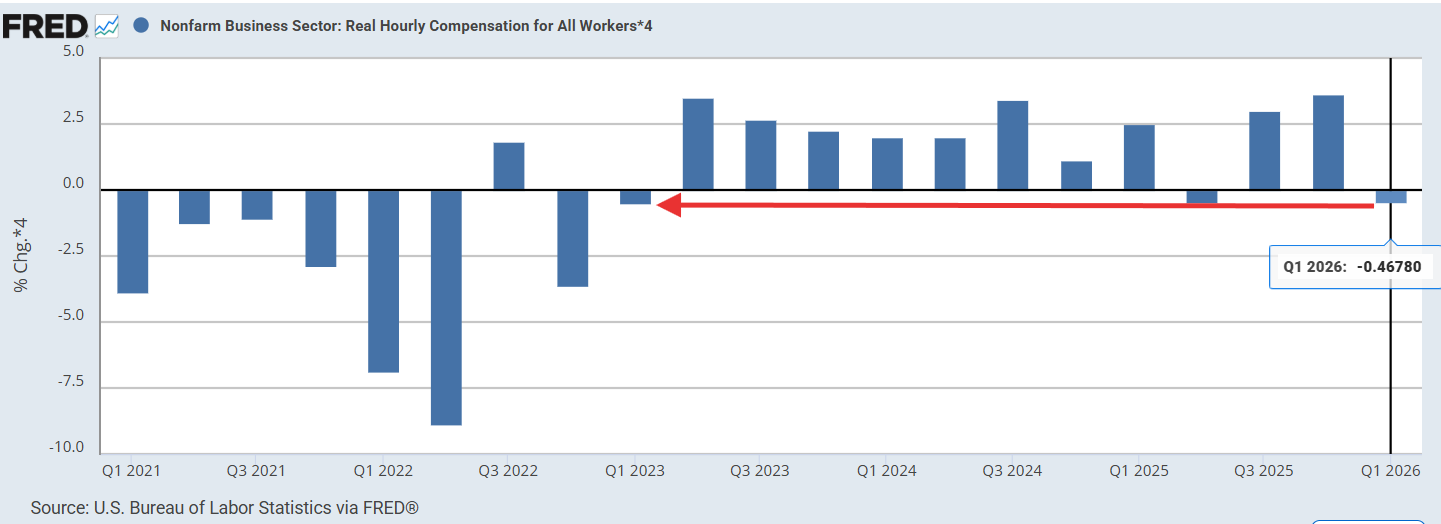
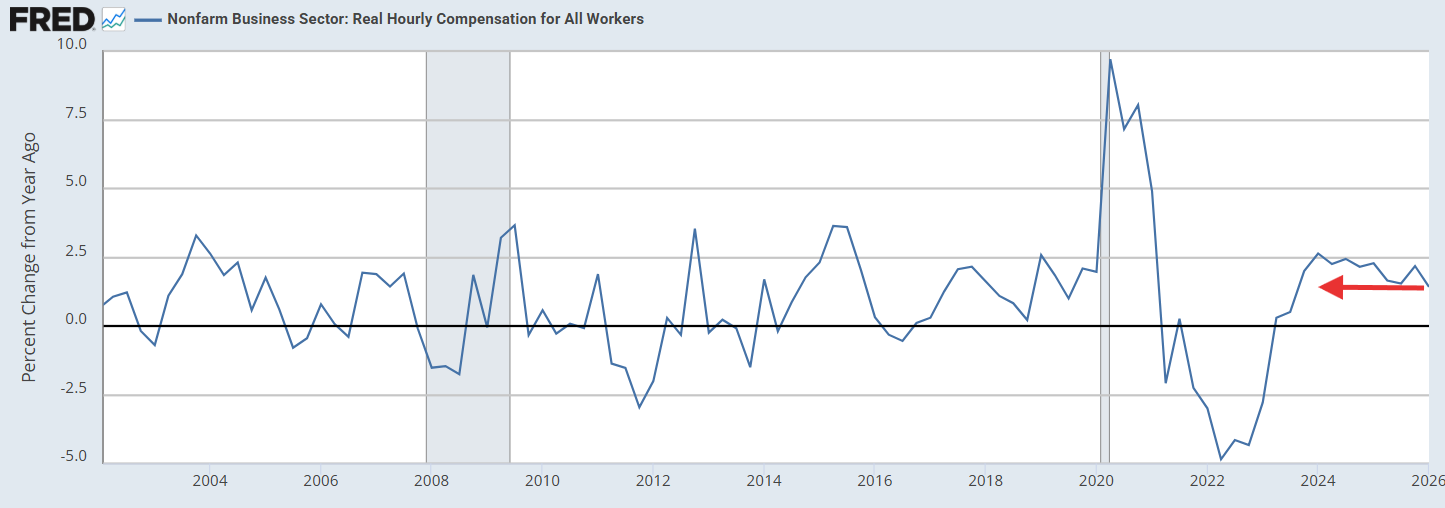
Less positively real (inflation-adjusted) compensation fell -0.5% in Q1, the joint least since Q1 ‘23 and a sharp reversal from the +3.7% in Q4 which was the best since Q4 ‘20. Y/y real compensation remains positive at +1.42%. While the least since Q3 ‘23 it’s a healthy number historically.
BBG noted that the labor share — the percentage of output accruing to workers as compensation — was 54.1% in Q1 2026, the lowest recorded value since the series began in 1947, down from Q4’s 54.4%.
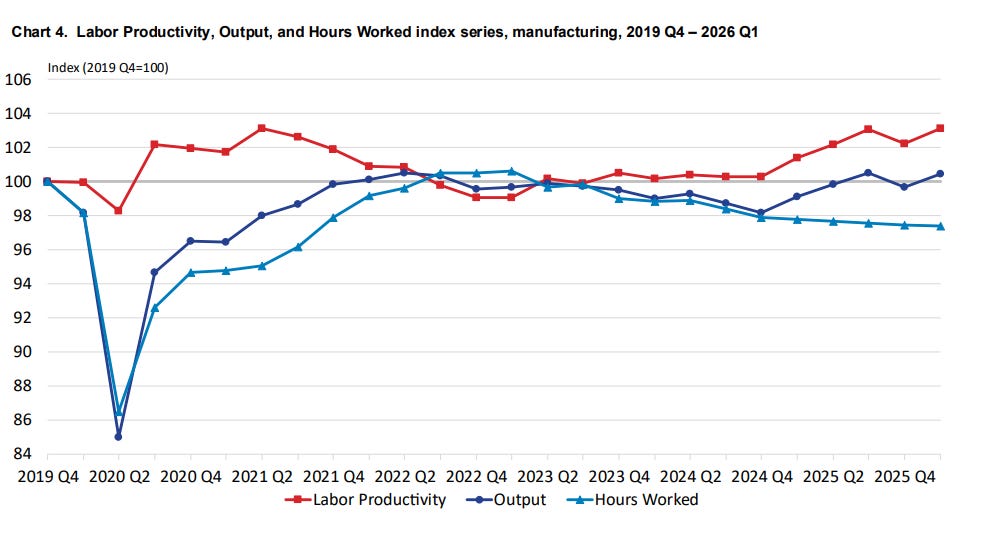
Looking deeper, Q1 saw a reversal from the manufacturing weakness at year-end, with manufacturing rebounding to +3.6% — the best quarter in a year — (after -3.2% in Q4 as revised) led by durable manufacturing +5.3% (non-durable +2.0%). Manufacturing ULC as a result rose just +2.4% (down from 9.4% in Q4) despite a +6.1% rise in hourly compensation. On a y/y basis manufacturing ULC came in at +3.7%.
Services (non-manufacturing) productivity was +0.6% Q/Q SAAR (down from +1.6% in Q4 as revised) with output +1.4% and hours worked +0.9%.
Also released was nonfinancial corporate sector Q4 2025 productivity which came in at +5.4%, with output +4.6% and hours -0.7%, and ULC a very contained +0.8%. For full year 2025 nonfinancial corporate productivity rose +2.9%.
https://www.bls.gov/news.release/pdf/prod2.pdf
Productivity (Q/Q SAAR)
Productivity (Y/Y)
Real (inflation-adjusted) compensation
ULC (Q/Q SAAR)
ULC Y/Y
Manufacturing
To subscribe to these summaries, click below.
To invite others to check it out,