The Week Ahead - 11/26/23
A detailed look at US equity markets covering fundamentals, technicals, positioning, the economy, the Fed, and everything in between
Short glossary:
SPX = S&P 500
Naz = Nasdaq Composite
NDX = Nasdaq 100 (100 largest stocks in the Naz)
RUT = Russell 2000 (smaller stocks)
DMA = Daily Moving Average (the moving average over the given time period (20, 50, 100, 200 days normally)).
MACD = Moving Average Convergence Divergence (basically a trend indicator)
RSI = 14-day Relative Strength Index (basically what it sounds like)
On my charts, the lines are 20-DMA (green), 50-DMA (purple), 100-DMA (blue), 200-DMA (brown)
Source abbreviations: BBG = Bloomberg; WSJ = Wall Street Journal; RTRS = Reuters; SA = Seeking Alpha; HR = Heisenberg Report
Note, all screengrabs which look like the one below are from the Daily Chartbook which is a GREAT daily newsletter. You can subscribe here. Daily Chartbook
If you're a new reader or maybe one who doesn’t make it to the end feel free to take a second to subscribe now. It’s free!
Or please take a moment to invite others who might be interested to check it out.
Also please note that I do often add to or tweak items after first publishing, so it’s always best to read it from the website where it will have any updates.
As always, apologize for typos. Another week with a lot of family stuff, so this is going out late without any real editing. Also please note I WILL BE AT A CONVENTION MON-THURS SO LIKELY NO UPDATES DURING THAT PERIOD.
Also, as a reminder to ease reading for those who read each week, as I reuse a lot of language week-to-week and/or leave in legacy material for reference, I will leave anything from prior weeks that hasn’t changed in italics. Only new content will be non-italicized.
Next Week
I hope you rested up on the lighter holiday week as we’re back into the grind with a heavy week of data that will include reads on housing, consumers, the economy (GDP and Beige Book), inflation, trade, labor market, manufacturing, and construction.
We’ll also resume non-bill (>1year) Treasury auctions in the upcoming week with a front-loaded schedule that will see 2-yrs Monday morning, 5-yrs Monday afternoon and 7-yrs Tuesday afternoon (more in the bonds section).
Here is Heisenberg Report’s always nice summary:
Inflation updates from both the US and Europe top the macro agenda in the new week.
The figures have the potential to underscore market speculation that monetary policy is poised for a pivot in 2024, if only to prevent mechanical tightening through the real policy rate channel.
In the US, core PCE inflation likely rose 0.2% last month, economists reckon. On a YoY basis, prices probably rose 3.5%.
If the 12-month print matches estimates, it’d be the slowest pace of annual core price growth since April of 2021, when inflation took off in earnest in the US.
Obviously, this isn’t “mission accomplished.” But policymakers do need to start planning for the next stage of the fight. Part of that entails being prepared to restart hikes in the event inflation continues to percolate throughout the economy. It also means strategizing around a plan for cuts should it become apparent that the mandate asymmetry (i.e., upside risks to inflation versus downside risks for the labor market) is shifting rapidly.
While it might seem far-fetched, sitting here in late November of 2023 with core inflation lingering 1.5ppt above target and the jobs market supported, to suggest the Fed will be forced into large rate cuts in the space of just 13 months, 100bps of “insurance cuts” next year only gets you down to 4.5%. Neutral is (allegedly) 2.5%. If, for whatever reason, the bottom falls out for the jobs market or for consumer spending (or both), a Fed that fails to react fast enough could be a Fed that inadvertently runs highly restrictive policy for months while waiting on “confirmation” from data that’s reported on a lag.
…
Across the pond, inflation in the euro-area likely receded to just 2.7% in November. The data, due Thursday just prior to the PCE report in the US, will probably show core price growth in Europe ran at 3.9% last month.
Even if inflation in Europe turns up again temporarily due to YoY comps, the ECB is done raising rates. The task now for Christine Lagarde is to convince markets that cuts aren’t any semblance of imminent.
As a quick reminder: The monetary policy transmission channel in Europe has worked fairly well, particularly given the impossibility of managing disparate economies (and disparate fiscal regimes) under one monetary authority. In Europe too, though, inflation is embedded on the services side of the economy. Initially, it was an energy and food price problem. But inflation isn’t easily contained once it gets going. It doesn’t take long for it to find its way from goods to services and then into wage-setting.
Also on the docket in the US this week: A bevy of housing figures, including new home sales, updates on the national price gauges and pending home sales. Conference Board confidence is due Tuesday, the second read on Q3 GDP Wednesday and ISM manufacturing on Friday.
And earnings will continue to come in over the next couple of weeks, but at this point we’ve had 99% of the SPX.
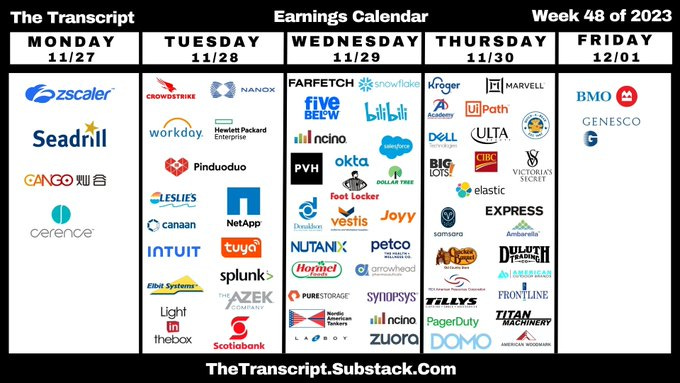
Earnings spotlight: Monday, November 27 - Zscaler (ZS) and Seadrill Limited (SDRL).
Earnings spotlight: Tuesday, November 28 - Intuit (INTU), Workday (WDAY), Splunk (SPLK), NetApp (NTAP), Hewlett Packard Enterprise (HPE), and CrowdStrike (CRWD).
Earnings spotlight: Wednesday, November 29 - Salesforce (CRM), Snowflake (SNOW), Dollar Tree (DLTR), Hormel Foods (HRL), and Five Below (FIVE).
Earnings spotlight: Thursday, November 30 - Royal Bank of Canada (RY), Toronto-Dominion Bank (TD), Dell Technologies (DELL), and Kroger (KR).
Earnings spotlight: Friday, December 1 - Bank of Montreal (BMO).
And we’re scheduled to get a decision from OPEC on Thursday.
Internationally it’s a busier week with the highlight as HR noted inflation prints for the EU. We’ll also get Canada 3Q GDP and Nov jobs numbers, Chinese Nov manufacturing PMIs, and Japanese industrial production and retail sales. The COP28 climate summit also begins on Thursday. Apparently meat will be a big topic with the world’s most-developed nations to be told to curb their appetite for meat as part of the first plan to bring the global agrifood industry into line with the Paris climate agreement. Developing countries — where under-consumption adds to a prevalent nutrition challenge — will be tasked with improving their livestock farming.
Canada will release third-quarter GDP data that will reveal whether it entered a recession, though economists reckon on at least minimal growth. Jobs numbers for November will be the last major data point before the Bank of Canada’s rate decision on Dec. 6.
Chinese purchasing manager indexes will start being published toward the end of the week, data to be closely watched by investors for signs of recovery in the world’s second-largest economy. The Bank of Korea is expected to hold rates steady on Thursday, though it continues to face a tricky policy environment where inflation remains sticky, growth weak and household debt on the rise. South Korea is also set to report on trade data Friday, one of the earliest looks into how global demand was holding up in November. A range of Asian countries will report on manufacturing PMI data on Friday, from India to Vietnam to Indonesia, giving a broader view into how the region’s economies are holding up. Japan will report on industrial production and retail sales data on Thursday, plus labor and business spending data on Friday, after figures showed the Japanese economy contracted in the third quarter.
Euro-region inflation data for November, due on Thursday, will probably show inflation at 2.7%, the lowest since July 2021. The underlying measure is seen slowing to 3.9% Those numbers will arrive after a drip of national reports starting on Wednesday that are mostly expected to show a synchronized decline across major economies, albeit at divergent levels. While Spanish inflation probably accelerated, it’s seen weakening in France to 4.1%, and the outcome in Germany is also projected lower at 2.7%. Italian price increases are expected to decelerate markedly further below the ECB’s goal, to 1.1%.
Meanwhile, the German government is struggling to hammer out a revised budget after a shock court ruling earlier this month. In the UK, several Bank of England policymakers are due to make appearances, including Governor Andrew Bailey, while it’s a quieter week for data.
Latin America has a light economic calendar in the coming week, with highlights to include mid-month consumer prices index in Brazil and an inflation report by Mexico’s central bank.
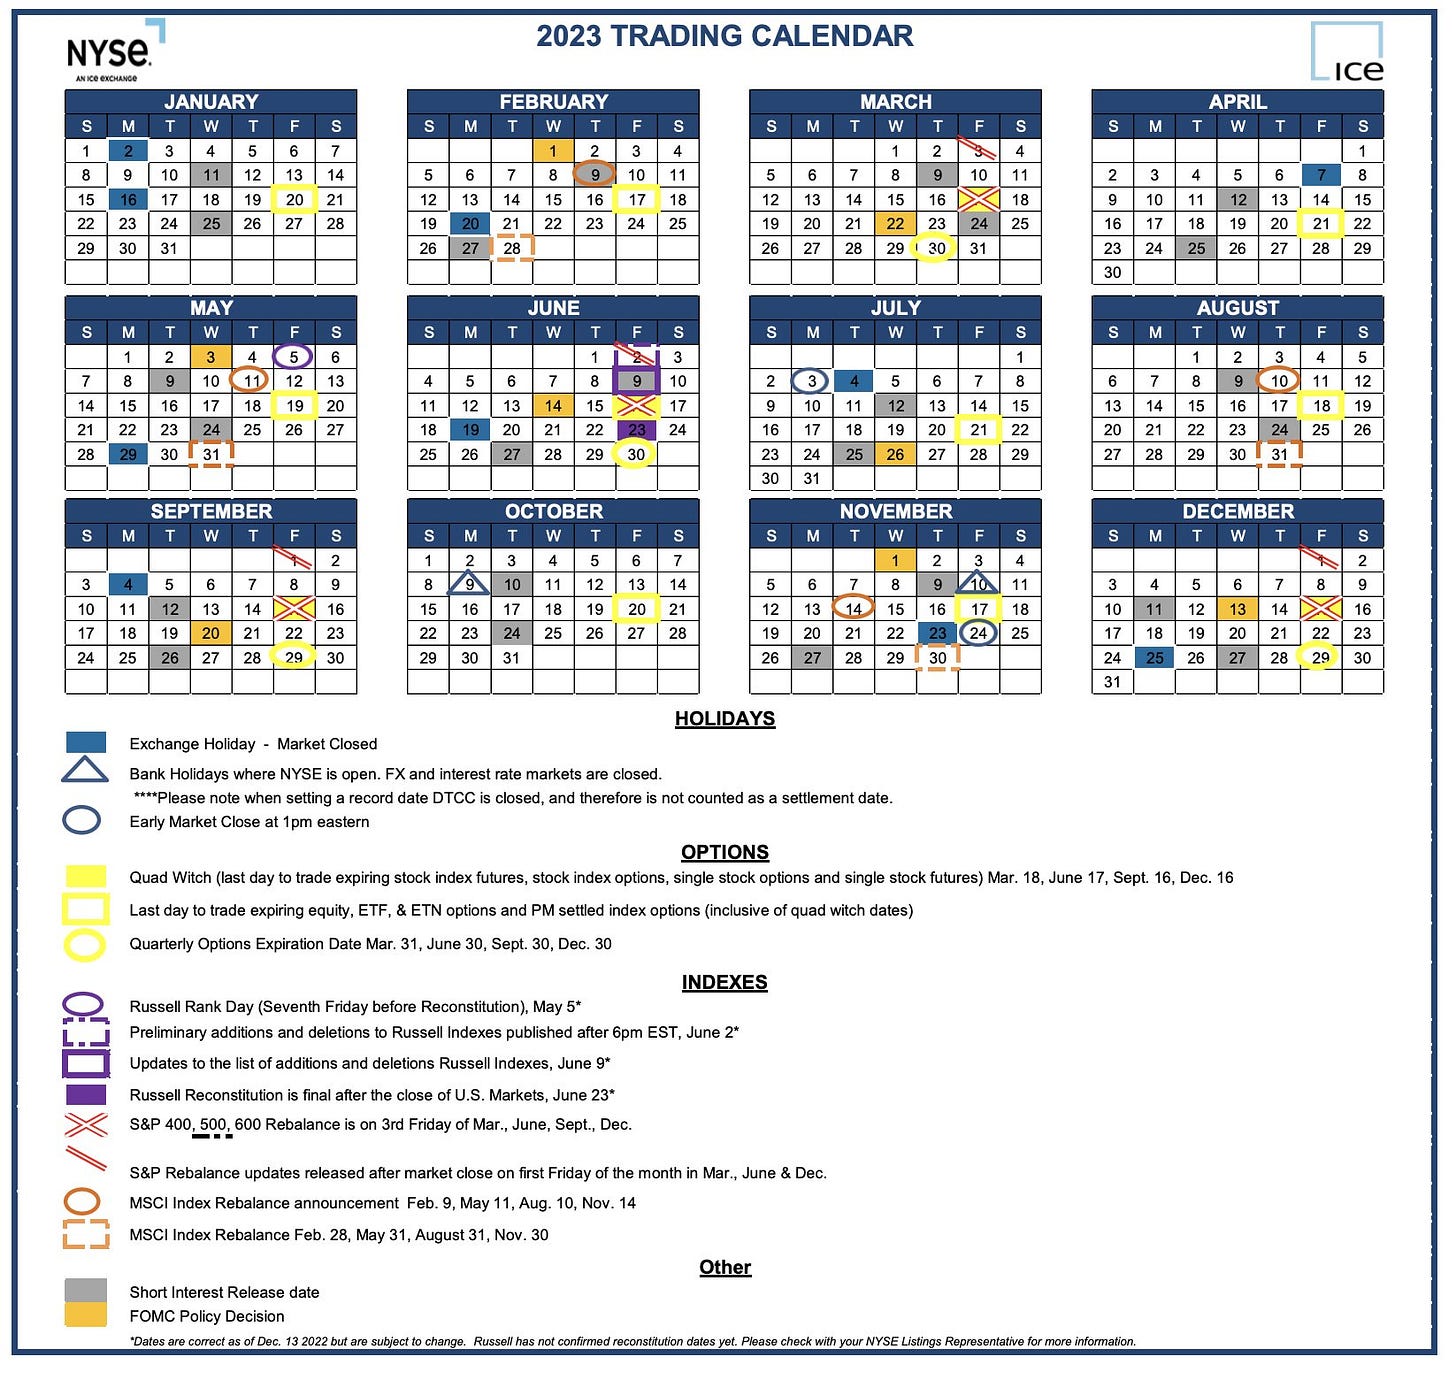
And here’s a nice trading calendar I came across from NYSE that I’ll just leave up for the year.
Market Drivers
So let’s go through the list of items that I think are most important to the direction of equity markets:
The Fed/Bond Market - This was a lighter week with probably the most relevant item the Fed minutes. While pretty stale (coming before the October CPI report and following 40bps drop in long duration Treasury yields), they were still taken on balance has hawkish.
“Even if the Fed doesn’t truly believe there’s a compelling reason to hike further, adding symmetry at terminal is very typical (and understandable),” BMO’s Ian Lyngen remarked on Tuesday afternoon. “Overall, there was nothing in the release that has offered any divergence from the recent Fed messaging.”
We had a pair of Treasury auctions which got some attention given the lighter week. First we had a very good 20-yr auction…
…but it was followed by a weak 10-yr TIPS auction which saw the highest real yield (2.18%) since 2009.
There was also some economic data discussed later, particularly a drop in jobless claims and tick higher in inflation expectations, that added to the firming in bond yields as well as Fed expectations. After having come in to the week with a 0% chance of another hike and 102 bps in cuts expected, we ended the week with a 12% chance of a hike in January and 87 basis points of cuts. So nothing like what we saw the previous week in pricing out hikes and pricing in cuts but still notable.
From the Friday report:
Fed expectations moved around a little. According to the CME FedWatch tool chances for another hike edged up to 12% (in January) from 0% to start the week, while the chance for a cut in March fell to 23% (down from over 30% to start the week) but May moved higher to 64% (the highest we’ve seen), while the second cut remained in July (although eased to 52%). The December 2024 implied rate moved up to 4.54% w/2024 rate cuts at 87 basis points, the least in over two weeks.
As I said a week ago, given where rate hike odds stand for December (<5%) it would take a massive repricing in a short period of time (the December meeting is less than two weeks away) to get to the 90% odds the Fed would want to see the week before the meeting (the Fed doesn’t like to surprise). Given that, I think a December hike is almost certainly not going to happen. We’ll have two jobs reports and two CPI reports between now and the January meeting, so at this point there’s no reason they would force it in at this point.
Overall, I don’t have really any change to what I’ve been saying for the past few months except to note we have now started to get some talk of cuts drifting into the conversation. Whether that remains will be a function of whether inflation continues to moderate which I think has become the key talking point repeated over and over from Fed speakers recently:
I think we’ll continue to hear generally hawkish Fedspeak in the near term to preserve optionality for hikes, but over time we’ll hear less of this and more about holding rates at then current levels, which will then shift to a debate about when rate cuts should start. That said, cuts will be a high bar, as the one thing this Fed won’t do is allow for a reprise of the 70’s “bounceback inflation”. So for me, we won’t see rate cuts early in 2024 absent something new “breaking” or the job market cracking (which I define as the unemployment rate over 4% and at least two negative payroll prints). But as we start to see core PCE move to 3% (or perhaps under 3% per Patrick Harker’s comments earlier this year), rates will become increasingly restrictive, and the Fed will at some point need to dial back the pressure. They will though have the 70’s in their heads so they’ll likely be later than earlier and cautious unless/until the economy forces their hand. The good news is that I don’t personally think that even 5.75% means a hard landing (or necessarily even a recession), but it’s also true that we really won’t see the full impact of the rate hikes until next year at the earliest.
Here was HR’s take this week on the subject:
policymakers do need to start planning for the next stage of the fight. Part of that entails being prepared to restart hikes in the event inflation continues to percolate throughout the economy. It also means strategizing around a plan for cuts should it become apparent that the mandate asymmetry (i.e., upside risks to inflation versus downside risks for the labor market) is shifting rapidly.
While it might seem far-fetched, sitting here in late November of 2023 with core inflation lingering 1.5ppt above target and the jobs market supported, to suggest the Fed will be forced into large rate cuts in the space of just 13 months, 100bps of “insurance cuts” next year only gets you down to 4.5%. Neutral is (allegedly) 2.5%. If, for whatever reason, the bottom falls out for the jobs market or for consumer spending (or both), a Fed that fails to react fast enough could be a Fed that inadvertently runs highly restrictive policy for months while waiting on “confirmation” from data that’s reported on a lag.
“Our bias for 2024 assumes a stubborn Fed that delays normalizing yields lower until it’s too late to avoid a more material downturn in the pace of growth,” BMO’s Ian Lyngen and Ben Jeffery said. “By no means would we consider this a policy error; in fact, it’s most likely Powell’s base case scenario,” they added. “Sure, the Chair would like to stick the landing [but] at the end of the day, he’s most likely taking the approach of hope for ‘no,’ plan for ‘hard,’ landing. A prudent strategy.”
I’m not so sure about some of that. Let’s not forget: The Fed is a political institution. Yes, it’s nominally independent and yes, it generally does have unfettered operational latitude. But it’s not lost on Fed officials that a recession in 2024 could materially … [influence the upcoming] election outcome.
And as noted yields found a bottom on Wednesday not only on the back of the Fed minutes and jobless claims but also a jump in European yields on larger than expected supply from Germany and the UK. I’d note though while 10-yr yields hit their lows on Wednesday, the 2-year yield has been climbing since 11/14.
“In this early close Black Friday, we open to much higher Treasury yields because of what happened yesterday in Germany,” said Andrew Brenner at NatAlliance Securities. “A court ruling is causing Germany to suspend their debt ceiling, which has led 10-year German Bunds to rise. Other European rates followed, and so have US Treasuries.”
Yields moved higher with the 2-yr yield continuing a rise which started 11/14 and the 10-yr which started yesterday morning at support. The 2-yr note yield ended up five basis points at 4.95%, the 10-yr note rose six basis points to 4.47% (after bouncing at the key 4.36% level yesterday (see below)), now at the top of its channel, while the 30-yr bond yield also rose six basis points to 4.60% from the lowest since September.
Which as a side note saw 2/10 curve move back to its most inverted since Sept.
And bond volatility also continued to ease off a bit this week now the lowest since September, consistent with Harley Bassman's call (the creator of the MOVE index) last month that it should decline from "elevated" levels.
Which Goldman thinks will continue. As a reminder, the high vol environment in rates is one of the factors keeping mortgage spreads so wide (over 100bps wider than avg) so falling rate vol should over time see those spreads narrow bringing down mtge rates.
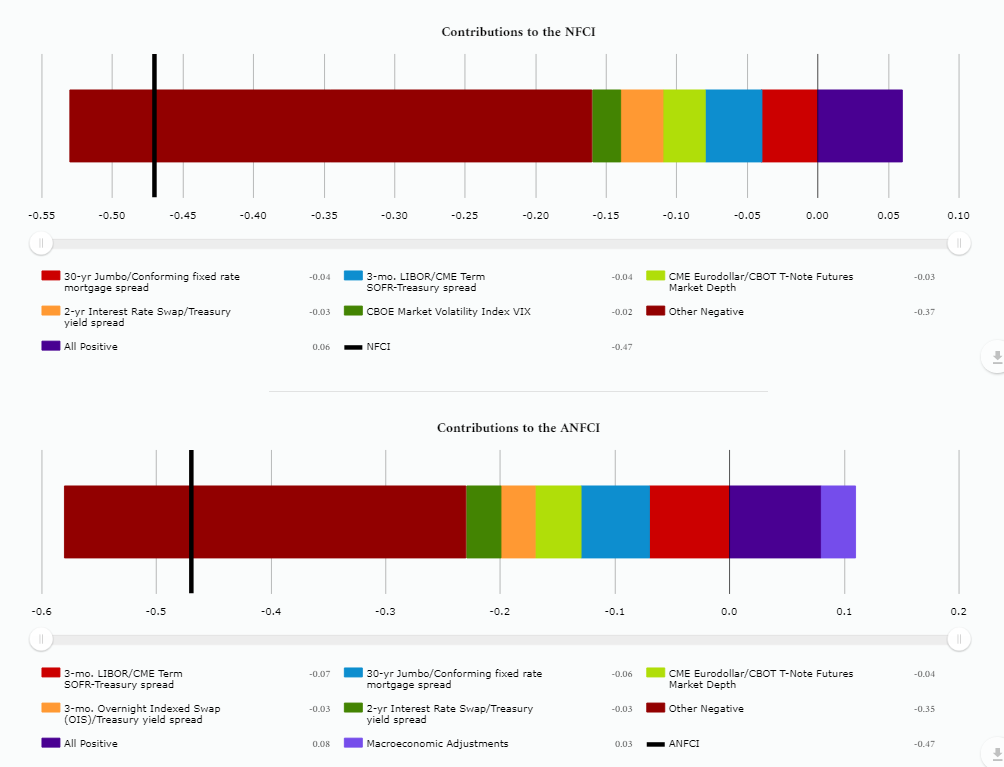
As the Chicago Fed national financial conditions index and its adjusted counterpart fall further to the lowest since February 2022.
And BoA does an interesting layover of SPX with the Chicago Fed FCI. They’ve tracked pretty closely (even though broad stock prices are a minor weighting).
And while UofM consumer inflation expectations are highest in months, market pricing for long-run inflation expectations fell to the least since July. The 5-yr, 5-yr forward rate (exp'd inflation over following 5 yrs starting in 5 yrs) down to 2.31%.
Which again softened the impact of the decline in nominal Treasury yields on real yields but they still are down to the least since September, down 40bps points from the high, although remaining above 2%.
And that may remain for the time being per the discussion of term premium which remains relevant given it was brought up in the Fed minutes. As a reminder, to the extent the rise in yields is due to term premium, the Fed treats it as a tightening of financial conditions (as opposed to if the rise is due to expectations of a higher fed funds rate.
Many participants observed that a range of measures suggested that the rise in longer-term yields had been driven primarily or substantially by a rise in the term premiums on Treasury securities. Participants generally viewed factors such as a fiscal outlook that suggested greater future supply of Treasury securities than previously thought and increased uncertainty about the economic and policy outlooks as likely having contributed to the rise in term premiums. Some participants noted that the rise in longer-term yields may also have been driven by expectations for a higher path of the federal funds rate in light of the surprising resilience of the economy or a possible rise in the neutral policy rate. Participants highlighted that longer-term yields could be volatile and that the factors behind the recent increase, as well as their persistence, were uncertain.
Some background materials from past past weeks:
As seen from BMO’s Ian Lyngen and Ben Jeffery vantage in a note called “Term Premiumania” was:
“There isn’t any obvious reason for a revisit to a negative term premium as long as the US economy proves resilient enough to withstand policy rates at the current level.” “Wobbles in stocks will be insufficient to convince the Fed that materially tighter conditions are in the offing; particularly not while the S&P is still up ~13% on the year,” they added. “Goldilocks remains the most common narrative at the moment, even if most fixed income investors have deep reservations.” (HR)
And here’s how the colorful Charlie McElligott put it (HR)
McElligott on Wednesday described the prior session’s robust retail sales print as just the latest in a series of catalysts for the “resumption of hate-selling” in US rates. “Despite duration having recently experienced a (short-term) renaissance with regards to more dovish Fed comms and constructive flows taking shots on UST upside, we’ve seen a return to ‘death by thousand paper cuts’ for bonds,” he added.
Here, from McElligott, is the problem:
When you add in 1) “still too strong US consumer,” with 2) “still too tight labor,” 3) the recent, modest re-acceleration in US headline inflation, and 4) US nominal GDP growth remaining in the 6-8% range, plus the long-term “structural” inputs of 5) government deficit spending trajectories, in turn leading to 6) issuance trajectory shocks, 7) an enhanced perception of “fiscal dominance” regime risk and all alongside 8) ongoing QT / balance-sheet unwind, we continue to get this rollicking term premium reset.
As ever, Charlie’s knack for re-capping markets in a way that resembles the glory days of SportsCenter, is much appreciated.
He also noted that SOFR spreads have removed ~30bps of priced-in Fed cuts for next year over the week, and 90bps since July.
Oh, and finally, there’s the overhang from currency weakness abroad. The “UST selling threat via FX reserve manager intervention flows” is back in play, McElligott wrote, flagging the yuan and the BoJ’s efforts to cap JGB yield rise, which serves to pressure the yen, both because it’s indicative of “money printing” and, more importantly, because it ensures that on days when JGB yields are at or near the cap and Treasury yields are rising (and those days tend to coincide for obvious reasons), rate diffs are guaranteed to move in favor of the dollar
And I’ve decided for now to keep in this background on the term premium for reference purposes:
The premium had reached a generational low of -1.67% in 2020 — partly due to declining inflation that made investors willing to accept lower long-term yields. For much of the period since 2016, it was also contained by Fed purchases of government bonds as a component of its monetary policy.
The gauge reverted to positive for several months during 2021 at a point when economic optimism pushed longer-maturity yields higher. The term premium then eroded as anticipation of US interest-rate increases, that began in March 2022, pushed short-term yields higher relative to longer-term ones.
Bank of America Corp. strategists said in a report that the term-premium between 10- and 2-year bonds averaged 40 basis points from 2004 to 2006, a time when longer-term yields were holding at a similar level to where they are now. If the term premium returned to that level, the 10-year yield would be pushed close to 5%, though they said that would likely only happen if data kept signaling improving strength in the economy.
And from BBG this week:
Typically described as the extra yield investors demand to own longer-term debt instead of rolling over shorter-term securities as they mature, the term premium, in the broadest sense, is seen as protection against unforeseen risks such as inflation and supply-demand shocks, encapsulating everything other than expectations for the path of near-term interest rates.
The problem is it’s not directly observable. Various Wall Street and central bank economists have developed models to estimate it, often with wildly conflicting results. The one thing that most market observers, including Federal Reserve Chair Jerome Powell, can agree on is that in recent months the term premium has soared, likely fueling the dramatic ascent in long-term rates that only recently has started to fade.
The implications for the trajectory of monetary policy are substantial. Powell and other Fed officials have said that the jump in the term premium could hasten the end of their interest-rate hikes by squeezing growth in the economy, effectively doing some of the work for them as they try to rein in inflation. Yet with traders having long struggled to handicap the Fed’s next moves, some warn the central bank’s focus on the notoriously hard-to-understand feature of the US government debt market is making it even more difficult to anticipate the path of rates going forward.
“It seems like a strange door for the Fed to open,” said Jason Williams, a global market strategist at Citigroup Inc. “It’s puzzling as the term premium is something that by definition you can’t know, which the Fed realizes but still is saying its rise is important and can offset some potential hikes.”
The term premium, as its name implies, has historically been a positive number, with the New York Fed’s widely-followed 10-year ACM model — named after creators Tobias Adrian, Richard Crump and Emanuel Moench — averaging about 1.5 percentage points since the early 1960s, as far as the data goes back. More recently, however, it’s been decidedly negative, touching a record low -1.66 percentage points in March 2020.
Yet between mid-July and mid-October it went on a tear. Over the span the measure surged more than 1.3 percentage points, flipping to positive for the first time since 2021. Another popular gauge created by the Fed’s Don Kim and Jonathan Wright shows the metric rising by a more modest, yet still significant, 75 basis points over the span. While both measures have come in between 20 and 35 basis points from their late October peaks, they remain well in positive territory.
“The thing that makes it hard to model the term premium is that God doesn’t tell you what the expected path that short rates are going to be over the next 10 years,” said Former Fed Governor Jeremy Stein, who’s now an economics professor at Harvard University. He’s warned that estimates for the neutral policy rate may be overly influenced by near-term expectations, resulting in term premium measures that are too high.
And per the Treasury refunding announcement discussed above, we have had a bit of a supply/demand mismatch as evidenced by duration (longer than 2 year) Treasury auctions in general the past month or so. As I noted,
Larger auctions required by the relatively high deficits paired with low liquidity and a decrease in demand due to numerous reasons (the Fed has steadily been reducing their buying, foreign buyers reducing their buying, banks who were huge buyers when rates were more stable (they could leverage up by taking low cost deposits and buying very stable Treasuries) also stepping away for risk and regulatory reasons, baby boomers aging into the drawdown stage of their retirement funds, etc.) has resulted in some indigestion. Currently it appears that markets are trying to figure out the proper level for longer duration yields. In that regard, there is a yield on longer duration Treasuries where this will all settle out. The problem is where that yield is remains unclear for now adding risk (which adds to the term premium).
And from BBG on the subject:
A changing of the guard among the biggest buyers of US Treasuries has Wall Street veterans bracing for further pain in the world’s largest bond market. Increasingly absent are steady-handed investors including foreign governments, US commercial banks and the Federal Reserve. In their place, hedge funds, mutual funds, insurers and pensions are piling in. Market watchers are quick to note that unlike their more price-agnostic predecessors, the new buyer base is likely to demand a heavy premium to finance Washington’s spendthrift ways, especially with debt sales set to surge as deficits swell.
…
“We have an abnormal supply-demand situation in that the quantity of debt the government has to sell is a lot” and will “remain a lot,” Ray Dalio, the founder of Bridgewater Associates, said earlier this month in an interview with Bloomberg TV’s David Westin. Dalio, like fellow Wall Street titan Larry Fink, said he expects 10-year yields to exceed 5% in the near future. “The buyers are less inclined to buy the debt, for a variety of reasons” including that “many have gotten whacked. There’s lots of losses.”
…
“It’s going to be a bumpy road finding that equilibrium in rates as these are more price-sensitive buyers,” Jay Barry, co-head of US rates strategy at JPMorgan Chase & Co., said in an interview. “This will result in a higher term premium and steeper yield curve over time.”
[F]oreign holdings as a share of America’s national debt have been on the decline for a while, falling to around 27% earlier this year, the lowest since 2002, according to Fed data. Japanese accounts, historically among the most active buyers of US government bonds, in particular face prohibitively steep hedging costs amid this year’s plunge in the yen.
More recently, US commercial banks have been unloading Treasuries amid steep declines in deposit balances. Holdings of Treasuries and non-mortgage agency debt, the cleanest read of their stash of government securities, has tumbled from a record high of $1.8 trillion in July 2022 to about $1.5 trillion as of last month, Fed data show.
And then there’s the US central bank which, via its quantitative tightening program, is allowing up to $60 billion of Treasuries to roll off its balance sheet each month. It’s hoard of government debt has shrunk to about $4.9 trillion, down from a peak of $5.8 trillion last year.
“Previously inelastic buyers — central banks, foreign investors and banks — are now retrenching,” said Jean Boivin, a former Bank of Canada official and the current head of the BlackRock Investment Institute. “The Fed’s quantitative tightening means other buyers become more important.”
The shifting demand dynamics come as the US deficit continues to surge, topping $1.52 trillion in the 11 months through August, with no end in sight. Amid the profligate spending, the amount of marketable US debt outstanding has ballooned to more than $25 trillion, a roughly 50% increase since the start of 2020.
“It does appear that supply – particularly from the demand side – is becoming a lot more worrisome and creating headwinds for the Treasury market,” said Gennadiy Goldberg, head of US rates strategy at TD Securities Inc. “If the macro does not win out and we are stuck here for longer than we expect – at these rates – and there’s not a recession, then the supply headwinds will become more and more relevant and impactful.”
“We have to deal with a different buyer base for Treasuries,” said Priya Misra, a portfolio manager at JP Morgan Asset Management. “The marginal buyer of Treasuries will be asset managers. And that will mean more volatility since these buyers will be more price and flow sensitive. Foreign central banks had to invest their reserves and banks had to invest their deposits. But asset manager demand is a function of inflows and performance of different asset classes.”
But all of that said, the term premium has gone the other direction during the Treasury rally now back into negative territory.
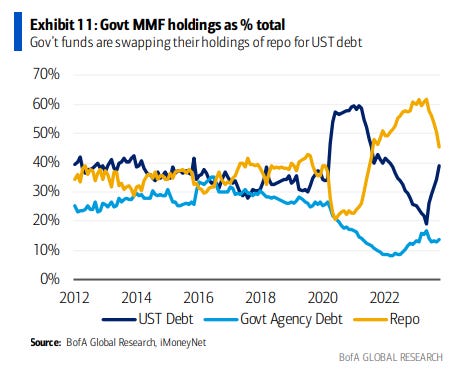
And this week as noted in addition to $257B in bills (<1 yr) which will be picked up by RRP and money market funds as they shift out of the RRP facility (now holding a larger share of bills than pre-pandemic)…
…. we’ll get some shorter term note auctions in $54B in 2yrs, $55B in 5yrs and $39B in 7yrs. Those will need to find other buyers so we’ll have to see how well all that supply is digested.
So I as I’ve been noting the past several months, we’re looking at a different yield paradigm for the time being than what we saw pre-pandemic. While I think there’s a decent chance we have seen the peak in yields (f they do make it back to 5%, I think there’s a wall of buyers , I also don’t think we’re going to see sub-3% 10-year Treasury yields anytime in the near future. That said as noted last week there is a growing chorus of Wall Street banks saying it’s time to buy bonds.
For investors stashing record sums in cash, US bond managers overseeing a combined $2.5 trillion have a bit of advice: It’s time to put that money to work. That’s the message from Capital Group, DoubleLine Capital, Pimco and TCW Group. And it comes as many fixed-income managers are still licking their wounds following a tough year that’s seen the bond market trail ultrasafe T-bills and money-funds carrying the highest rates in decades. The asset managers said in interviews last week that they’re comfortable buying Treasuries and other high-quality bonds at levels they finally see as attractive. And they generally agreed on extending interest-rate risk as far as the five-year area of Treasuries, while also owning mortgage debt, which they consider cheap. While the appeal of cash is clear, “at some point, though, and you’ve seen this just over the course of this month, that approach means you miss all the potential price appreciation if the economy starts to slow,” said Ryan Murphy, head of fixed-income business development at Capital Group. “My sense of things right now is that 4 1/2 to 5% is a safe place to be buying bonds,” said Greg Whiteley, head of government securities investing at DoubleLine. “My sense of things right now is that 4 1/2 to 5% is a safe place to be buying bonds,” said Greg Whiteley, head of government securities investing at DoubleLine.
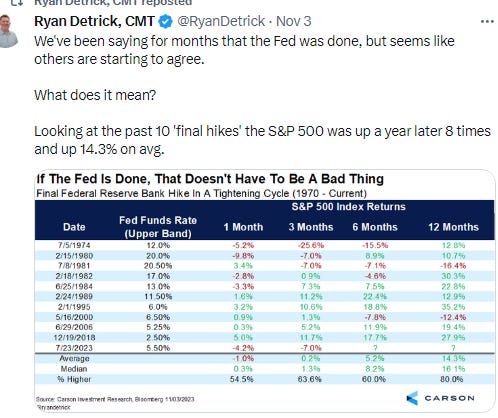
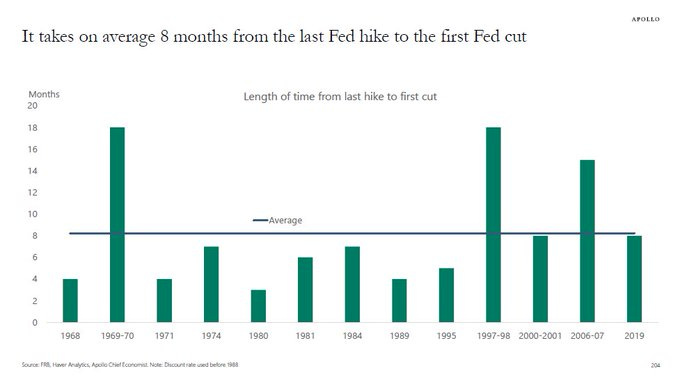
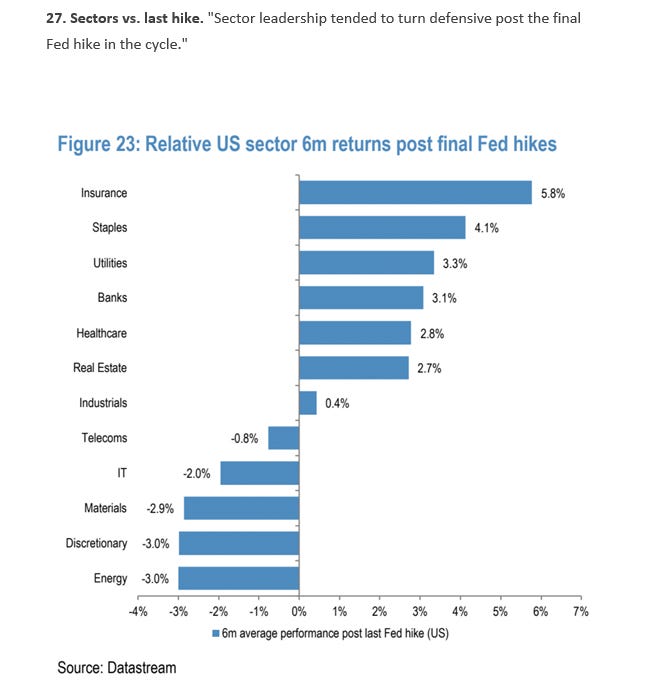
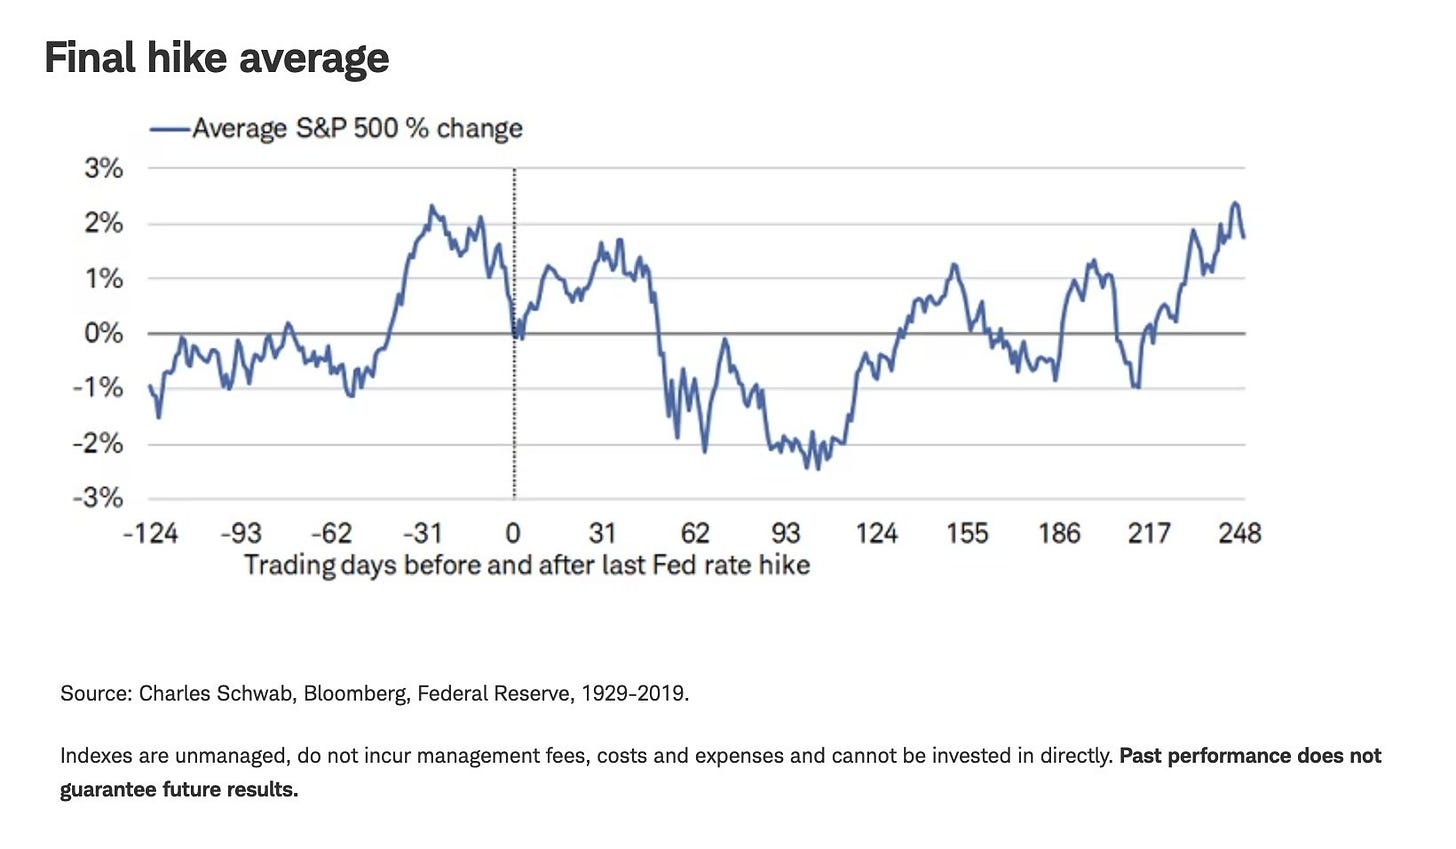
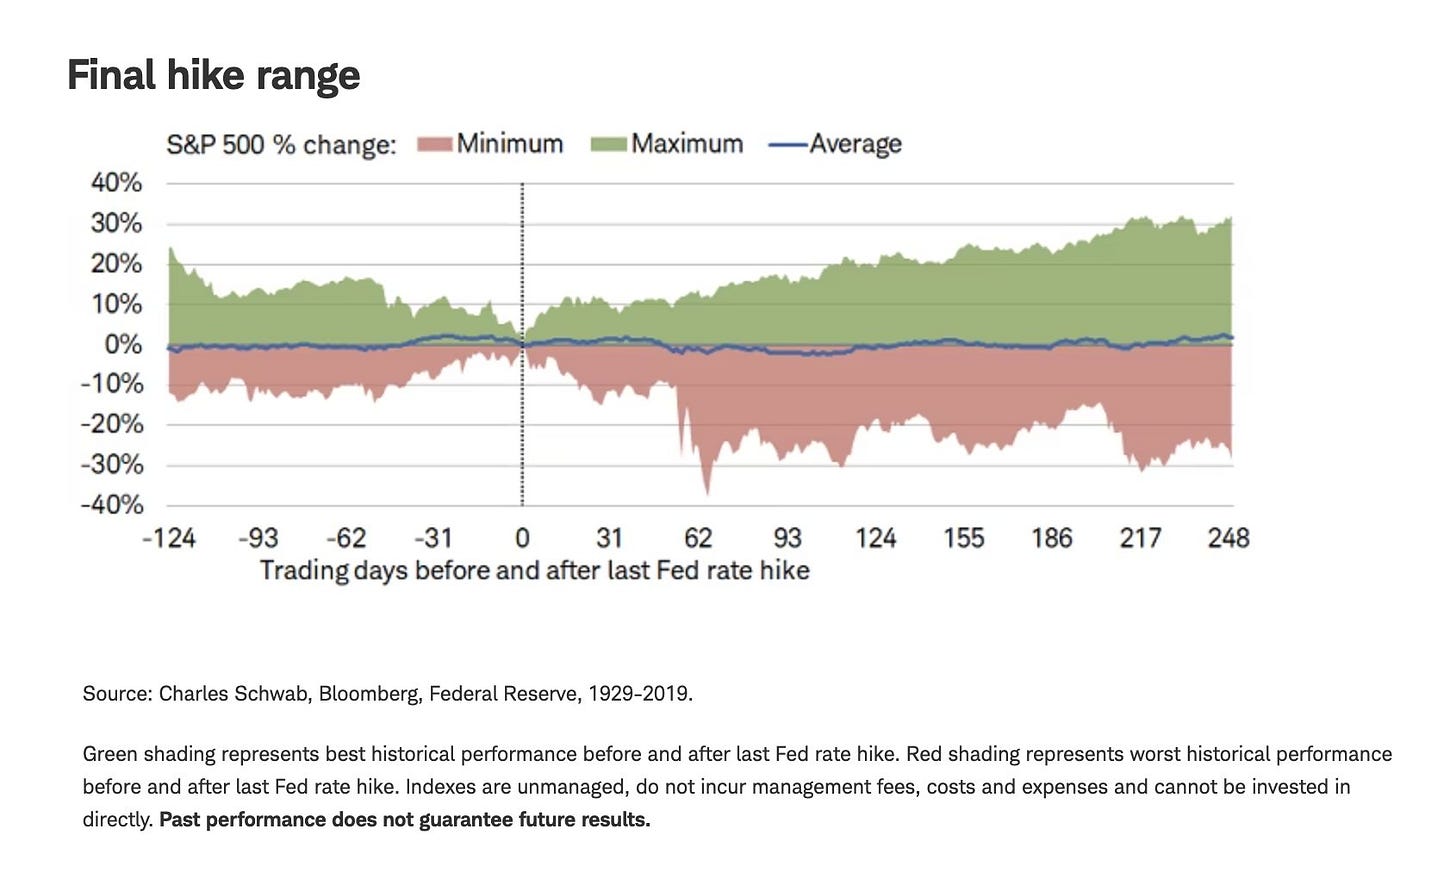
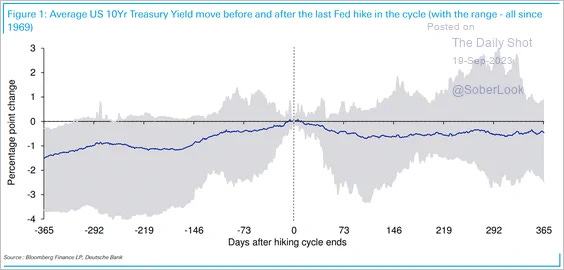
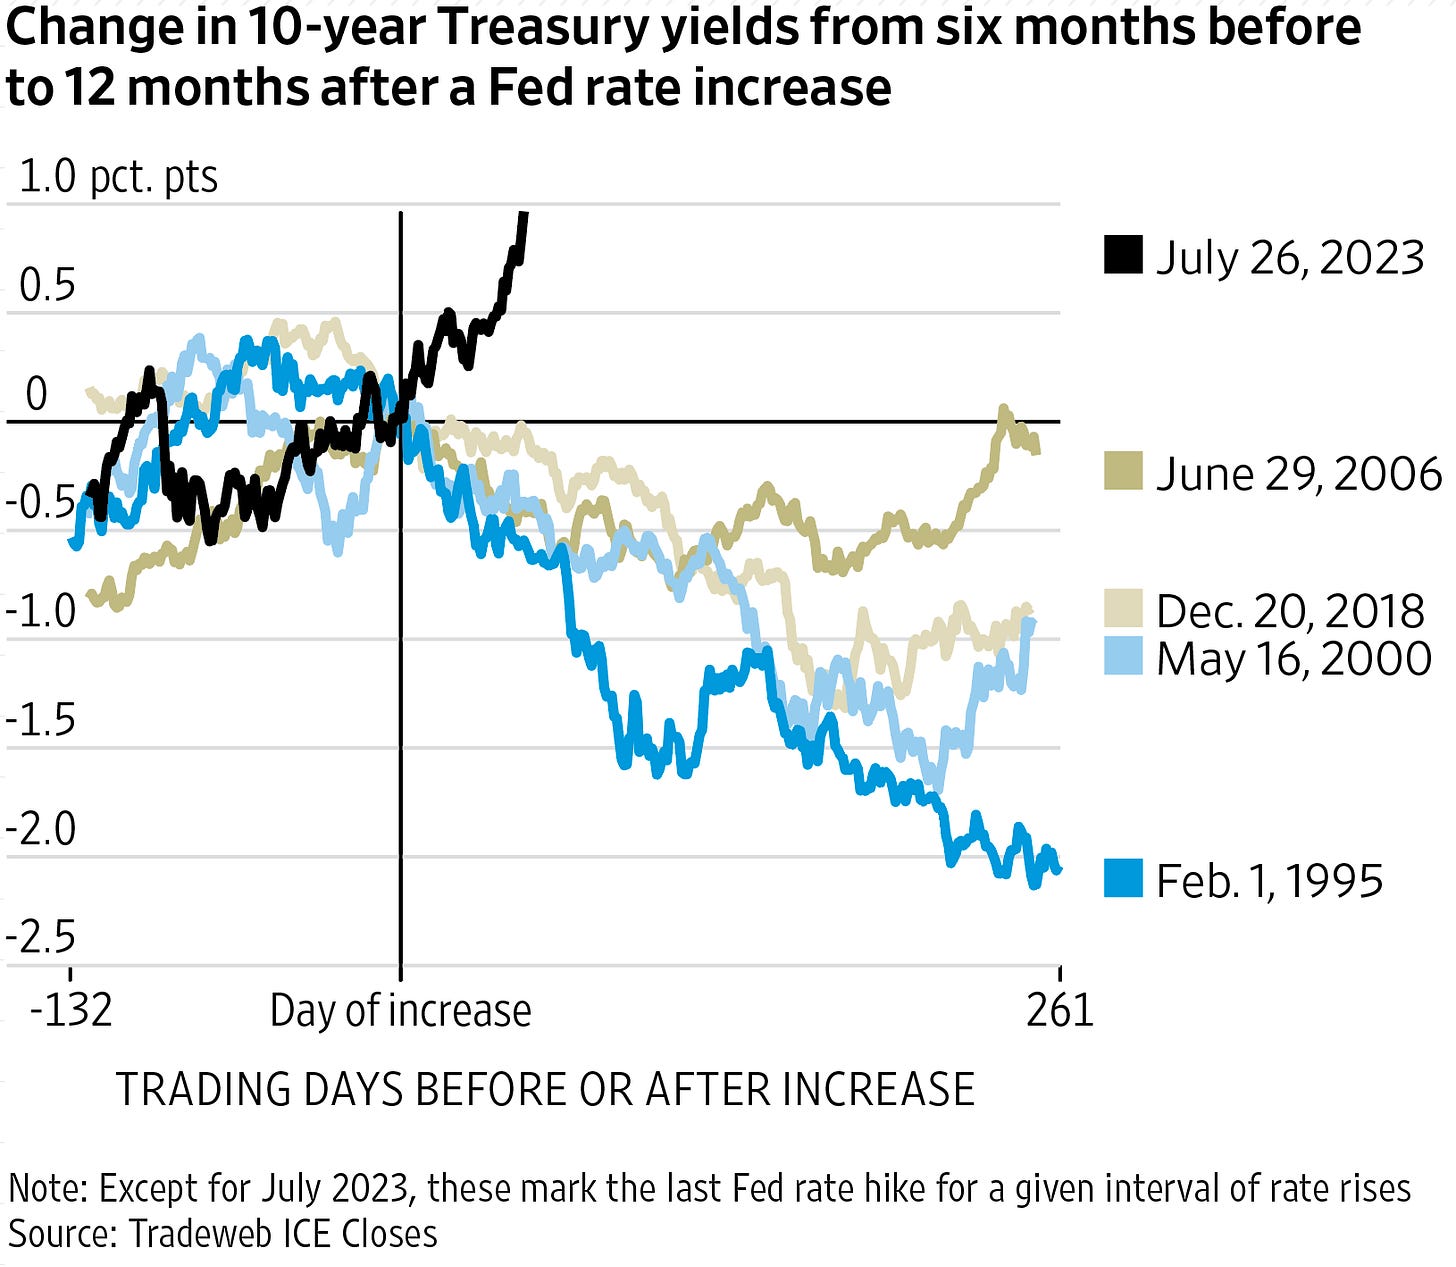
And keeping up those “final hike” charts for now. One thing I’ll note which I heard from a smart analyst on Bloomberg was that there is relatively high dispersion in the data points and not a ton of samples so these need to be taken with a big grain of salt.
Fed Chart
Earnings - As I noted coming into the year,
Along with the path of inflation this is a critical point for 2023. Do earnings hold up or do they crack? I think they will continue to be “better than feared”, but if not we’re likely looking at a new low for this bear market or at least a revisit to the lows.
And as I noted in May, at this point given the progress the equity markets have made from the October lows, we’d need to see more than just some mildly disappointing earnings to make it back down to those October levels. We’d really need to get the sub-$200 SPX earnings numbers predicted by the most staunch bears to get that sort of drawdown (i.e., “a revisit to the lows”). So whether earnings follow their expected path (i.e., a bottom in 2Q and moving higher from there) will be a key factor going forward as to the sustainability of the equity rally which has now discounted that rebound in earnings. In other words, it will come down to earnings to decide if stocks can support their P/E’s.
And with 99% of the SPX reports (by market cap) in, as I noted three weeks ago we can at this point basically book the results which have been pretty good. These stats are through last Thursday, and through that date we had 82% beat on earnings according to Factset (which is the highest since Q32021), and above the 5-year average of 77% and 10-year average of 74%. The beats have been +7.1% above estimates, which is below the 5-year average of 8.5% but above to the 10-year average of 6.6%. If you exclude energy, though, as noted two weeks ago it’s more like +10% y/y. Revenue beats, though, have been much less stellar at 62% beats, the least since Q1 2020, below the 5- year average of 68% and the 10-year average of 64%, and beats are only +0.7% above the estimates, the least since Q1 2020, and below the 5-year average of 2.0% and the 10-year average of 1.3%
And the strong earnings saw 3Q move to +4.3% from -0.4% four weeks ago, consistent with my thoughts from pre-earnings season that “we’ll beat as normal likely leading to a small increase in y/y earnings” which I added to four weeks ago saying
I might be underestimating things. As noted, on average over the last 10 years companies have beaten by 6.6% lifting the earnings growth rate by 5.4%. As we’re on track so far with that 6.6% beat level, even getting a fraction of that 5.4% would easily push us into lower single digit y/y growth. Notably, though over the past 4Q’s the beat rate has only been 4.4% which has resulted in just a +1.6% move higher in the y/y earnings growth rate.
And it looks like we’re getting something closer to the historic average with a +4.6% move higher in the growth rate thus far. Regardless I think we can comfortably say the earnings recession is over for now.
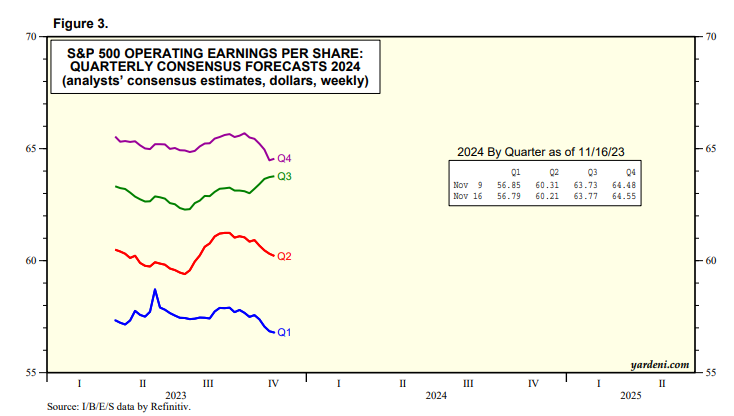
But as noted three weeks ago, while 3Q expectations have improved markedly, 4Q and 2024 have deteriorated on the back of weaker guidance than we’ve seen lately (although it’s still just slightly worse than the 10-year average at 67% negative (with 96 SPX companies reporting guidance). Q4 now is expected to see growth of just 2.9%, almost down to a third of where it stood September 30th. Still on net 2023 has not moved much during the earnings season (to $220.38 from $221.13) as Q4’s deterioration is offset by Q3’s upgrade. As a reminder as I’ve said since August, according to BofA’s research, as we’re past the 2Q reports, the final number should come in within a couple of percent of the $220 number on July 1st. So as I’ve noted in past weeks it’s 2024 that we need to start watching for, and analysts had penciled in a nice jump of almost 12% to over $247 when we started the reporting season. That’s come down a little to $245 but still a healthy increase at over 11%. Although as noted last week, the 2024 jump is back-half loaded so I think at least the first quarter is definitely doable at 6.5% growth. After that, though, double digit growth is expected each quarter. I had said before we started earnings season “it will be interesting to see if Q4 or 2024 gets cut down as we move through Q3 earnings,” and so that’s definitely been the case particularly as to Q4. As always the question will be if earnings can exceed whatever “lower bar” the market has priced in.
But as Goldman noted last week the drop in 2024 earnings estimates since July has been “on schedule” and outside of the big drop in health care well ahead of schedule.
"During the month of October, analysts lowered EPS estimates for the fourth quarter by a larger margin than average."
As noted in earlier reports, both GS and BofA agree with my pessimism about 2024, both looking for more around 5-6% in 2024 earnings growth. A little surprisingly, Morgan Stanley (who was perhaps the most aggressive at calling for sub-$200 earnings in 2023 now sees $2I5 as their base case (which I still think is too low), but now sees $229 (7%) in 2024. In addition to 7% EPS growth in 2024, Wilson sees earnings growing 16% in 2025. As Mike Wilson noted this week, he was “too bearish in terms of expected magnitude of the decline.” While all are below the 12% consensus, it's certainly no earnings collapse that would require a big market correction. And of course given their market caps, much depends on the top 5 stocks to deliver robust y/y earnings (exp's are for +34%).
From Goldman: Given that “the starting point of margins is elevated,” profit growth next year “could end up more flattish, rather than up, and this is without having recession as a base case,” Matejka wrote in a note. “If we have an outright contraction, then corporate profits are likely to fall.”
So for now I will continue to recycle this now familiar language about how I expect we will again in 4Q see a reprise of 3Q (and 2Q and 1Q and 4Q22, etc.):
1Q is not going to be “the quarter” we get the great “reckoning” in earnings expectations to the bears sub-$200 number. As I said last week, “if we continue to beat the lowered bar, it will be a support,” and so far it definitely has been. But with the economic resilience, strategists are becoming more convinced we’re getting to the end of the earnings recession, and remember what I’ve written previously: Stocks normally bottom well in advance of earnings so if 2Q was the bottom for earnings then stocks bottoming in October makes sense.
And you can always choose your own inputs to the P/E model (this is a bit dated).
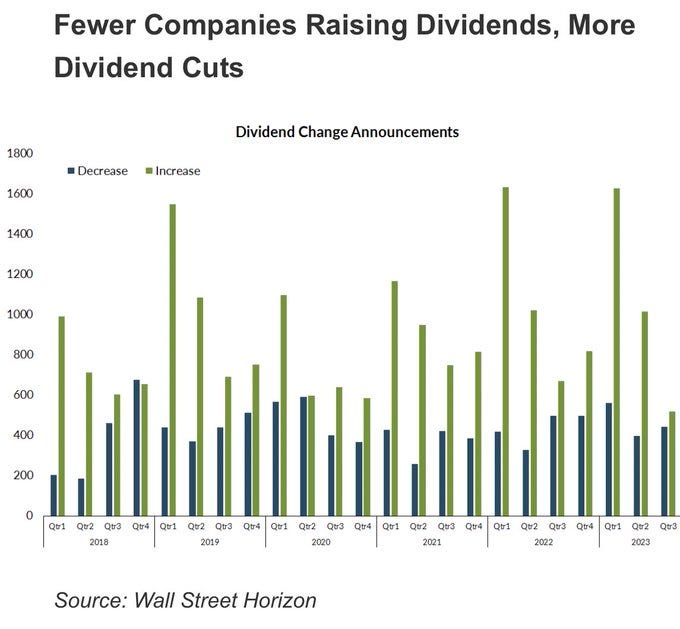
And on the importance of earnings (and dividends):
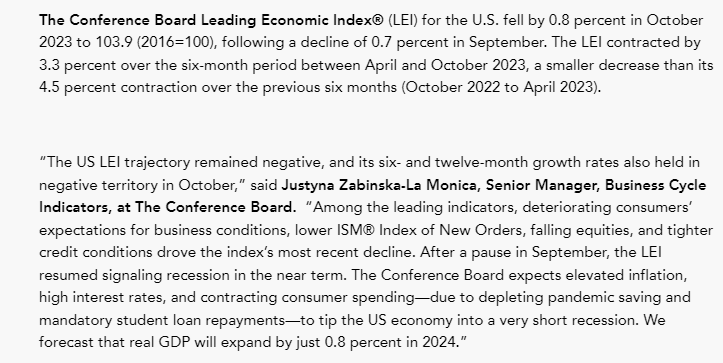
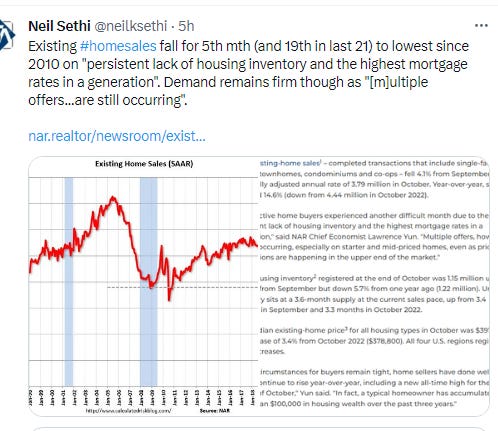
Economy - As I’ve written over the past year, part of my earnings optimism has been due to the economy holding up better than expected. While earnings only track the economy loosely (and markets look forward 6-12 months), there is a clear correlation between recessions, lower earnings, and lower stock prices. So far, though, the economy has held in, although the past few months has shown clear signs of deceleration. The mixed data continued this week. The Conference Board’s leading economic index declined for a 19th straight month, something unseen outside of recessions. The Chicago Fed’s National Activity Index softened to the least since March indicating below trend growth, but remained above its recession trigger. Existing home sales fell for a 5th month to the least since 2010. November flash PMI’s from S&P were unchanged from October with services remaining just above and manufacturing falling to just below the breakeven 50 level. Notably, employment fell for the first time since June 2020. Positively input prices rose the least in 3 years. Jobless claims unexpectedly fell, although continuing claims remained closer to the highs of the year. Durable goods orders also fell more than expected (and business spending was soft for a second month), while University of Michigan sentiment improved from the flash reading but fell m/m to lowest since May with inflation expectations confirming their initial jump.
So while I don’t see the need to raise any alarm bells about an imminent recession, I have to acknowledge that seems seem to be cooling off. That said, we’ll need to see a lot more weakness than we’ve seen to date. In that regard, I posted last week Advisor Perspectives’ four-factor model they use to replicate the NBER’s 6-factor analysis. While it has seen softening that could be consistent with a recession, the indicators are generally going the wrong way (improving rather than declining).
So for for now I will continue to say what I’ve been saying all year (although, as noted last week, I’ve increased the “althoughs” considerably in the parentheticals, evidencing a clear slowing in the economy):
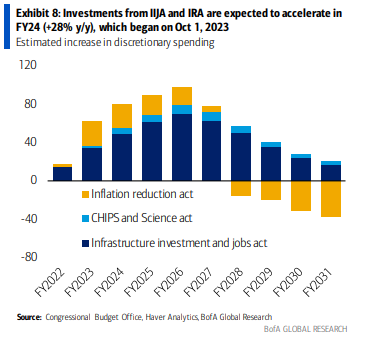
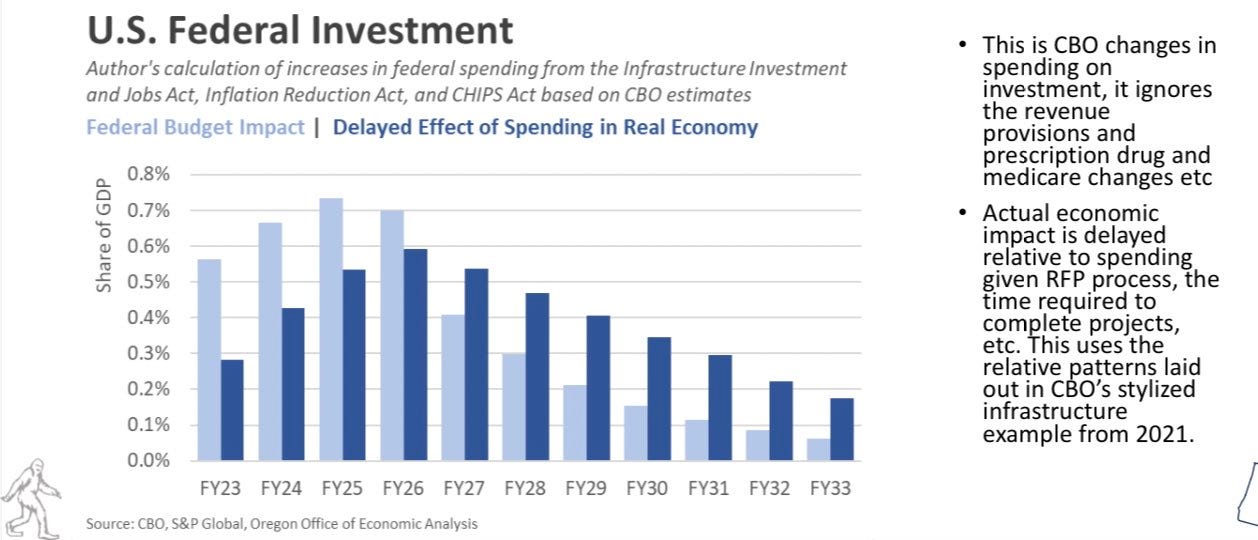
while we’re overall seeing the economic slowing the Fed has been looking for, the economy remains much more robust than I (and, honestly, really anyone) thought it would be following 500bps of rate hikes, and consistent with the much sought after “soft landing.” Wages and inflation remain positive but continue to slow (and real wages were negative the last three months), employment remains solid (although with some clear slowing the past 6 months), manufacturing continues to improve off its bottom supported by the recovery in plane (Boeing and suppliers) and auto production (although obviously that second one has taken a short term hit with the UAW strikes), although business spending has turned negative the past two months, consumer spending remaining solid if slowing, consumer sentiment off the lows (although remaining weak), the services sector growing (although steadily softening), and the construction sector and business investment “sneakily strong” as I’ve put it due to housing bottoming (although multi-family is clearly in a downturn, and single-family will remain constrained until mortgage rates come down (although there’s a record number of units in the pipeline that need to be worked through supporting construction for now and single-family remains above pre-pandemic levels)) and flow-through from the Inflation Reduction Act (something (the flow throughs from the IRA and previous infrastructure bill) that I think was missed until recently as it supports not only construction and business investment but also employment in those industries and associated businesses).
And the softening is also seen in the Citi Economic Surprise index which while positive has fallen to its lowest this year.
And on the IRA, I thought I'd leave this in for the time being as a reminder that this will be an ongoing economic support as we saw in 2Q and 3Q GDP:
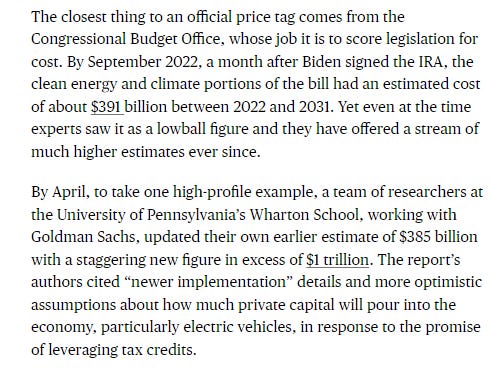
I didn’t realize but the actual amount of IRA benefits is unknown as the tax credits are uncapped. More recent estimates are upwards of $1T, and Goldman thinks the total "impact" will be $3.3T in arguing that green investments are underpriced. $3.3T is obviously an eye-popping number.
And also from prior weeks:
Meanwhile the Weekly Economic Index from the NY Fed (which is scaled as y/y rise for GDP vs year ago quarter (not Q/Q)) edged down to 2.33% from 2.35% last week, a tenth below the highest of the year, and the 13-week MA the highest this year at +1.91%.
While the 4Q GDP Nowcast from the Atlanta Fed, which as a reminder was the closest for 3Q, edges up a tenth to 2.1% on an upgrade to private investment (to -1.1% from -1.8%).
While the NY Fed’s which was far below the Atlanta Fed for 3Q is right in line at 2.2% from 2.4% last week for Q4.
While the St. Louis Fed GDP tracker for 4Q is back to the lowest of the three Fed bank trackers, but very marginally, at 2.04%. As a reminder they were also the least for 3Q at 2.31%.
And Goldman edges up to 1.9% (from 1.8% last week). As a reminder they see some headwinds to Q4 after which GDP should move back to potential in 2024.
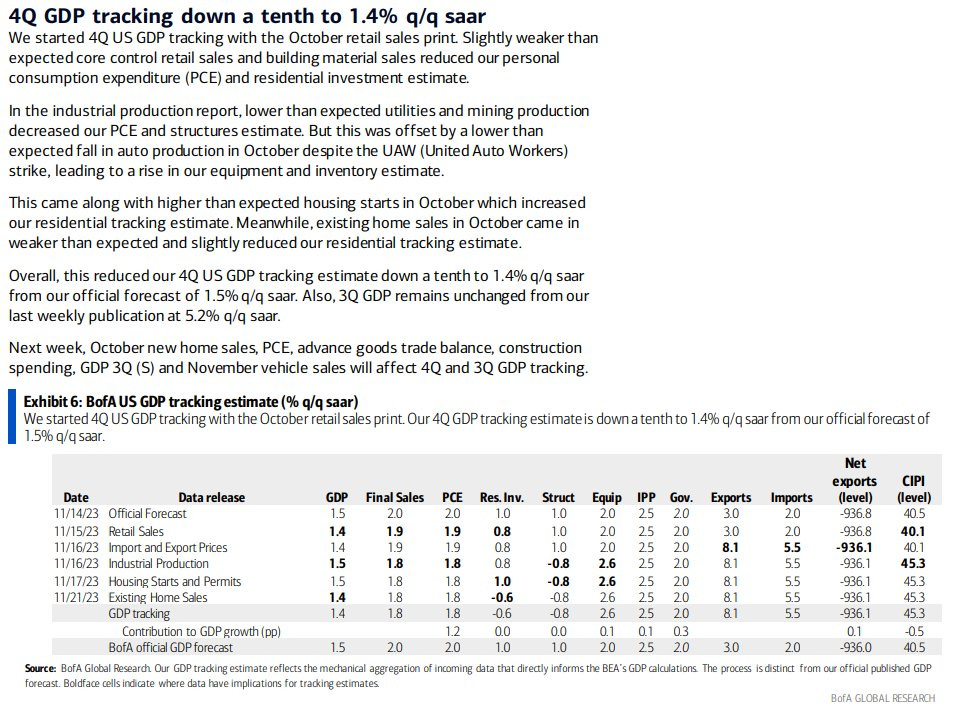
While BoA starts their 4Q tracking at a relatively pessimistic 1.4% Q/Q.
And here’s their expectations for 2024 and 2025:
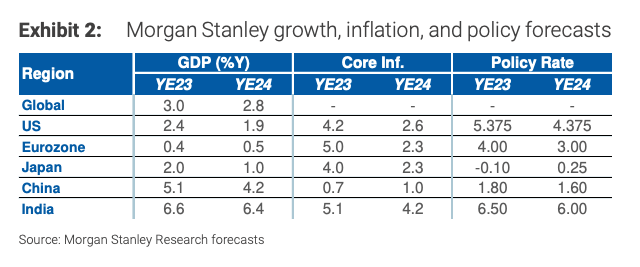
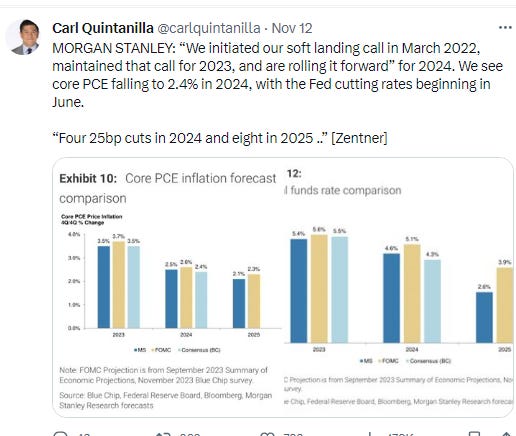
While Morgan Stanley is looking for 1.9% GDP in 2024.
But also decelerating job growth (which in fairness in is line with basically every other economic modeling out there).
And JPM sees +2.0% in Q4 and +0.7% in 2024. They see core PCE ending next year at 2.3% with four rate cuts all in the 2nd half.
And some other economy stuff.
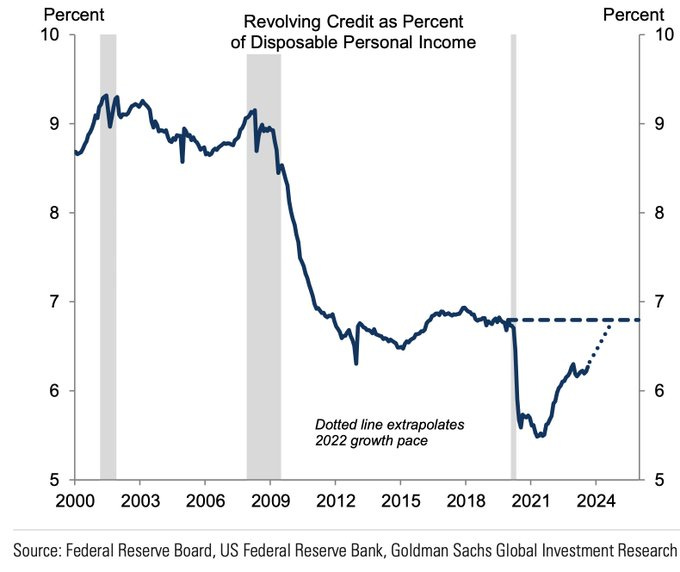
BI - money market funds are now generating more than $22B a month in interest income. If all spent, that would add "more than 1% to GDP.”
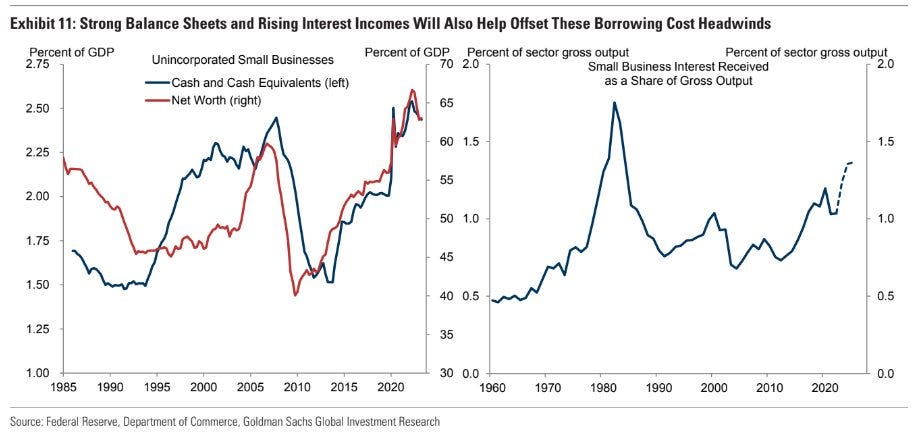
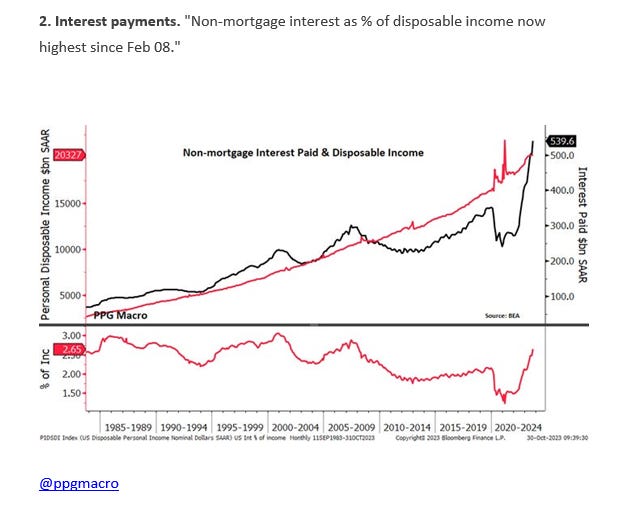
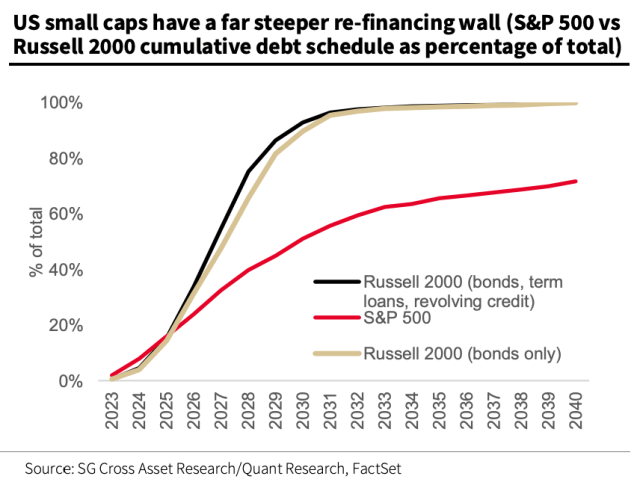
But importantly, it’s critical to note the disparity between large cap corporates and “everybody else”. As you move down the cap spectrum things become more dicey.
Around a third of debt on Russell 2000 firms’ balance sheets is floating rate. That figure for S&P 500 companies is just 6%. Net debt to EBITDA for small-caps is 2.9x. It’s 1.7x for the S&P.
“The strain of higher rates is even more acute for small, private businesses,” Kostin remarked, noting that according to Goldman’s estimates, around 50% of small business debt is either credit lines, short-term loans or other floating-rate debt.
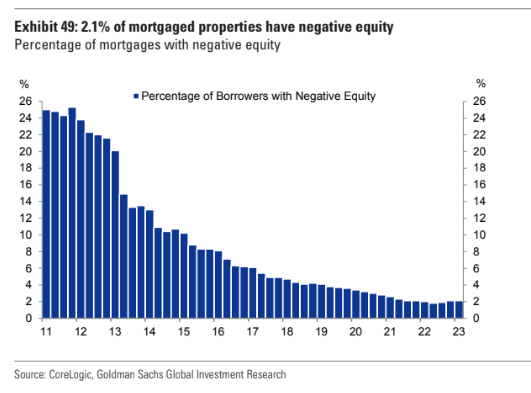
And I think now that we’re starting to really see the impacts from the tightening in the pipeline come through, I think the below discussion takes on greater relevance. I still remain unconvinced we’ll see a recession, but I think it’s foolish to rule it out:
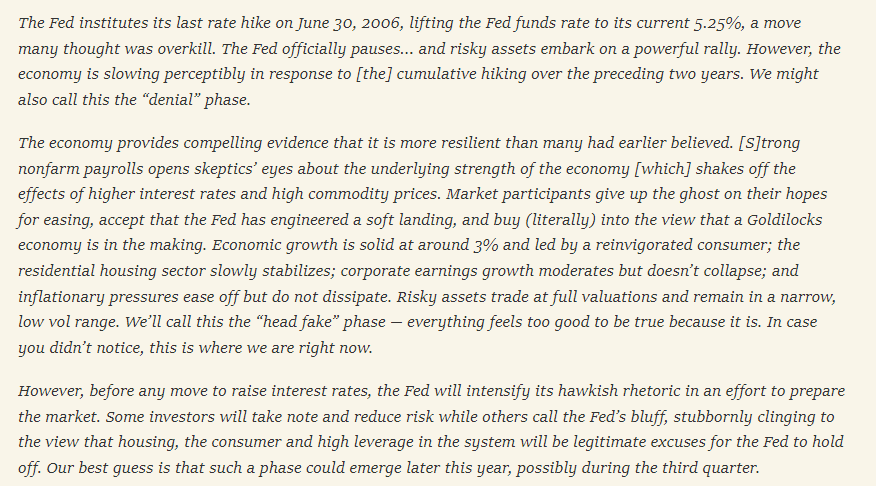
it’s very important to keep in mind that with things like recessions and bear markets, they generally are not expected (which is why I was dubious when the consensus was one was coming). I was actually less concerned about a recession (very mild one) than I have been since the end of June.
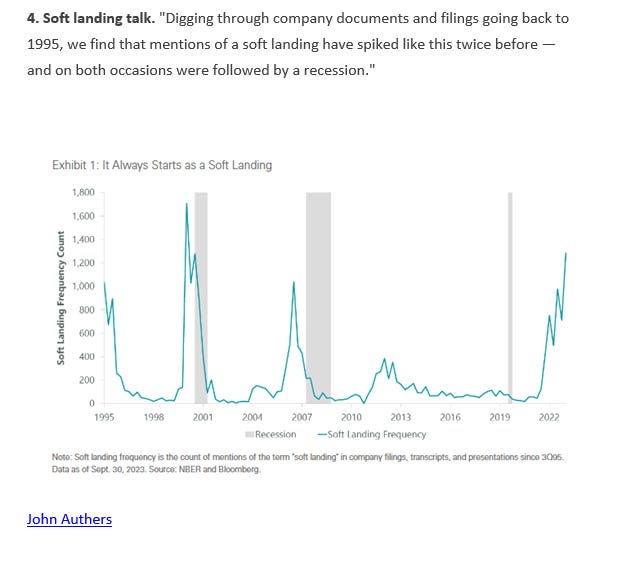
To that point, Anna Wong, BBG’s excellent chief economist, looked back to 2007, two months before the recession started, and found job gains in that month were 166k and the Fed meeting noted a lot of comments about a potential “soft landing”.
So while I feel good about things today, I can’t say conclusively I’ll feel as good about them six months from now. That’s the unfortunate nature of a Fed tightening cycle.
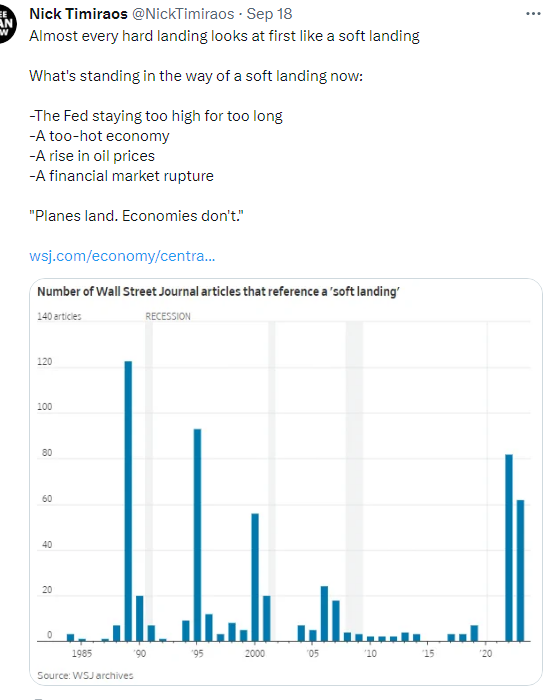
This concept (that a hard landing starts off looking like a soft landing) is something that is gaining more and more traction in the financial community. Anna Wong updated her analysis a few weeks ago and found that soft landing talk preceded all of the last 4 recessions prior to Covid. The reason is that economic data deteriorates on a nonlinear basis which is not how humans think, so it's tough to see coming. Unfortunately there’s really no good way I know of to parse out in advance which way things will go, so the best we can do is just continue to watch the indicators.
And Marko Kolanovic touched on this last week as well quoting this note from Edward Marrinan in January 2007:
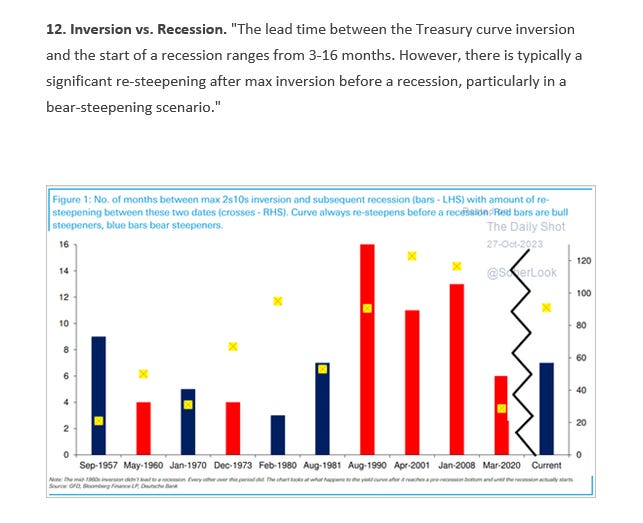
And with respect to the long and variable lags part of things, the NY Fed Recession model which is built around the yield curve.
The NY Fed’s yield curve-based recession probability model (Exhibit 5) indicates a 47% probability (highest since 1982) as early as this December and increases dramatically from there – a peak 71% probability of recession by May 2024. The October 2023 recession probability is/was 26% – elevated by historical standards, but by no means a slam dunk on a recession.
But as noted previously, according to 3F Research we can’t rely on credit spreads to let us know in advance.
Multiple - This stays the same as prior weeks but as noted since late May, I’m starting to get a little more comfortable with the idea that the overall SPX multiple doesn’t need to (and at this point almost certainly won’t) come down to the levels we’ve seen in previous earnings recessions, if only because earnings have held up overall better than a normal earnings recession, and there are other factors (lower volatility, the trend higher in multiples overall the last two decades for a variety of reasons (more stable economy with smaller and shorter recessions, less risk of financial catastrophe, lighter asset models with more intangibles, etc.), and we appear to have hit our cyclical bottom in earnings (P/E’s often peak at an earnings trough)). If so, then it would be normal for valuations to be on the expensive side (as equities are expected to “grow into” the valuation).
And we had coming into the month taken taken the SPX forward P/E down to just 17.1, the least since March and below both the 5-yr average of 18.7 and 10-yr average of 17.5, but with the rally since then, the P/E is now up to 18.8, not what I’d consider a huge headwind (Bloomberg Intelligence estimates “fair value” at around 19.5x) but certainly not a tailwind, although remember that the index level P/E is burdened by the top 10 whose prices have outrun their earnings growth. Valuations for the equal-weighted SPX are much more reasonable (and for small caps as discussed below downright cheap). Regardless as I have repeatedly noted valuations are not a great tool for anticipating stock price moves except over long time frames (years).
And as noted previously outside of the top-10 stocks multiples are arguably on the cheaper side (particularly for small caps).
Which has BoA calling for 12% per annum returns based on valuation
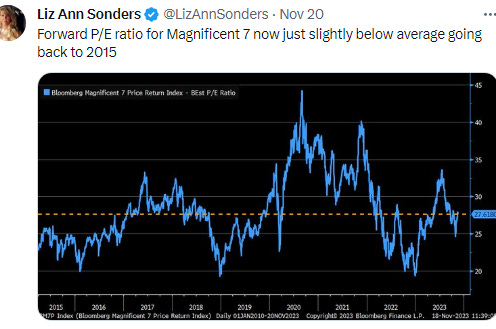
But, again, there is at least some explanation for the higher valuation of the top names whose multiples are actually well off the peaks.
Technicals - Another week, another push through key resistance on the big cap indices. The RUT remains choppy, but it’s still overall made very good progress this month.
From Friday’s note:
The SPX (+0.1%) was up for the 16th session in the last 19, remaining roughly on a trendline running back to the January 2022 highs. As I said three weeks ago “Is the next stop a test of the July highs? Maybe but probably not in a straight line.” As I noted Monday, “so far, it’s been pretty straight, we’ll see if it can get over that trendline. The daily technicals remain very supportive.”
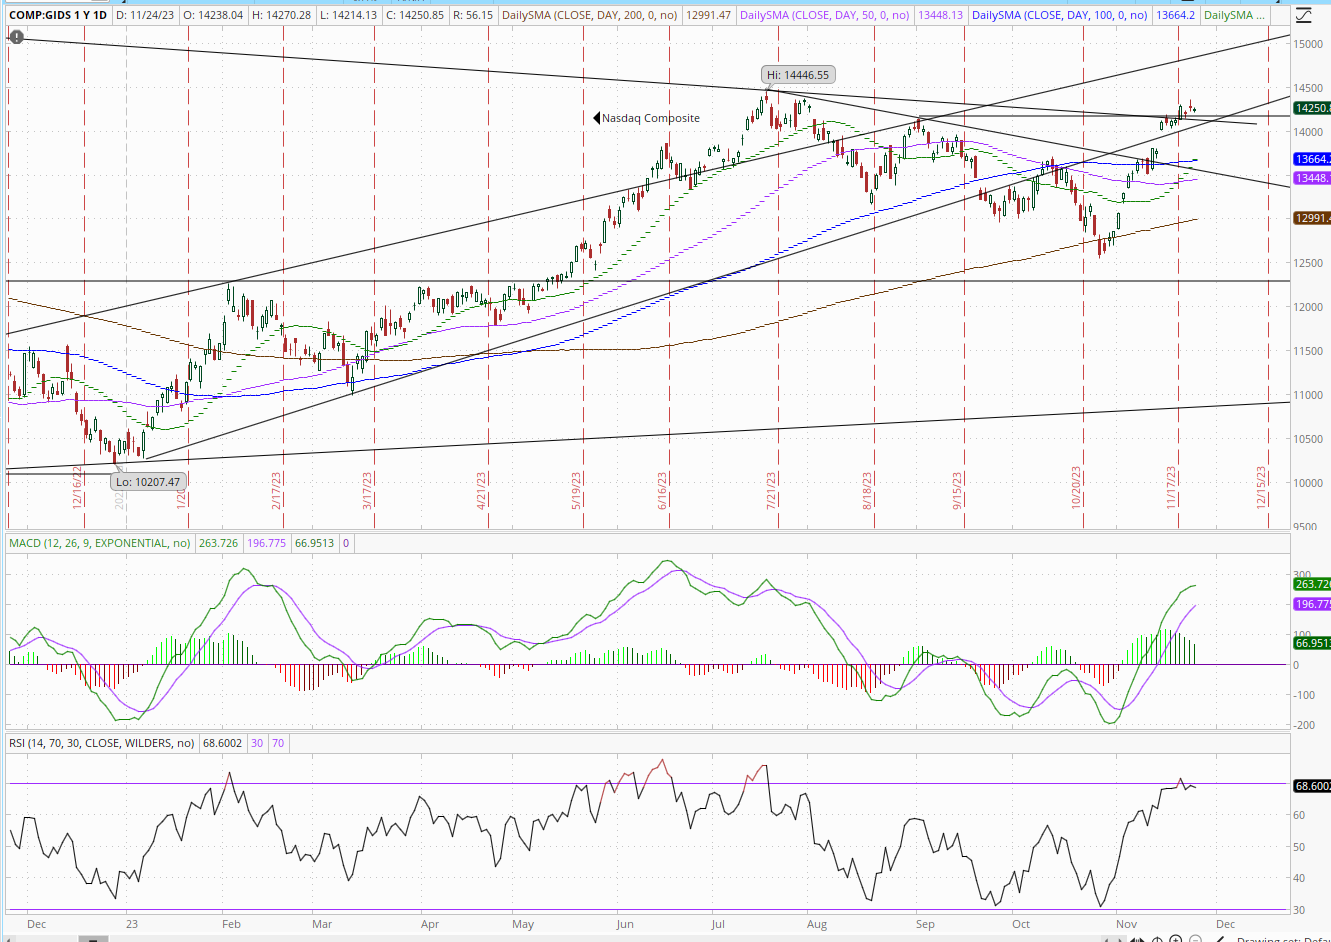
The Nasdaq Composite (-0.1%) continues to remain above all notable resistance between it and the 2023 highs which are around a percent away. It has a similar daily technical condition to the SPX.
RUT (+0.7%) rose back over 1800 as it remains choppy. Still it’s overall made very good progress this month, and the daily technicals remain supportive.
And some technical notes:
Breadth/Sectors - In terms of sector breadth coming off the very strong week a week ago, it remained very healthy with well over half the stocks up most sessions, and just a total of three down sectors the final two days. Positive volume on the other hand which also was coming off a strong week was relatively disappointing this week until Friday, although it was a light volume week overall so hard to read too much into it. Friday though was great, but given it was a half-session wedged in between Thanksgiving and a weekend, it’s probably even less meaningful. The previous Friday was also very strong but we didn’t get much carryover into this week.
From the Friday update:
SPX sector breadth pretty good for a barely green day with 9 of 11 sectors green (the two down sectors were two of the three large cap growth sectors, both down less than a half percent). Still no sector was up much over a half percent either.
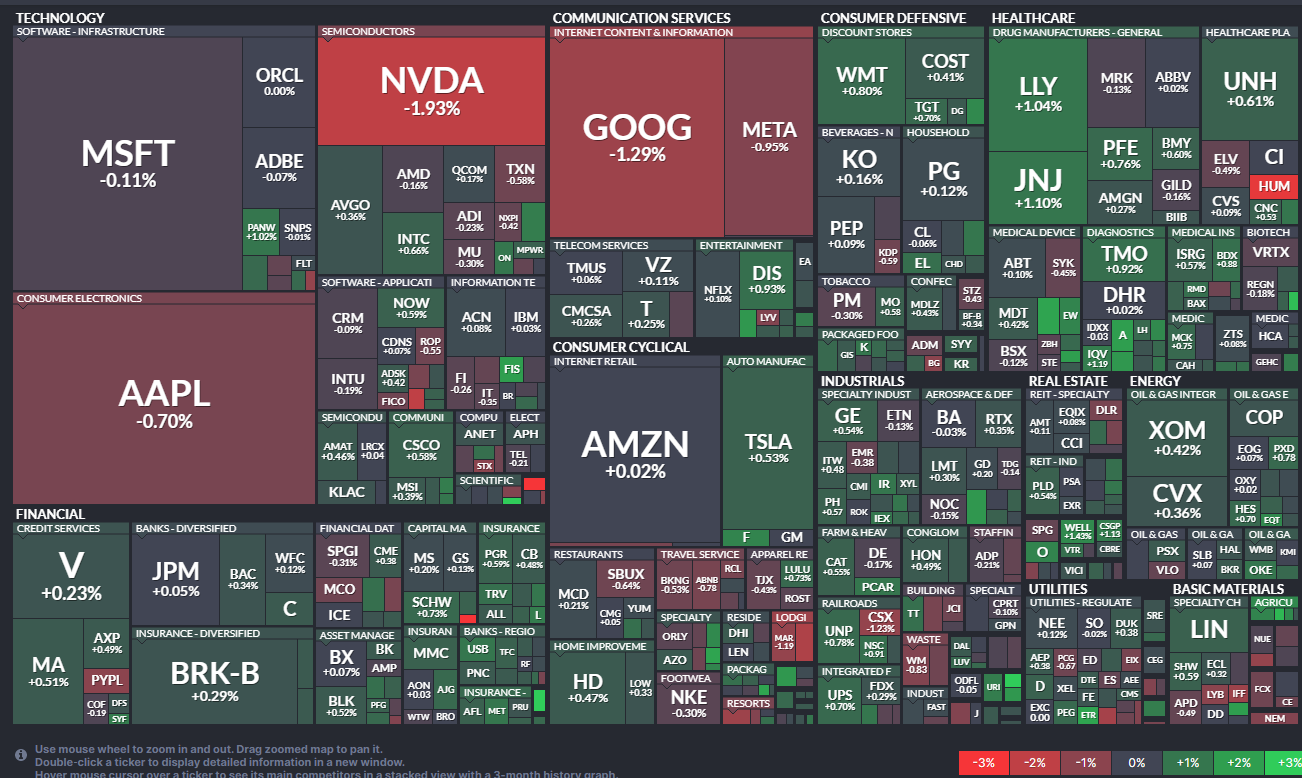
Here’s the stock-by-stock SPX chart from Finviz. NVDA a conspicuous laggard for a second day.
Positive volume, which had been very solid last week but disappointing this week, ended the week strong with 71% NYSE and 72% Nasdaq, its best combined day of the week. Issues similar at 71 and 67% respectively. Hopefully this will continue into next week.
While the A/D lines remain a mixed bag. The NYSE are more consistent both improving modestly but remaining way behind the levels of the indices which are threatening 2023 highs. The Nasdaq is a tale of two lines. The issues A/D line remains near the lows of the year while the volume line is now at a new high. I prefer the volume lines, so I’ll take it as a positive, but it shows the lack of breadth on that index.
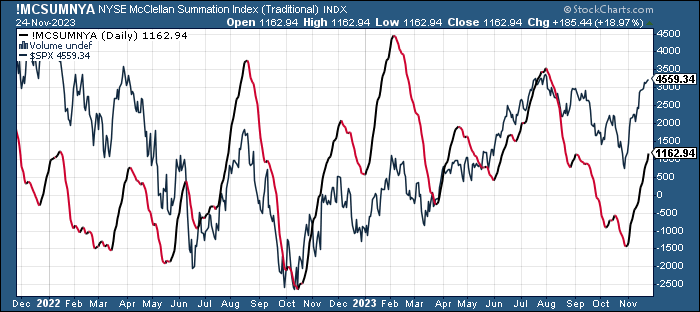
The McClellan Summation Indexes (what the avg stock is doing) are more consistent continuing to improve rapidly but again are not near the same levels as the indexes versus the 2023 highs.
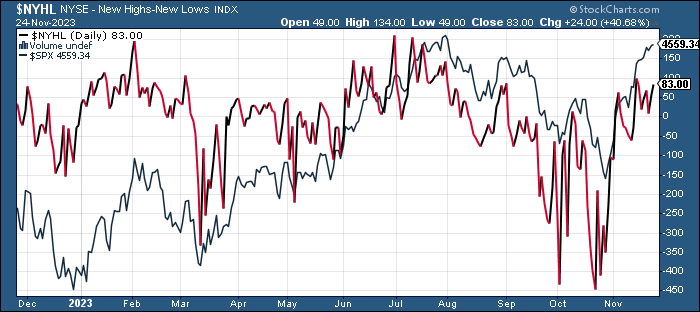
New highs-new lows also are improving and are closer to their 2023 highs.
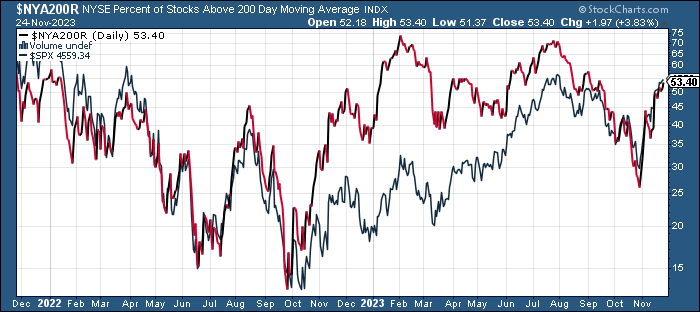
And % of stocks above their 200-DMAs continues to track closely with the indices during this rally. After less than one-third of stocks for companies in the S&P 500 index were trading above their 200-day moving averages two weeks ago, that’s now just over 50% on the NYSE, while Nasdaq (which normally lags) is at 31%, up from 16% two weeks ago.
While the equal-weighted S&P continues its modest bounce from the end of last week when it almost matched the 2020 lows.
While IWM:SPY is just off the lowest in two decades.
Looking at sector performance last week, while not as strong as the previous week where we saw every sector advancing, and 9 of 11 up at least +1.5%, 6 of 11 up at least +2.9%, it still was very healthy with again every sector advancing, all but one up by at least a half percent, and six up at least 1%. So three of the last four weeks we’ve seen very solid index action. As I said last week, “that’s a bullish sign to me.”
Consumer Staples +1.4%. Utilities +0.6%. Financials +1.%. Communications +1.3%. Healthcare +2.2%. Industrials +0.8%. Information Technology +0.6%. Materials +1%. Energy +0.3%. Consumer Discretionary +0.8%. Real Estate +1.1%.
Here's the SPX heat map from last week. A lot of green again last week. NVDA sticks out like a sore thumb.
So overall breadth continues to improve but has a lot of room to improve further.
And a nice sector calendar I’ll keep up from EquityClock (I have no idea how accurate it is).
Flows/Positioning -
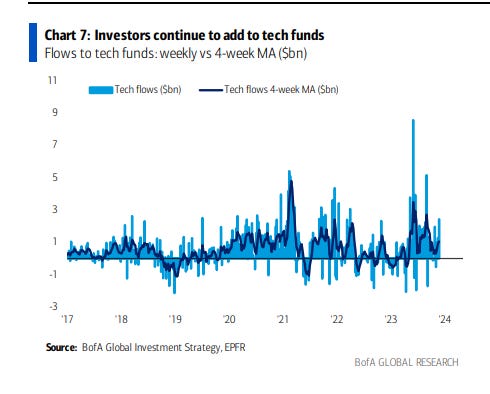
In terms of equity flows, BofA using EPFR Global data (for only four business days due to Thanksgiving holiday) saw a third week of inflows following a four-week streak of outflows (+$16.5B, following the prior week’s $23.5B (which as the largest of the year) with the 2-week inflow the largest since February 2022)) bringing the net inflow to stocks over the last 25 weeks to +$152.6B. Tech continued to lead inflows with +$2.4B, the most in 12 weeks, and has taken in +$25.1B over the last 20 weeks (and +$42B this year). Financials were second in inflows for a second week after a 15 week string of outflows (+$0.3B, $1.2B over the 2 weeks). Materials broke a 5-week string inflows which had been the longest streak since May 2022 to lead outflows (-$0.7B). Consumer also saw an outflow for the 8th week in 9 -$0.5B and -$6.7B over the past 9 weeks. Healthcare saw an outflow for the 11th week in the last 13, -$0.5B, -$6.3B over the last 10 weeks. Real estate saw another week of outflows, -$1.7B over the last three weeks.
US saw a 6th week of inflows, +$13.9B taking the last 10 weeks to +$71.7B, with almost $50B of that in the last three weeks. Europe in contrast saw a 37th straight week of outflows (will it ever end?) although barely at -$0.03B, -$62.3B YTD), while Japan saw its 3rd outflow in a row and 4th in 5 weeks (but only 6th in the last 23 weeks accelerating to -$1.9B) cutting the YTD total to +$11.3B. EM equities saw a 7th week of outflows (-$0.04B), with an outflow from China offsetting inflows to Brazil and India. This still leaves the year’s haul for EM at +$86.3 (with $64.7B of that to China (and +$12.3B to India which saw an inflow of +$0.4B this week)), although DM is catching up with +$56.7B to developed markets ( up +$50.7B in just the last three weeks). The US YTD is also now +$56.7B YTD since hitting positive for the first time this year 10 weeks ago, with the net inflow post-Nvidia’s big beat earlier this year (and debt ceiling resolution) +$122.9B. US large caps led inflows for the 12th week in thirteen +$10.5B after +$23.7B last week which was the largest since Feb 2022 while small caps saw a still healthy inflow of +$2.4B (+4.9B last three weeks).
Equity allocations of BofA clients edged higher for a third week after hitting the least in over two years three weeks ago.
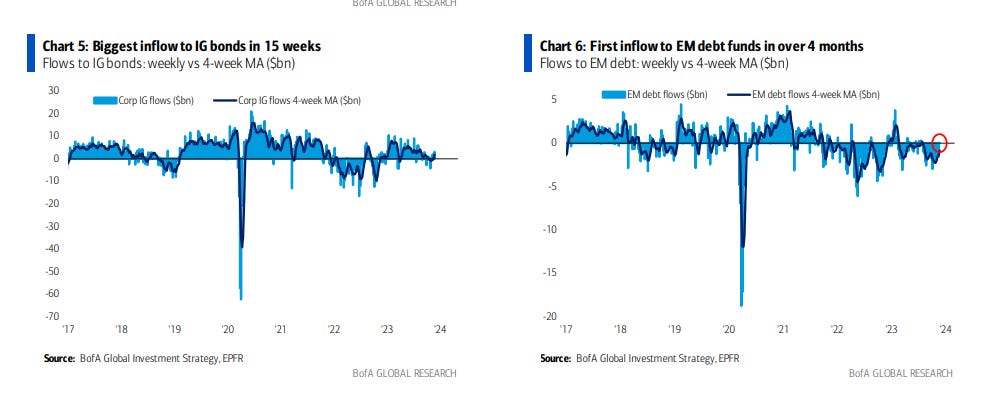
Bonds saw a seventh week of inflows +$4.0B, the 35th week of inflows in the last 36 weeks, with IG/HG seeing +$3.1B, the 30th inflow in 34 weeks and the largest since May, +$145B YTD. Treasuries though saw their second outflow in a row after 30 weeks of inflows, which had been the longest streak since 2010 (-$0.4B, -$1.4B over the two weeks). Treasuries have still taken in $176.4 YTD and still are on pace to set a new record (and along with 2022 in a completely different universe in terms of flows than any year previously). Bank loans returned to inflows, the 6th in 7 weeks and 14th in 17, at +0.1B, while HY saw a fourth week of inflows (although just the 5th in 17 weeks) of +$1.2 (+$10.8B last three weeks, but -$9B YTD). EM debt broke a 16-week string of outflows, the longest streak since 2022, with a tiny +$0.02B inflow, but they’re -$32B YTD. TIPS saw their 11th week of outflows (-$0.9B), -$27B YTD.
BofA private client AUM to bonds has stalled but still around the highest since June 2020.
Gold saw 2nd week of inflows in the last 3 weeks (but only after a 22-week string of outflows) (+$0.7B the largest since May), while cash saw another big inflow of +$40B taking the five week total to +$231.6B. Cash YTD has taken in $1.2T on track for a record $1.3T. Cash has taken in nearly $2.6T since 2019.
As BofA private client AUM to cash have drifted below average levels.
And ICI data on money market flows was a little less than the EPFR data above showing a +$29.1B inflow in the week to November 22nd after +$21.9B the prior week, moving the total sitting in MMF’s as of Wednesday to $5.76T an all time high. For the year, inflows stand at $997B.
And here’s a nice visual of the YTD flows.
While hedge fund crowding “is the most extreme" in the last 22 yrs w/the Mag 7 accounting for 13% of the avg hedge fund long portfolio, 2x the start of 2023. That still is nearly just 1/3 of the SPX weighting in its top 10 of 30%.
Mutual funds are actually closer at just 6.5% underweight.
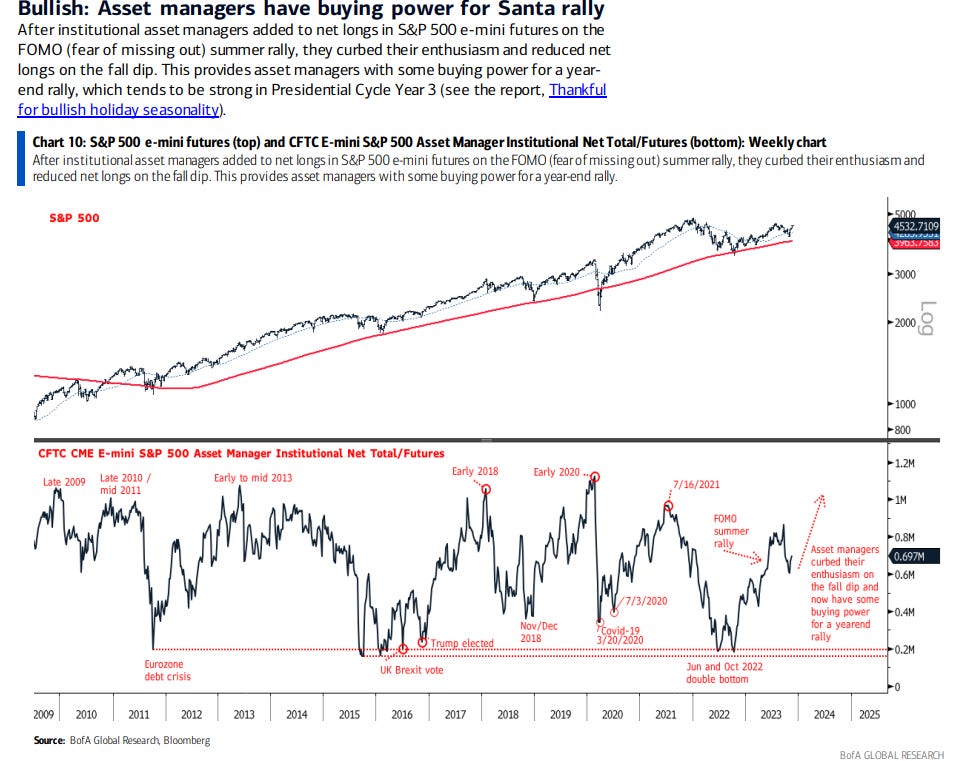
Although BoA says asset managers have buying power for Santa rally.
As demand for downside protection has “evaporated”.
Hedging demand has fallen sharply with the cost to protect against a market selloff down by around 10%, or one-standard deviation, tumbling to the lowest ever in data starting in 2013. Demand for tail-risk hedges that pay out in an equity fall as precipitous as 30% has also dropped and is hovering around the lowest level since March.
“There has been absolutely no demand for hedging — the cost of protection using various metrics are all near lows looking out five years,” said Amy Wu Silverman, head of derivatives strategy at RBC Capital Markets. “Additionally, volatility continues to be suppressed in our market due to volatility selling strategies.”
While Goldman says CTA positioning has gone from tailwind for US equities to a headwind seeing selling over the next week "in every scenario".
CTAs bought more than $60 billion worth of global equities in the last two weeks, according to Nicolas Le Roux of US Group AG, who expects flows to continue though at a slower pace.
While BofA says their work indicates CTA positioning, which had gotten stretched to the downside three weeks ago, particularly on the RUT, and which saw large unwinds the last two weeks, could see more buying in the week to come.
The equity indices that we track all ended the week higher with markedly higher trend strengths than we saw in last week’s report, as our model anticipated. We expect CTA buying in the S&P 500 next week as the index has gained greater than 1% in each of the last four weeks turning its trend strength positive for the first time since early October. Our model initiated a long position this past week that will rapidly increase along any price path next week. Meanwhile, our model already had long NASDAQ-100 and Nikkei 225 positions that look to grow in size along any price path. EURO STOXX 50 price trend also looks to increase again next week and may turn positive enabling a long position to come on. Price trend in the Russell 2000 remains quite negative but is projected to continue getting less negative in the coming days implying short covering. In our daily, data-only version of this report, we track six additional global equity markets that are also projected to see price trend increases; please email us to be added to the distribution.
While for volatility targeters (risk parity) they also see scope for buying due to drops in realized volatility “which should lead to simultaneous increases in leverage to begin the upcoming week.”
And with respect to bonds, as a reminder the last couple of weeks they had seen some scope for short covering in shorter durations but longer durations were at risk of selling. This week they say that short is projected to be covered which would put pressure on yields.
While our model CTA is currently short 10yr Treasuries and Bunds, differently parameterized CTAs may have no duration exposure after covering short positions a few weeks ago. Our model’s remaining short bond positions are projected to see covering next week.
And a reminder we’re now out of the blackout period which should be supportive for stocks.
And something to note.
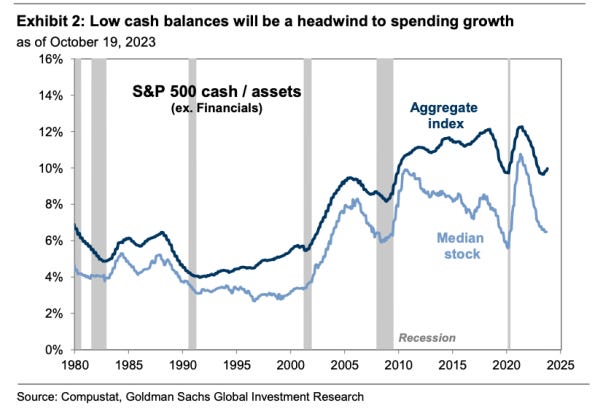
Which is all consistent with Goldman’s analysis that with corporates having run down their cash balances to avoid high rates, the aggregate SPX cash/assets ratio now ranks in the 13th %ile relative to the last 10 years and in the 9th for the typical stock.
This will impact capex, R&D spend, buybacks and dividends which will grow just 4, 7, 4, and 4% respectively in 2024, from 7, 12, -15, and 5% in 2023.
“This sequential deceleration reflects the slowdown in GDP growth and the drag from a more challenging financing environment”
And that seems to be what we’re seeing.
Although not for BoA clients.
Sentiment - Sentiment (which I treat separately from positioning) is one of those things that really only matters at the extremes. I noted two weeks ago that after sentiment had reached extreme (to the downside) territory three weeks ago, with the rally since then certain indicators (AAII, II, NAAIM, etc.) saw historically significant turnarounds. Other more slow moving (like BoA Bull and Bear or CNN Fear and Greed) remained more in the negative camp until this week. Now all are significantly more bullish than when we entered the month, although not what I’d consider extreme.
And after the unusual rise in the 10-DMA of the equity put/call ratio along with equities two weeks ago, the avg has moved lower, but still certainly not in the smooth fashion we normally see where it (black/red line) trends lower as stocks (blue line) trend higher.
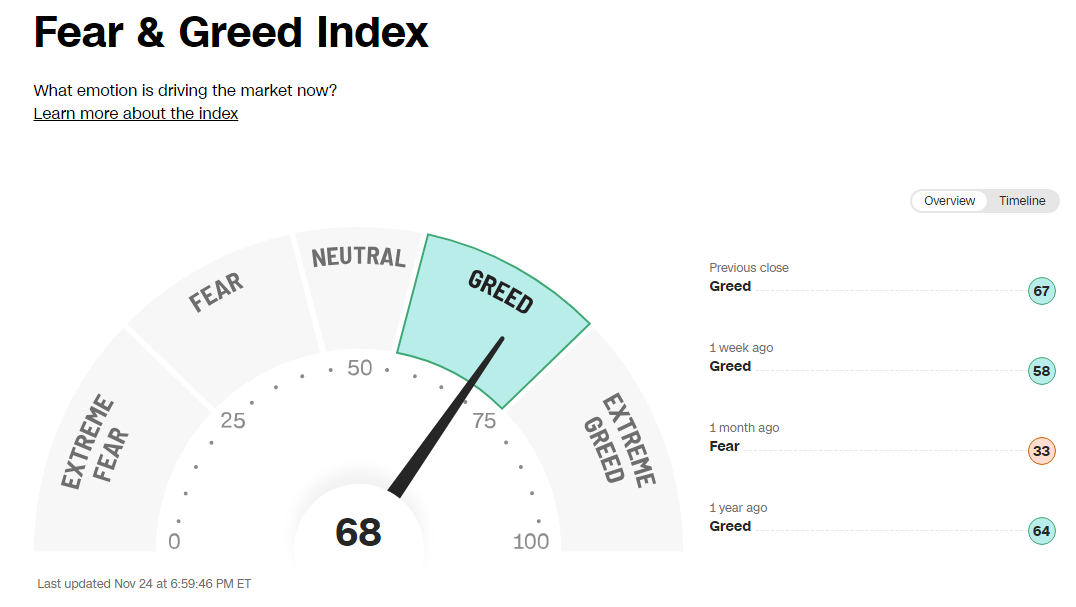
And the CNN Fear & Greed Index moved up another 10 points from a week ago (now up 50 from four weeks ago) remaining in Greed territory, the highest since Aug 8th. Now just -16 points from the July 18th high of 84.
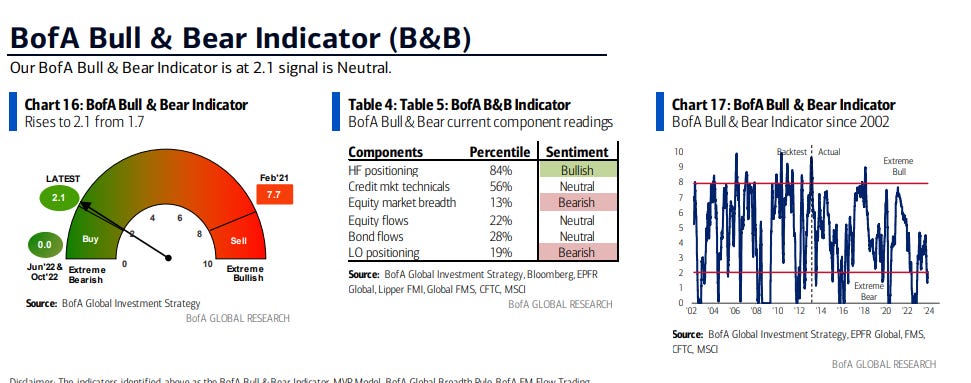
While the contrarian buy signal from the BofA Bull & Bear Indicator ends as it jumps to 2.1 from 1.7 on stronger inflows to stocks, HY & EM bonds, better equity market breadth. Since buy signal “CDX HY spreads -123bps, S&P500 +6.5%, ACWI +6.3%”. “all BofA proprietary trading rules now in neutral territory.”
While Helene's followers are bullish for a 5th straight week, first time since Jan. That was a good call then, hopefully will be again now.
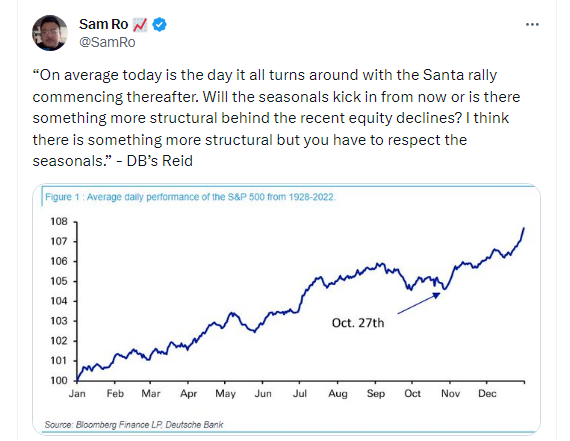
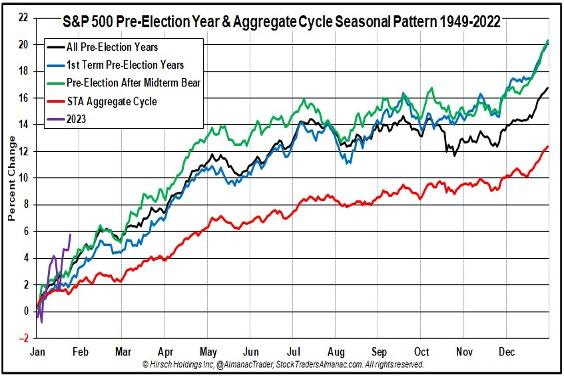
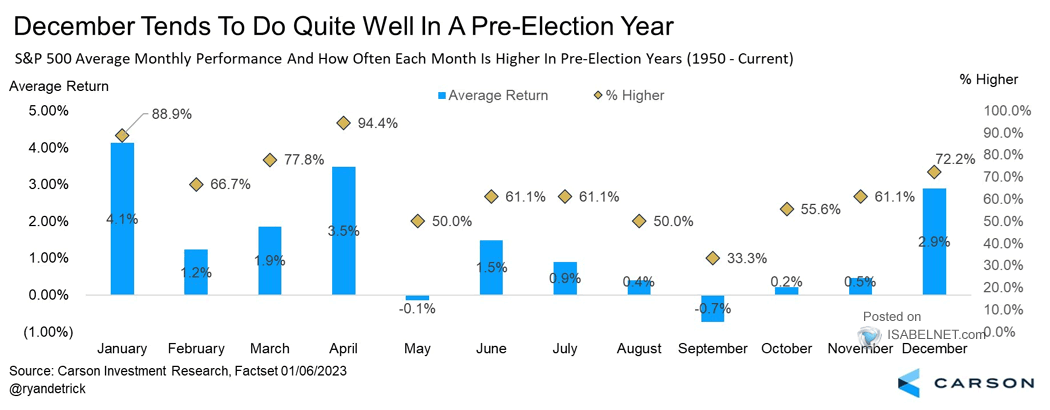
Seasonality - Now that we’re into the back half of November, as noted last week we’re into one of the seasonally strongest periods of the year.
Thanksgiving to Santa Claus Rally Trade — Time to Feast
Thanksgiving kicks off a run of solid bullish seasonal patterns. November-January is the year’s best consecutive 3-month span (2024 STA p 149). Then there’s the January Effect (2024 STA p 112 & 114) of small caps outperforming large caps in January, which begins in mid-December.
And of course, the “Santa Claus Rally,” (2024 STA p 118) invented and named by Yale Hirsch in 1972 in the Almanac. Often confused with any Q4 rally, it is defined as the short, sweet rally that covers the last 5 trading days of the year and the first two trading days of the New Year. Yale also coined the phrase: “If Santa Claus should fail to call, bears may come to Broad and Wall.”
We have combined these seasonal occurrences into a single trade: Buy the Tuesday before Thanksgiving and hold until the 2nd trading day of the New Year. Our good friend and renowned technician and options guru Larry McMillan of the Options Strategist opened our eyes to this trade and runs it with options starting on the day before Thanksgiving.
Since 1950, S&P 500 is up 79.45% of the time from the Tuesday before Thanksgiving to the 2nd trading day of the year with an average gain of 2.57%. Russell 2000 is up 77.27% of the time since 1979, average gain 3.19%.
Not a huge amount of instances but a down Aug/Sep after being up 10% YTD has led to good 4Q's in the past.
And while equal-weight SPX is lagging the cap-weighted by the most in data back to 1990 (only twice has it been even close), this hasn’t been an issue in the past.
And, of course, we’ll soon be entering December.
Other - First, the weekly update on the liquidity front. As a reminder on why I have been tracking this, as I wrote 22 weeks ago,
now that the debt ceiling is behind us, we have to deal with the question of who will buy the estimated $1T in bill and bond issuance the Treasury needs to refill it’s “bank account” with the Fed which it drained the past five months when it started implementing “extraordinary measures” - a liquidity boost which many have credited (along with the post-SVB liquidity surge from the Fed) for 2023’s equity rally. For that reason it won’t be any surprise that any number of bearish prognosticators from Mike Wilson to Michael Hartnett have seized on this as their newest talking point.
…
[I]n short, it remains to be seen how this slew of bond issuance will impact the markets. For sure, it won’t be a tailwind. How much of a headwind is an open question.
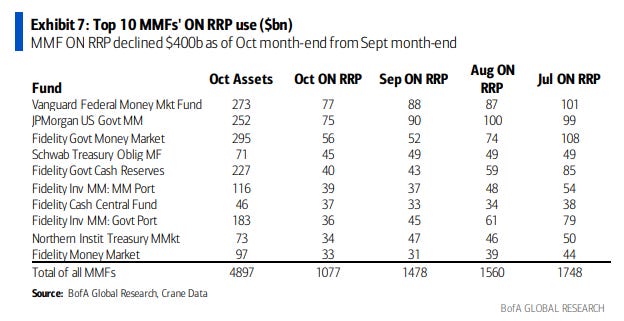
Of course at the time, nobody was thinking of the fact that deficits had risen so in addition to the TGA refill, more funding would be needed overall to fund the government, which led to even larger issuance over time. Until six weeks ago, this wasn’t a problem, as the outsized Treasury auctions were funded from RRP. In that regard, through Nov 15th, RRP YTD has declined by -$1.35T while TGA has increased $260B. That along with money market flows has allowed bank reserves to actually increase YTD by a huge $504B (and $168B from the start of QT June 2022) while the TGA was fully rebuilt, something that was not expected by those looking for a big drawdown in equities from the tightened liquidity conditions.
As HR explained earlier this year,
Suffice to say the RRP-Bill transformation dynamic is ongoing. RRP yields 5.30%. Treasury sold four- and eight-week bills on Thursday at 5.325% and 5.345%, respectively. Both sales stopped below the WI, and why wouldn’t they? They’re yielding more than RRP. When that’s the case, demand will be there, particularly when the odds of another Fed hike are waning.
“The significant reduction in reverse repos by MMFs to absorb the very large amount of issued T-bills… explains the surprisingly benign picture for US bank deposits and broad liquidity since May,” JPMorgan’s Nikolaos Panigirtzoglou remarked, in the course of suggesting the liquidity backdrop could be more challenging in 2024.
But the question is how long this will continue. We hit a sort of milestone this month with RRP balances falling below $1T for the first time since August of 2021. Some comments:
"It’s quite clear that money market mutual funds have been leaving the RRP to onboard Treasury bills. The question now is if additional bill supply – at a likely equal or greater pace than in H2 – will continue to be absorbed as easily as it has been so far. [The] switch out of cash and into T-bills is ongoing, with no signs of relenting. It appears that appetite for bills, even in the face of record issuance, remains unsated, and that between MMFs and real money institutional funds, bill demand is sustainably large enough to absorb it." -- John Velis, BNY Mellon
RRP balances have been much more sensitive to the change in bill supply than the change in deposit betas, as there has been little rotation from MMFs to deposits even as banks meaningfully raised their deposit betas this year,” JPMorgan’s Teresa Ho remarked, in a recent note. “In some sense, Treasury is helping the Fed facilitate the continuation of QT. The increase in bill supply should pull funds out of RRP versus reserves.” (HR)
ING - On the front end, we also saw an historic day of sorts, as the cash going back to the Federal Reserve on the reverse repo facility dropped below US$1trn. That is still a large volume of excess liquidity in the system, but it has come down from the US$2.25trn area since the summer is a precipitous manner. A lot of this reflects the build in the Treasury cash balance, from close to zero in the summer before the debt ceiling was lifted, to near US$800bn now. Going forward, the bulk of the fall in usage of the reverse repo facility will come from ongoing quantitative tightening.
As I’ve noted time and again (and as Panigirtzoglou noted above), the drawdown of RRP instead of bank reserves has been important in allowing the Fed to continue with QT in the background w/o any issues, so it’s something I will continue to monitor.
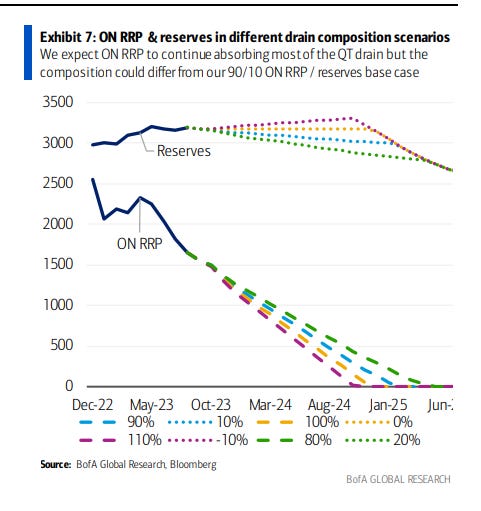
And BofA has reiterated from time to time they continue to predict that the RRP will continue to bear the brunt of the TGA refill (and they do not expect bank reserves will be drawn down until late 2025 (they noted this week that bank reserves actually continue to climb higher since the process started). They project that by late 2025 RRP will drain to zero, and QT will start to slow somewhere between May 2024 and September 2025, with the explanation for the wide range a lot of uncertainty about how the Fed will calculate when reserves are scarce (or when the first rate cut comes which also will likely mean an end to QT). To the extent that RRP doesn’t continue to take up the bond issuance, that obviously changes things.
A point which Powell indirectly made at the November Fed post-meeting press conference when he said on the endgame for QT: “There is no thinking around changing the pace of runoff. It's hard to think reserves are scarce when they are at $3.3 trillion.”
And, again a reminder, Goldman had a similar take several weeks ago which they refreshed this week looking for QT to drain most if not all of the RRP and then reserves to between 12-13% of bank assets. At that point they estimate the Fed’s balance sheet will be around 22% of GDP, down ~7ppt from current levels and 4ppt above 2019 levels (emphasis added). (HR)
In 2022, the bulk of the reduction in the Fed’s balance sheet came from a decline in bank reserves. At the same time, the Fed’s reverse repo facility increased as the rapid rise in the fed funds rate led depositors toward money market funds in search for more attractive yields and a decline in outstanding Treasury bills pushed money markets toward the RRP facility. In contrast, reserve balances have been relatively flat in 2023, and the Fed’s liabilities declined largely because of lower RRP use as increased Treasury bill issuance and higher demand for funding by banks pushed money market funds away from the facility. Looking ahead, we expect RRP balances to continue declining and reach near-zero levels in 2024 as these dynamics continue. Lower RRP balances account for the bulk of the decline in the Fed’s liabilities that we expect over the next year.
The FOMC will likely aim to stop balance sheet normalization when bank reserves go from “abundant” to “ample” — that is, when changes in the supply of reserves have a real but modest effect on short-term rates relative to the Fed’s administered rates. Our model suggests that short-term rates will start becoming more sensitive to changes in reserves around 2024Q3, and we expect the FOMC to begin considering changes to the speed of runoff at that point and then to slow the pace of balance sheet reduction in 2024Q4 by cutting the monthly runoff caps in half from $60bn to $30bn for Treasury securities and $35bn to $17.5bn for MBS securities. We expect runoff to finish in 2025Q1.
We continue to expect the Fed’s balance sheet runoff to have modest effects on interest rates, broader financial conditions, growth and inflation. Our rule of thumb derived from a range of studies is that 1% of GDP of balance sheet reduction is associated with a roughly 2bp rise in 10-year Treasury yields. In total, our projections for runoff imply that balance sheet normalization will have exerted around 20bp worth of upward pressure on 10-year yields since runoff started. Together with our rule of thumb that a 25bp boost to 10-year term premia from balance sheet reduction has roughly the same impact on financial conditions and growth as a 25bp rate hike, this implies that the total runoff process should have the effect of a little under one rate hike. At this point, a large part of runoff has already occurred and most of what remains is likely already anticipated by financial markets, meaning that most of the impact on Treasury yields is likely behind us.
The key risk to our forecast is that the increased supply of debt that we expect in 2024 causes intermediation bottlenecks in the Treasury market that lead the Fed to stop runoff earlier. Another possible risk is that FOMC participants decide to stop runoff early in order to avoid risking volatility in money markets.
While BMO cited the 6.4% of GDP level as the “no mas” point for reserve drain in past episodes, well below the current 11.5%. That said they noted
So far, “the risk of reserve scarcity similar to September 2019 [has been] low on the Fed’s list of worries [but] with bill issuance set to stay lofty as a share of overall debt outstanding and QT continuing to shrink SOMA, the state of the funding market is a space to watch,” Lyngen wrote. “The risk remains that the removal of liquidity doesn’t play out in linear fashion… necessitat[ing] a more dovish shift in policy sooner than Powell would prefer.” (HR).
Importantly, though, this has meant that the drawdown has come not at the expense of bank deposits nor bank reserves. The lack of deposit flight was confirmed by JPM and BofA last week, the latter noting that a drop in small bank deposits were offset by large time deposits (CD’s, etc.) and “other borrowing”.
And on reserves, as noted above they have actually increased YTD to a new 2023 high.
But all of that notwithstanding, as I covered two weeks ago and above in the Fed/Bonds section, the market suddenly has starting having some trouble digesting all of the supply (or their appetite for it has diminished with natural buyers stepping away - likely some of both). As I have said previously, it remains to be seen if this will continue, but something I’ll definitely be watching.
And this move out the curve is set to become worse in 2024 according to Nikolaos Panigirtzoglou of JPMorgan who foresees T-bill issuance “collapsing” to only $200B next year which will take MMF’s out of the picture.
"Going forward, we project another $250 billion of T-bills to be issued by year-end, bringing the total outstanding amount of US T-bills to $5.6 trillion. Assuming US MMFs continue to replace their reverse repos with T-bills, this would continue to prevent US liquidity from contracting in any significant manner between now and year-end. However, the backdrop for money supply or liquidity would likely become rather problematic in 2024 as the US Treasury shifts towards issuing coupons and T-bill issuance collapses from $1.9 trillion in 2023 to only $200 billion next year. As a result, the liquidity contraction forces from the Fed’s QT, subdued credit creation, continued sales of bonds by US banks and a continued shift from US bank deposits to MMFs would all become more visible in 2024." -- Nikolaos Panigirtzoglou, JPMorgan
BofA for their part sees a similar phenomenon.
We forecast net bill supply to grow $732b in FY ’24, decline $27b in FY ’25, and increase $479b in FY ’26, assuming QT ends in June 2024 with the first Fed cut (Exhibit 14). As noted earlier, bills as a % of outstanding will continue to grow due to higher deficits unless coupon auction sizes continue to increase beyond our forecasts.
So as I’ve noted I have to slightly adjust what I’ve said the last few months which was:
while I do find the overall global liquidity drawdown to be a headwind (in addition to the US (QT plus the rebuild of the TGA) you have the ECB winding down QT (although China has been pushing liquidity out in dribs and drabs and Japan continues to buy bonds “as needed” to maintain their yield curve control for now)), its impact on the markets and economy appears to be moderate so far.
The adjustment is that as noted there have been some digestion issues in more recent auctions. If it continues it could have broader ramifications in terms of the plumbing of the monetary system getting a bit clogged.
And the use of FHLB loans continues to remain below pre-SVB levels, insinuating no major stresses in the small and regional bank space.
And usage of the Fed’s Bank Term Funding Program (the emergency backstop established in SVB’s wake) stayed flat at around $113 billion, record high, but the increases have been relatively moderate and with discount window borrowing (which has less favorable terms) declining to the lowest in two months.
And moving on to less archine matters, the last couple of weeks the battle between the bulls and the bears shifted notably to the bullish side, but with indices starting to get a little extended, we’re hearing more bearish (or perhaps “cautious”) chatter:
“Despite a more certain outlook regarding peak rates and potential cuts in 2024, there are few upside catalysts,” said Liberum strategist Susana Cruz. “Corporate guidance was pretty soft during this earning season, forecasts for the fourth quarter have fallen and we will probably see more downgrades. That’s why we expect equities to experience a soft patch in the first half of 2024.”
“The stock market is once again priced for perfection,” said Matt Maley, chief market strategist at Miller Tabak + Co. “Since the stock market is more ‘overbought’ right now — than it was ‘oversold’ three weeks ago — investors will need to remain very nimble as we move through the end of November and into December.”
“Our base case is for further modest equity gains in 2024, with the S&P 500 Index ending the year around 4,700,” said Solita Marcelli at UBS Global Wealth Management. “As inflation continues to fall and growth moderates, we are even more positive on quality fixed income. But an unusually wide range of risks could still spoil the outlook.”
Short-term charts on the S&P 500 are currently sporting a negative divergence between price action (approaching recent 2023 highs) and momentum (lower highs), according to Dan Wantrobski, at Janney Montgomery Scott. “This is a sign that buying power is weakening even as the S&P looks to test into the low-4600 zone,” Wantrobski noted. “Markets are now vulnerable to profit taking/consolidation over the near-term. We also believe they are still vulnerable to elevated volatility/correction within the first half of 2024.”
Not everyone is buying. Marija Veitmane, senior multi-asset strategist at State Street Global Markets, is still concerned about recession risks and inflationary pressures, particularly on the services side. Americans feel it too. US short-term inflation expectations climbed to a seven-month high while longer-run price views remained at levels not seen since 2011. “Current economic data still does not justify the current aggressive policy normalization,” said Veitmane. “Thus, rates need to stay higher for longer, which will most likely push us into recession which means that earnings expectation are too high. So, no we are not backing this rally.”
“We had a nice bounce off of an oversold condition at a seasonally appropriate time,” said Steve Sosnick, chief strategist at Interactive Brokers. “It was predicated on the Fed ending its hiking cycle, so that’s OK. But it now seems predicated on a rapid easing cycle, which may require a much worse economy than investors expect.”
Peter Chatwell, head of global macro strategies trading at Mizuho International Plc., says the fact that rate cuts may be coming is no sustainable reason for elated market sentiment. “If the Fed is cutting rates because of a recession, this is very unlikely to be supportive of stocks,” he said. “It seems that stocks are in a sweet spot which will require a major earnings increase to allow this level to be maintained.”
(Reuters) - The S&P 500 will end next year only about 3% higher than its current level, with a possible U.S. economic slowdown or recession among the biggest risks for the market in 2024, according to strategists in a Reuters poll released Tuesday. The benchmark index (.SPX) will finish next year at 4,700, according to the median forecast of 33 strategists polled by Reuters during the last week and a half. That is 3.4% higher than Monday's close of 4,547.38. Nine of 13 strategists who also answered a question on whether U.S. stocks will hit a record high in the coming six months said yes, and most of them said they expect it to happen in the early part of 2024.
If you’re wondering whether that means Michael Hartnett is prepared to sound the all-clear, the answer is “no.” Whereas Subramanian long ago declared the bear market over, Hartnett still writes as though it’s ongoing, even as he never directly contradicts Subramanian. “We don’t think the Wall Street bear ends until Credit, Crude and Consumer threaten hard landing/credit events, triggering bearish Positioning, recessionary Profits and Policy panic,” Hartnett said, in the 2024 year-ahead edition of the “Thundering Word.” “Bulls outperformed bears like us in 2023 but we await the classic combo of bearish Positioning, recessionary Profits and Policy easing to flip to ‘full bull,'” Hartnett wrote. Hartnett sees a bull market in bonds, bullion and breadth commencing from H2 2024, as “a weaker US economy and Fed cuts delivers a cyclical decline in bond yields and the dollar,” which would be bullish for gold. Bonds “can easily deliver equity-like returns in 2024,” he said, reiterating another familiar refrain.
Here are Hartnett’s top 10 trades for 2024:
Long blended 30-year UST/IG/HY/EM bond portfolio. Rationale: High yield + “equity returns without equity risks.”
Long zero-coupon bonds. Rationale: “Peak yields” + “hard landing” hedge.
Long IG tech bonds. Rationale: Own tech balance sheets but not tech EPS in ‘24.
Long EU subordinated debt. Rationale: Big yields and big EU winners on “peak yield” theme.
Long GCC US$ bonds. Rationale: Strong Saudi/GCC balance sheets + hedge against energy crisis.
Long Japanese yen. Rationale: BoJ rate hikes to trigger big capital repatriation to Japan.
Long EM assets. Rationale: “Peak US dollar” play and China can surprise on upside.
Long equity “diamonds in the rough.” Rationale: Buy best stocks in most unloved levered regions/sectors of banks, utilities, REITs, UK, China.
Long distressed tech vs Magnificent Seven. Rationale: Lower rates = lower EPS much better for biotech/renewables than crowded monopolistic tech.
Long ACWX & SPW. Rationale: Risk-return in consensus “soft landing” looks great in equity breadth, small cap, value, international. (HR).
To power back to its previous peak, the S&P 500 needs more than just the earnings recovery that appears to be underway — rate cuts are necessary, too. That’s according to Bloomberg Intelligence’s fair-value model of the US stock benchmark, which says the consensus 2024 price target on the gauge looks too lofty. The typical post-earnings recession rebound is expected to come against a backdrop of sustained higher interest rates. That’s likely to limit potential upside for the S&P 500 to around levels the gauge is currently trading at, even in the best-case scenario, based on projections by BI equity strategists Gina Martin Adams and Michael Casper.
On the more optimistic side:
“We remain positive on equities and expect a broadening of the rallies recently experienced as the US economy continues on a sustainable economic expansion albeit at a modest pace,” said John Stoltzfus, chief investment strategist at Oppenheimer Asset Management.
“If people are moving into cash because of 5% rates, we could see that money start trickling back into markets soon. Inflation is coming under control, and the bond market is now preparing for the Fed to start cutting rates in March,” said Callie Cox at eToro.
“A recently sluggish market is a more a function of a short-term overbought market, rather than a market that believes it misinterpreted the Fed,” Krosby noted. “Still, the market believes that the Fed is finished and that the economy will require help with rate cuts in 2024, regardless of the Fed’s messaging.”
The S&P 500 will rally to a record high next year, helped by positive sentiment and resilient valuations, according to Lori Calvasina at RBC Capital Markets.
“The sentiment set up is constructive for now,” Calvasina wrote in a note, saying that an indicator of investor appetite that’s proved reliable in 2023 is sitting in a range typically followed by 10% gains in the S&P 500 over 12 months. “Valuations can stay higher than many investors realize,” as cooling inflation should support price-to-earnings multiples, she wrote.
The S&P 500 will rally to a record high next year, helped by positive sentiment and resilient valuations, according to Lori Calvasina at RBC Capital Markets, who joins a band of Wall Street strategists predicting further gains for US stocks in 2024. “The sentiment set up is constructive for now,” Calvasina wrote in a note, saying that an indicator of investor appetite that’s proved reliable in 2023 is sitting in a range typically followed by 10% gains in the S&P 500 over 12 months. “Valuations can stay higher than many investors realize,” as cooling inflation should support price-to-earnings multiples, she wrote. The strategist sees the US benchmark rallying to the 5,000 points level, the median of five different models her team uses that factor in sentiment, valuations, earnings, the economy, politics, and the cross-asset dynamic between stocks and bonds. The RBC strategist said earnings will be good enough to justify another year of gains and the appeal of bonds won’t derail equity returns. She noted that the US presidential election will be a source of uncertainty next year, while the sluggish economy expected in 2024 through 2025 is the biggest headwind to stock market performance. That said, Calvasina remains “constructive on the S&P 500 in the year ahead.” Her bull case would see the index rising to 5,300 — 17% higher than current levels.
The S&P 500 is set for a fresh high in 2024 because US companies have adapted to higher rates and weathered macroeconomic jolts, according to Bank of America Corp. strategists who join a growing chorus of optimistic Wall Street forecasters.
The team led by Savita Subramanian is bullish on US equities for next year “not because we expect the Fed to cut, but because of what the Fed has accomplished.” “The market has absorbed significant geopolitical shocks already,” they wrote in a note on Tuesday, adding “US exceptionalism is intact.”
They see the S&P 500 closing at a record 5,000 by the end of 2024, which is 10% higher than Monday’s close. Next year will be “a stock picker’s paradise,” the strategists said. The BofA strategists pointed to the bank’s own analyst survey, which suggests a Goldilocks environment — a steady economy that is not running too hot or too cold — as a reason for their optimism. Earnings can accelerate even if economic growth slows, said Subramanian, a quant who lifted her S&P 500 target to 4,600 in September after the sharp rally in 2023 left forecasts in the dust.
Tom Lee (Fundstrat):
Bottom line: Our base case remains for a year-end rally, and upcoming November CPI and December FOMC likely catalysts.
The bottom line is the November FOMC minutes seem stale relative to the reality of incoming inflation data and upcoming November CPI (12/12) likely reinforces this. And thus, the December FOMC meeting could see Fed members make a dovish move.
* By the December FOMC meeting the Fed will have potentially two good CPI reports -- October and November.
* Raising probabilities that they could marginally move away from "higher for longer."
* We still see a rally into YE and next week and upcoming November CPI (as well as the December FOMC) might be the catalyst.
Final Thoughts
As I noted last week, the end of year rally I thought we’d see has so far gone better than I had expected (I thought we would see a short pullback at one of the resistance levels, but instead we have pushed right through and kept going). The RUT as noted has been a different story, but even that has made substantial progress this month. As I said last week
it’s hard not to be optimistic. On the bullish side, as long as yields remain around these levels (or lower) they seem supportive and equity market technicals are in good shape, particularly on the large cap indices. Breadth improved notably last week, seasonality is weaker the next few days but after that very favorable, positioning and sentiment are improving but not yet stretched (the “good” part of the cycle), we’re past the “bombshell” data (employment reports, CPI, PPI, retail sales) for the month (we do get personal income and spending and PCE prices in two weeks but most of that is “baked in” by then), the government shutdown has been pushed off, and while geopolitics remain a potential flashpoint to date have not been an issue. Buybacks are now back, and we’re in the earnings “quiet period”. And there’s not much on the bearish side at this point beyond the “what if’s” (what if inflation resurges, what if growth slows further, what if something happens on the geopolitical front, etc., etc.). Against that backdrop there’s not much reason not to expect equities to continue to drift higher (at least until one of those “what if’s” becomes a “what now”).
And this week, I don’t really anything to add to that. We do have yields starting to drift higher, and there are those Treasury auctions this week, that could be a bit of a headwind, but I think it would take them moving much higher at the long end before they’ll really make an impact. So there’s nothing much on the horizon, at least until we get to the November jobs report a week from Friday, that I can really see moving the needle appreciably. I suppose the inflation number Thursday could do the trick, but we seem to have a pretty good handle on how that will print. A run of particularly bad data may also stir recession fears. And of course it still leaves things “not on the horizon” (i.e., the proverbial black swan), but by definition those are not things you can plan for (you can just make sure you’re ready if one does happen). We’re also getting a bit extended, so you’d think at some point we’d get some sort of pullback to relieve the mildly overbought conditions, but it’s not so extreme (nor is sentiment nor positioning) that says it has to be this week. So, overall, lots of reasons for some mild weakness, but nothing that should lead to appreciable weakness at least for this week.
Portfolio Notes
I’ve decided I’m spending too much time playing around with small trades (which are costly from a tax perspective) so I’m going to look to consolidate things into fewer stocks with larger positions that I can just sell puts and calls on (which is taxed at ordinary income rates but provides extra “juice” on top of dividends and allows me to hold for 12-months to get the capital gains rates on sales). This has the added advantage of being less time intensive. I’ll also be looking to sell losers starting now that see pops for tax-loss purposes.
More cleaning pup the portfolio per the above selling out of EBAY, VTEB, BLK, KO, SCMB, MUB, MCD, AXP, SPLK, JEPI, CMG, MELI, IDV, FHB, most bank preferreds, CRSP, ADSK, WSM, MMM, HD, QCOM. Also continue to sell a lot of calls. No buys this week.
Cash = 20% (this is down significantly from the start of the and now just a little above what I held pre-3Q21 (held mostly in SGOV and MINT but also TLH and TLT (if you exclude the longer duration bonds, cash is around 18%)).
Shorts have been closed out.
Positions (after around the top 20 I don’t keep track of their order on a frequent basis as they’re all less than 0.5% of my portfolio).
Core positions (each 5% or more of portfolio total around 20%) Note the core of my portfolio is energy infrastructure, specifically petroleum focused pipelines (MLP’s due to the tax advantages). If you want to know more about reasons to own pipeline companies this is a decent primer, but I’m happy to answer questions or steer you in the right direction. https://spac.tortoiseadvisors.com/resources/insights/commentary/the-case-for-energy-infrastructure-as-a-real-asset/
EPD, ET, PAA
Secondary core positions (each at least 0.5% of portfolio, total around 10%)
ENB, GOOGL, OKE (from MMP takeover), WFC
For the rest I’ll split based on how I think about them (these are all less than 0.5% of the portfolio each)
High quality, high conviction (long term), roughly in order of sizing
C, CTRA, BAC, KMI, SHEL, VZ, MPLX, CVS, DVN, USB, T, MAC, TFC, CQP, VNOM, LAZ, TRP, KHC, SCHW, DIS, AGNC, O, PNC, GSK, APA, RHHBY, PFE, HBAN, ADNT, STLA, VOD, AM, BWA, DIS, DAL, VSS, EQNR, UBS, BAYRY, ING, TLH, ETRN, MTB, CRM, SWKS, RRC, FRT, JPM, FANG, CI, DGS, SNOW, PXD, E, FIS, JWN, UBER, VWAPY, CMCSA, GM, BMWYY, WES, EOG, NXPI, PFF, DDAIF, BUD, CVE, SOFI, CG, BEP, SAN, TEF, SPG, MCHP, PVH, KT, PLTR, F, TSM, CTSH, INDA, VNM, MFC, TD, LYG, CRWD, BMO, RY, CM, FSK, ORCC, EMN, AMT, WBA, ASML, MDT.
High quality, less conviction due to valuation
AAPL
Higher risk due to business or sector issues; own due to depressed valuation or long term growth potential (secular tailwinds), but at this point I am looking to scale out of these names on strength. These are generally much smaller positions.
ILMN, ORAN, PYPL, CHWY, TIGO, TPR, SWN, ACCO, PINS, CLB, PARA, TEVA, LUMN, HBI, TDOC, TCNNF, TCEHY, SBH, EEMV, PK, VNM, CURLF, GTBIF, QRVO, TPIC, NCLH, SABR, NSANY, BTI, VNQI, URNM, CCJ, ST, WBD, LADR, BNS, PPLT, EWS, VTRS, IJS, NOK, SIL, WVFC, FUSB, LBTYK, DOCU, CMP, TAP, BBWI, QRTEA, GPN, ZM, ASRV, JTKWY, CAL, EWZ, FCX, CZR, LAC, NSTS, MBUU, TLRY, HRTX
Note: CQP, EPD, ET, MMP, MPLX, PAA, WES all issue K-1s (PAGP is the same as PAA but with a 1099).
Reminder: I am generally a long term investor (12+ month horizon) but about 20% of my portfolio is more short term oriented (just looking for a retracement of a big move for example). This is probably a little more given the current environment. I do like to get paid while I wait though so I am a sucker for a good well supported dividend. I also supplement that with selling calls and puts. When I sell a stock, I almost always use a 1-2% trailstop. If you don’t know what that is, you can look it up on investopedia. But that allows me to continue to participate in a move if it just keeps going. Sometimes those don’t sell for days. When I sell calls or puts I go out 30-60 days and look to buy back at half price. Rather than monitor them I just put in a GTC order at the half price mark.
To subscribe to these summaries, click below (it’s free).
To invite others to check it out,


