If you're a new reader or maybe one who doesn’t make it to the end feel free to take a second to subscribe now. It’s free!
Or please take a moment to invite others who might be interested to check it out.
Also please note that I do often add to or tweak items after first publishing, so it’s always safest to read it from the website where it will have any updates.
I know not everyone can be on X several times a day like I can, but I really encourage you to click the link in each daily update to just scroll through that day’s posts, as I am moving away from the time consuming process of going through them to add to the weekly blog.
Also, as a reminder, some things I will still leave in from prior weeks (although much less than before). Anything not updated is in italics.
The Week Ahead
After a very busy week, next week a little less so but does have plenty to keep us interested. The highlight is the February employment reports (including JOLTS & ADP) as well as weekly jobless claims, but we’ll also get high profile reports on the service sector, factory orders, consumer credit, trade, and productivity, plus the monthly Fed Beige Book. There’ll be plenty of Fedspeak as well, highlighted by Powell’s semi-annual testimony before Congress. It’s not the type of forum where he normally deviates from the Committee’s message, which we heard pretty clearly in last week’s slew of speakers covered in the daily updates, but that’s not to say that there might not be some interesting stuff, especially when one considers it was a year ago that rate hike expectations peaked when Powell’s message was unexpectedly hawkish. I don’t expect something similar this time, instead I think this will likely be less interesting than for example a post-meeting press conference.
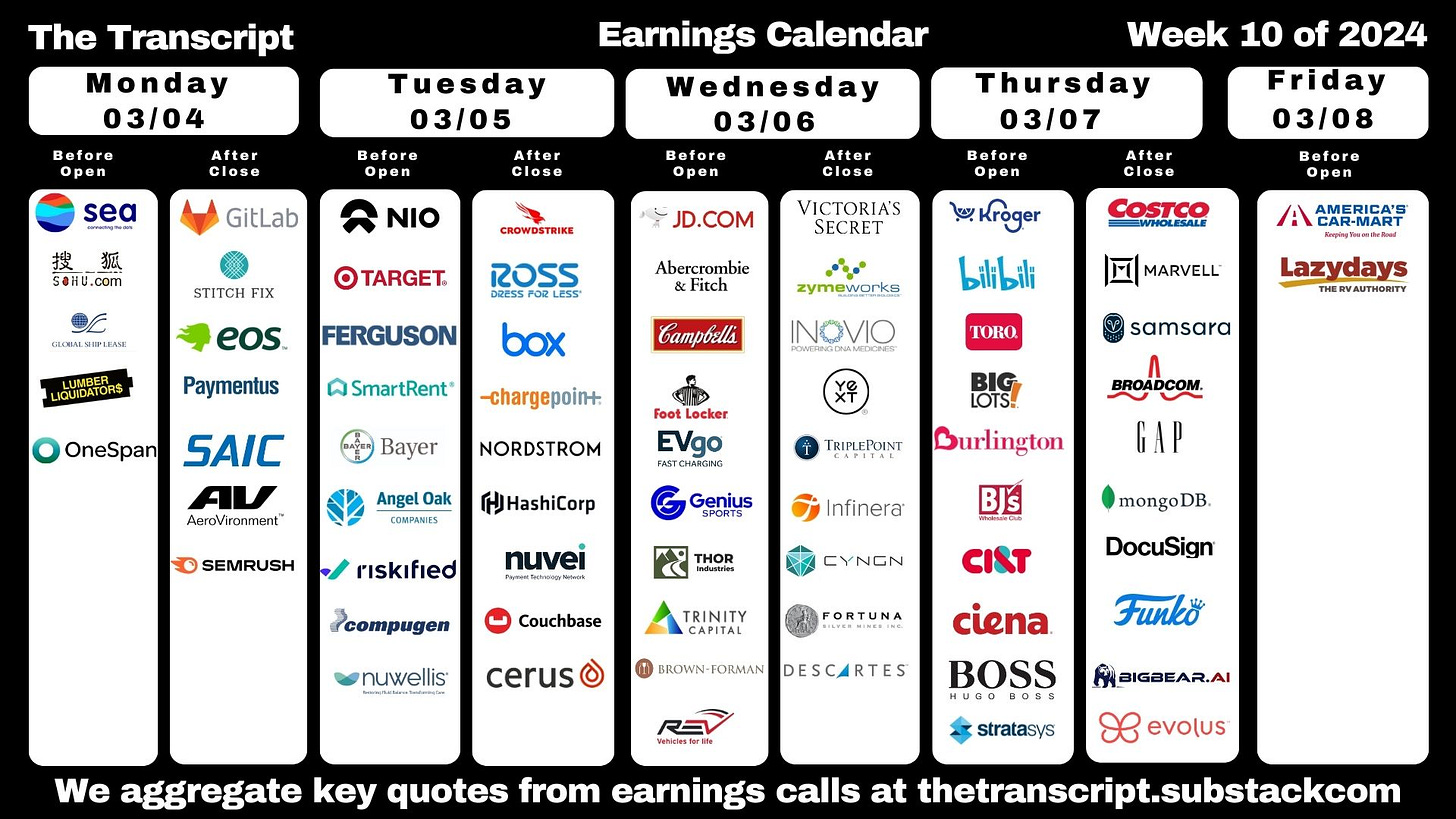
Treasury auctions will definitely be less interesting, confined to T-Bills (< 1yr), although it will be interesting to see if RRP remains below $500bn (discussed later), while earnings will continue to slow after 98% of the SPX has now reported. Still we still get some notables in Marvell Technology (MRVL) and Broadcom (AVGO) in the tech sector along with consumer heavyweights Target (TGT) and Costco (COST) among others. That leaves some room for politics which will fill that void amply with Super Tuesday. The international calendar also has a number of key events as detailed below.
From Heisenberg Report on Friday’s NFP report:
I doubt anyone needs a reminder, but the last jobs report was a bombshell. The headline print doubled consensus and annual revisions pushed total hiring in 2023 beyond the three million mark. Not only that, average hourly earnings printed a scorching 0.6% MoM gain, double the expected pace, and the hottest in two years.
Economists expect 200,000 from the February NFP print. That’d push the three-month moving average up to 295,000, the highest in 11 months. The unemployment rate’s seen at 3.7% and the monthly pace of wage gains is expected to moderate to 0.2%. If there’s another hot AHE read, particularly in the presence of another NFP overshoot, markets might start to question whether the dot plot refresh later this month will find the median 2024 marker shifting to reflect just two cuts this year instead of three. Let me quickly say, though, that the jobs report could show a “hangover” given how hot the last report was.
Earnings spotlight: Monday, March 4 - Sea Limited (SE), GitLab (GTLB) and Stitch Fix (SFIX).
Earnings spotlight: Tuesday, March 5 - Target (TGT), NIO (NIO), Ross Stores (ROST), Nordstrom (JWN), CrowdStrike (CRWD), and Box (BOX).
Earnings spotlight: Wednesday, March 6 - JD.com (JD), Brown-Forman (BF.A), Campbell Soup (CPB), Foot Locker (FL), Abercrombie & Fitch (ANF), and Victoria's Secret (VSCO).
Earnings spotlight: Thursday, March 7 - Kroger (KR), Bilibili (BILI), Costco (COST), Broadcom (AVGO), Gap (GPS), Marvell Technology (MRVL), and DocuSign (DOCU).
Earnings spotlight: Friday, March 8 - Genesco (GCO) and America's Car-Mart (CRMT).
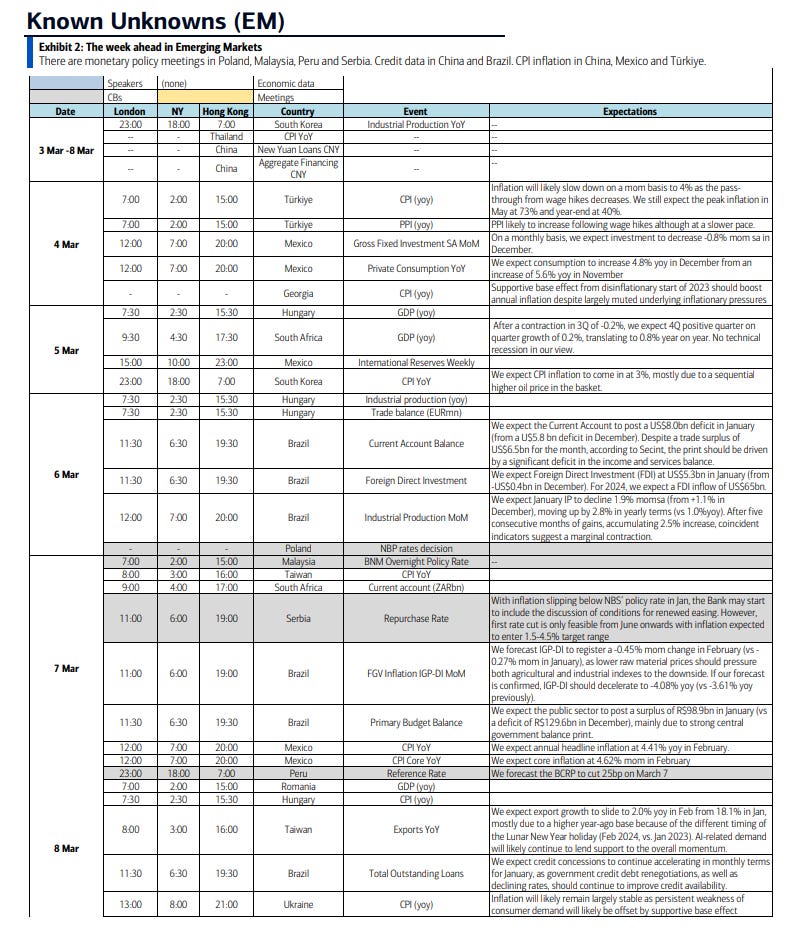
It will be a busy week on the international front with rate decisions in the EU and Canada (among other countries), China’s most significant annual political event of the year, the National People’s Congress, where President Xi will lay out his vision for the country amid increasing discontent, Japan’s Tokyo CPI (a leading indicator for full country), and the unveiling of the UK budget where Jeremy Hunt faces a difficult balancing act between tax cuts and a fragile financial picture. We’ll also get global services PMIs, and key inflation readings from Turkey, Mexico, Columbia, and Chile.
The National People’s Congress in China will be at the center of attention in Asia as investors, economists and policymakers watch for signs that Beijing is prepared to take more significant stimulus measures. China’s growth target for the year may also offer clues on how aggressively the country’s leadership will pursue a recovery. The latest price data and cumulative trade figures for January and February will indicate how severe China’s slide into deflation is becoming, as well as the lack of major support for the economy via exports. February inflation figures for Tokyo (a leading indicator for the full country) are likely to show a strong uptick as the impact of subsidies a year ago fades, an outcome that could fuel bets on a March rate hike from the Bank of Japan at a time when the labor market has tightened.
In the UK, Chancellor of the Exchequer Jeremy Hunt will unveil his budget on Wednesday in what could be the final such announcement before a general election that’s likely this year. Speculation in recent days has centered on possible giveaways for voters, and an end to the “non dom” status used by wealthy foreigners. Hunt may have limited room for maneuver on tax cuts.
In the euro zone, the European Central Bank decision on Thursday will be the main event. Policymakers will unveil their first quarterly forecasts of the year, which may show that they’re moving closer toward delivering a rate cut in coming months. Faster-than-expected inflation in numbers released on Friday will give officials reason for caution, and they’re also awaiting data on wage deals to ensure that the full pace of consumer-price gains isn’t getting reflected in pay. Industrial numbers from Germany, France and Spain are all due as well as services PMI’s.
In Turkey, analysts predict data on Monday will show inflation accelerated to 66% in February, an outcome that’s roughly in line with forecasts from the central bank. Brazil’s January industrial production data may show 2024 getting off to a strong start. Brazil will also serve up the central bank’s weekly survey of economists, current account, foreign direct investment, monthly trade figures, bank lending and government debt data. In Peru, most analysts have been looking fo the central bank to deliver a seventh straight quarter-point interest-rate cut to 6% at its meeting on Thursday. February inflation data posted Friday showing an unexpected jump in consumer prices likely complicates the decision. On the ever-critical inflation front, Mexico’s posting Thursday of mid-month and February consumer price readings will likely show enough cooling to green light Banxico to deliver a much awaited rate cut at its March meeting. In Colombia, both the headline and core readings will slow to keep BanRep easing on March 22, while Chile’s central bank — which sees inflation hitting the target in the first half — won’t be put off by the slight uptick reported here.
Here’s BoA’s cheat sheets for the upcoming week.
And here’s a calendar of 2024 major central bank meetings.
Market Drivers
So let’s go through the list of items that I think are most important to the direction of equity markets:
Fed/Bonds
As noted two weeks ago this was one of the sections that had grown unwieldy, so I’ve really pared it down. Given I provide daily updates on Fed expectations, Fedspeak, and analyst thoughts on the Fed, it’s duplicative (and time consuming) to gather it all again so, again, I encourage you to look at those (the daily posts) for updates. I will just give more of a quick summary.
Up until Friday, the week was dominated by a plethora of Fed speakers which continued last week’s messaging that there will likely be easing this year, but the timing and scale are uncertain (certainly not in March), although they did mostly play down the January CPI, PPI, and import price reports. I put in posts in the daily updates, but here were BoA’s takeaways from recent Fed speakers:
I mentioned “up until Friday” and that’s because as detailed in the Friday update, after the weaker than expected ISM manufacturing PMI we saw Fed cut expectations price back in some of the cuts that have been taken out, still though only seeing a little over 3 cuts, a different universe from the seven that were priced in a month ago.
And while markets (and the Fed) still expect cuts, a big topic this week was something I brought up a month ago: what if there’s no cuts this year? I think it’s way too early to get serious about this conversation after just one month of data, but if we see that continue for another month or two, it’s something that we’ll have to start considering, especially with the elections gumming up the calendar in terms of 2H rate cuts (it will be politically difficult for the Fed to start cuts after June due to the way the political calendar works, something I’ll get into later, but just note the July meeting comes between the Republican and Democratic conventions). So not something to be your “base case” but definitely something to have on your radar as a possibility.
As noted in previous weeks, I am more in the June camp given that’s when the Fed will have their next SEP/dot plot update (and there might not be enough constructive data by May).
In terms of the impact on bonds, as noted in the Friday update, the weak PMI saw them fall to 2-week lows with shorter durations falling the most after Fed Governor Waller’s comments regarding shortening duration.
The bigger fall in shorter term durations did see the 2/10 curve steepen slightly but remains around the most inverted of the year at -0.35%.
While long term inflation expectations, as judged by the 5-yr, 5-yr forward rate (exp'd inflation starting in 5 yrs over the following 5 yrs) were little changed this week, remaining in the middle of the range over the past year at 2.24%.
And the drop in long-term inflation expectations offset the drop in 10yr nominal Treasury yields, keeping real rates right around the 2% mark just off the highest since November.
Shorter-term real yields (Fed Funds - core PCE) though are over 3%, and just off the highest since 2007.
While the 10yr term premium estimate as of Feb 27th remained in negative territory at -0.14%, something the Fed has said they were keeping an eye on (they clearly would prefer it be positive).
The extended discussion on term premium (what it is, why it’s important, etc.), can be found in this section in the Feb 4th Week Ahead.
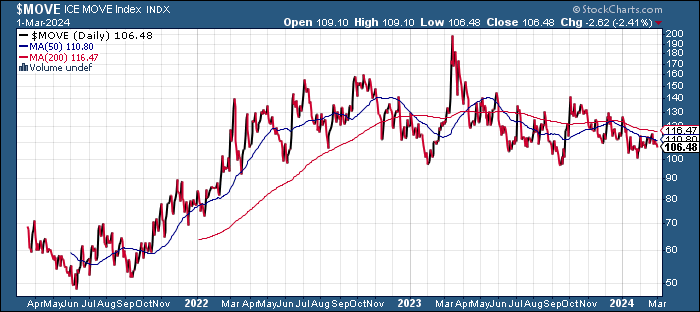
While the MOVE index of bond volatility edged lower back towards the 4 mth lows we saw in January.
And after we saw three weeks ago the first increase since October in the Chicago Fed National Financial Conditions Index and its adjusted counterpart, they remained unchanged for a second week both still though not far from the lowest since Nov 2021 and Jan 2022 respectively.
And DB has one designed to mimic the Fed’s financial conditions indices which are the loosest since 2022.
And BNP Paribas says the loosening has been the equivalent of 100bps of cuts.
Turning to the discussion on the Fed’s balance sheet/QT we’ll continue to keep get steady, sizeable auctions of T-bills (<1 yr) through the end of March, but interestingly, they haven’t had much impact on RRP balances which had remained very stable a little above $500B for the last few weeks. They did drop down to $441B on Friday, but we’ll see if that “sticks” next week (it might have been related to start of a new month, etc.). To the extent they do remain around the $500B level, it will take some pressure off the Fed to do anything about QT. Some have pointed to a dialing back of funding of basis trades (which buy cash Treasuries and short Treasury futures) which may have freed up cash that is being invested in T-Bills. I’ll obviously revisit this next week when we have a few more days of RRP data. Regardless, bank reserves remain very healthy near $4tn.
Also supporting continued QT for now is the fact that SOFR (short term bank lending) rates have settled down after they had moved higher at YE.
For background on various estimates of when reserves will be “too low” see the Feb 4th Week Ahead.
Getting back to rates, I continue to think rates will will trade in the 3.5-4.5% range this year, but likely towards the top of that range (and maybe above it up to 5%) until we get the Fed talking more near term about rate cuts,
while I think there’s a decent chance we have seen the peak in yields (if they do make it back to 5% (or even 4.5% at this point, I think there’s a wall of buyers, but I also don’t think we’re going to see sub-3% 10-year Treasury yields anytime in the near future (even sub-3.5% to me seems a stretch). So while it’s a wide range, I expect 10-yrs to trade in the 3.5-4.5% range for at least the next few months dependent of course on the economy not deteriorating rapidly or inflation seeing an unexpected resurgence.
Also removing all the legacy “final hike” and “first cut” materials, which can also be found in the Feb 4th blog post. I will put in new things if they come up.
Earnings
As a reminder, I have removed most of the background material, which you can get in the Feb 4th blog post. At this point we can I think officially wrap up Q4 earnings with 97% of the SPX having reported by market cap through Thursday. Overall according to Factset we saw growth of +4.0%, a “normal” improvement from the -0.3% expected at the start of the earnings season. 73% of reports beat below both the 5-year average of 77% and the 10-year average of 74%, with beats +4.1% above expectations, also below the 5 & 10 year averages (8.5% & 6.7%). However, I’m not sure about that +4.0% number as others are reporting it’s closer to 8%.
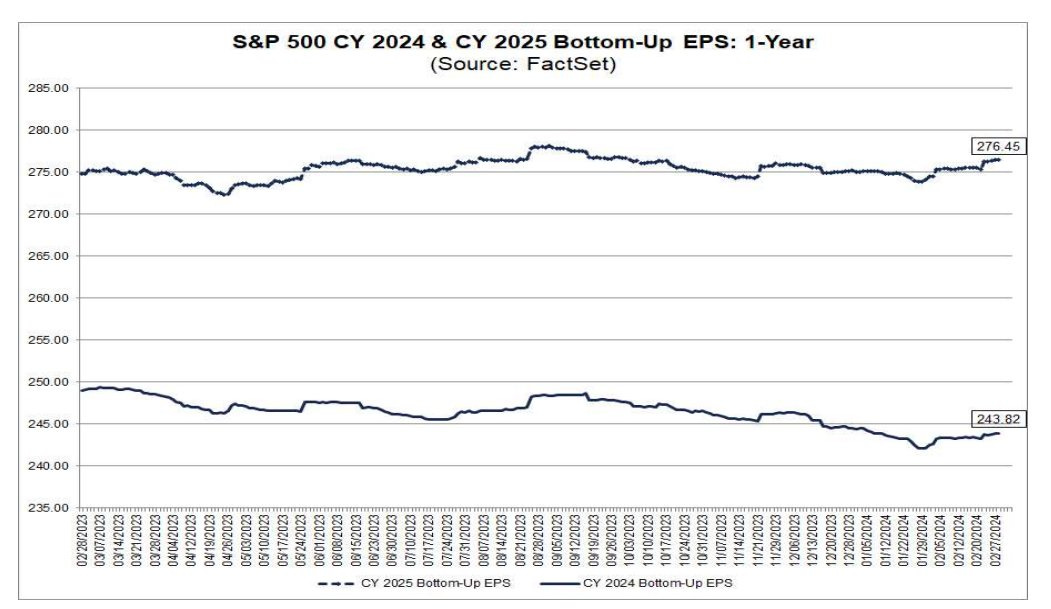
So as I’ve noted in past weeks, it’s 2024 that we need to start watching for, and analysts had penciled in a nice jump of almost 12% to over $247 when we started the 3Q reporting season. That has held up much better than normal since then (July) outside of a more typical drop in January when Q4 earnings started. But as the 4Q earnings season has progressed we saw the normal increase in NTM earnings. As of this week it’s at $243.82, down just around $2.80 from the start of Q3 season. That’s much better than what we’ve historically seen. And even with the declines though we’re still talking about a double digit increase, although it’s back-end loaded. Q1 is at 3.6% (which has steadily deteriorated throughout Q4 earnings season) which seems very reasonable. Q2 and Q3 have also come down to 9.2% and 8.3% respectively (although those moved higher this week) but it’s Q4 2024 that remains a very tall order at 17.4% (although that’s still down from 21% four weeks ago). As always of course the question will be if earnings can exceed whatever bar the market has priced in.
And it’s no surprise that Q1 earnings have deteriorated with weak guidance.
101 companies in the index have issued EPS guidance for Q1 2024. Of these 101 companies, 71 have issued negative EPS guidance and 30 have issued positive EPS guidance. The percentage of companies issuing negative EPS guidance for Q1 2024 is 70% (71 out of 101), which is above the 5-year average of 59% and above the 10- year average of 63%.
But that said the deterioration has been less than we normally see.
But despite that, the deterioration in Q1 earnings is less than we normally see.
During the months of January and February, analysts lowered EPS estimates for the first quarter by a smaller margin than average. The Q1 bottom-up EPS estimate (which is an aggregation of the median EPS estimates for Q1 for all the companies in the index) decreased by 2.2% (to $55.11 from $56.34) from December 31 to February 28. The decline in the bottom-up EPS estimate recorded during the first two months of the first quarter was smaller than the 5-year average (-3%), the 10-year average (-2.7%), and the 20-year average (-2.9%).
And Factset notes that as of this week, analyst bottom-up price targets keep climbing, now at 5589, up over 300 points the last 3 weeks. Remember in 2023 they were within a couple percent which is unusual. Typically they are 7.2% too high, although they’ve undershot 4 of the last 6 years.
The bottom-up target price for the S&P 500 is 5589.20, which is 10.2% above the closing price of 5069.76. At the sector level, the Energy (+17.7%) and Communication Services (+14.5%) sectors are expected to see the largest price increases, as these sectors have the largest upside differences between the bottom-up target price and the closing price. On the other hand, the Industrials (+5.8%) and Materials (+6.4%) sectors are expected to see the smallest price increases, as these sectors have the smallest upside differences between the bottom-up target price and the closing price.
Economy
As I’ve written over the past 18 months, part of my earnings optimism has been due to the economy holding up better than expected. While earnings only track the economy loosely (and markets look forward 6-12 months), there is a clear correlation between recessions, lower earnings, and lower stock prices (although stock prices generally fall in advance of the recession and bottom 6-9 months before the end of the recession). Regardless, seeing a recession coming is helpful, although very difficult. You can reference this Week Ahead (in the Economy section) for a lot of material on how every recession is preceded by talk of a “soft landing” as close as a month before the start. On the IRA infrastructure act, the November 26 report has good info on how that should be supportive at least through the end of this year. I also have removed the notes about how small caps have shorter maturity profiles and more debt which can also be found at that report.
As I’ve stated since I started doing the Week Ahead posts, while indicators are mixed, I do not think we’re on the verge of a recession. We got a lot of data this week, and it remained a mixed bag due to the issues with January weather and seasonality. February’s reports seem to be coming in better. We’ll know a lot more over the next couple of weeks. One thing to note is we may be seeing a rotation from consumers not needing to hold everything up as investment and manufacturing seem to be picking up. Below is some of the major releases from BoA but I went over them (via X posts) in the daily summaries so you can refer back to the relevant day to see more.
Which saw the Citi economic surprise index roll over a bit but remains firmly in positive territory.
And GDP estimates are also consistent with a no recession call (again though remembering GDP going into recessions generally doesn’t look like one is coming).
According to BBG the consensus is currently for 2% growth in Q1, up from 1.3% to start the year.
Goldman is a little above but drops theirs two tenths to 2.1%.
BoA goes the other way significantly upgrading their 1Q & FY 2024 estimates now seeing 2.5% & 2.1% on upward revisions to private investment, although some of that steals from 2025 which they lower slightly. They see unemployment staying sub-4% this year and core PCE ending the year at 2.6% y/y.
And after Atlanta Fed came in closer than consensus for another quarter in 4Q (2.4%) 1Q ‘24 sees a big drop to 2.1% from 2.9% the prior week week on downgrades to ironically private investment (ironic after BoA upgraded on that basis) and consumption.
And the NY Fed’s 1Q GDP Nowcast also was trimmed but not quite as aggressively as the Atlanta version to 2.3% from 2.80% last week also mostly on consumption and investment.
And the St. Louis Fed GDP tracker which was been consistently lower (and wronger) than the NY and Atlanta Fed versions continues to remain well below those for 1Q at 0.92%.
While the Weekly Econ Index from the DallasFed (scaled as y/y rise for GDP) as of Feb 25th was + 1.97% a nice improvement from the down r +1.46% prior week (this series is consistently revised down), but the 13-wk avg edged lower to +1.82% (although still around the highest since 2022). This series is more useful in terms of direction which has been some overall economic softening but remaining well into positive territory.
Here’s the components.
Multiple
Like the other sections, I’ll just post current week items regarding the multiple. For the historical stuff, see the Feb 4th blog post.
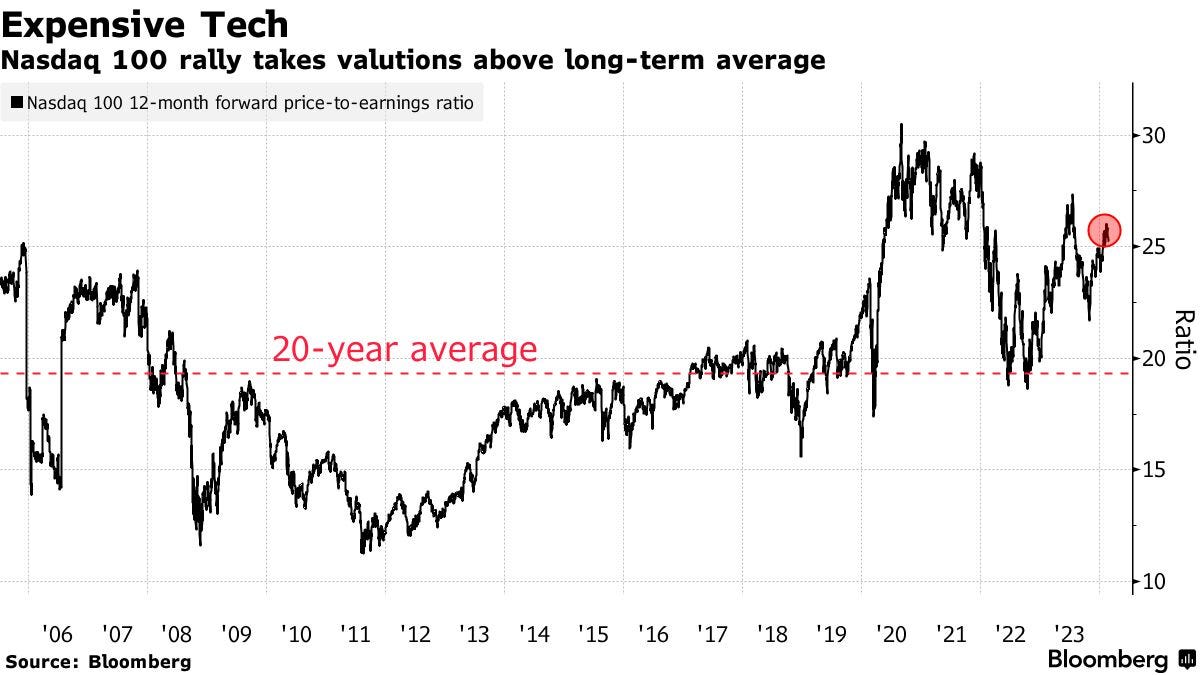
The large cap SPX multiple extended to 20.3 last week, highest since 2022. Mid and small caps have also tracked higher but remain several points lower, more in line with historic averages.
As BoA again reminds us according to their work, valuation matters little in the near term, but is almost all that matters in the long-term.
Breadth
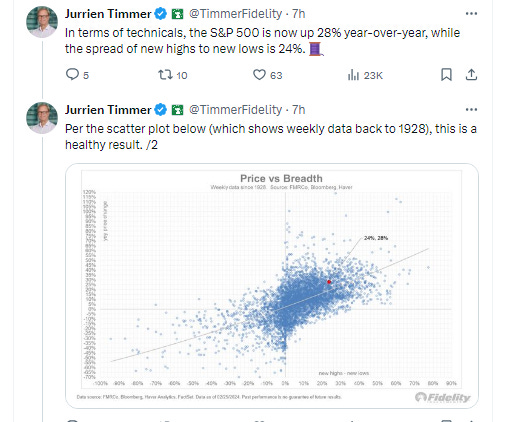
As I go over this daily, I won’t reprise that information, just will add anything notable from the current week. Overall breadth was better this week, in line with a better index performance, although it peaked on Tuesday as far as positive volume was concerned. But sector breadth and new highs-new lows were very strong right through the end of the week, so overall breadth is not dramatically signaling a problem.
The McClellan Summation Index (red/black line) continues its sideways trade since mid-January. As Helene Meisler has noted it’s unusual for it to trade like this in the midst of a big equity rally (or really in any environment for this long).
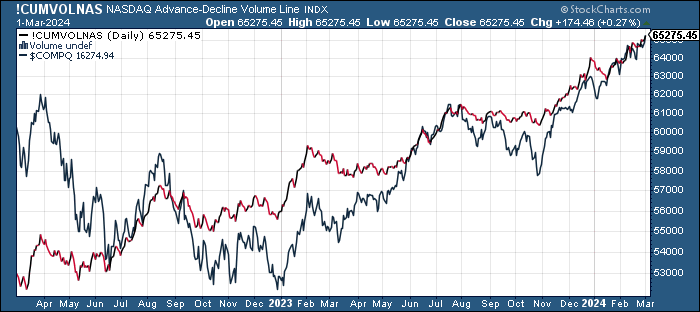
Nasdaq’s version McClellan Summation Index (red/black line) based on volume has been a little more consistent with price.
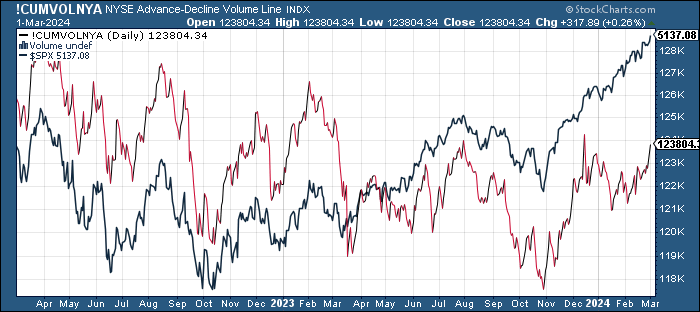
While there remains a large divergence between the Nasdaq A/D volume line (which has been confirming price) and the NYSE (which has not), the latter made a big move higher last week, a positive.
While new high-new low indices (red/black lines) have moved towards the highs of the year.
And % of stocks above their 200-DMAs continue to hold near recent highs but below the mid-December highs as price has moved higher (small negative divergence).
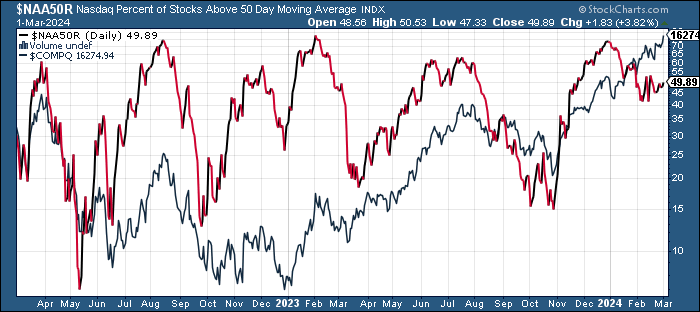
And % of equities trading above 50-DMAs have seen more softening since December, but have held in the past month.
While the equal-weighted SPX vs cap-weighted ratio remains near the lowest since 2009.
And IWM:SPY (small caps to large caps) holding in middle of its recent range.
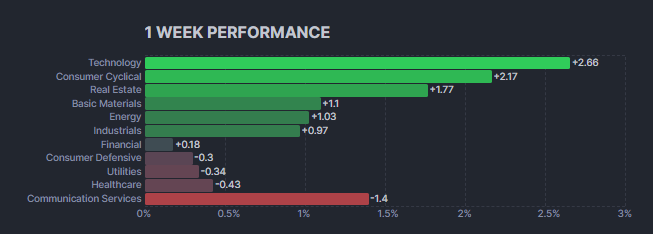
Sector breadth a little more mixed last week, although only communications was down more than around -0.4%. Growth led.
Flows/Positioning
In terms of equity flows, in the week to Feb 28th BofA using EPFR Global data saw another week of inflows, the 14th in 18 weeks, +$10.0bn, now +$270.4bn last 35 weeks (and +$84.5bn last 6 weeks). Tech led inflows for 7th week in eight +$4.7bn, largest since Aug, +$17.3bn last 7 weeks, and has taken in +$45.1bn over the last 31 weeks, on track for $98.8bn in 2024 (of course it is just Feb). Materials saw 4th inflow in 5 weeks +$1.8bn, consumer took in +$0.3bn (still -$10.7bn last 21 weeks), communications +$0.2bn and healthcare +$37mn (but still -$10.5bn last 22 weeks). Energy returned to outflows, the 14th in 15 weeks, -$0.8bn, financials -$0.7bn, the 24th outflow in 28 weeks, -$0.8bn, utilities -$0.5bn, the 16th in 20 weeks, and real estate -$0.3bn.
US saw the 14th inflow in 20 weeks, +$8.3bn, +$122.1B last 24 weeks, with ~+$101.5bn the last 16 weeks. Europe saw a 50th week of outflows in 51 weeks -$32mn (now -$8.6bn YTD after -$66.9bn in 2023), while Japan the 9th inflow in 10 weeks +$1.2bn, $7.2bn YTD after +$7.3bn in all of 2023. EM equities saw 1st outflow since Nov -$1.0bnm still +$52.5bn YTD (and on track for $345bn in 2024) as China saw a rare outflow of -$1.6bn, the largest since Oct but still +$48.1bn YTD and +$5.8bn YTD to India. EM took in +$91bn in 2023. US large caps saw 22nd inflow in 26 weeks, +$8.3bn, +$88.0bn last 16 weeks after $125bn in 2023, while small caps returned to outflows, -1.4bn, cutting YTD to +$0.2bn. US value saw 8th outflow in 9 weeks -$1.1bn (-$15.3bn so far in 2024 after a record -$73bn in 2023).
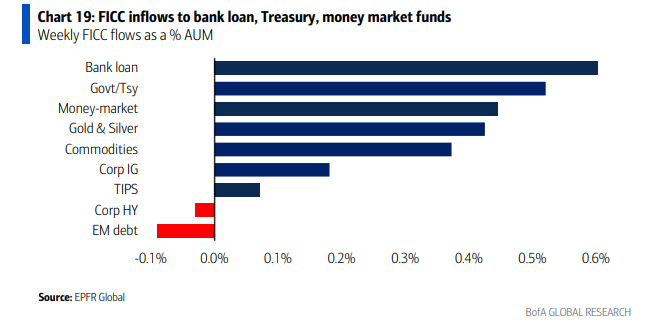
Bonds saw their 47th inflow in 49 weeks +$13.8bn, $112.7bn YTD, with IG/HG seeing an 18th consecutive week of inflows (and 44th in 48 weeks) +$7.5bn w/$85.5bn the last 9, on track for $500bn in 2024 after +$162bn in 2023. Treasuries saw 3rd week of inflows +$5.5bn. Treasuries took in $177bn in 2023, a record (and along with 2022 in a completely different universe in terms of flows than any year previously), but flows this year have been less robust until this week. Bank loans saw the largest inflow since November +$0.6bn, while HY saw only the 2nd outflow in 18 weeks (and first in eight) -$0.2bn (but +$22.2bn last 16 weeks). EM debt saw the 26th outflow in 29 weeks, -$0.4bn, after -$37.0bn in 2023, while TIPS saw the 1st inflow in 4 weeks (and only the 4th in 25) +$0.1bn. TIPS saw record outflows of -$33bn in 2023. Munis saw an 8th week of inflows +$0.2bn.
Gold saw a 10th week of outflows in last 11 weeks (& 34th in 38) -$0.5bn, while cash saw broke 2-week string of outflows in a big way, +38.7bn, now +$233.6bn YTD on track for record $1.4T after +$1.3T in 2023 and +$3.2T since 2019. The total inflow to money markets over the last 15 weeks is ~+$662bn. Crypto (assuming bitcoin) took in $2.4bn on track for $44.7bn in 2024.
ICI data on money market flows showed an even bigger inflow to money markets of +$49.9bn in the week to Feb 28th, the second largest this year, now +$172bn YTD, leaving the total sitting in MMF’s as of Wednesday at $6.06tn, a new record.
While hedge fund gross exposures are at record highs according to Goldman.
While BofA says their work indicates that CTAs (trend followers) by their model remain “stretched” in SPX and NDX positioning (as well as Nikkei 225 & Euro Stoxx 50), but given the gains, they would need see declines in the -3% range to reach unwind triggers. So they are most likely not going to have much impact next week. Small caps, though, could see continued buying with more room. 4962 is their sell trigger for the SPX (-3.4%). They’re currently 86% of max length SPX, 80% NDX, but still just 56% RUT (although that’s up considerably from 3 weeks ago). Japan is 94% and Europe 100%. As noted previously, if/when these start selling, there’s a lot to sell. In that regard, BoA’s comment was “at some point these CTA longs will come under pressure and their unwind could potentially create market impact given their size.”
In terms of gamma positioning, they find that delta-hedgers are long gamma in the 4950-5200 range, meaning they’ll cushion declines to the bottom of that range and sell moves up to the top. If it leaves those areas, they will flip to gamma negative as I understand it and be buyers into rallies and sellers into declines. The bottom of the range also coincides w/BoA's estimated trend follower sell point, so a decline below 4950 could escalate rapidly.
But BoA estimates volatility targeters (risk parity) saw a fairly large reduction in exposure on Monday following the previous week’s increase in volatility following NVDA’s earnings. So they remain with more room to the upside (and the downside) if volatility remains low (high).
But combined systematic positioning remains just off the post-pandemic highs from December.
As Goldman sees a potential record year for buybacks.
Sentiment
Sentiment (which I treat separately from positioning) is one of those things that really only matters at the extremes (and even then, like positioning, it only matters when something comes to tip things over). As noted in previous week, sentiment remains very frothy. While most indicators are not at peaks, almost every one is near a peak. Again, this will only matter when something comes to undermine sentiment, but when it does, retail will add to the selloff.
The 10-DMA of the equity put/call ratio (black/red line) has hooked back up. That is generally associated with some indigestion with equity markets (especially if it starts moving higher), but as the x’d out arrow shows, equities completely ignored its rise in Dec/Jan.
While the CNN Fear & Greed Index remains in Extreme Greed at 77, not far from 52-week highs.
And Goldman’s sentiment indicator edges back from the highest of the year now right at the breakeven “stretched” level.
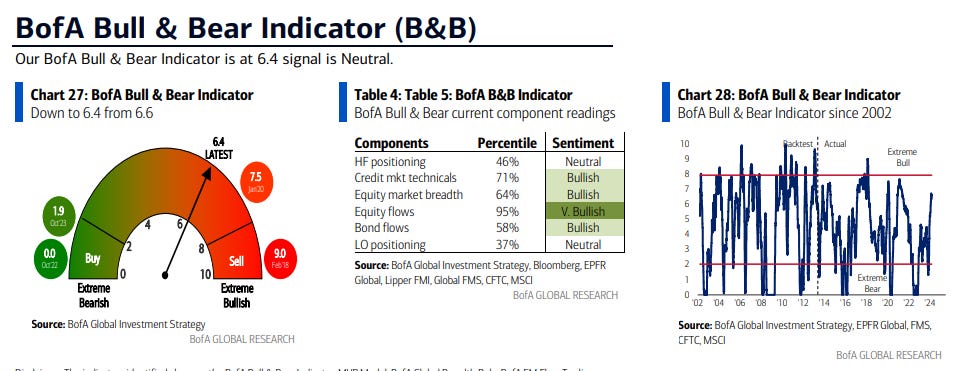
While the BofA Bull & Bear Indicator “down to 6.4 from 6.6 on big EM equity outflows; investors are bullish, but not yet ‘extreme’ bullish.”
Meanwhile BoA’s Sell Side Indicator (SSI) ticked up 33bp to 54.7% in February as the S&P 500 rose for a fourth consecutive month (+5.2%). Now in “Neutral” territory, a less predictive range than the more extreme “Buy” or “Sell” thresholds, but now closer to a contrarian “Sell” signal than a “Buy” (3.3 vs. 3.5ppt) for the first time since April 2022. The current level indicates a price return of +13% over the NTM or 5650 for the S&P 500 by year-end 2024. S&P 500 returns were positive 94% of the time over the next 12m vs. 81% overall
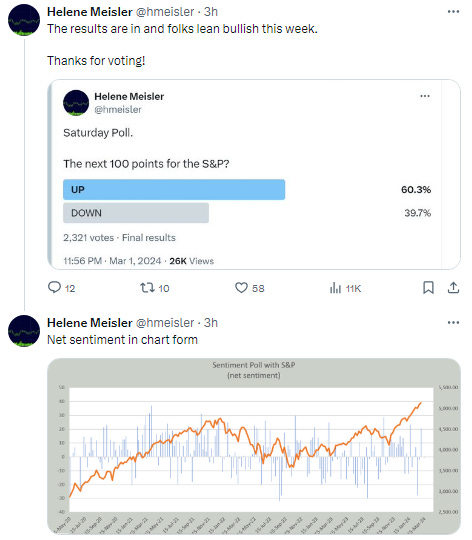
Helene's followers 2nd most bullish since September after 2nd most bearish 2 weeks ago. Nothing like all-time highs to set the mood.
Seasonality
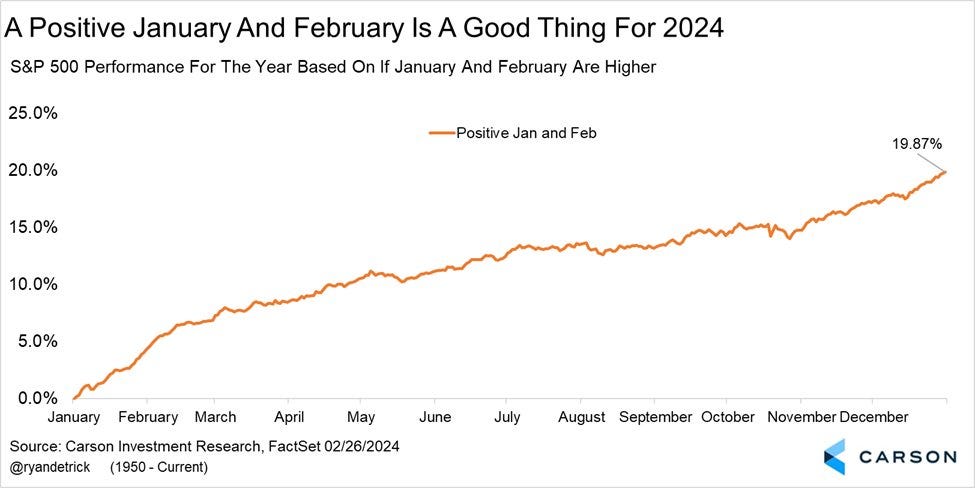
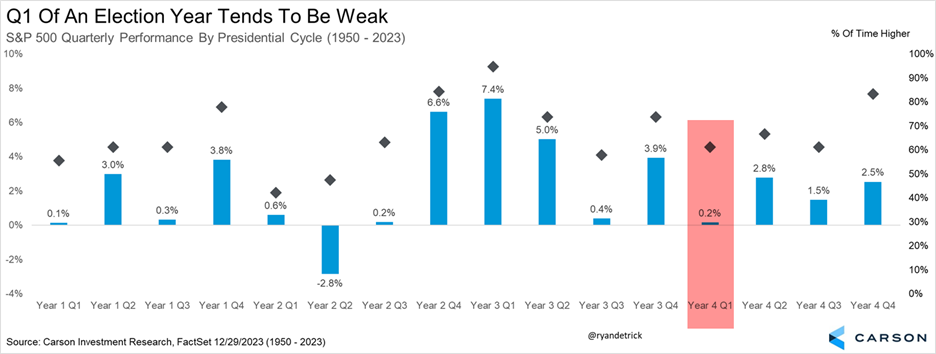
As noted in previous weeks, the second half of February has historically been the worst stretch seasonally of the year. But as noted last week, we don’t normally have the largest stock move in the history of the SPX in that period either, so YTD the SPX has completely ignored the normal seasonal pattern. And with that positive February, history strongly favors more gains through year end (though not necessarily in a straight line). As we turn the page into March, which is normally a strong month but not so much in Presidential election years, start to weigh?
BoA [Suttmeier]: SPX up YTD through February suggests 5420-5490 while SPX up in both Jan and Feb suggests 5490-5510.
For reference purposes to see all of the “as January goes so goes the year”, see the February 4th Week Ahead.
Although Jeff also notes that you have to take some of the Presidential election year weakness with a grain of salt as it includes March 2020. Excluding that, March is more of a sideways grind than a big drop.
And from BBG:
Since 1950, whenever the SPX finished higher in both January and February, full-year returns for the index have averaged 19.8% — with 27 of 28 occurrences producing positive full calendar-year returns, according to Adam Turnquist at LPL Financial. “Can the winning streak continue?,” Turnquist said. “March has historically been a good month for stocks as the S&P 500 has posted an average return of 1.1%. However, during election years, average March returns dip to only 0.4%, with notable historical weakness midmonth.”
Analyst Commentary
The bears continue to remain few and far between:
Matt Maley at Miller Tabak has a word of caution. He says that after the big run in equities, the market is showing signs of froth. While that doesn’t mean stocks will roll over in a big way soon, it is a reason for investors to avoid being too complacent. “The stock market could easily continue to advance,” Maley noted. “However, we believe that it’s important for investors to remain nimble and to have a plan in place — in advance — for what they will do if some sort of significant ‘surprise’ creates a big increase in volatility at some point in the coming months.”
“We believe there are valuation concerns throughout the markets,” said David Bahnsen, chief investment officer at the Bahnsen Group. “Markets are pricing in unrealistic earnings growth at this point. It is just hard for us to rationalize entering the indexes at these levels.” Bahnsen also notes that investors should be “prudent and selective” — avoiding a strategy that simply buys the stocks that go up. “We expect market breadth to increase,” he added. “The only question is whether or not it increases from the top 5-10 names underperforming or the currently underperforming components of the market increasing — or some combination thereof.”
“There is really kind of an everything-is-awesome mentality permeating the markets right now on hopes of not only a soft landing, but no landing, which isn’t really a thing or we would never have economic cycles,” Roland said. “I think we have to remember that economic cycle analysis does matter. It just doesn’t exist today.”
US stocks have reached a significant inflection point — poised to either “top out or broaden out,” according to Craig Johnson at Piper Sandler. Technical evidence suggests the next 10% move in the equity market is likely lower than higher, he added. “We continue to observe overall poor market breadth,” Johnson noted. “A broadening out will favor the financial and healthcare sectors as they are among the largest weightings in the Russell 2000. A topping out would likely result from profit-taking in the ‘Magnificent Seven’ stocks.”
But the bulls remain very positive, even as many continue to look for a dip to buy (this is over the last 2 weeks):
Stock markets have room to extend gains beyond record highs if the economic outlook remains upbeat and investors pour money into recent laggards, according to Goldman Sachs Group Inc. strategists. The S&P 500’s run to an all-time peak has left investor positioning “extremely” concentrated in the so-called Magnificent Seven, the team led by Cecilia Mariotti wrote in a note.
While that does create the risk of a pullback, there’s also “space for bullish sentiment and positioning to be further supported, especially if we start seeing a more meaningful rotation out of cash and into risky assets and laggards within equities,” the strategists wrote.
Doomsayers keep pushing the narrative “that any day now it’s going to kick in and there’s going to be this weakness,” said Neil Dutta of Renaissance Macro. “I just think there is only so long you can keep doing that. That’s why I think the consensus has been perpetually surprised to the upside.”g
“Now, as a result of the AI-induced surge, investors wonder if the market will top out or broaden out,” said Sam Stovall at CFRA. “We think it will broaden out – eventually, but not before investors feel assured that the Fed will not postpone the first rate cut beyond the second quarter of this year.”
Tallbacken Capital Advisors’ Michael Purves is so optimistic about a “dual Goldilocks effect” of the Fed ending hikes and strong US consumers that he sees a “distinct possibility” of the S&P 500 ending the year at 5,500 or even beyond.
“Market momentum remains intense, with any momentary period of weakness quickly bought by bulls,” said Mark Hackett, chief of investment research at Nationwide. “The bear case has come apart as the technicals and fundamentals both support the rally, though elevated valuations and near-universal optimism are things to watch from a contrarian basis.”
HSBC strategists upgraded their view on global stocks to neutral from underweight, saying their decision to downgrade in January was “wrong” as they failed to predict the rally in artificial-intelligence stocks.
Barclays Plc upped its year-end target on the S&P 500 — following increases from Goldman Sachs Group Inc., UBS Group AG, and Piper Sandler & Co. Strategists led by Venu Krishna boost forecast on US equity benchmark to 5,300 from 4,800. “The US economy continues to defy rates headwinds in 2024, much as mega-cap tech continues to defy even the most bullish earnings targets,” they wrote.
While valuations are higher for the “Magnificent Seven” megacaps, they are warranted for the group delivering earnings growth that’s “significantly better” than the remaining companies in the S&P 500, according to To Marc Dizard at PNC. “Right now, the Magnificent Seven names aren’t an area I would over concentrate, but I wouldn’t want to neglect them in a portfolio either,” Dizard said. “So certainly have, and maintain, an exposure to these names – but keep it in context of a more broadly diversified portfolio.”
Bank of America Corp.’s Savita Subramanian is the latest equity strategist to ratchet up her target for the S&P 500 Index to among the highest on Wall Street after this year’s rally left forecasters blindsided. Subramanian now expects the benchmark to end the year at 5,400, compared with her earlier target of 5,000 — implying a gain of about 5% from Friday’s close. Indicators are flashing bullish signals on stronger earnings growth ahead and “surprising” profit margin resilience, she said. “Bull markets end with euphoria — we’re not there yet,” Subramanian, the bank’s head of US equity and quantitative strategy, wrote in a note to clients on Sunday. “Sentiment has improved, but areas of euphoria are limited.”
To Kristina Hooper at Invesco, there is a perception that the US stock market is trading at very lofty valuations. While it is true that the S&P 500 is at an above-average price-to-earnings ratio, much of that is driven by just a few stocks, she noted. “The good news is that this narrow group of stocks — dubbed the “Magnificent Seven” — have been meeting the high expectations set for them,” Hooper said. “Given their collective performance, valuations for the Magnificent Seven remain elevated compared to the broader US equity market, but their earnings growth is expected to be almost five times that of the remaining 493 stocks in the S&P 500 over the next years….This isn’t ‘irrational exuberance’ — it’s more like ‘rational exuberance,’ she concluded.
JPM markets says we might get a seasonal pullback but markets can continue rallying from here but something more sinister would require "deterioration of both macro and fundamental story":
"CAN MARKETS KEEP RALLYING? Yes, they can. The well-flagged concentration risk can continue from here since there are no obvious negative catalysts for the Mag7 and you have a series of investor events in March that have the potential to pull more inflows. The most impactful event with be NVDA’s GTC on March 18, where the company has historically announced their next-gen datacenter products.
WHICH SECTORS DO YOU LIKE? From the Feb 20 Morning Briefing (but a view that I have held since last year), while we may see a near-term pullback given negative seasonality in late February, it will take deterioration of both the macro and fundamental story to see a multi-month decline. I favor longs in Tech (Mag7; Semis) and parts of Cyclical sectors (Large-Cap Banks, Credit Cards, Homebuilders, Transports, and Retailers). For hedges, I like using Credit and Defensives. For international exposure, Japan remains the top pick though China is becoming more interesting especially if we see fiscal support."
· WHAT WOULD MAKE YOU CHANGE YOUR BULLISH VIEW? Some events, should they occur, would trigger a reconsideration of the current hypothesis, include (i) a negative NFP – this could shift the narrative to one of recession or stagflation, negative for stocks; (ii) 2-3 consecutive negative Retail Sales prints – this would have a similar impact as a negative NFP print, but potentially less acute; (iii) a QoQ or YoY decline in SPX revenue or earnings especially if led by MegaCap Tech; (iv) an inflation spike that pushes yields materially higher with significant velocity; (v) a decline in consumption likely triggered by a rise in unemployment; (vi) a deterioration of consumer and corporate balance sheets – in the case of consumers would use proxies such as debt service payments as a percentage of income as well as credit card delinquency data. Separately, things such as geopolitics are important to consider but tend to not have a lasting impact on US Equities.
Final Thoughts
Overall, my message the last several weeks has been things are primed for a pullback of some magnitude. The equity run and positioning are extended, sentiment is relatively frothy, technicals and breadth are not terrible but not great, real rates remain restrictive, the economy while holding in is showing signs of slowing, etc. I’m in particular eyeing the high levels of systematic equity exposure. That can stay elevated basically indefinitely, but when it hits triggers the selloff will be quick and sharp. That said, I’m not particularly concerned that any selloff needs to be particularly deep or prolonged, and this market could just keep going up like we saw in 2021, so I’m not making any active bets on downside. Overall things are moving in the right direction (the economy is holding in, earnings are back to growth, the Fed is much more likely to be cutting than hiking this year, the technical picture and seasonality are strong overall for this year, etc.) So if we do get that sharp pullback I would think it will likely be an opportunity not a reason to run for the hills.
And just remember when a 10%+ correction inevitably happens, it’s supposed to. That’s most likely not the time to be selling.
Portfolio Notes
Sold the PANW bought last week. GM position and half of BAC and VNOM called away. Got back into ABEV, SEE, PEAK and NYCB (smallish), added to some other names on weakness, including more China shares.
Cash = 20% (this is more than I want to hold, but I’m looking for a pullback in 1Q to add at this point, held mostly in SGOV and MINT but also TLH (if you exclude the longer duration bonds, cash is around 15%)).
Did put on some SPX and QQQ shorts end last day of December, but haven’t added. Around 1% total.
Positions (after around the top 20 I don’t keep track of their order on a frequent basis as they’re all less than 0.5% of my portfolio).
Core positions (each 5% or more of portfolio total around 20%) Note the core of my portfolio is energy infrastructure, specifically petroleum focused pipelines (weighted towards MLP’s due to the tax advantages). If you want to know more about reasons to own pipeline companies here are a couple of starter articles, but I’m happy to answer questions or steer you in the right direction. https://finance.yahoo.com/news/pipeline-stocks-101-investor-guide-000940473.html; https://www.globalxetfs.com/energy-mlp-insights-u-s-midstream-pipelines-are-still-attractive-and-can-benefit-from-global-catalysts/)
EPD, ET, PAA
Secondary core positions (each at least 0.5% of portfolio, total around 8%)
ENB, GOOGL
For the rest I’ll split based on how I think about them (these are all less than 0.5% of the portfolio each)
High quality, high conviction (long term), roughly in order of sizing
WFC, CTRA, DIS, XOM, USB, DVN, KMI, MAC, SHEL, MPLX, CVS, KHC, ANAC, T,, K, BWA, TRP, SCHW, TLH, VNOM, APA, ADNT, PFE, O, GSK, HBAN, SWKWS, C, CQP, MTB, EQNR, OXY, BAC RHHBY, STLA, NEM, NTR, CMCSA, E, ING, WES, VZ, SQM, PFF, VSS, BMY, TFC, DAL BTI, AM, GILD, JWN, ARCC, LAZ, AES, VOD, AM, BWA, DAL, VSS, BAYRY, ING, TLH, ETRN, VZ, NTR, CRM, SWKS, RRC, FRT, BMY, FANG, CI, DGS, SNOW, PXD, E, INDA, FIS, JWN, VWAPY, CMCSA, BMWYY, EOG, NXPI, DDAIF, BUD, KEY, CVE, SOFI, BEP, BIIB SAN, TEF, SPG, KVUE, KT, PLTR, F, TSM, KLG, VNM, MT, MFC, TD, LYG, BMO, FSK, ORCC, EMN, MDT.
High quality, less conviction due to valuation
AAPL
Higher risk due to business or sector issues; own due to depressed valuation or long term growth potential (secular tailwinds), but at this point I am looking to scale out of these names on strength. These are generally much smaller positions outside of the top few.
ILMN, AGNC, PYPL, FXI, TPR, ORAN, CHWY, TIGO, SWN, URNM, ACCO, CLB, WBA, PARA, TEVA, LUMN, HBI, TCNNF, TCEHY, YUMC, EEMV, PK, VNM, CURLF, GTBIF, FXI, , TPIC, NCLH, SABR, NSANY, BTI, VNQI, CCJ, SBH, ST, WBD, LADR, BNS, EWS, VTRS, IJS, NOK, SIL, WVFC, NYCB, ABEV, PEAK, SEE, LBTYK, DOCU, KWEB, CMP, TAP, BBWI, GPN, ZM, CAL, EWZ, CZR, LAC, MBUU, TLRY, HRTX
Note: CQP, EPD, ET, MMP, MPLX, PAA, WES all issue K-1s (PAGP is the same as PAA but with a 1099).
Reminder: I am generally a long term investor (12+ month horizon) but about 20% of my portfolio is more short term oriented (just looking for a retracement of a big move for example). This is probably a little more given the current environment. I do like to get paid while I wait though so I am a sucker for a good well supported dividend. I also supplement that with selling calls and puts. When I sell a stock, I almost always use a 1-2% trailstop. If you don’t know what that is, you can look it up on investopedia. But that allows me to continue to participate in a move if it just keeps going. Sometimes those don’t sell for days. When I sell calls or puts I go out 30-60 days and look to buy back at half price. Rather than monitor them I just put in a GTC order at the half price mark.
To subscribe to these summaries, click below (it’s free).
To invite others to check it out,


