

US Chicago Fed Nat Activity Index Dec: -0.49 (prevR -0.51)
US Chicago Fed Nat Activity Index Dec: -0.49 (prevR -0.51)
CFNAI remains in negative territory not far from recessionary levels for a second month

US Chicago Fed Nat Activity Index Dec: -0.49 (prevR -0.51)
Chicago Fed National Activity Index: Current Data - Federal Reserve Bank of Chicago
Note: The reason I like the CFNAI is that it gives a good distillation of a lot of inputs (85 total) from several different areas across the US economy (this is a national indicator which covers production, employment, consumption, incomes, sales, etc.) which we'll go through below. According to the Chicago Fed, over the past 20 years the CFNAI has a 95% accuracy rate in predicting recessions with a lag time of 6-18 months. In terms of reading its signals:
“Following a period of economic expansion, an increasing likelihood of a recession has historically been associated with a CFNAI-MA3 value below –0.70. Conversely, following a period of economic contraction, an increasing likelihood of an expansion has historically been associated with a CFNAI-MA3 value above –0.70 and a significant likelihood of an expansion has historically been associated with a CFNAI-MA3 value above +0.20.”
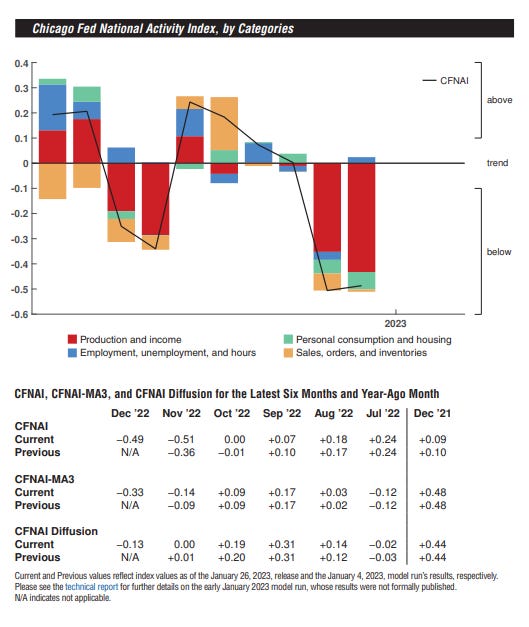
The Chicago Fed National Activity Index (CFNAI), which spent most of 2022 above or around the 0 dividing line indicating trend growth, but fell sharply in November to -0.51, not far from its recession signal (3-month average under -0.70), improved slightly but remained at the third-lowest reading since the start of the pandemic at -0.49.
This brought the 3-month moving average (the CFNAI-MA3), which as noted is what this report uses for its recession signal, down to -0.33 from -0.14 in November (it was +0.09 in October). Again, the recession signal is this number falling under -0.70, so as of now this is not signaling a recession, but it’s the closest since June 2020. As I noted starting in October,
I should note the -0.70 reading has always occurred when the economy is already in recession. But that said, normally the MA3 is well below zero and falling rapidly as a recession is starting (see tables at the bottom). The one exception was 1973 when it was in positive territory. Notably, though, that was also a period of high inflation.
For a third consecutive month, just one of the four broad categories made positive contributions in December. 40 of the 85 individual indicators made positive contributions to the CFNAI in September (up slightly from November but down from 45 in September), while 45 made negative contributions (down slightly from November but up from 37 in September). 44 indicators improved from November to December, while 40 indicators deteriorated.
As a reminder, the CNFAI doesn't have any "new" data - it is just a compilation of other reports that have been released (or estimates for reports that haven't been released yet). You can see all of the indicators here. But since all of the data is not available at the time of the initial report, and as this is subject to being revised as the underlying reports are revised, I like to look back at revisions, which were on balance slightly negative. For this report data was as of Jan 23rd. As of that date, data on 51 of the 85 indicators had been published.
So, overall, this report, unlike other reports like GDP, the PMI’s, consumer UofM consumer confidence, and the Leading Index from the Conference Board, had not previously suggested a marked softening in the economy. That changed in November and continued into December. As noted, it’s not yet signaling a recession, but any further declines over a 3-month period likely would.
From the report (bold is mine):
Production-related indicators contributed –0.43 to the CFNAI in December, down from –0.35 in November. Industrial production fell 0.7 percent in December after decreasing 0.6 percent in November. The contribution of the sales, orders, and inventories category to the CFNAI moved up to –0.01 in December from –0.07 in the previous month. Employment-related indicators contributed +0.02 to the CFNAI in December, up from –0.03 in November. The unemployment rate ticked down to 3.5 percent in December from 3.6 percent in November. The contribution of the personal consumption and housing category to the CFNAI ticked down to –0.07 in December from –0.05 in November.
And here’s a chart that I thought was interesting. It is the 3-month moving average against sustained increases in inflation. As you can see in the past sustained inflation has always led to a deeply negative reading (probably because high inflation has historically been associated with recessions). So far we haven’t seen it though.

To subscribe to these summaries, click below.
To invite others to check it out,
To see more content, including summaries of most major U.S. economic reports and my morning and nightly updates go to Neil’s Newsletter Substack. You can also follow me on Twitter @NeilKSethi.