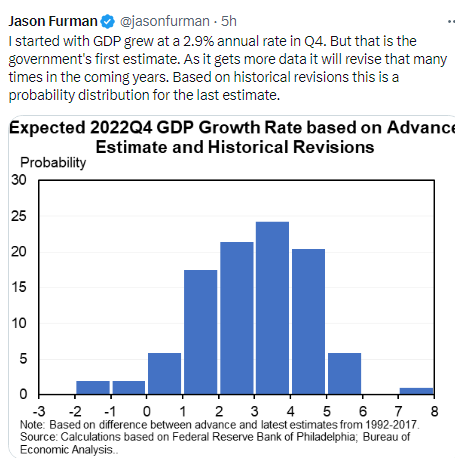
US GDP Annualized (Q/Q) Q4 A: 2.9% (est 2.6%; prev 3.2%)
neilsethi.substack.com
US GDP Annualized (Q/Q) Q4 A: 2.9% (est 2.6%; prev 3.2%)
4QGDP comes in above expectations led by inventory rebuild and consume spending. Spending below expectations, though, decelerating from 3Q. Core prices come in as expected.
*Note: remember that all of the numbers are annualized so it reflects the change from the previous quarter but then annualizes it (so the numbers are basically 4x what the q/q change was). If a number isn't annualized, I will note it.
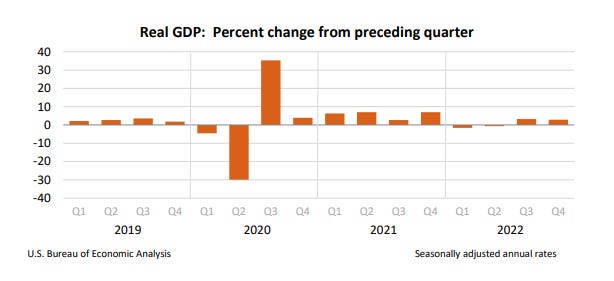
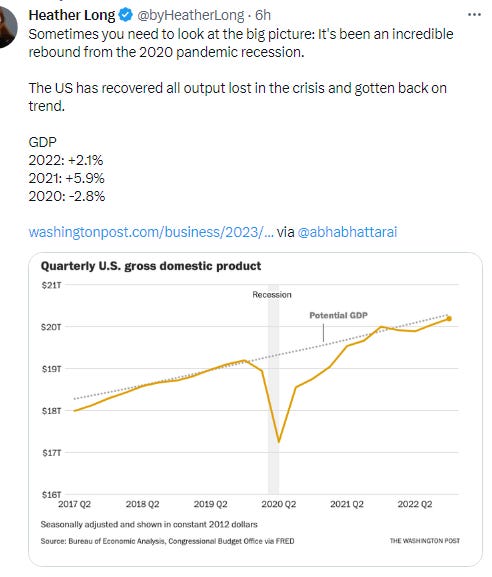
After bouncing back into positive territory in the third quarter (3Q) of 2022 (so 3Q22) with a +3.2% gain fueled by better than expected personal consumption, business investment, government spending, and trade, 4Q GDP remained firmly in positive territory as well coming in with a +2.9% gain, although this time the composition was a little less positive with inventories leading the gains. But consumer spending was still a big contributor as were government spending and trade. Housing continued to be a major drag.
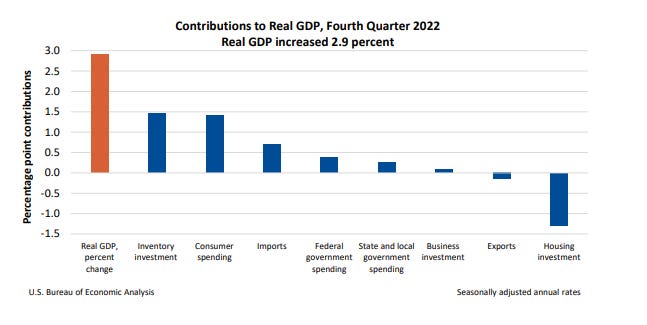
The increase in real GDP reflected increases in private inventory investment, consumer spending, federal government spending, state and local government spending, and nonresidential fixed investment that were partly offset by decreases in residential fixed investment and exports. Imports, which are a subtraction in the calculation of GDP, decreased.
There is a ton of information in this report, but as usual let me hit the high points. Looking at the components individually (full table at the end):
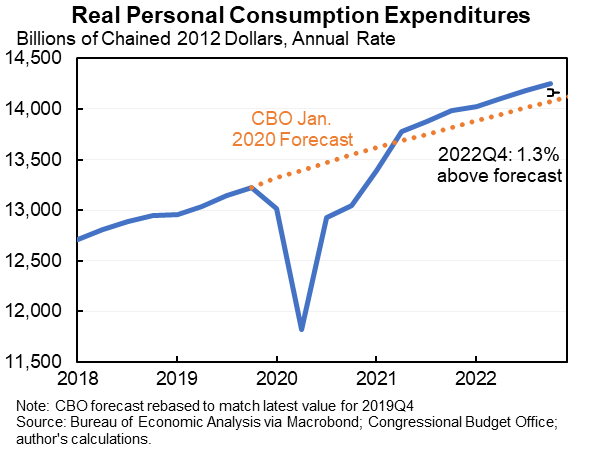
PCE (personal consumption expenditures (spending)), as noted was a relative strong point in 3Q coming in at up 2.3%, and remained a big support at +2.1% in 4Q, although that was weaker than expectations. The report noted an “an increase in services (led by health care, housing and utilities, and "other" services) and goods (led by motor vehicles and parts).” In that regard, goods spending increased for the first time in 2022 by 1.1% after falling -0.4% annualized in Q3, -2.6% in Q2 and -0.1% in Q1 while services were up 2.6% after +3.7% in Q3, 4.6% in Q2 and 2.1% in Q1. Realservices spending has increased every quarter since the pandemic. Personal spending was a +1.42% contribution to GDP down from 1.54% in Q3. It is up 1.9% y/y. Another gauge of underlying demand – sales to domestic buyers, after adjustment for inflation – increased by a more modest 0.8%.
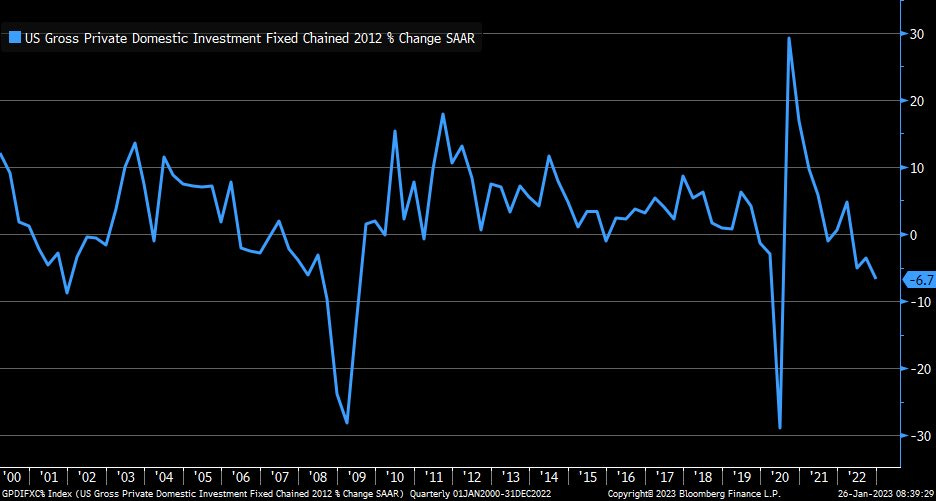
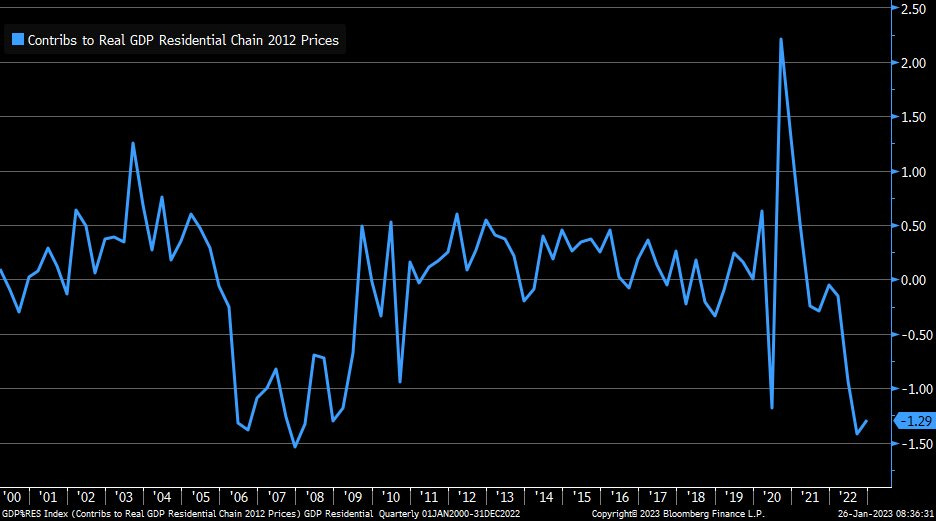
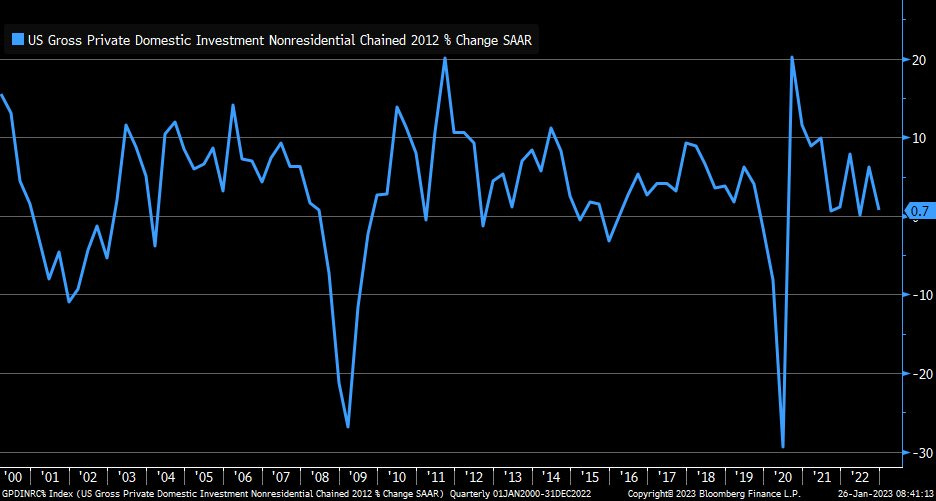
Fixed asset investment continued to be a big drag, in fact it was the most since the initial pandemic lockdowns. After falling by -5.0% in Q2 and -3.5% Q3, the decline accelerated to -6.7% in Q4, a drag of -1.2% from GDP, with residential construction again leading declines, falling a huge -26.7% annualized after -26.1% in Q3 and -17.8% in Q2. That (residential fixed investment) alone was responsible for a drag of -1.29% in GDP (so the rest of fixed asset investment was a slight net positive). Residential investment is now down -19.3% y/y, and this was the seventh consecutive quarter of declines. Note this includes broker’s commissions which have been a notable laggard for obvious reasons. Non-residential structures continued to remain positive, although decelerating to +0.7% from 6.2% annualized in Q3, while equipment investment which was up a very healthy 10.6% in Q3 fell for the second time in three quarters at -3.7%. That though remains up 3.8% y/y. Intellectual property investment continued its string of positive quarters (it hasn’t been down since Q22020) with a solid 5.3% increase annualized. That’s up 7.9% y/y. Those latter two categories comprise business spending so that has clearly slowed. Residential investment tends to be a leading indicator for the economy, equipment and software is generally coincident, and nonresidential structure investment trails the economy according to Bill McBride. Private investment overall was a +0.27% benefit to GDP due to inventories (discussed next).
Private inventory investment, which was a subtraction to GDP in the first three quarters, was the biggest support to 4Q adding +1.46% to GDP after subtracting -1.8% in Q3 and -2.8% in Q2. I had noted in previous quarters that the declines “seem weird to me as we have seen inventories building in the monthly inventories reports”, so this I think should have been expected. According to the report, “[t]he increase in private inventory investment was led by manufacturing (mainly petroleum and coal products as well as chemicals) and mining, utilities, and construction industries (led by utilities).”
Exports (which are additive to GDP as they were made here), which were a big boost in Q2 (+13.8%) and Q3 (+14.6%) turned into a drag in Q4 of -1.3%. All of the decline was on goods side (-7.0%) as services (+12.4%) advanced solidly for a third quarter. Exports were a -0.15% drag to GDP after contributing +1.65% in Q3. “Within exports, a decrease in goods (led by nondurable goods excluding petroleum) was partly offset by an increase in services (led by travel as well as transport).” As I had said last quarter, I didn’t see how exports could continue at the pace of mid-2022 given the state of the global economy, but things outside the US seem to be improving, so this at least hopefully won’t become a big negative in 2023. Exports were up 5.3% y/y down from 11.3% y/y in Q3.
Imports (which are a subtraction from GDP as they were made elsewhere), which decelerated significantly in Q2 (+2.2%) and had a rare negative print in Q3, falling -7.3%, remined negative in Q4 (-4.6%). So unusually imports were an additive to GDP for a second quarter (+0.71% after +1.21% in Q3). As noted, falling imports is not typical, and we’ve already started to see a return to import growth in the December numbers, so I would imagine this flips back to its normal role as a detractor to GDP in 2023. Imports were up only 1.7% y/y in Q4.
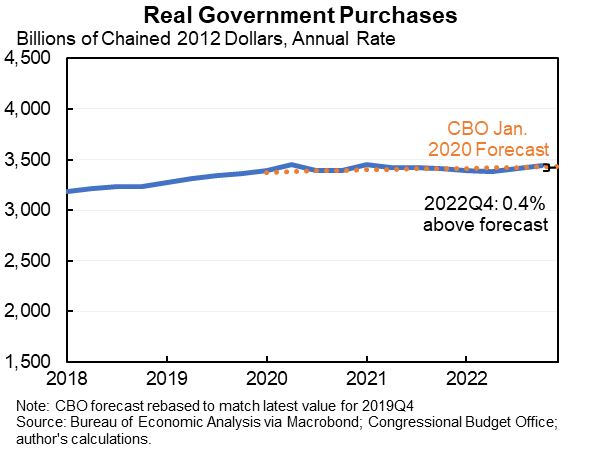
Federalgovernment spending accelerated in Q4 to 6.2% after increasing Q3 for the first time time since the first quarter of 2021 (+3.7% supported by a +4.7% jump in defense spending). Defense spending decelerated to +2.4% but that was more than made up by non-defense spending which jumped +11.2% annualized.
State and local government spending also increased, up +2.3% after increasing Q3 for the first time since the third quarter of 2021 (+3.7%). “The increase in state and local government spending primarily reflected an increase in compensation of state and local government employees.”
Federal and spending added +0.39% to GDP and state and local +0.25%. I said in the Q2 report
I would like to see this start to stabilize, and it should as we start to release the funds freed by the budget bill. It also looks like we might have more spending coming based on news reports of a spending deal. Defense spending should for sure continue to bounce back.
So it looks like we’re seeing that for a second quarter. Total government spending was up +0.9% y/y, the first time it was up y/y since Q421.
Turning to non-GDP areas, realdisposable personal income accelerated from Q3’s +1.0% (as a reminder the first positive print since Q120) to +3.3%. I’ve noted the past few months if wages can remain stable while inflation falls it will be a big tailwind to household balance sheets. The increase primarily reflected increases in compensation (led by private wages and salaries), government social benefits, and personal interest income (table 8). Within government social benefits, the increase primarily reflected an increase in "other" benefits reflecting state stimulus payments to individuals in the form of one-time refundable tax credits.” Seeing such a strong number is great to see (even if the Fed might differ). It remains down -2.3% y/y though, but that’s the least negative since Q421.
The personal savings rate, which had been a one-way trip to the downside since peaking in 2020 at almost 20%, appears to have stabilized finally (although it didn’t have much further to fall) increasing to 2.9% from 2.7% in Q3 (which had been the lowest since 2005).
There’s a lot of price data in the full report. It gives prices for every major GDP component. Overall, across all the GDP categories prices continued their sharp deceleration to 3.5% annualized from 4.4% in Q3 and 9.0% in Q2. Turning to the all important PCE prices (which is what the Fed uses as their preferred price gauge) the headline fell to 3.2% annualized from 4.3% in Q3 and core PCE prices fell to 3.9% from 4.7%. Those were in line with expectations. Headline PCE prices was the lowest since Q420 when it was 1.6% (remember those days?) and core the lowest since Q121 when it was 3.5%. Again, good to see, and bodes well for the PCE price data we’ll get tomorrow for December.
So, overall, definitely a weaker report than Q3 given the strongest component was an inventory build, but spending and incomes remained healthy, although the former below expectations, while government spending, which was a drag to start 2022, has become a tailwind as the money from the various infrastructure programs passed the last few years flow through. Business investment is clearly slowing, though, and as noted the boost from negative imports will likely not be repeated anytime soon, while inventory builds are a self-correcting mechanism (so won’t be a big tailwind indefinitely). Residential investment should be bottoming out soon, but I’m not sure we’ll see it as a big support in the near future.
Putting all of that together, I can definitely see a couple of soft quarters to start the year similar to 2022. But as I noted last quarter, “to the extent we continue to get some relief on prices, it should flow through to support the economy, and just maybe we’ll be able to hold it together until the Fed sees what it needs to.” In that regard the 3.3% increase in real personal disposable income in Q4 is something that seems to have flown under the radar, but I can bet that households have noticed (and probably the Fed).
Some comments:
“Consumer spending on services drove the economy to solid growth in the fourth quarter, but the good news ends there. Two measures of underlying activity that strip out volatile components — including trade, inventory swings, and government spending — showed considerably milder growth.” — Eliza Winger, Bloomberg economist
“When we look at what’s happening with the consumer, which is the backbone of the US economy, we are seeing a clear loss of momentum,” Lindsey Piegza, chief economist at Stifel Nicolaus & Co. in Chicago, told Bloomberg TV. “Without the consumer happy and healthy out in the marketplace, we simply cannot expect to maintain positive growth, let alone more robust growth similar to what we saw this morning,” she said. “We are teetering towards a recession.”
To see more content, including summaries of most major U.S. economic reports and my morning and nightly updates go to Neil’s Newsletter Substack for newer posts or https://sethiassociates.blogspot.com for the full history.