US New Home Sales Change Dec: 616K (est 612K; prev R 602K)
neilsethi.substack.com
US New Home Sales Change Dec: 616K (est 612K; prev R 602K)
New home sales increase against expectations for a decrease, but as with Oct, was b/c prior month was revised down. Median sale price lowest since August.
US New Home Sales Change Dec: 616K (est 612K; prev R 602K) - New Home Sales (M/M): +2.3% (est -4.4%; prev R +0.7%) - Median Sale Price (Y/Y) (USD): 442.1K (prev 471.2K or +9.5%)
New-home purchases account for about 10% of the market and are calculated when contracts are signed. They are considered a timelier barometer than purchases of previously-owned homes, which are calculated when contracts close. They do not include cancellations. All numbers m/m unless otherwise noted. Most of what is reported in the media is seasonally adjusted, so I will report on that basis as well. Finally, please note that this report is subject to significant revisions (for example the 90% confidence interval for the m/m figure in this report is a big +- 18.5%.
Going to give a brief summary and then provide a link to Bill McBride’s really excellent blog post that goes into more detail with lots of great charts (no need to reinvent the wheel, Bill is one of if not the best on the subject).
Two months ago I said
While I am to some extent anticipating a bounce in November as mortgage rates have fallen this month to the lowest since early September, I was not anticipating a bounce in October. But that’s just what we got with new home sales jumping to a 632k annualized pace up from 588k in September. The median estimate in a Bloomberg survey of economists called for a 570k rate. That said, I encourage you to read to the end on this one, as the Census bureau (who compiles this report) does not take into account cancellations which are definitely making home sales look higher than they actually are. Sales are down -14% y/y.
And in November we did see the bounce I was expecting but only because that October jump was revised down to a 605k annual pace (from 632k). From that level new home sales were initially reported as moving 5.8% higher (seasonally adjusted) to a 640k annual pace (so slightly above October’s originally reported level).
Well, in a reprise of that, December also saw an increase, but, again, only after large revisions to the previous three months that brought November’s level down to 602k annualized (October is now down to 598k). From that lower base, sales moved up by a modest 14k annualized to 616k, an increase of 2.3%. It is though the highest since August (and before that March). For all of 2022 644,000 houses were bought, the smallest annual total in four years. The 16.5% y/y drop was the largest annual decline since 2009.
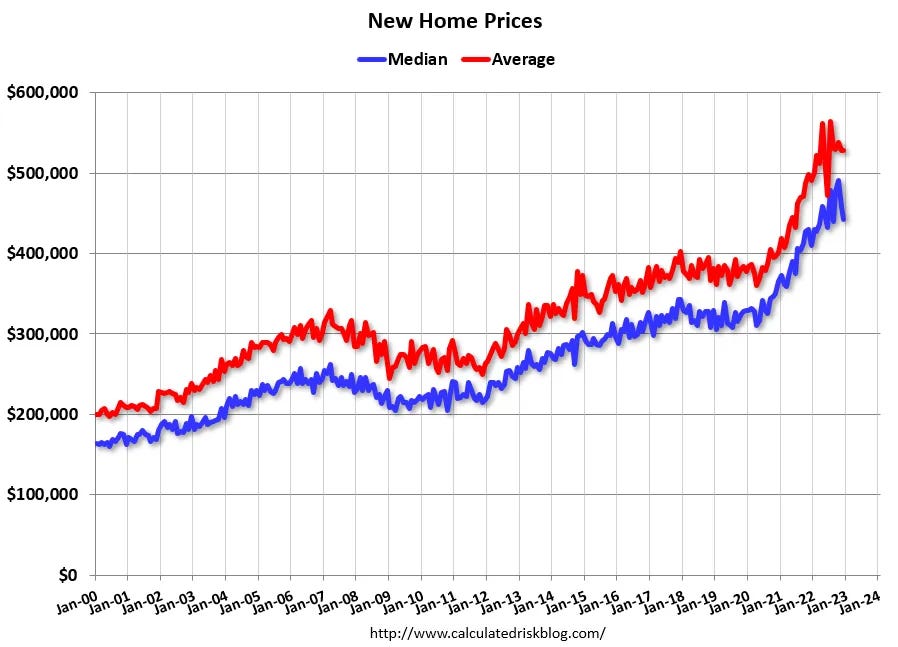
Turning to prices, those were mixed with the median sales price falling for a second month to $442k from November’s $459k (revised down from $471k), and October’s record high of $491k (as revised), while the average sales price remained unchanged at $528k (but only after November was revised down to that level from $544k), still not too far from the record $565k in July. The median price is up 8% y/y as is the average price.
Inventories which have steadily crept higher over the past year remained at 461k. Still that is up from 394k at the start of 2022. With the higher sales volume, months of supply fell to 9.0 from 9.2 in November (as revised) and the recent high of 10.1 in September. It is though over double the all time low of 3.5 months in October 2020, and is well above the "normal" range of 4-6 months. It was 5.6 months a year ago.
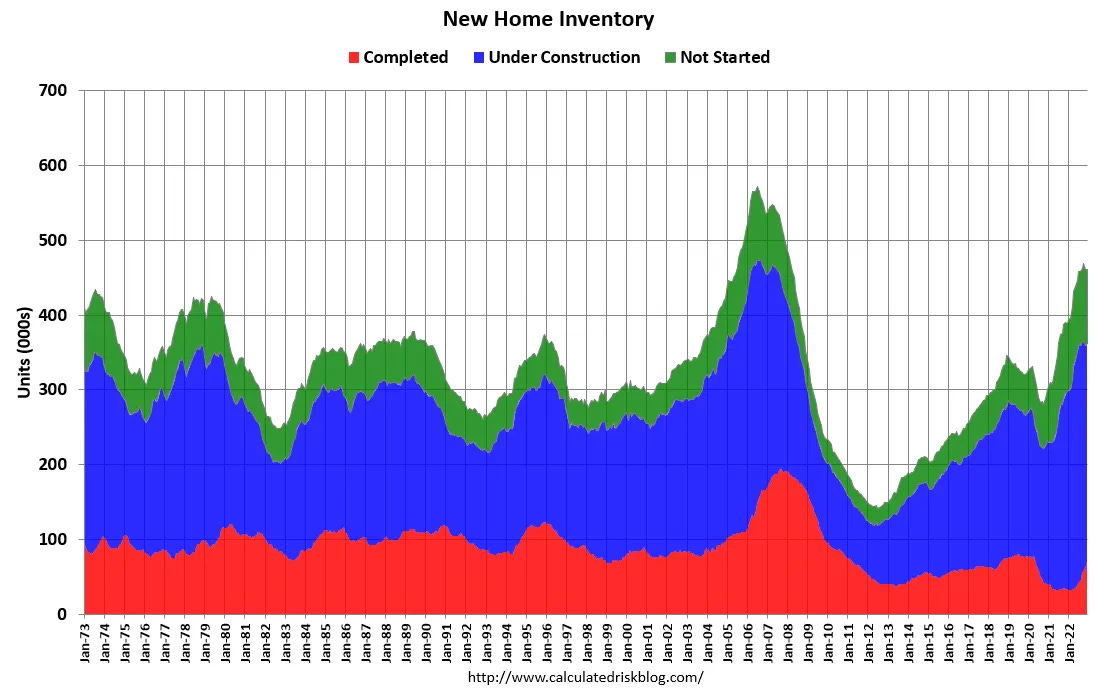
But the makeup of that inventory continues to shift as Bill details in his blog post. For most of the past two years there has been a wide separation between supply of homes that have been completed (well below normal) versus supply not yet started (at record highs) or under construction (well above normal levels). So while there have consistently been well above the normal amount of homes "for sale" there's been a below historically normal number that actually exist today. That has corrected now to the point that the inventory of completed homes (at 71k, up from 32k to start the year) is finally approaching normal levels. It is now the highest since June 2020. What remains extremely elevated are the number of homes under construction (at 291k just 8% under the cycle highs) and those not started (which is 5k below the record 104k in October). Of course, given inventories are starting to normalize you have to wonder how many of those homes that haven’t been started will be started until the housing market regains its footing (meaning that months of supply number may be a bit misleading). The number of homes sold in December and awaiting the start of construction — a measure of backlogs — increased to the highest since March.
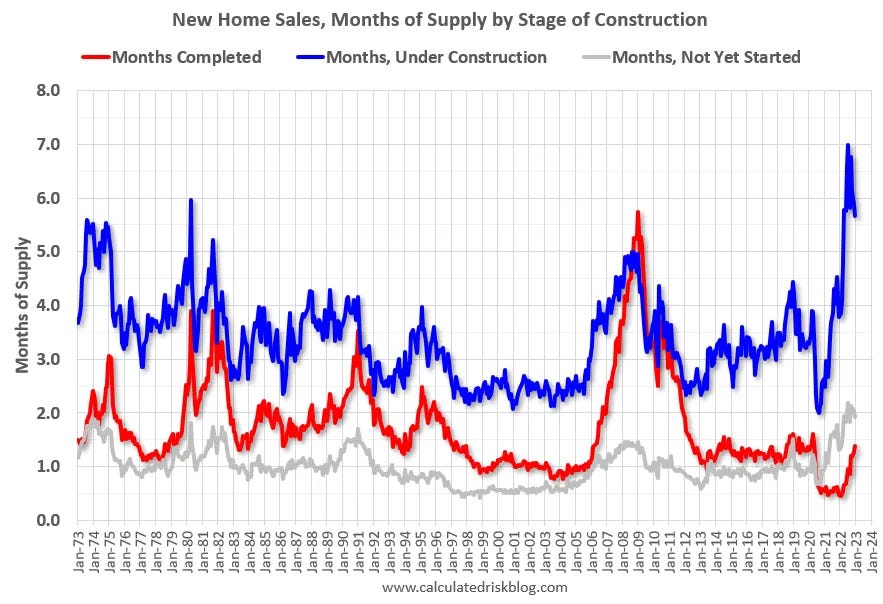
There are 1.4 months of completed supply (red line). This is close to the normal level. The inventory of new homes under construction is at 5.7 months (blue line). This elevated level of homes under construction is due to supply chain constraints. And about 1.9 months of potential inventory have not been started (grey line) - about double the normal level. Homebuilders are probably waiting to start some homes until they have a firmer grasp on prices and demand.
As normal, there was wide dispersion across regions. The report showed sales climbed in two of four regions, led by a more than 35% jump in the Midwest. Sales dropped in the Northeast and West. The South has by far the most sales with over half of all sales nationwide. Sales in all regions were down at least -17% y/y led by the West down almost -50%.
Here is the link again to Bill’s report, he has a lot more analysis on a lot of different factors and more charts.
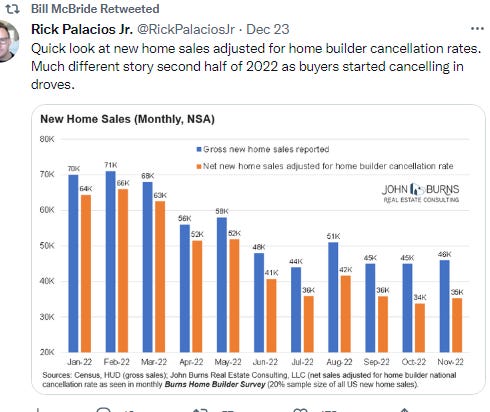
As previously discussed, the Census Bureau overestimates sales, and underestimates inventory when cancellation rates are rising, see: New Home Sales and Cancellations: Net vs Gross Sales. So, take the headline sales number with a large grain of salt - the actual negative impact on the homebuilders is far greater than the headline number suggests!
This will reverse when cancellation rates start declining. When a previously cancelled home is resold, the home builder counts it as a sale, but the Census Bureau does not (since it was already counted).
There are a large number of homes under construction, and this suggests we will see a further sharp increase in completed inventory over the next several months - and that will keep pressure on new home prices.
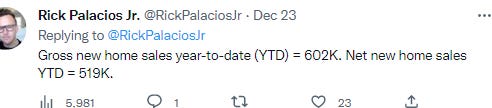
And here’s an estimate by Rick Palacious on just how much of a difference that (cancellations) can make (he estimated around 83k YTD as of November).
Overall, I agree with Bill’s take that the coming supply should work to bring prices down even if it hasn’t shown up so far in this report. But I also have said that if mortgage rates continue to drift lower we will see a bottom in the sales declines before too long thereafter (though it could take until next year as these cancellations cycle through). In that respect here is a nice chart from Advisor Perspectives which shows that on a population adjusted basis the decade after the housing bubble was an anomaly, and we are now back to the lows which preceded that in terms of new home sales.
To see more content, including summaries of most major U.S. economic reports and my morning and nightly updates go to Neil’s Newsletter Substack. You can also follow me on Twitter @NeilKSethi.