

US Pending Home Sales NSA (Y/Y) Dec: -34.3% (est -35.4%; prev R -37.7%)
US Pending Home Sales NSA (Y/Y) Dec: -34.3% (est -35.4%; prev R -37.7%)
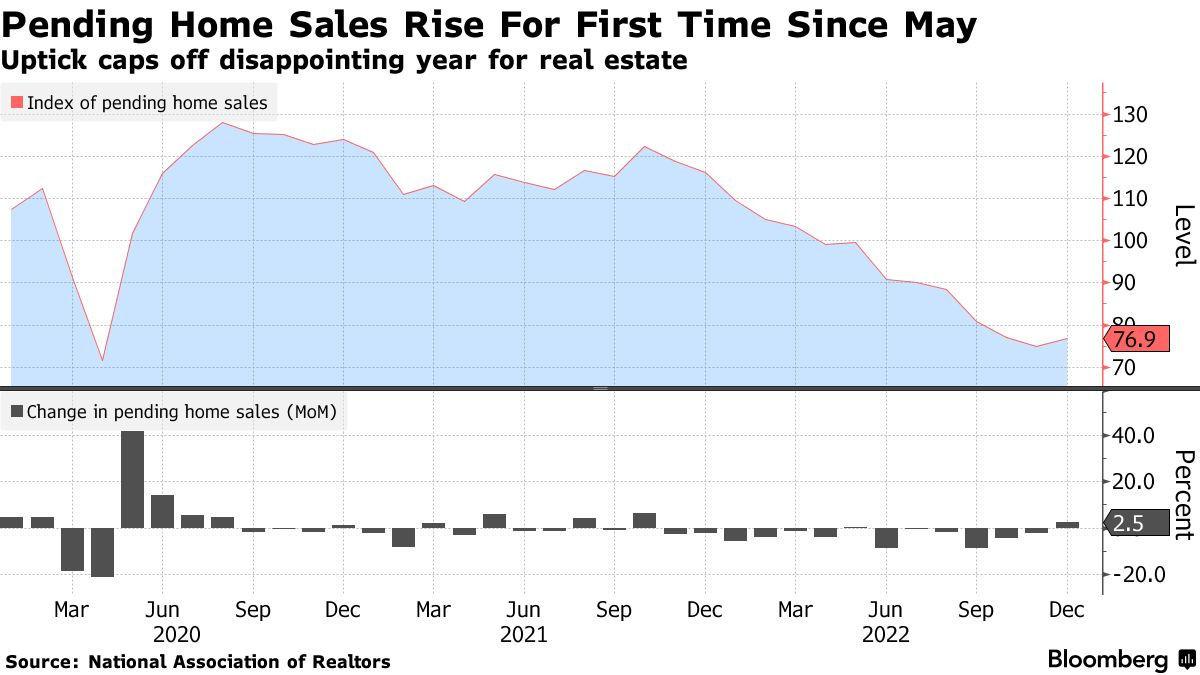
Pending home sales improve +2.5% for the first time in last 7 months above expectations for another fall but y/y remain down -34%.

US Pending Home Sales (M/M): +2.5% (est -1.0%; prev R -2.6%)
- Pending Home Sales NSA (Y/Y) Dec: -34.3% (est -35.4%; prev R -37.7%)
Pending Home Sales (nar.realtor)
Existing home sales represent 90% of home sales in the US. Pending home sales are contract signings not actual transactions so a little more forward looking. Contract signings usually lead sales by about 45 to 60 days.
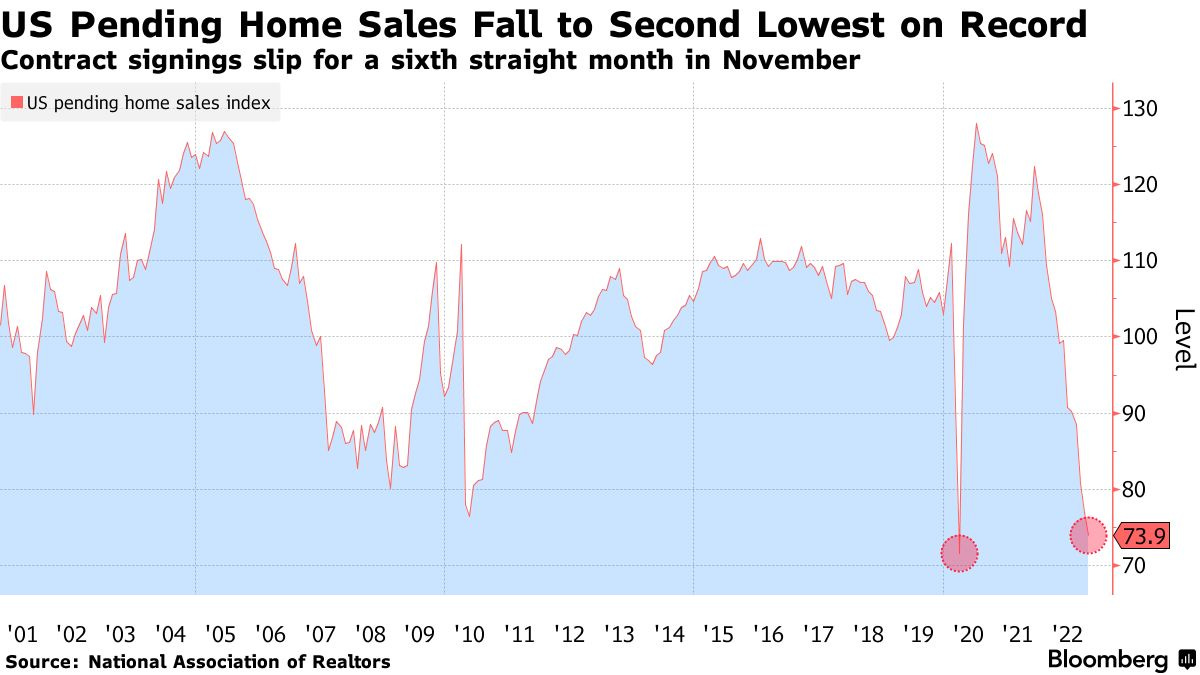
December pending home sales advanced for the first time following a sixth straight month string of declines (and advanced only for the second time in 2022), increasing by +2.5% m/m. The median estimate in a Bloomberg survey of economists called for a 1% decline. Y/y though sales were still down a jaw-dropping -33.8% (but that was an improvement after 37.7% y/y in November on a seasonally adjusted basis, the 19th month of negative y/y numbers (which as I’ve said since June I don’t see reversing until 2H2023 at the earliest). November was the second-lowest reading in the past 20 years (and the lowest in 20 years excluding the early days of the pandemic).
Here is some commentary from the report. In it NAR Chief Economist Lawrence Yun notes for a fifth consecutive month the point I have also made since early summer that home sales at this point are inextricably tied to mortgage rates (which I thought might bode positively for November sales, but did not, but did in December). Last month he saw an “inevitable” rebound in coming months. Emphasis added.
“This recent low point in home sales activity is likely over,” said NAR Chief Economist Lawrence Yun. “Mortgage rates are the dominant factor driving home sales, and recent declines in rates are clearly helping to stabilize the market.”
“The new normal for mortgage rates will likely be in the 5.5% to 6.5% range,” Yun added. “Job gains will steadily become important in driving local home-sales markets. The South, in particular, is set to outperform the rest of the country, thanks primarily to better job market conditions in this part of the country compared to other regions.”
Contract signings still fell in two of four regions. All regions are down at least -30% y/y.
The Northeast PHSI dropped 6.5% from last month to 64.7, a decrease of 32.5% from December 2021.
The Midwest index shrank 0.3% to 77.6 in December, a decline of 30.1% from one year ago.
The South PHSI rose 6.1% to 94.1 in December, dropping 34.5% from the prior year.
The West index advanced 6.4% in December to 58.6, decreasing 37.5% from December 2021.
Note on index composition: *The Pending Home Sales Index is a leading indicator for the housing sector, based on pending sales of existing homes. A sale is listed as pending when the contract has been signed but the transaction has not closed, though the sale usually is finalized within one or two months of signing. Pending contracts are good early indicators of upcoming sales closings. However, the amount of time between pending contracts and completed sales are not identical for all home sales. Variations in the length of the process from pending contract to closed sale can be caused by issues such as buyer difficulties with obtaining mortgage financing, home inspection problems, or appraisal issues. The index is based on a sample that covers about 40% of multiple listing service data each month. In developing the model for the index, it was demonstrated that the level of monthly sales-contract activity parallels the level of closed existing-home sales in the following two months. An index of 100 is equal to the average level of contract activity during 2001, which was the first year to be examined. By coincidence, the volume of existing-home sales in 2001 fell within the range of 5.0 to 5.5 million, which is considered normal for the current U.S. population.
To subscribe to these summaries, click below.
To invite others to check it out,
To see more content, including summaries of most major U.S. economic reports and my morning and nightly updates go to Neil’s Newsletter Substack for newer posts or https://sethiassociates.blogspot.com for the full history. You can also follow me on Twitter @NeilKSethi