

US Personal Spending Dec: -0.2% (est -0.1%; prev 0.1%); US Personal Income Dec: 0.2% (est 0.2%; prev 0.4%); US PCE Deflator (M/M) Dec: 0.1% (est 0.0%; prev 0.1%)
US Personal Spending Dec: -0.2% (est -0.1%; prev 0.1%); US Personal Income Dec: 0.2% (est 0.2%; prev 0.4%); US PCE Deflator (M/M) Dec: 0.1% (est 0.0%; prev 0.1%)
Dec personal spending came in a touch weak on big drops in gasoline and autos, income and prices basically in-line

US Personal Spending Dec: -0.2% (est -0.1%; prev 0.1%)
US Personal Income Dec: 0.2% (est 0.2%; prev 0.4%)
US PCE Deflator (M/M) Dec: 0.1% (est 0.0%; prev 0.1%)
- US PCE Deflator (Y/Y) Dec: 5.0% (est 5.0%; prev 5.5%)
-US PCE Core Deflator (M/M) Dec: 0.3% (est 0.3%; prev 0.2%)
- US PCE Core Deflator (Y/Y) Dec: 4.4% (est 4.4%; prev 4.7%)
Personal Income | U.S. Bureau of Economic Analysis (BEA)
This is an important report, and one of the few that is a wholistic look at incomes, spending, and prices. It also includes the Fed’s preferred inflation indicator (PCE prices). All changes m/m unless noted.

Personal Income
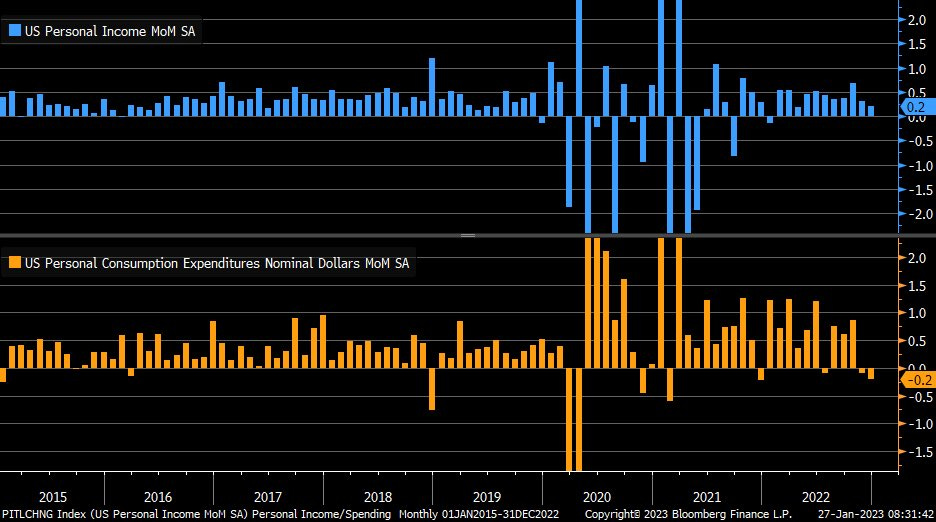
Nominal personal income increased for the eleventh consecutive month in December, decelerating +0.2% from to +0.3% in November (and the recent high of +0.8% in October). This was in line with estimates. With PCE prices (discussed below) remaining at +0.1%, real income (inflation adjusted) came in positive for a seventh consecutive month at +0.2%.
Looking at the details, after October and November broke a six month streak of every category other than government transfer payments being up or flat, (October saw proprietor’s income fall and November saw that and dividend income fall), December like October saw only one category, in this case dividend income, decline (-0.9%). Employee compensation decelerated to +0.3%, matching November, which was revised down from +0.5% (and October was revised down a tenth to +0.4%), again with service wages driving the gains (something the Fed will note, although they also should note the slowing in wages in general with downward revisions to prior months). It was the 22nd straight month of gains for compensation. For a second month interest income (+1.0%) and rental income (+0.8%) led gains. Disposable personal income (after taxes, not adjusted for inflation) was up +0.3%, the same as November (which was revised down a tenth). Adjusted for inflation (real) it was up +0.2% and is now -1.7% y/y (improved from -2.3% in November, -2.8% in October, -3.3% in September and -4.7% in August).
From the report:
In December, personal income increased, primarily reflecting increases in compensation and proprietors’ income.
• Within compensation, the increase primarily reflected an increase in private wages and salaries, based on data from the Bureau of Labor Statistics’ Current Employment Statistics. The increase reflected increases of $22.7 billion in services-producing industries and $2.9 billion in goods-producing industries.
• Within proprietors’ income, an increase in nonfarm income was partly offset by a decrease in farm income.
Personal Spending
Nominal (not inflation adjusted) personal spending fell the second month in a row in December, after declining only once previously in 2022, falling -0.2% after -0.1% in November (revised down from +0.1%), a big drop from October’s very hot +0.8% gain (the largest of 2022, although revised down a tenth). That was a tenth of a percent below expectations. Real (inflation adjusted) spending likewise declined for a second straight month to -0.3% from -0.2% in November. Real headline spending was up +2.2% y/y, though, the highest since August (2.3%).
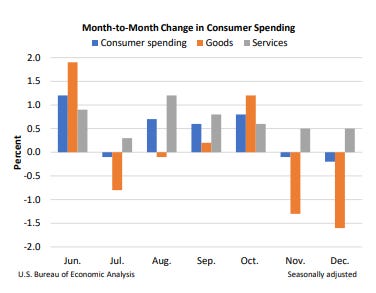
Looking at the details, goods spending fell for a second straight month (and fourth in the last six) falling by -1.6% after -1.3% in November (with durables -1.9% (on a big drop in auto spending)) and non-durables -1.4% (on a big drop in gasoline (although interestingly in real terms gasoline saw an increase))).
Services spending though stayed positive increasing +0.5% for a second straight month after a two tenths downward revision to November (down though from +0.6% in October, +0.8% in September and +1.2% in August). In real terms (table 7), inflation-adjusted services expenditures were flat, the least in at least six month, while goods were down -0.9% matching November. Y/y those are +3.3% and +0.2% respectively.
Bloomberg noted:
The report showed a pullback in discretionary spending, particularly on categories like restaurants and hotel stays, although air transportation increased. On the goods side, purchases on apparel and footwear dropped in addition to autos.
From the report:
Personal outlays decreased in December, reflecting a decrease in consumer spending for goods that was partly offset by an increase in consumer spending for services.
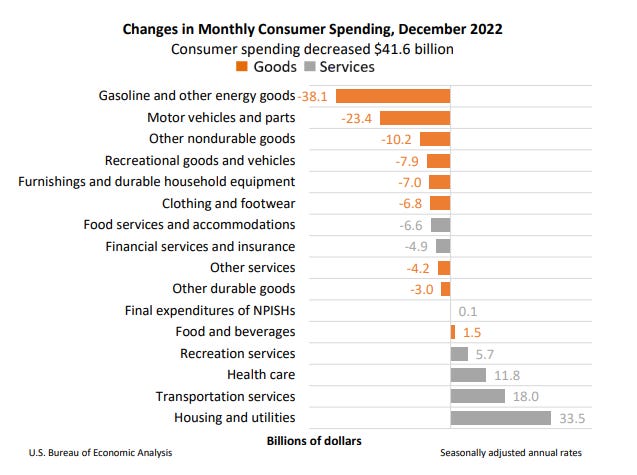
Within goods, the largest contributors to the decrease were gasoline and other energy goods (led by motor vehicle fuels, lubricants, and fluids), based on Energy Information Administration data, and motor vehicles and parts (led by new light trucks), based on unit sales data from Wards Intelligence.
Within services, the largest contributors to the increase were housing and utilities (led by housing), transportation (led by air transportation, based on Transportation Security Administration data), and health care (led by hospitals, based on patient volume data).
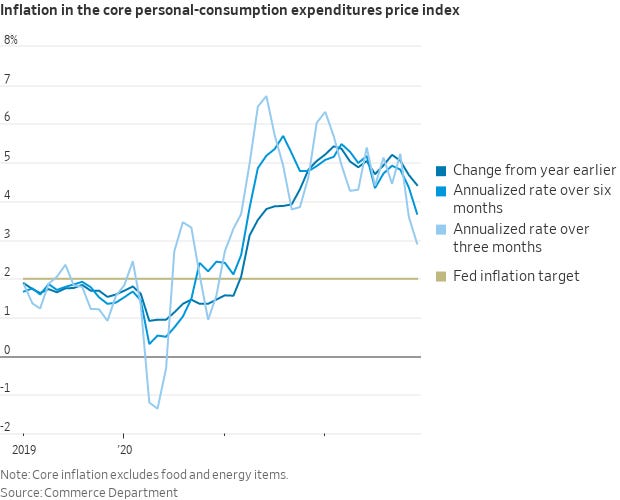
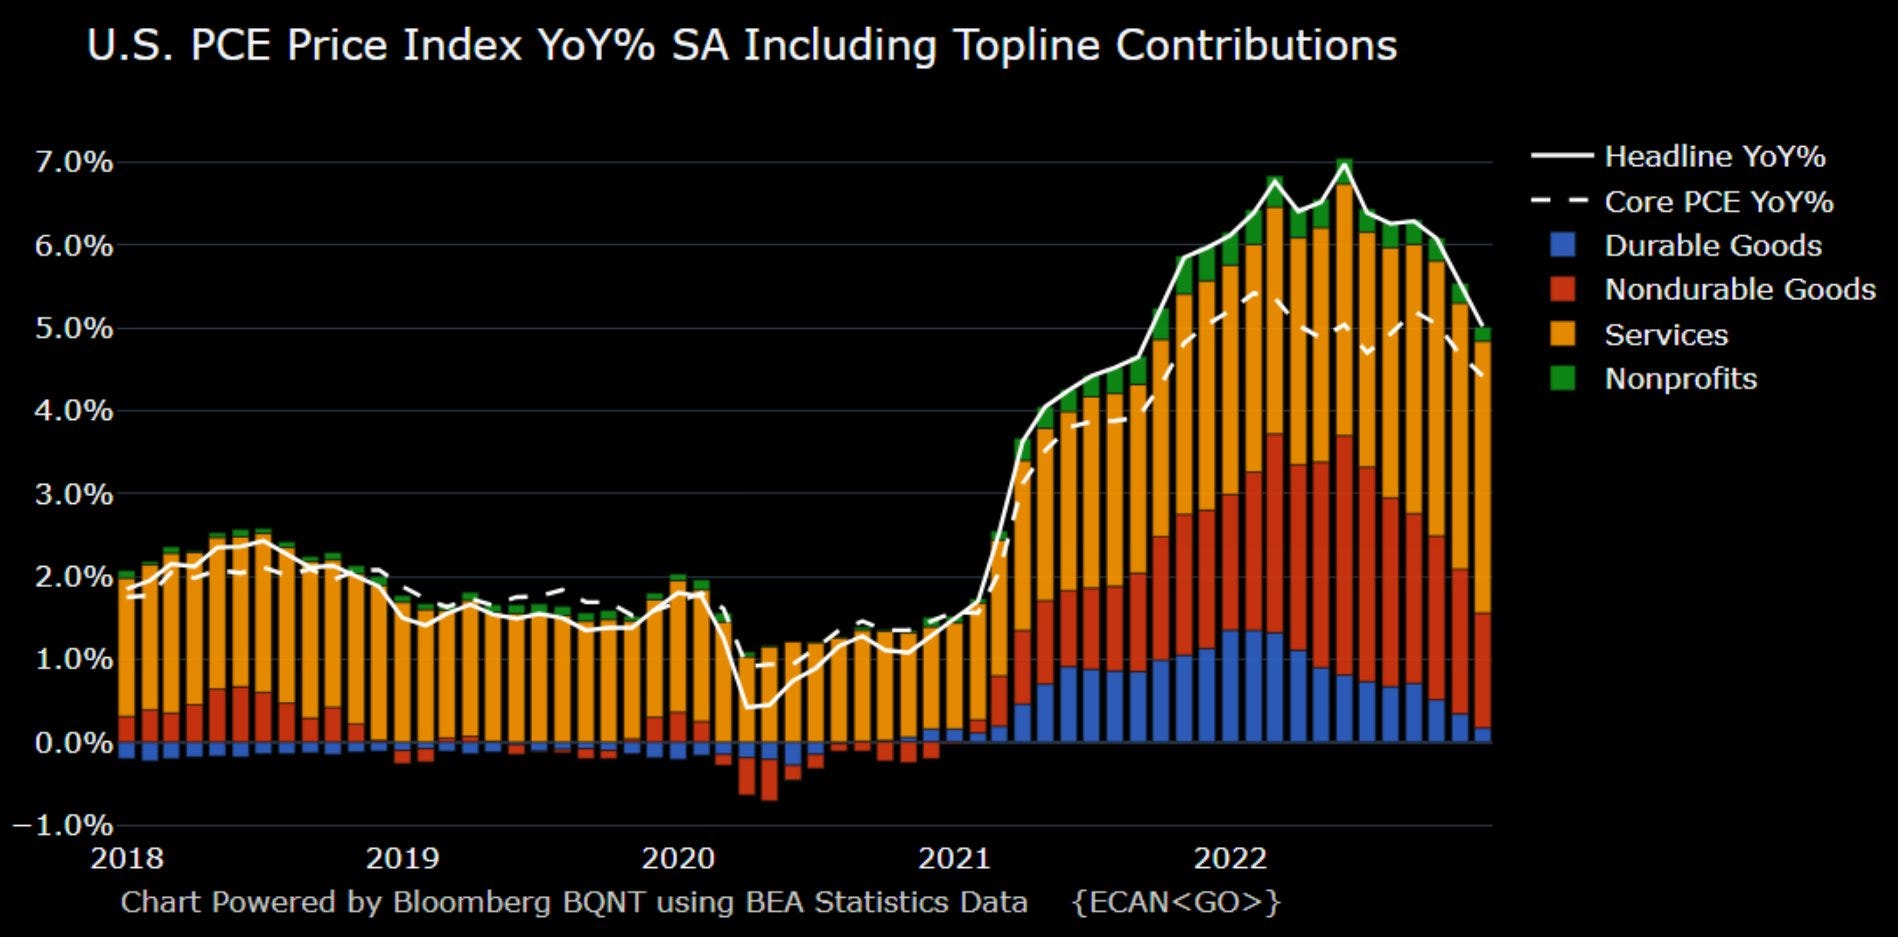
PCE - Headline PCE prices increased by +0.1% m/m in December for a second month a tenth higher than Bloomberg expectations. Services prices, which represent the majority of the price basket, increased by +0.5% the most since +0.6% in August and September while goods prices, declined for the fifth time in six months (-0.7%) led by a decline in durables (-0.3% after -0.8% in November) while non-durables prices fell -1.0% after -0.1% in November due in part to falling energy prices. Food prices importantly moderated for a fifth month from the 1.3% read in July coming in at +0.2%, the lowest in over a year, while energy prices, fell for the fifth time in six months by -5.1% m/m the most since August.
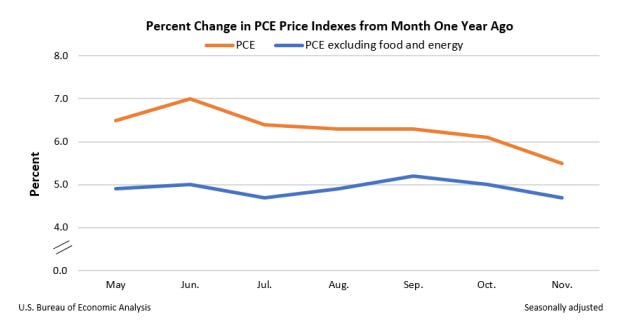
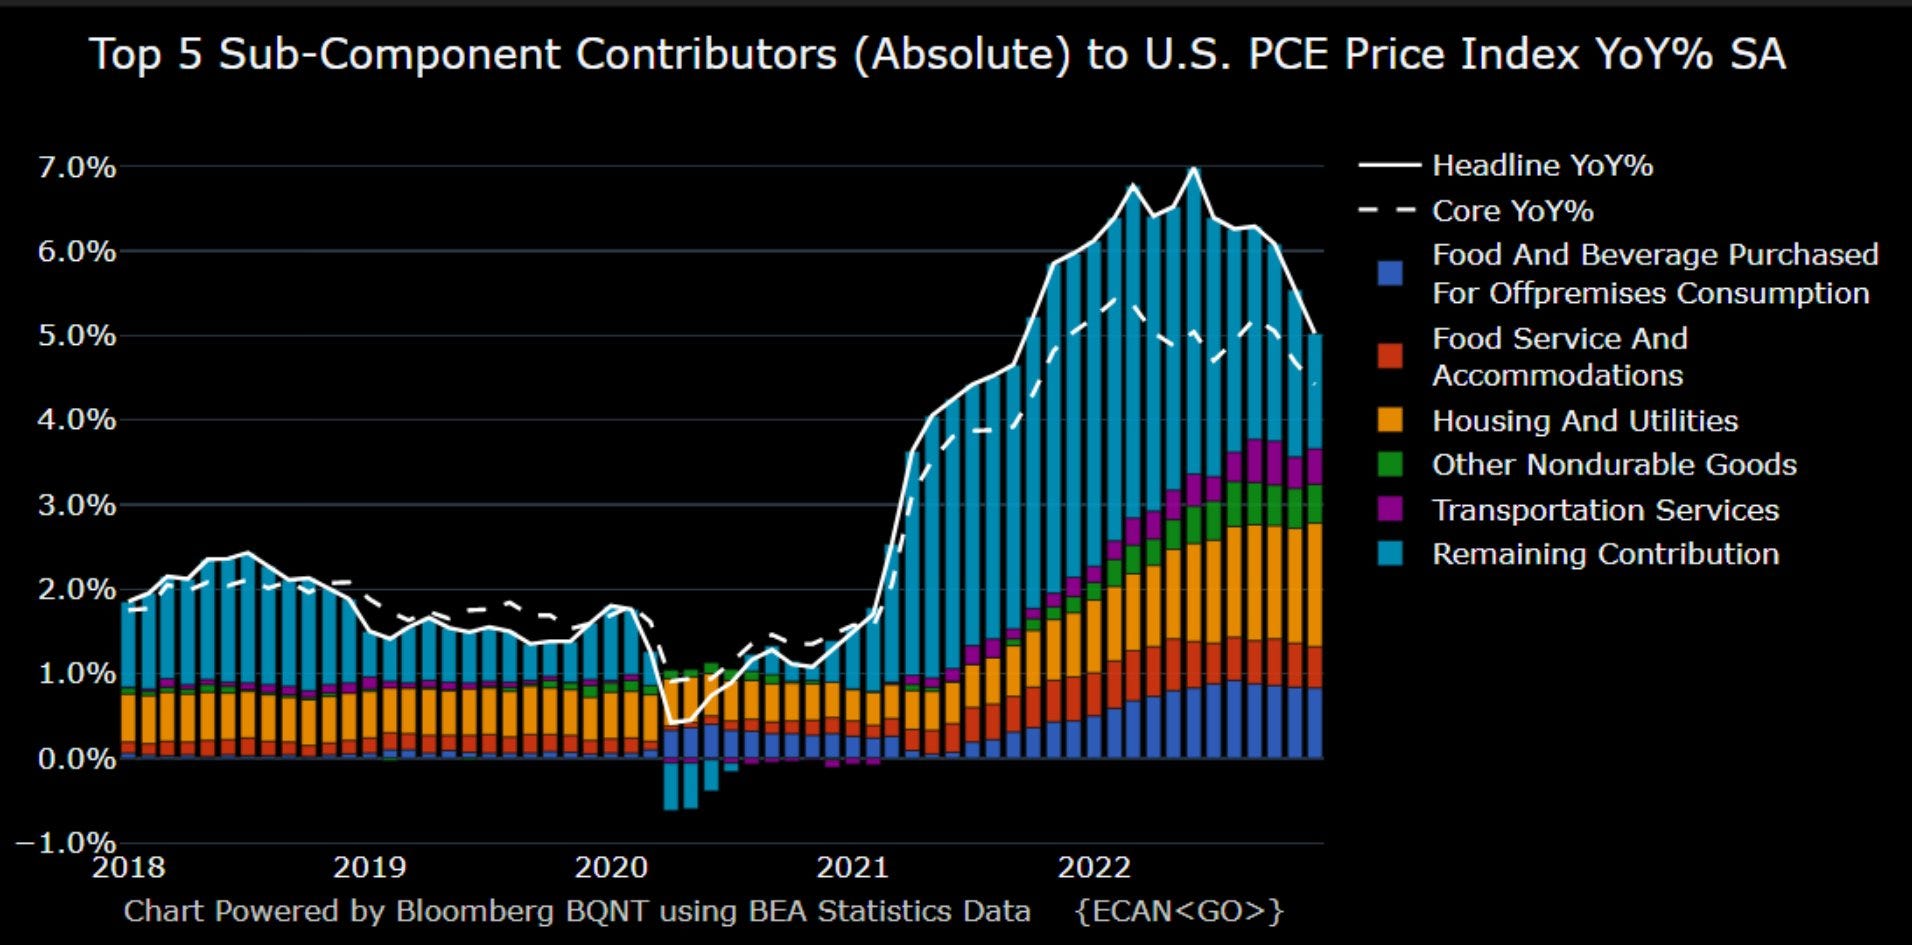
Headline prices y/y came in as expected at 5.0% (down from 5.5% in November, 6.1% in October and the peak 7% in June) which was the lowest print since late 2021. Y/y goods prices are up 4.6% (driven by non-durables, which includes gasoline, (+6.5%)), but that is down from 10.6% in June. Durable goods are now up just 1.4% y/y. Services prices are up 5.2% y/y (the same as November, but down from 5.5% in October, which was (hopefully) the peak). Energy is up just 6.9% y/y (down from 137% in November, 18.4% in October and 43.6% in June), and food is up 11.2% (same as November, but down from 11.6% in October and 13.2% in June).
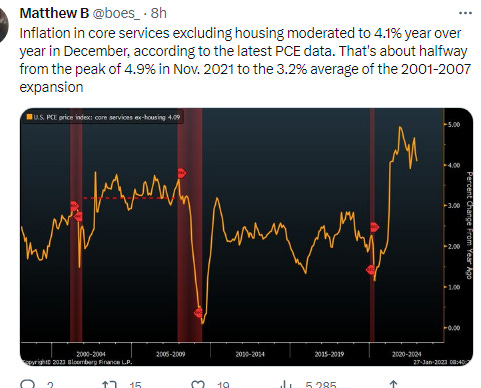
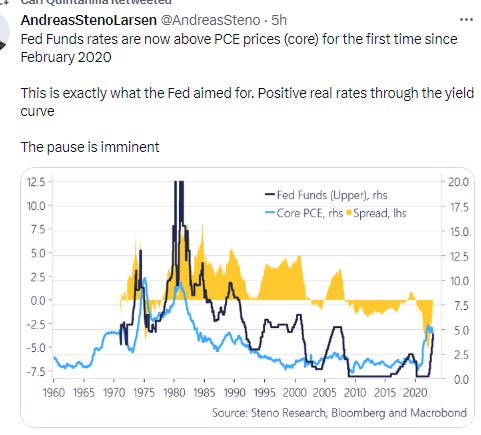
Core prices (excluding food and energy), the Fed's "preferred" inflation metric, also came in as expected at +0.3% up a tenth from November but remaining well below the +0.6% in August. This brought down the core y/y number to 4.4% from 4.7% in November, 5.1% in October, and the peak 5.2% in September. Price growth in services excluding energy and housing, a metric that has been noted by several Fed members including Jerome Powell, ticked up slightly though to 0.32% last month, according to Bloomberg calculations.
m/m charts
y/y
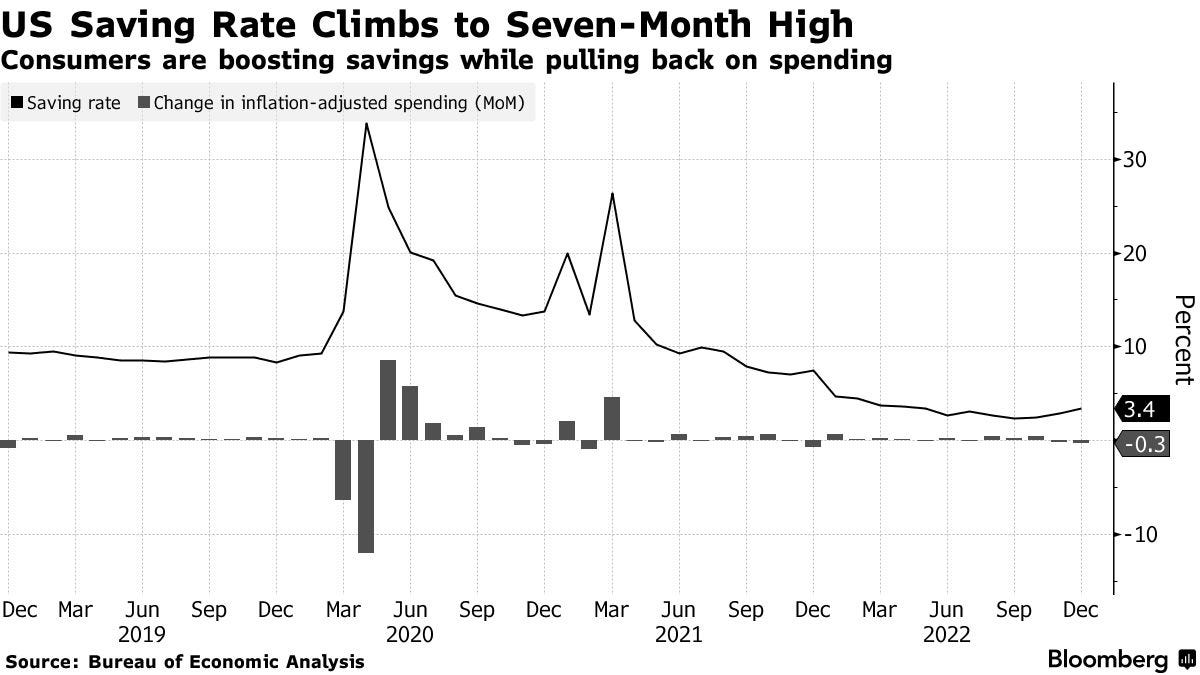
Personal savings - The savings rate which has been a big a sore spot, showed improvement for a second month moving to 3.4% from 2.4% in November from 2.2% in October (which was the lowest since 2005). It was the biggest monthly increase since July 2021, the Commerce Department report showed.
So, overall, a mixed report. Perhaps most importantly prices continue to moderate in general. And the deceleration was enough to keep real incomes in positive territory with compensation remaining healthy, but as noted clearly decelerating (something the Fed will like). And the tick up in the savings rate is great to see (the Fed will like that as well). On the negative side though real spending declined for a second month due to the continued moderation in goods spending, but even with services there is clear deceleration from the summer (although on a positive note it evidences the fact that increased real wages aren’t necessarily leading to increased real consumption a concern of the Fed’s). It seems that the consumer is running out of steam, although many said that a year ago as well.
More concerningly, as we’ve seen in the CPI report as well, services inflation remains sticky (this report annualizes to 6.0% services inflation, and the super core services metric noted above annualizes to 3.84%), something that I’m sure the Fed is watching. At least it has moderated somewhat from the highs. And hopefully they take some heart in the continued decline in more tame core number (which over the past three months annualizes to 3.2%), although it remains too high for their taste I’m sure. As I noted three months ago:
The only way to avoid a recession seems to be if that core number can start to quickly moderate before incomes and spending crack. I guess you can always hope right?
Here was Bloomberg’s take:
“Despite a soft headline print for December’s personal consumption expenditure deflator, inflation remains heady in core services excluding housing rents... The lack of evidence that the durable inflation component is moderating means Powell will maintain his hawkish message of holding rates higher for longer.”
— Anna Wong, economist
Some other tweets/comments:
From ING:
Core PCE deflator set to slow as corporate pricing power weakens

Source: Macrobond, ING
In terms of the outlook we expect to see this measure of inflation falling sharply through the second and third quarters. It won’t be as rapid as the core CPI declines given the different weighting of shelter costs and vehicle prices, but we still see it in a 2-2.5% range by year-end. As the chart above shows, corporate pricing power is apparently weakening rapidly with the National Federation of Independent Businesses reporting a steep drop in the proportion of businesses expecting to be able to raise their prices in the months ahead. If the relationship with the core PCE deflator continues to hold and recessionary forces continue to intensify then the Fed will be cutting rates in the second half of the year.
To subscribe to these summaries, click below.
To invite others to check it out,
To see more content, including summaries of most major U.S. economic reports and my morning and nightly updates go to Neil’s Newsletter Substack. You can also follow me on Twitter @NeilKSethi