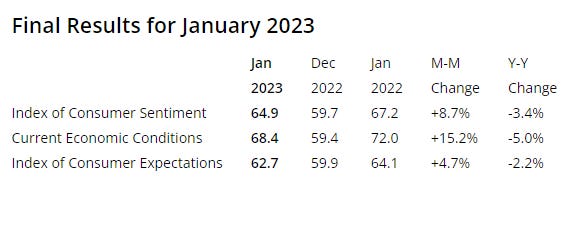
The final read of the University of Michigan’s consumer sentiment index for January came in at a nine-month high, three tenths above the preliminary read which had shown a big improvement from the final December read (which in itself was the fifth month of improvement in the last six months from the all-time low recorded in June). The headline index moved to 64.9, 9%, above the final December read of 59.7. It was 67.2 a year ago, making this the closest to year ago levels (-3%) we have been in at least a year as we lap the cratering in this index that occurred in 2022. The initial read was above every estimate in a Bloomberg survey of economists.
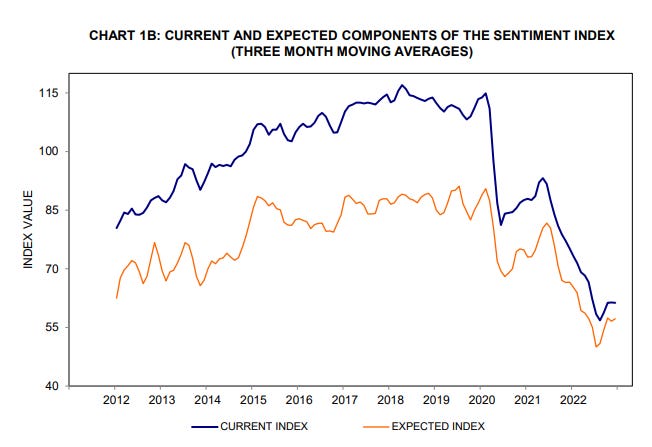
The improvement in the headline number over December was due to improvement in both of its constituent components, but mostly present conditions. The present conditions index jumped 15.5% to 68.6 from 59.4 in the January preliminary read (the highest in nine months), and eased back two tenths to 68.4 in the final read, while the expectations component which had improved to 62.0 from 59.9 in December (also the highest in nine months), moved to 62.7 in the final read for January which now makes it the highest in a year. These compare with 72.0 (current conditions) and 64.1 (expectations) a year ago.
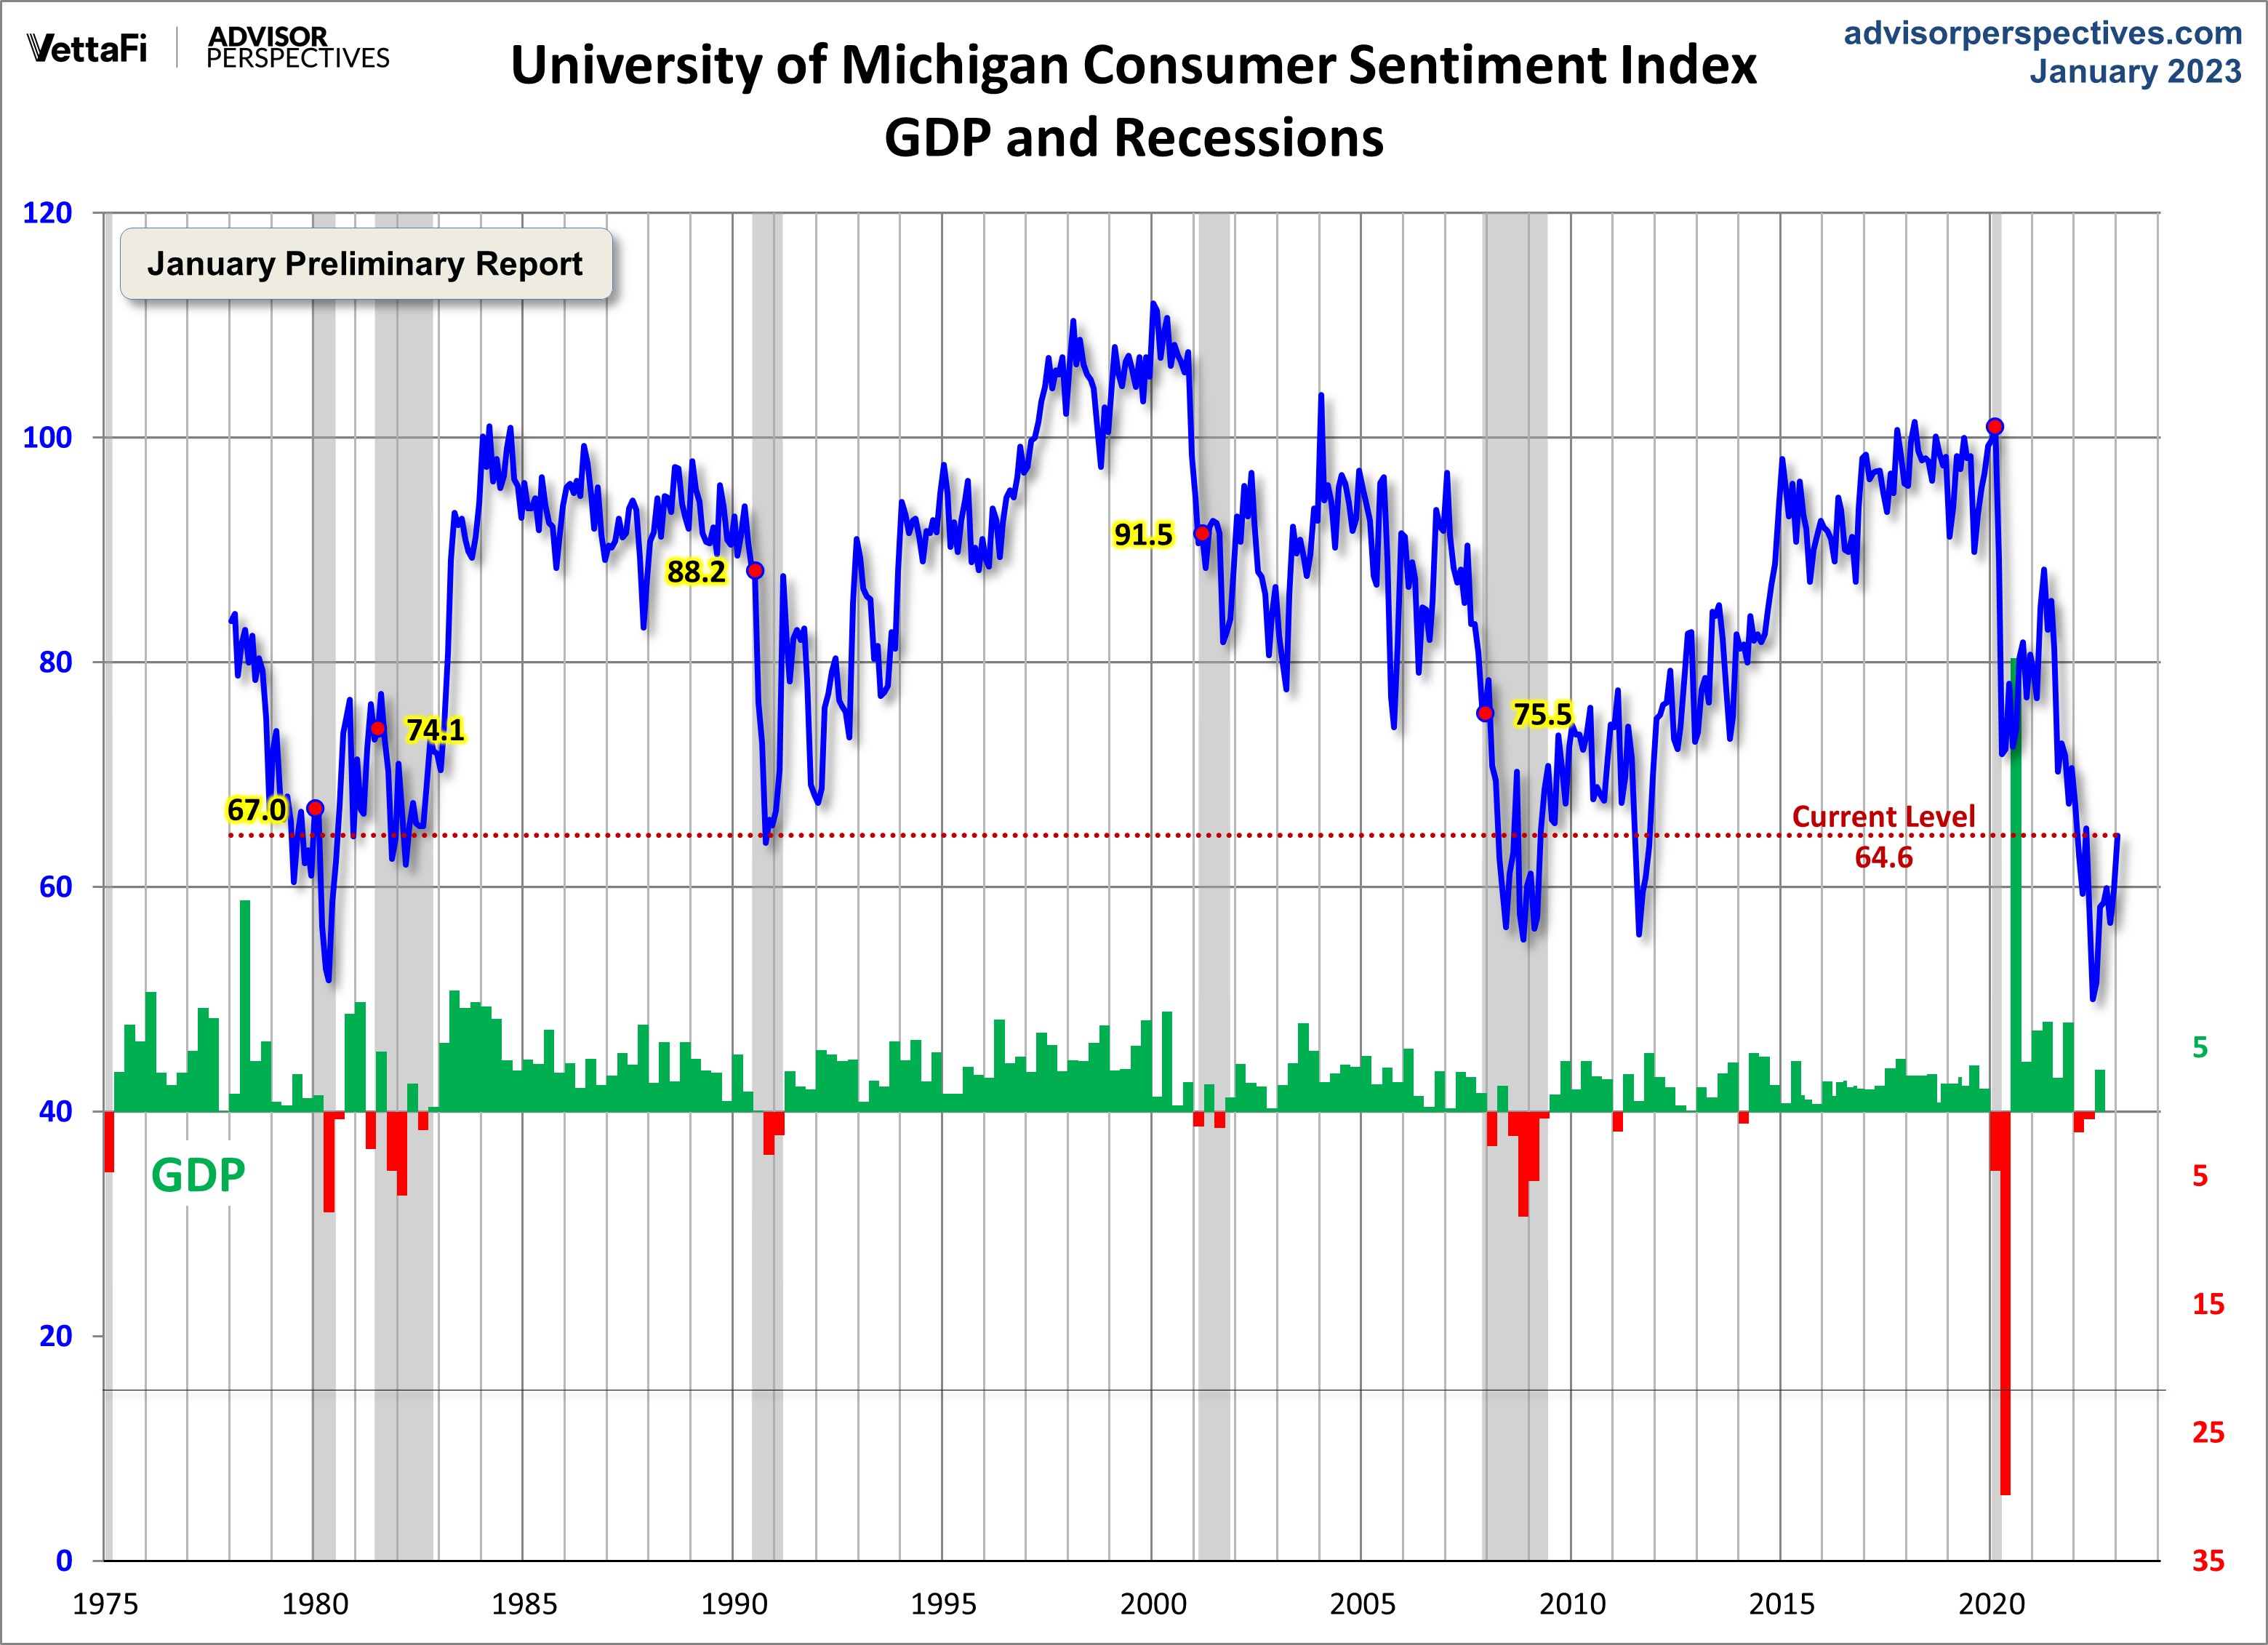
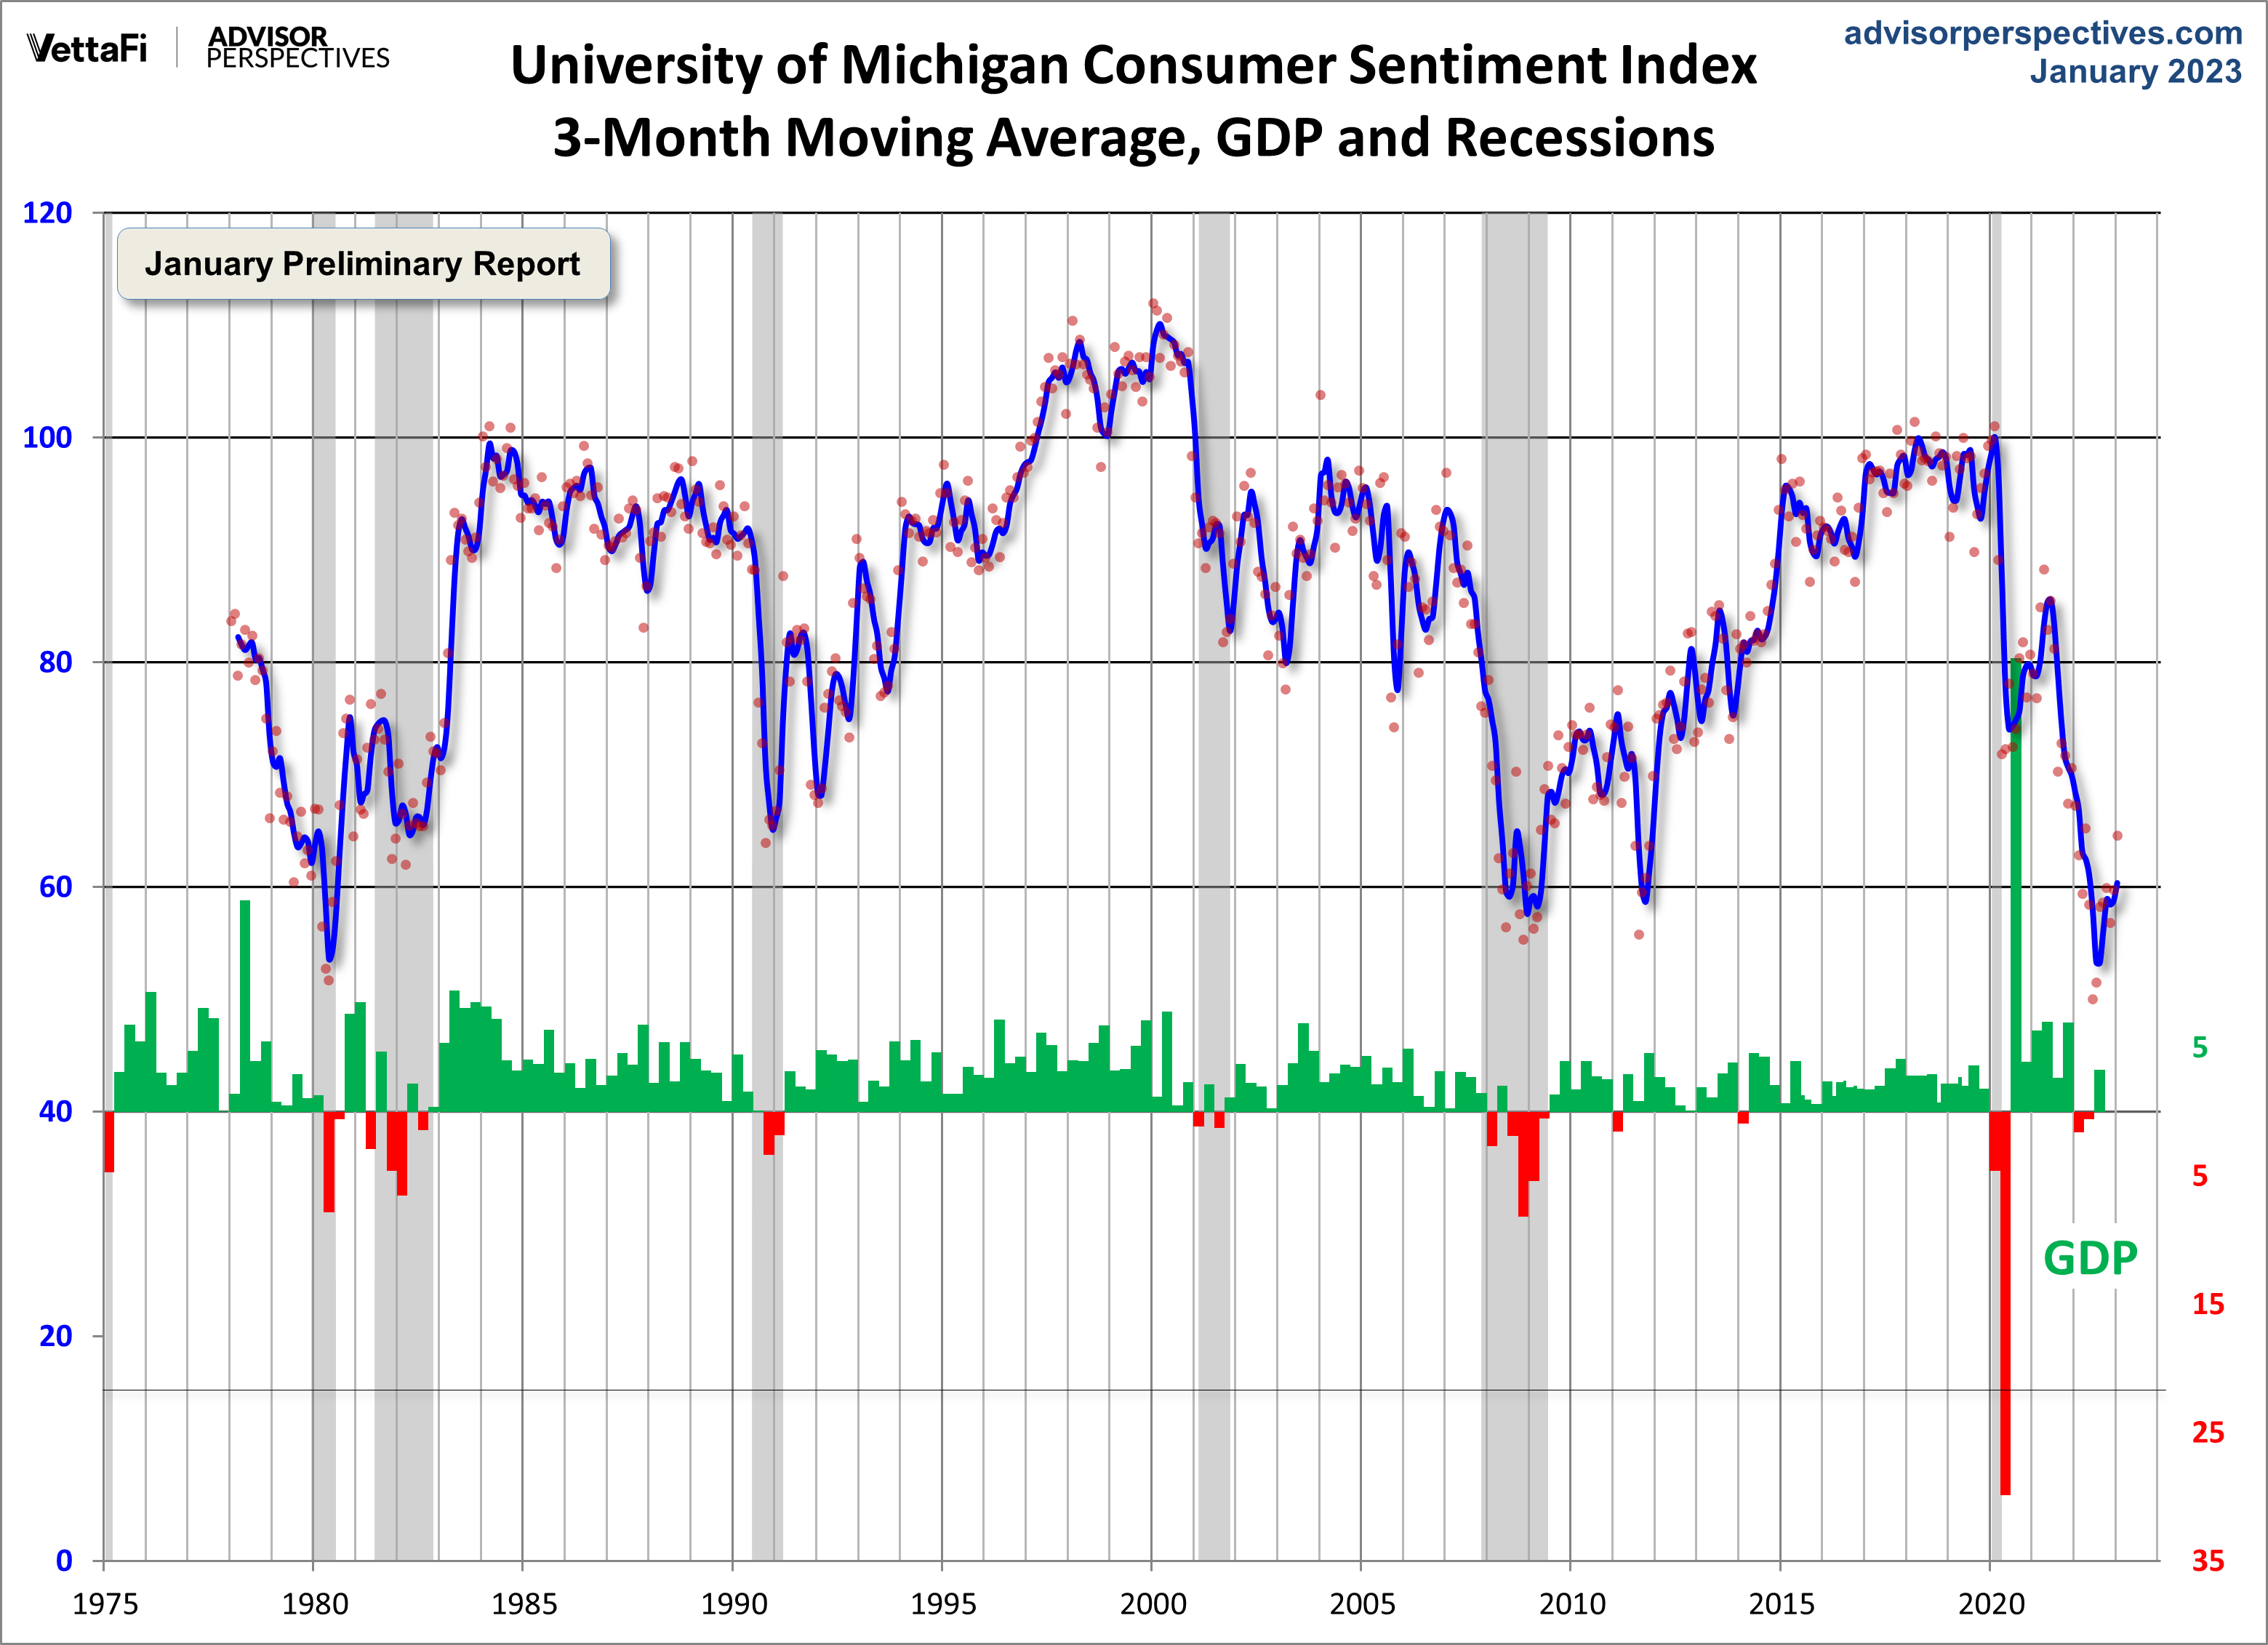
Despite the big jump, as noted in the preliminary report, the headline reading was still just in the 8th percentile of historical readings (although up from 3rd percentile in December), as Advisor’s Perspective noted:
To put today's report into the larger historical context since its beginning in 1978, consumer sentiment is 24 percent below the average reading (arithmetic mean) and 23 percent below the geometric mean. The current index level is at the 8th percentile of the 541 monthly data points in this series.
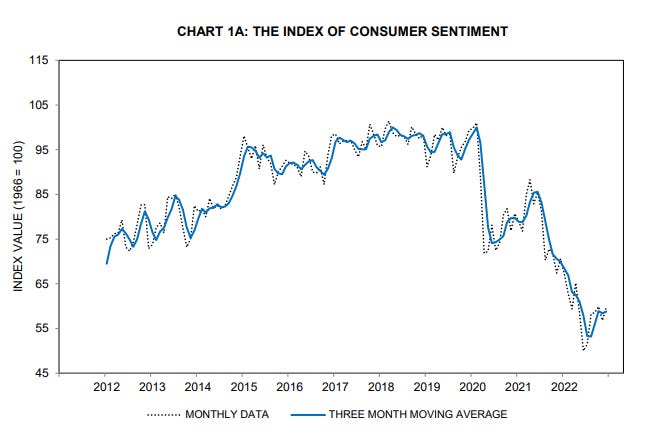
They also provide a 3-month moving average along with recessions. Clearly it’s still in territory that in the past has indicated a recession.
So overall good news on the sentiment front in terms of improvement although still “remaining low from a historical perspective” as Surveys of Consumers Director Joanne Hsu put it. As Bloomberg noted:
The university’s gauge of current personal finances rose 16% to an eight-month high, while expectations climbed to the highest in a year on the basis of higher incomes and easing inflation. A majority of respondents said they anticipate their incomes to rise at least as fast as prices in the year ahead, the most since October 2021.
In terms of expectations, the short run (next 1-year) outlook ended up unchanged in the final read, but the survey noted
all other components of the index increased in January. The current conditions index soared 15% above December, with improving assessments of both personal finances and buying conditions for durables, supported by strong incomes and easing price pressures.
Still, the report noted that recession risks remain and are one of the factors restraining consumer sentiment, as does the debt ceiling.
That said, there are considerable downside risks to sentiment, with two-thirds of consumers expecting an economic downturn during the next year. Notably, the debt ceiling debate looms ahead and could reverse the gains seen over the last several months; past debt ceiling crises in 2011 and 2013 prompted steep declines in consumer confidence.
In the preliminary report, though, Ms. Hsu noted that “given current historic lows in unemployment and strength in expected incomes, a gradual slowdown in spending appears more likely than a cliff-like drop,” she said
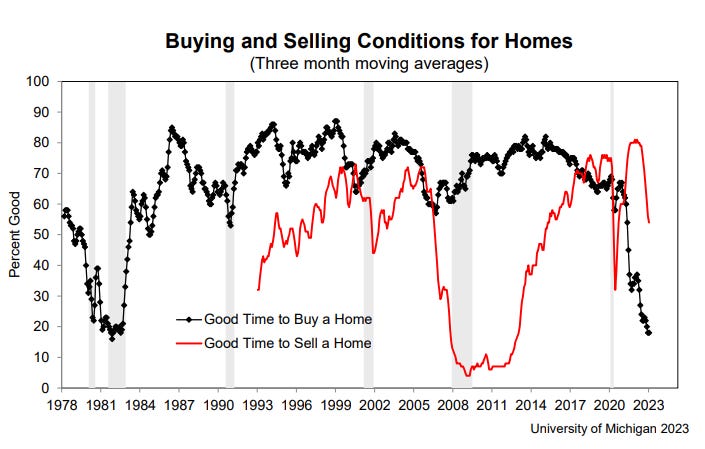
In that regard, buying conditions for large household goods also improved, though consumers noted higher borrowing costs, but views of the housing market continued to deteriorate amid high borrowing costs.
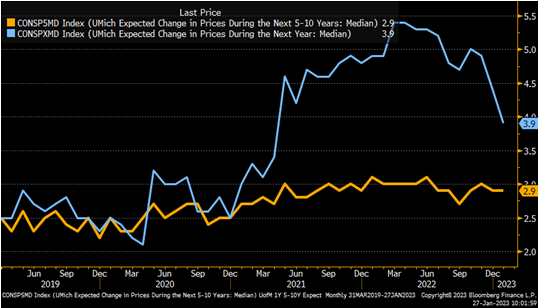
Turning to what has been the bigger news in this report since June of last year when they were mentioned by Jerome Powell at the June press conference as a reason for the bigger (75 bps) rate hike, inflation expectations, there was positive news as well.. Longer term (5-10 year) inflation expectations which had increased one tenth to 3.0% in the preliminary report fell back to 2.9%, keeping it at the low end of the 2.9-3.1% range we’ve been at most of the past 18 months, although as the report noted they remain elevated versus pre-pandemic levels:
Long-run inflation expectations remained at 2.9%, yet again staying within the narrow 2.9-3.1% range for 17 of the last 18 months and remaining elevated relative to the 2.2-2.6% range seen in the two years pre-pandemic.
One-year ahead inflation expectations, which had been at a four-decade high of 5.4% in that June preliminary report that spooked Powell, continued to decline coming in at 3.9%, the lowest since April 2021 (and down from 4.0% in the preliminary report, 4.4% in December and 4.9% in November). These though also remain well above pre-pandemic levels:
Year-ahead inflation expectations receded for the fourth straight month, falling to 3.9% in January from 4.4% in December. The current reading is the lowest since April 2021 but remains well above the 2.3-3.0% range seen in the two years prior to the pandemic.
Ms. Hsu also noted:
Consumers continued to exhibit considerable uncertainty over both long and short-term inflation expectations, indicating the tentative nature of any declines.
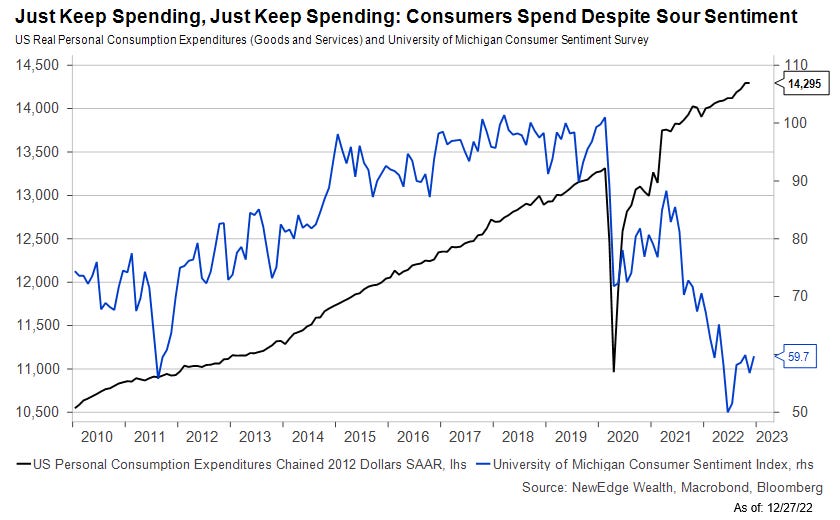
So, overall, my normal caveat is that I’ve never seen any clear evidence that consumer confidence is actually predictive of anything other than elections. If you don’t believe me here’s a chart going back to 2010 of consumer confidence vs personal spending expenditures.
That said, it does give some indication as to what’s happening with consumers, which is that consumer sentiment has continued to improve boosted by falling inflation/gas prices, but also a still robust labor market and income prospects. As I have said the last couple of months:
A solid report in terms of trends, but there’s a ways to go before things get to where we want them to be.
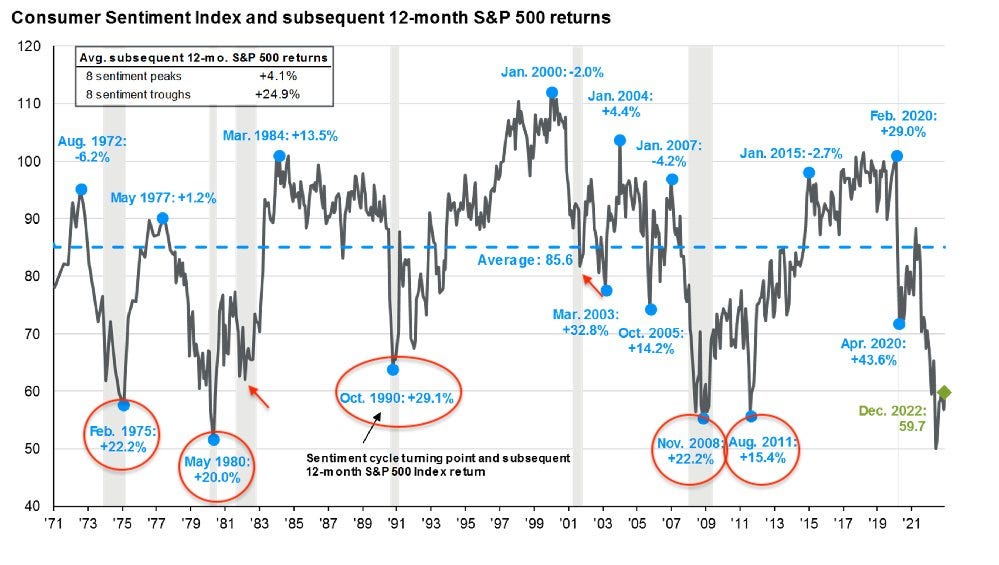
And FWIW came across this chart from JPM on 12-mos returns from sentiment bottoms in this index. Not bad.
The following is from October, but I will leave it in going forward to provide some overall context to the above.
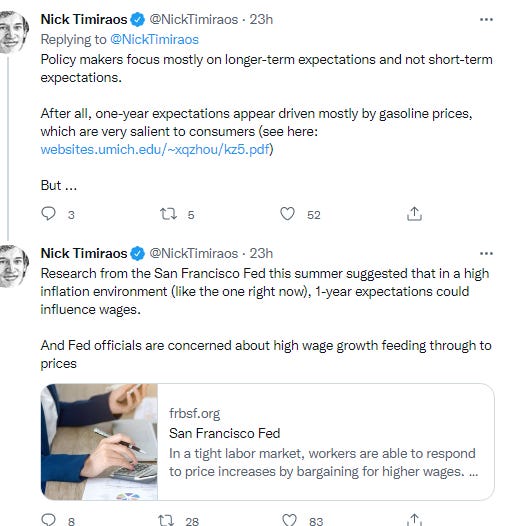
As I noted above 1-year inflation expectations have been shown to mostly track gasoline prices (see first tweet below where they found they explained 42% of variation), but “research from the San Francisco Fed this summer suggested that in a high inflation environment (like the one right now), 1-year expectations could also influence wages”. This in part explains why as unreliable as they may be they are focused on by the Fed.
Separately as I started noting in June of this year, it’s important to put the inflation expectations numbers into some context:
I’ll reserve my own opinions, but a Bloomberg article made some very good points about why we might want to take the inflation expectations from this report with a grain of salt. I thought this paragraph was particularly interesting:
Consider the way that consumer inflation surveys actually work. In the University of Michigan’s case, it dials a series of mobile phone numbers and asks at least 500 people questions, including: “By about what percent per year do you expect prices to go (up/down) on the average, during the next 5 to 10 years?” … Respondents gravitate to numbers with multiples of five, and a non-negligible group of participants give answers of 20% and higher. If you give an estimate above 5%, the survey team is instructed to subtly nudge respondents with another prompt: “Let me make sure I have that correct,” they must say. “You said that you expect prices to go (up/down) during the next 12 months by (x) percent. Is that correct?” The respondents sometimes change their answers. … As Morgan Stanley pointed out in a recent note, the Michigan survey on long-term inflation expectations basically tends to follow a five-year moving average of the consumer price index.
To see more content, including summaries of most major U.S. economic reports and my morning and nightly updates go to Neil’s Newsletter Substack for newer posts or https://sethiassociates.blogspot.com for the full history. You can also follow me on Twitter at @NeilKSethi