This week was again more hectic than I had thought (perhaps I should just expect it), so I again got to as much as I had time for. As usual, it was a bit of a scramble to get this out, with no time to do a full edit. Apologize for any typos, etc.
If you're a new reader or maybe one who doesn’t make it to the end feel free to take a second to subscribe now. Subscriptions help validate spending the time to create these.
Also please note that I do often add to or tweak this after first publishing it, so it’s always best not to go off the emailed version but to read it from the website where it will have any updates.
Recap
Here was my recap from Friday’s report:
As noted in the weekend update (which is much more in depth than the quick summaries, I encourage you to check it out if you haven’t), there’s reasons to be bullish this week (technicals, breadth, systematic flows), but also reasons to be bearish (overbought conditions, technical resistance), and some wildcards (data, global events, Fedspeak, and earnings).
So, overall, as I started saying two weeks ago,
the consensus for 2023 is a poor first half with a better second half. Makes me think it’s unlikely that’s what we get. One issue with the second half may be sticky or resurgent inflation. The combination of a resilient economy in the US, China reopening, Europe bouncing back (particularly if we get a cessation of Ukraine hostilities), etc., that pushes prices higher is one of my big fears for 2023. But on the other side it will be interesting to see if when shelter moderates to m/m declines if that along with continued goods disinflation doesn't overwhelm other factors leading to just the opposite - a deflationary environment. So suffice to say the year will definitely be tricky. As Tom Essaye, a former Merrill Lynch trader who founded The Sevens Report newsletter, noted
“Markets enter 2023 at important transition points. One path is paved with continued disinflation, resilient earnings, moderating growth, a balanced labor market, and higher stock and bond prices. The other path is paved with sticky inflation, slowing growth, a continued tight labor market and lower stock and bond prices. Data points at the start of the year will offer important clues as to which path the markets are taking.”
Last week we got a big dose of the former path, and markets liked it. Earnings will again be a big focus until we get to Wednesday, when we get a smorgasbord of data. The only one that will likely be market moving is retail sales, but you never know these days. Globally (at least on the schedule) there’s the Bank of Japan meeting which could lob some fireworks into global markets. We also do get a bunch of Fed speakers. My hypothesis is that they won’t carry the impact they once did. Again, we will see.
To me along with earnings, the bigger issues for the upcoming week are the technical resistance paired with a very overbought short term situation. Even though it appears systematic flows are picking up, I am not sure that will be enough to keep us from pulling back, and at some point a consolidation is going to be necessary. The key will be it finding some support and not turning into a larger decline. All of that said, I am definitely not ruling out a quick run to the 4100 level first.
And on Tuesday, consolidative action is what we saw with indices making minimal gains and losses with earnings reports a mixed bag. Still, for the SPX at least, now that it’s above a falling trendline and 200-DMA, sideways is the new up as it puts more distance between itself and those prior resistance now support levels (although, again, depending on how you draw that trendline, arguably the SPX was still beneath it Tuesday (definitely on Wednesday)). I noted in the Tuesday conclusion:
So a fairly muted day. Tomorrow we get a ton of data starting with the important retail sales report pre-market and going throughout the day (although it gets less important after 10 am). There’s also the BoJ meeting overnight (in the U.S.) which almost certainly will have some market implications irrespective of what they decide to do. Between that and continued earnings releases, tomorrow it’s a good bet we’ll move by more than a few tenths of a percent in one direction or the other.
And that (that we would move by more than a few tenths of a percent) proved accurate, but unfortunately it was in the “wrong” direction despite a big drop in yields as consistent with my thinking in the weekend update that the Fed will become less important than the economy/earnings, a trio of reports consistent with a weakening economy, as well as a Beige Book which also noted economic softness, gave the markets a recessionary vibe on Wednesday (bonds up, stocks down). As ING’s James Knightley put it, “Coming on the back of [a] poor retail sales report, [a weak industrial production report] reinforces the message that recession is on its way and we could in fact already be in it,” he said (I don’t really agree with that last part, but I do agree that today’s reports were very weak). The “good” news as ING also noted is that
Today’s numbers, coming after the softer CPI report, should cement expectations for a 25bp Federal Reserve interest rate hike in February and at the margin diminish the case for additional rate hikes – currently we expect a final 25bp in March. With recessionary forces intensifying and inflation looking less and less threatening, the prospects for Fed rate cuts later in the year are growing.
But even those hopes were set against hawkish Fedspeak with a number of speakers reiterating that further hikes were coming and cuts in 2023 were unlikely, giving a sort of worst of all worlds result (Fed staying restrictive into a weakening economy). The result was broad-based losses in equities and most other risk assets which took the SPX back under the 200-DMA and that widely watched trendline. It did find support at the 50-DMA though. I wrapped up with
So we move into a little less data-heavy day tomorrow (jobless claims and housing starts the key reports), but we get a lot of earnings. [T]oday was very weak. Hopefully it was just a one-day reset, but if the action continues, we’ll be breaking more support, and things could easily deteriorate from there. An unexpected big jump in jobless claims and/or poor earnings will be something I’ll be watching for (I think housing starts could basically do anything, and the market would shrug it off).
And unfortunately the market got started on the wrong foot Thursday with a number of unfavorable earnings reports, in particular a recessionary reserve build by Discover Financial which piled on the recession fears from Wednesday. But the data was actually relatively positive (jobless claims fell to the second-lowest since April, single family housing starts jumped 10%, and the Philly Fed manufacturing index came in above estimates). Unfortunately, that gave a lift to bond yields, as it meant a stronger economy for the Fed to lean against. As Heisenberg Report put it,
All in all, Thursday’s data was much less recessionary than Wednesday’s dour readings, which, in turn, makes the case for an incrementally more hawkish Fed. And around we go in the good-news-is-bad-news-is-good-news-unless-it’s-too-bad insanity loop.
Paired with the continued relieving of the overbought condition discussed at length last weekend, the result was another day of losses dropping the SPX to the 20-DMA as the next level of support. Daily technicals remain positive but are rolling over. I ended Thursday with:
So we move into an even less data-heavy day tomorrow (just existing home sales) and fewer earnings. The problem is momentum seems to be turning. The last two days have been very weak internally. The good news is the indices are still above good support, and the technicals have not rolled over to where a longer consolidation is “more likely than not”. That said, there isn’t a lot to get things moving back into the right direction again either. So most likely we’re setting up for a period of choppiness until we get a reset or a fresh catalyst to move us higher.
And I guess a big rally counts as “choppiness” although I’d be lying if I said I thought yesterday we would end the week back at the 200-DMA. But the one item I didn’t really take into account was options expiration (mostly because I didn’t have good information on it). My suspicion is that the max profit number for options makers was around the levels we ended at. It probably wasn’t exceedingly difficult to push up a Friday market on a non-newsy day (and with some relatively tame Fedspeak the last 24 hours) if that’s what big money was inclined to do. Might also have been aided by some profit taking on shorts ahead of the weekend. Whatever the reason, the market managed to get back much of what it lost the first three days. Notably this also occurred in the face of higher Treasury yields.
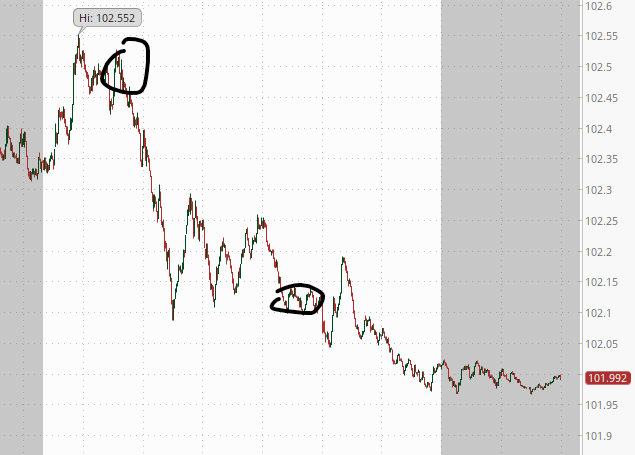
Dollar
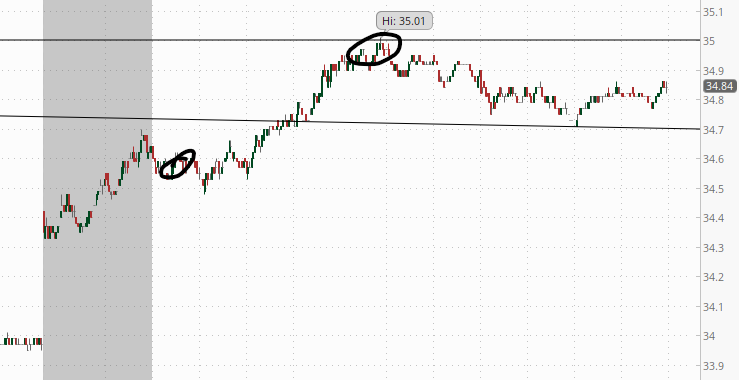
10-year yield
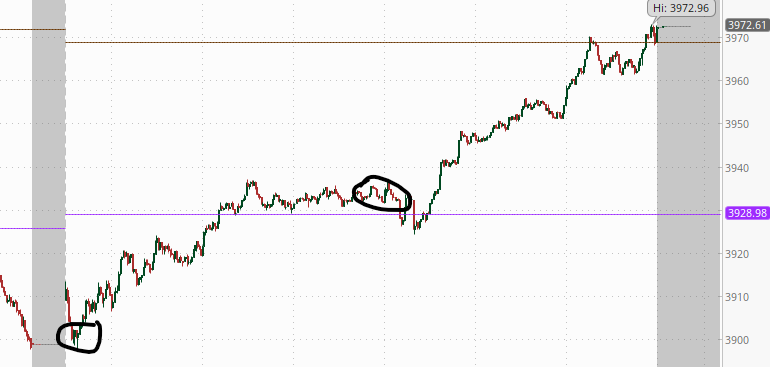
SPX
For the week: Dow -2.7% to 33,375. S&P 500 -0.7% to 3,973. Nasdaq +0.6% to 11,140. Russell 2000 -1.2% to 1,865.
Flows, Positioning, Etc.
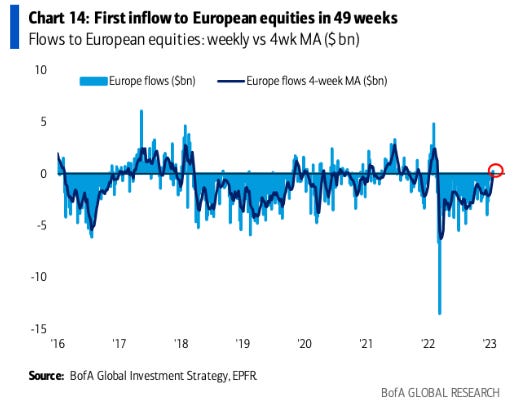
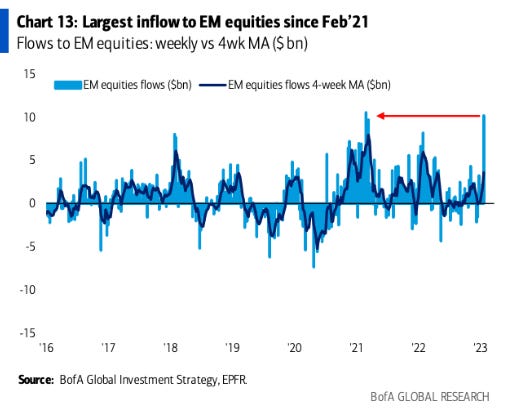
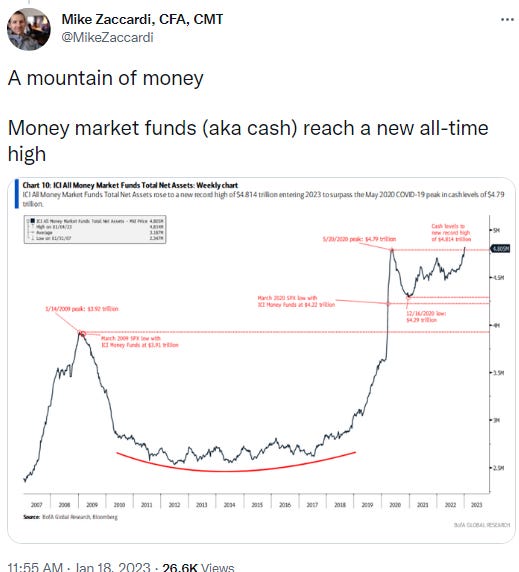
As in the week through Janu 11th, Lipper mostly saw a continuation of what we saw in the previous week, although with selling of US equity funds slowing to an eight-week low, global equity funds saw inflows for the first time in nine weeks with strong flows into European funds (+$7.35 billion) again this week. And after global bond funds saw their first weekly net buying since mid-August last week (the most since August 2021) they upped that this week to the most since April 2021. Still money was flowing into cash, with global investors adding another another $13.37 billion to cash, although not in the U.S. where there was a large $17 billion outflow from money markets. Emerging markets saw a second week of large inflows. RTRS.
Global equity funds drew their first weekly inflow in 10 weeks in the week to Jan. 11 on hopes of easing inflation and expectations that China's re-opening would boost global economies. Refinitiv Lipper data showed global equity funds attracted $5.17 billion in net purchases, for their first weekly inflow since Nov. 2.
Fund flows: Global equities bonds and money market
European and Asian equity funds received $7.35 billion and $1.54 billion worth of inflows, but investors exited U.S. funds worth $2.01 billion. Equity funds focused on China accumulated $1.61 billion worth of inflows, the biggest since July 6. Among equity sector funds, industrials, financials, and consumer discretionary saw $1.15 billion, $574 million and $479 million, respectively, in inflows. Still, tech suffered a 10th weekly outflow at $365 million.
Fund flows: Global equity sector funds
The $2.01 billion outflow from U.S. equity funds was the lowest in eight weeks. Both growth and value funds bled assets, with net selling worth about $4 billion and $757 million, respectively. However, some sectoral funds observed buying interest, with investors purchasing industrials, financials, and materials sector funds worth net $1.13 billion, $477 million and $435 million, respectively, after no sector saw positive flows the prior two weeks.
Fund flows: US equity sector funds
Weekly net purchases in global bond funds, at $16.92 billion, were the highest since April 2021, led by U.S. bonds. Global short- and mid-term, high-yield, and government bond funds had inflows of $3.89 billion, $3.56 billion and $1.89 billion, respectively, but inflation-protected funds lost $480 million in outflows.
Global bond fund flows in the week ended Jan 11
Refinitiv Lipper data showed U.S. bond funds attracted a net $10.52 billion worth of purchases, the biggest weekly inflow since late June 2021. U.S. taxable bond funds received $8.8 billion, the biggest weekly inflow since late June 2021, while municipal bond funds attracted a net $1.74 billion. Investors purchased U.S. short/intermediate investment-grade funds of $3.63 billion in their most extensive weekly net buying since Jan 2022, while high-yield, general domestic taxable fixed income, and government bond funds received $2.35 billion, $1.82 billion and $927 million, respectively.
Data for commodity funds showed precious metals got a marginal $5 million, while energy funds received $144 million and marked a second weekly inflow.
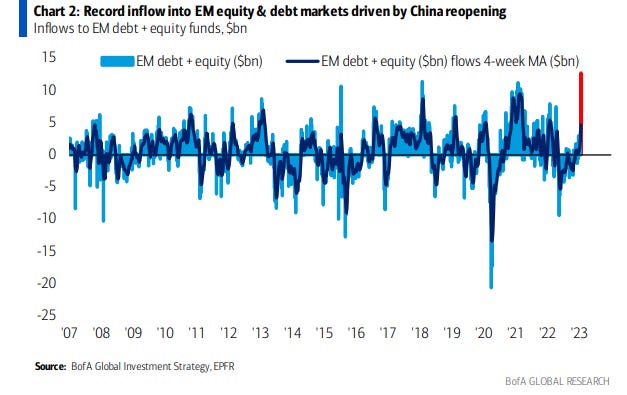
Data for 24,627 emerging market (EM) funds showed, bond funds secured $730 million in net buying, while equity funds drew $3.94 billion, the biggest weekly inflow since April 2022.
Fund flows: EM equities and bonds
Global investors were also net buyers in money market funds for a third straight week, with net purchases worth $13.37 billion, although in the U.S. it was a large net outflow ($17.22 billion after two weeks of inflows).
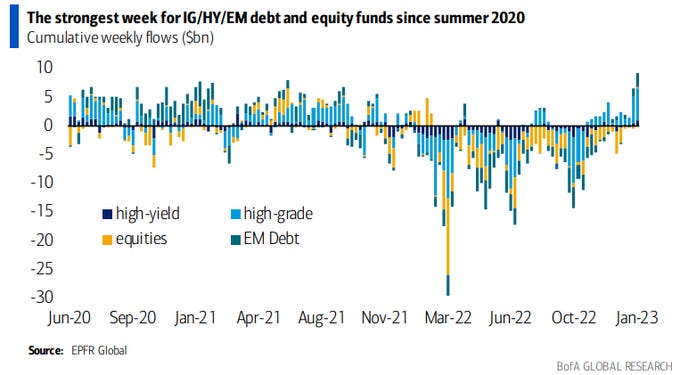
And Bank of America also saw inflows into both investment grade and high yield bonds, emerging market debt and equities. “Notably, the combined inflow into these four risky-assets pockets was the strongest since summer 2020:” BofA Global research
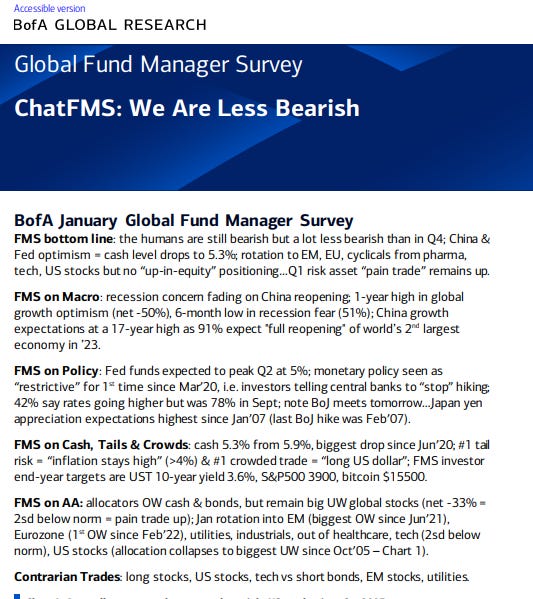
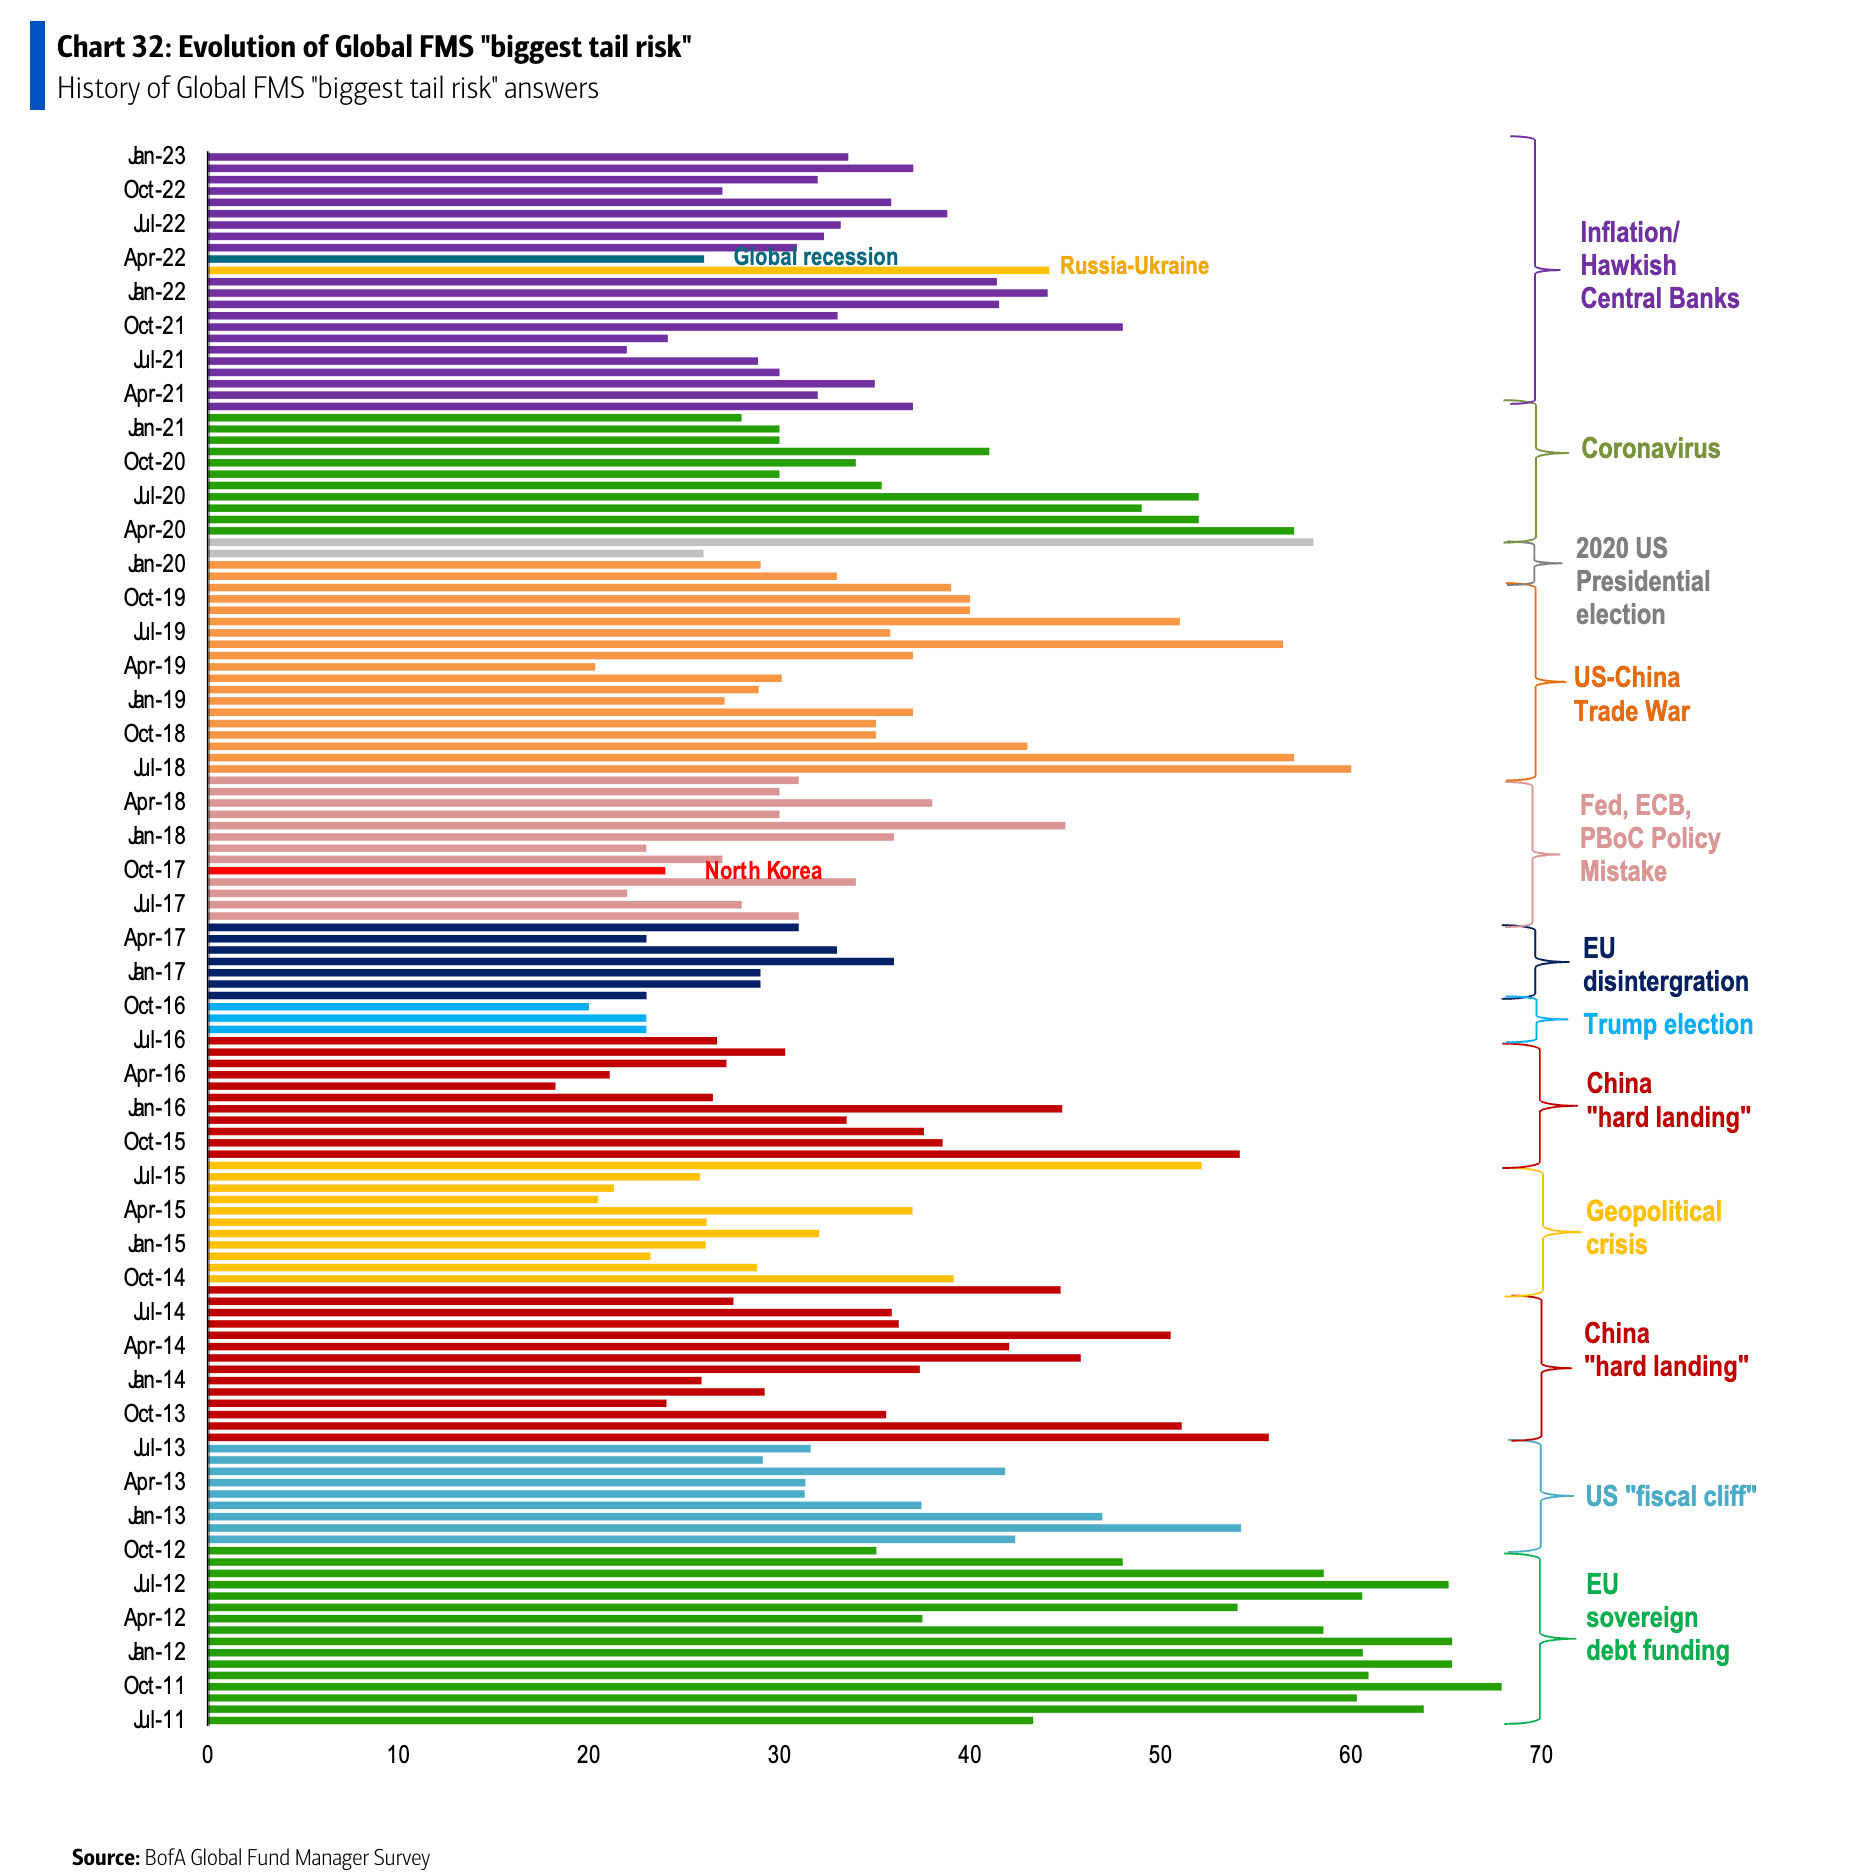
And BofA also released their widely followed monthly fund manager survey (FMS). BBG/HR.
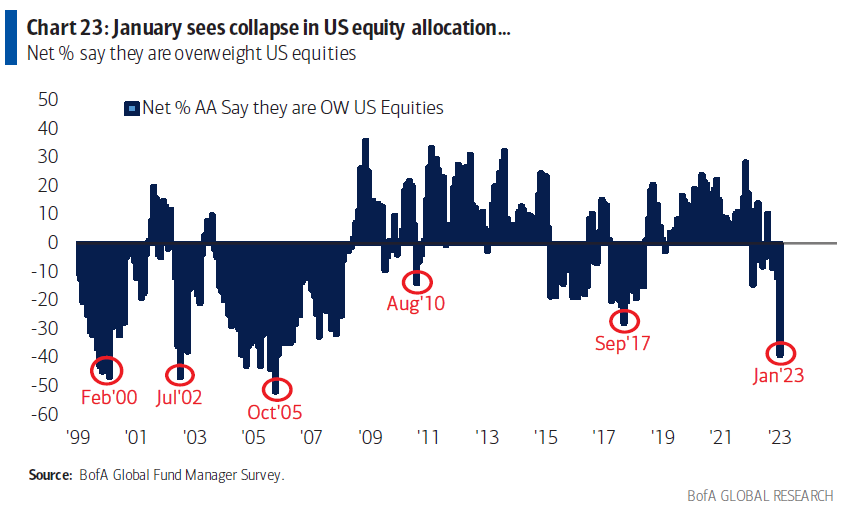
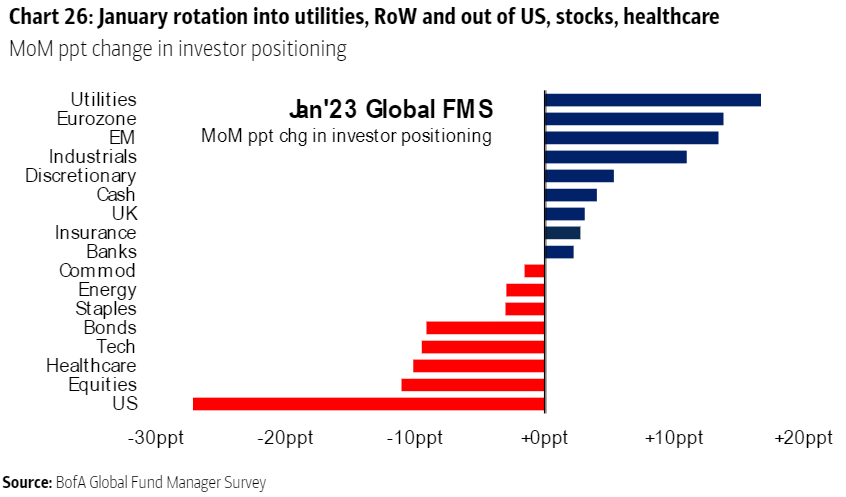
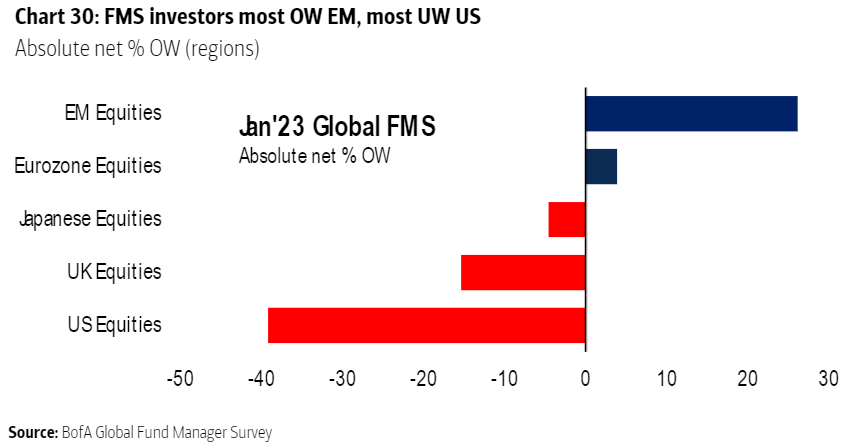
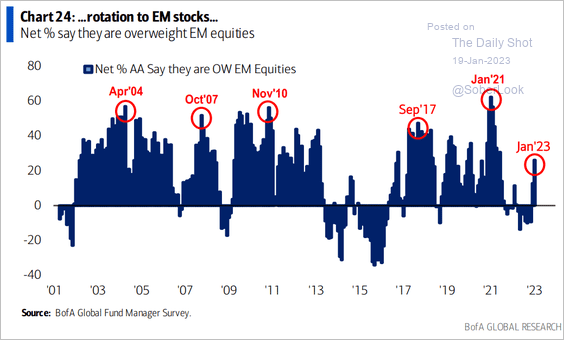
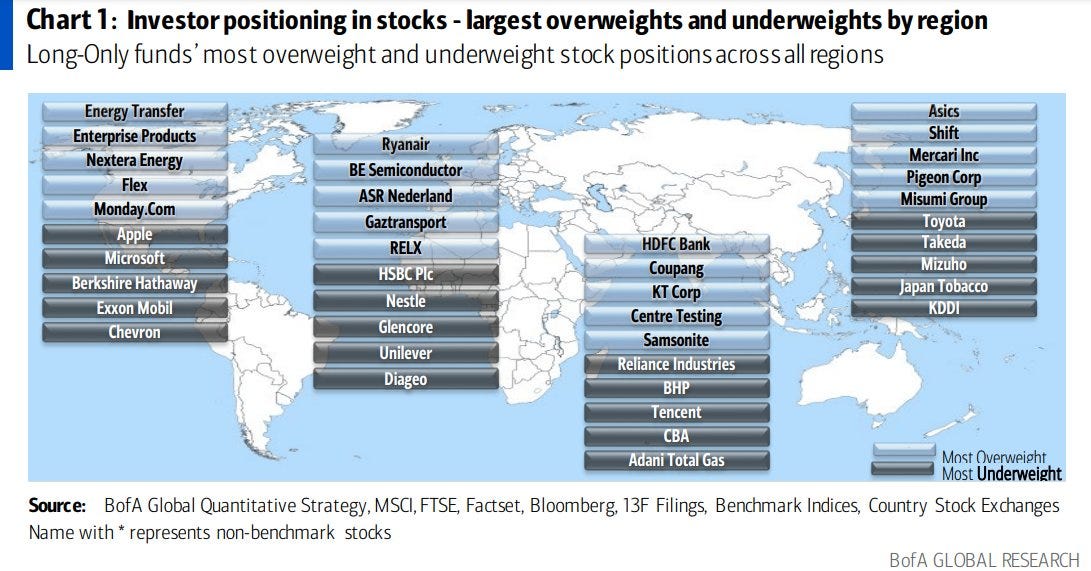
Investors have the most relative underweight on US equities since 2005 as improving market sentiment sends them flocking toward cheaper regions, according to Bank of America Corp.’s global fund manager survey. “The humans are still bearish but a lot less bearish than in Q4,” BofA’s Michael Hartnett said, sparking a rotation to emerging markets, Europe and cyclical stocks, and away from pharmaceuticals, technology and the US, strategists led by Michael Hartnett wrote in a note. Allocation to US equities “collapsed” during the first month of 2023, with investors a net 39% underweight the asset class, they said, the lowest since October 2005, and exceeding even the UK’s 15% As a reminder, October 2005 was in the immediate aftermath of Hurricane Katrina, which left much of the Gulf Coast under water and prompted incorrect predictions of an imminent recession The m/m decrease in investors’ overweight to US shares was the largest ever.
Investors’ net Overweight in EM shares jumped to the highest since June of 2021, while investors flipped Overweight European stocks for the first time since Russian tanks rumbled into Ukraine.
That said, fund managers remain underweight global stocks overall in light of persisting risks to economic growth. They’re overweight cash and bonds with prospects of peaking inflation driving up expectations for lower short-term rates, the survey showed.
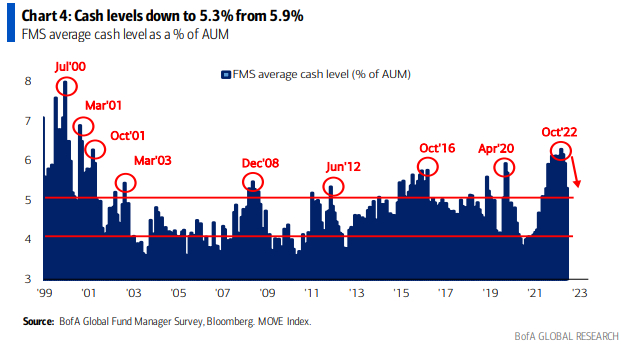
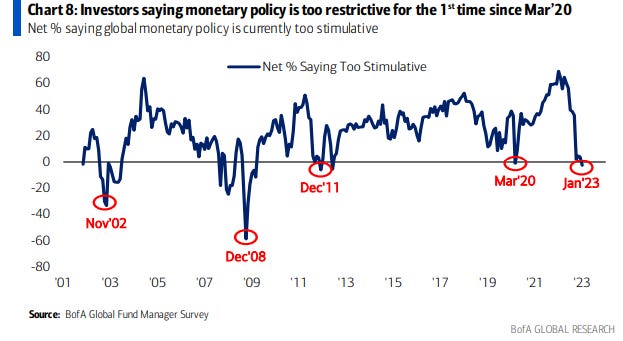
Participants said monetary policy is too restrictive for the first time since March 2020. They expect Federal Reserve rates to peak at 5% in the second quarter, and more investors now believe short-term rates will be lower in 12 months than those who see higher rates. “The combination of peak rates and peak recession fears is causing cash allocations to fall,” Hartnett said. Cash levels declined to 5.3% from 5.9%, the biggest drop since June 2020.
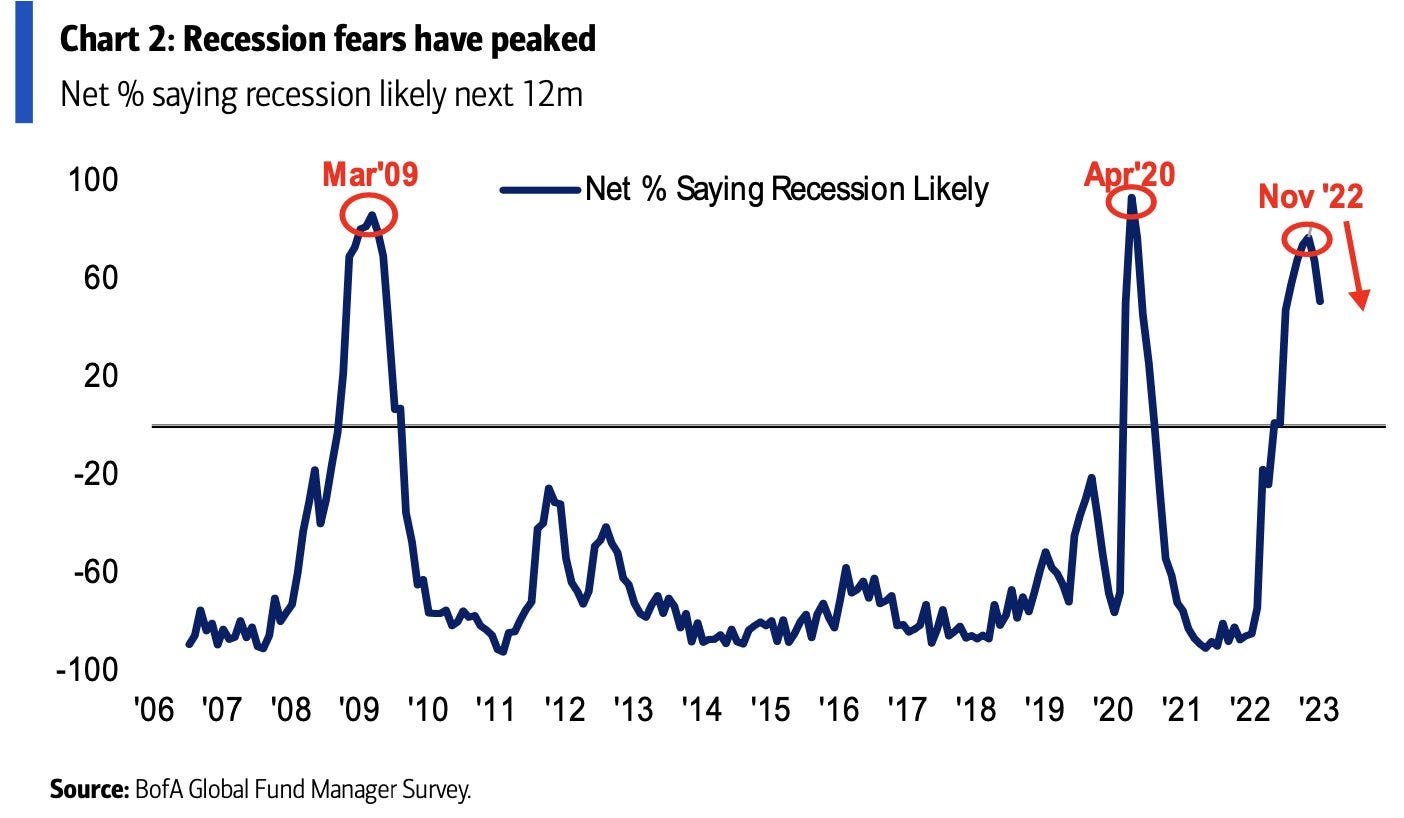
Even though a net 50% of respondents expect a weaker economy in the next 12 months, that’s the least bearish outlook on global growth prospects in a year as concerns about a recession fade due to China’s dismissal of its zero Covid policy. Recession expectations among panelists peaked two months ago at 77%. Historically, peak recession worry marked “turning points in asset prices,” Hartnett remarked.
A total of 253 fund managers with $710 billion under management participated in the global survey, which was conducted from Jan. 6 to 12.
Other highlights include:
Most crowded trades: long US dollar, long ESG assets, long China equities, long oil, long US Treasuries and long investment-grade bonds
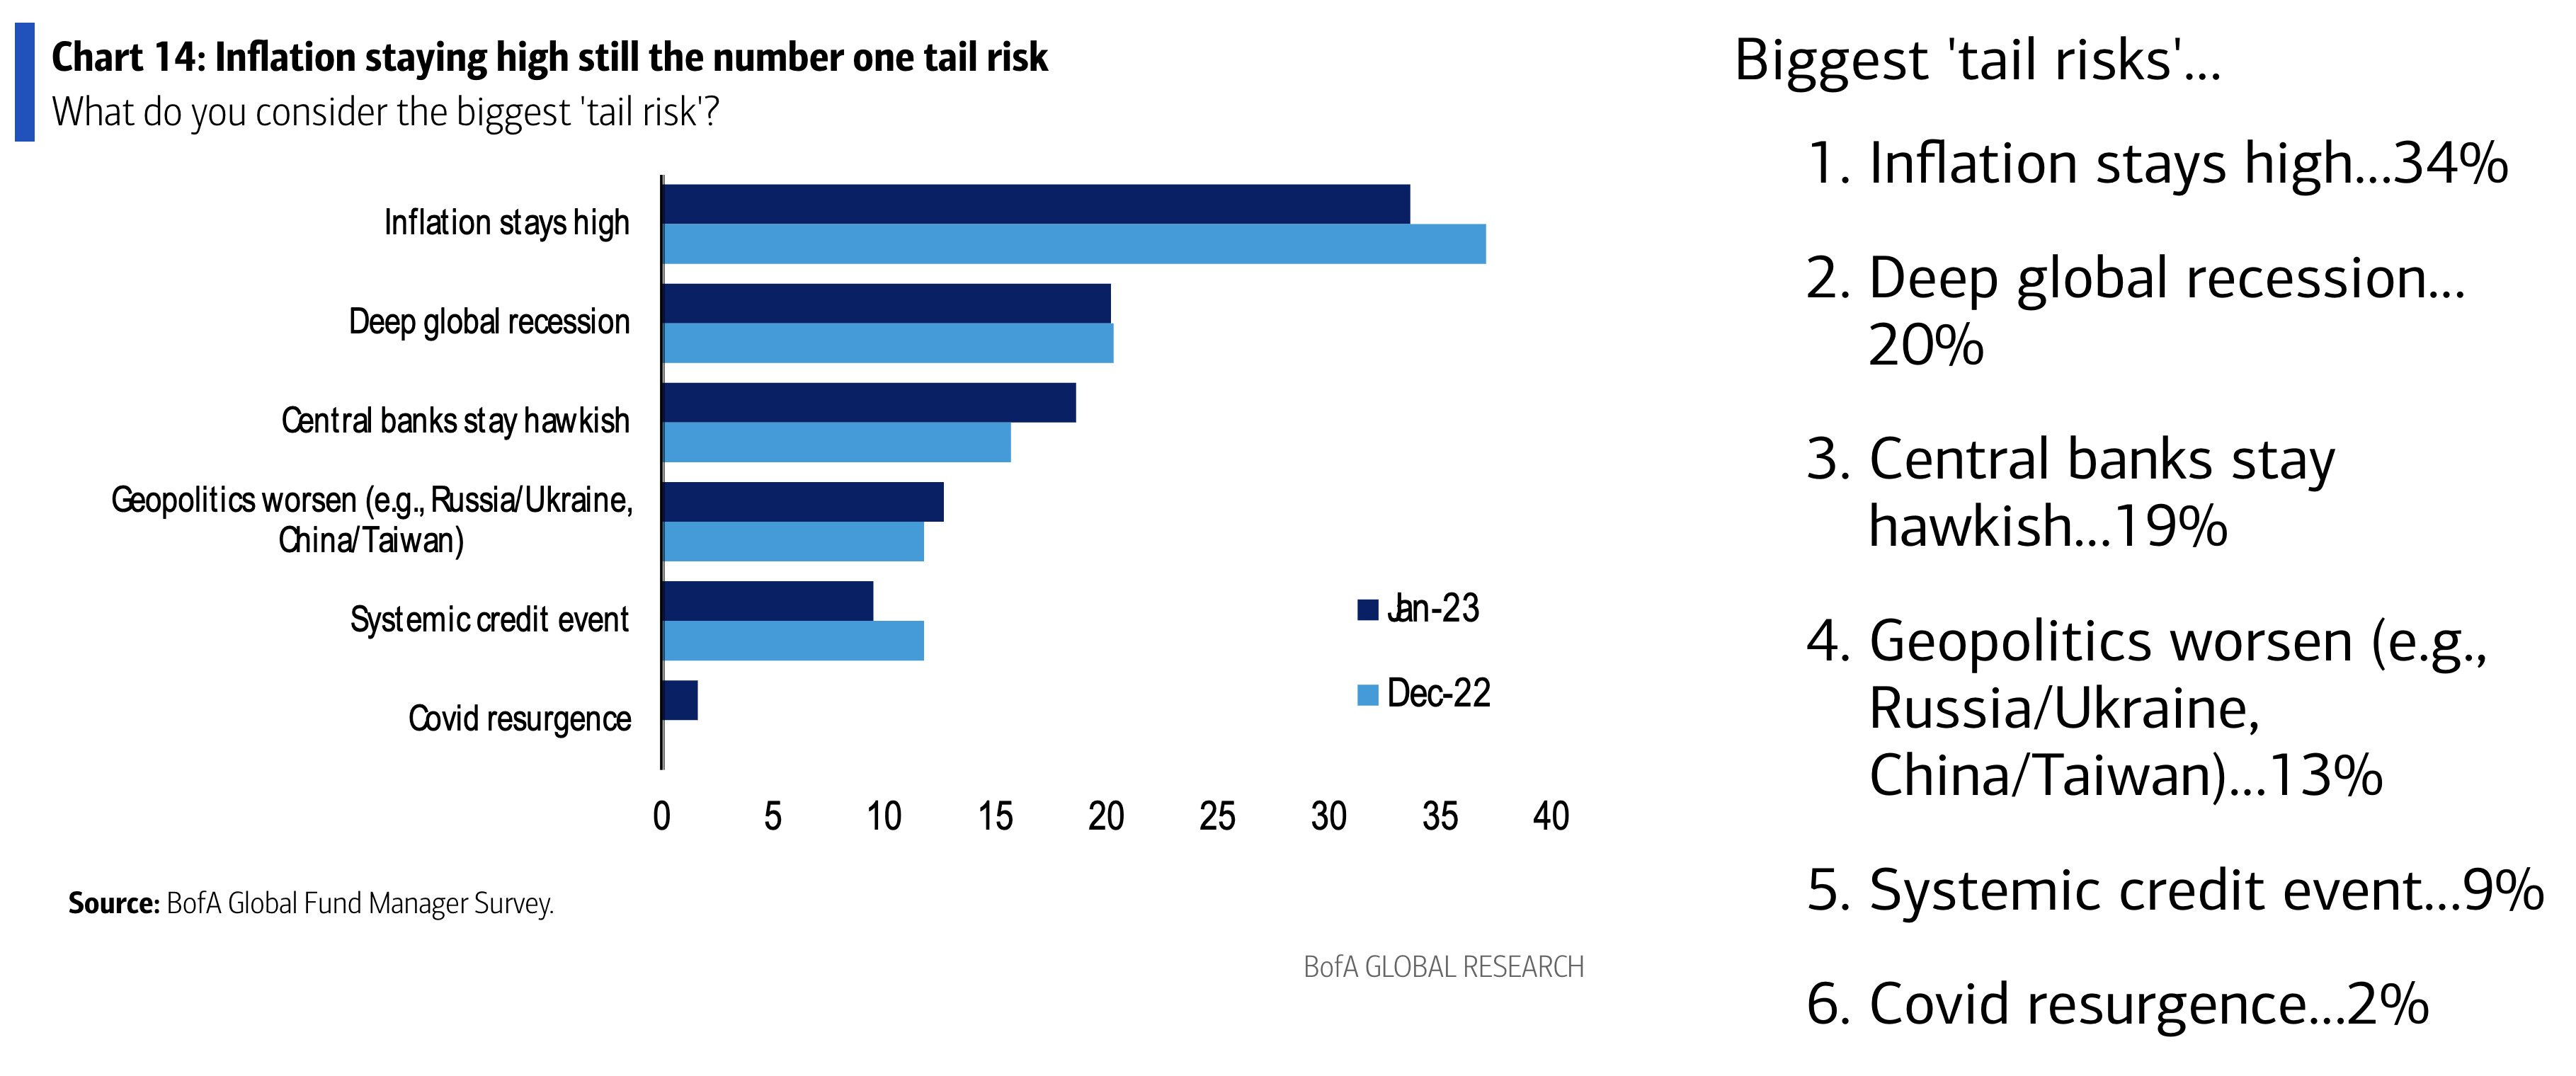
Biggest tail risks are inflation remaining high, a deep global recession and central banks staying hawkish
The most likely sources of a credit event are US shadow banking, China real estate and European sovereign debt
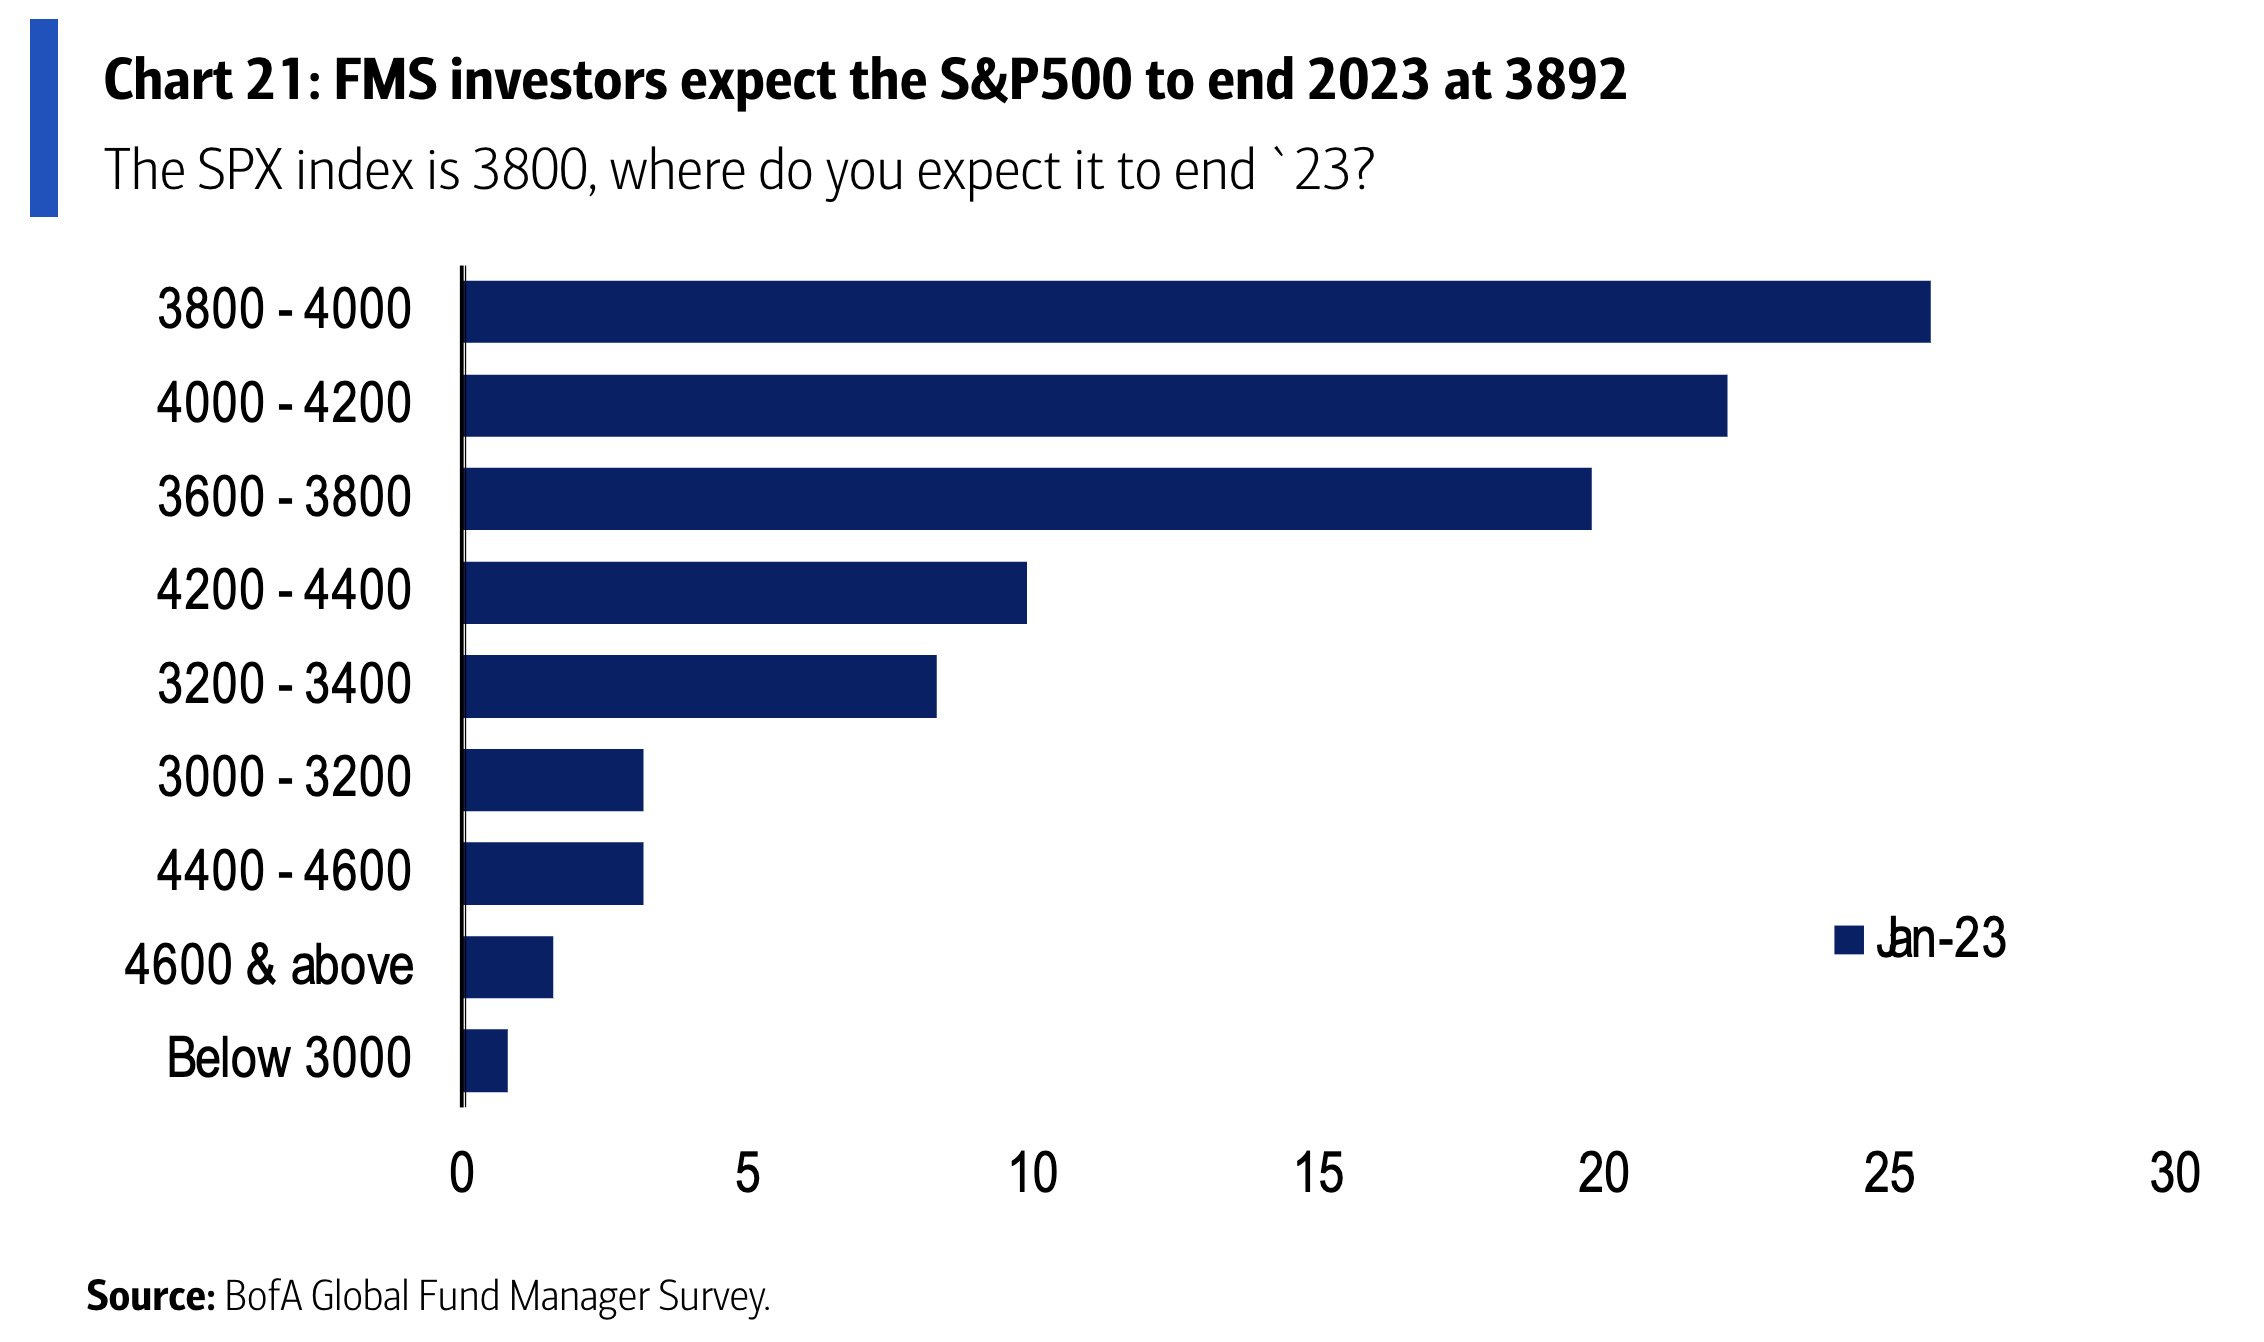
Participants see the S&P at 3,892 in 12 months with the vast majority of opinions between 3,000 and 4,600
Only 35% of panelists expect a peace agreement in Ukraine this year
And Goldman similarly sees a shift out of the US and into bonds. BBG.
The country’s equities have seen outflows of about $5 billion just in the first two weeks of the year, strategists led by Cecilia Mariotti wrote in a note dated Jan. 17. Meanwhile, lower natural gas prices, a weaker dollar and optimism about China’s economic reopening have spurred inflows into stock funds of Europe, China and other emerging markets. “We might be at a turning point for regional equity fund flows,” Mariotti wrote, adding that there’s a case for “a more meaningful acceleration” in non-US flows “as regional diversification has historically proved more valuable past the dollar peak.” European equity funds saw inflows for the first time since Russia invaded Ukraine nearly a year ago, according to Goldman citing EPFR Global and Haver Analytics data. Mariotti said a drop in commodity prices and signs of cooling inflation had boosted market optimism more broadly, pushing the bank’s custom risk appetite indicator into positive territory since the start of the year.
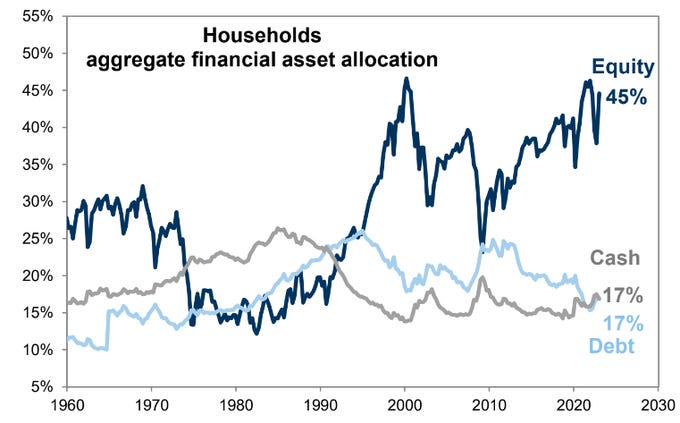
And Goldman also finds household equity allocations remain near record highs.
As they continue to see a flat year for the SPX as well as earnings assuming no recession.
While JPM’s Marko Kolanovic continues to be cautious, seeing the January rally as mostly short covering. HR.
Marko Kolanovic on Thursday warned that a recession probably isn’t priced into markets. “Economic slowdown and weakening corporate fundamentals are happening in an environment where interest rates are very high, rising and likely to stay high as stated by the Fed on several occasions,” he wrote… Given the worsening data and likely profit recession, why have markets been buoyant of late? Well, not because a recession is priced in, Marko suggested. Flows played a part, and particularly from vol-sensitive mechanical cohorts. “Volatility significantly declined in December, helped by low trading activity and hedging of long option positions,” he said, adding that,
In Europe, likely misplaced optimism caused trend following programs to reverse positions from fully short to long. Along the way, many fundamental investors also covered their short positions, despite their negative fundamental outlook. Also, there is a January effect of new 401(k) allocations, rotation from growth to value, as well as increased risk positions by long only funds.
As the annotations on the chart show, this is a bifurcated market. Big-cap US tech suffered a fairly deep, de-rating-driven selloff. Due to the weight of mega-cap US tech shares in US indexes and global equity benchmarks, some investors might’ve been inclined to believe that the “broad” market has priced a recession, when in fact it hasn’t... If you’re wondering what’s changed since early last summer when the bank was more receptive to the idea that a recession was in the price, Kolanovic was direct. “At that point in time, recession-sensitive markets were almost 20% lower than now, earnings expectations were higher and terminal Fed funds were much lower than where they are projected to peak now,” he said. As to the flow drivers mentioned above, Kolanovic thinks they’re “running out of steam.” The bottom line, he wrote, is that “markets heading towards recession are being further aggravated by central bank tightening.”
And Citi remains bearish as well.
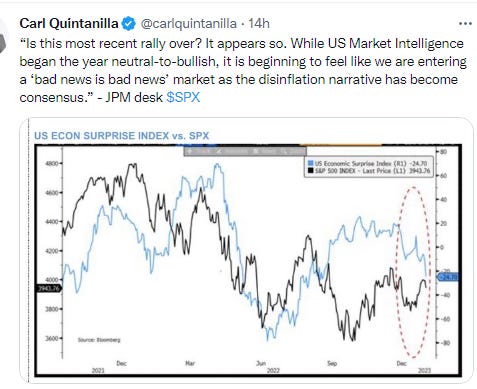
As a big theme for this week (including my summaries) is, as Charlie McElligott put it, whether we are entering a rare (since the GFC) “bad news is bad news” environment. HR.
Extremely hot nominal growth and runaway inflation during the stimulus-fueled rebound from the fleeting pandemic slump were unequivocally bad for markets in 2022, which meant that signs of decelerating demand are welcome indeed if they presage softer inflation. But what of unequivocal recessionary prints? That’s a question markets were compelled to ponder this week, when retail sales and factory output posted wide misses which, when taken in conjunction with the struggling housing market, and the prospect of slower business spending and layoffs as corporates retrench, suddenly revived hard landing fears.
“‘Hard US recession’ trading snap[ped] back with a vengeance, particularly as the US economic data downside surprises are occurring against a labor market which refus[es] to roll over and placate the FOMC, hence the ultra-rare sighting of a ‘bad news is bad news’ market regime,” Nomura’s Charlie McElligott wrote, in a Thursday note, calling the retail sales miss a “new pain point” and describing the Microsoft layoffs as a “signal that the dreaded ‘margin compression’ is very much a ‘here and now’ phenomenon at even the best-run companies.” On the flows front, that’s meant the “re-acceleration of forced buy-to-cover flows from legacy G10 bond ‘shorts’ to the tune of an estimated $24 billion of notional buying over the past week in the CTA model, as ‘hard landing recession’ buy-in sees an underlying price impact across fixed-income,” Charlie wrote. At the same time, there’s been “substantial deleveraging within recently re-accumulated equities ‘longs,’ with an estimated -$32.1 billion of selling” concentrated in US and Japanese shares, he added.
…
“The RoW [rest of world] being ‘less bad than feared’ is a global growth stabilizer, but one that is greatly complicating matters for the Fed, because it’s now occurring at the same time that domestically we see this stark juxtaposition, where the US economy is showing accelerated strains due to the ‘lagged and variable’ implications of [policy] tightening,” Charlie wrote, suggesting that the new “better-global-offsetting worsening-domestic” regime may embolden the Fed, or even necessitate tighter policy (e.g., in the event Chinese demand pushes up commodity prices, and thereby inflation), risking the dreaded “terminal for longer” scenario. Of course, as McElligott went on to say, terminal for longer would “increase the likelihood of policy error, which is why we see implied Fed cuts growing over the past week, as the deepening likelihood of a hard landing will merit even larger cuts to offset the damage later.”
Earnings
As earnings are a direct input into stock prices, these along with multiples are the two direct determinants into where a stock is priced. So as those go so will the market all else (the multiple) equal (see chart).
And here was my earnings preview thoughts last week:
As I have been writing for the last couple of months,
So far there’s been been some degradation in [4Q22 and2023 earnings expectations], but they’ve held up much better than what you’d typically see in a recessionary period as we’re still talking earnings growth at this point (although decelerating).
And as I noted three weeks ago the total deterioration in estimates for 2023 has been around -8.5% from the peak, and 4Q has seen some deterioration as well. But, importantly, earnings are still forecast to be UP in 2023(by 4%, although it’s all back half loaded). That is not anything like what would be expected in a recession (and why many analysts have 2023 earnings expectations forecast to be more around the $200 mark, meaning the “feared number” is certainly lower than the $230 or so that’s estimated, setting us up for the potential for more “better than feared” earnings seasons in coming quarters). This will be one of the key questions of 2023. Do earnings hold up or don’t they. I have been in the more positive camp all year despite those who predicted an “earnings disaster” this year, and I continue to think they’ll come in at least better than feared, especially after 20% of the SPX has already preannounced (a very high rate) as noted last week. I also think there will be some good support from the weaker dollar (it was down 10% in the 4th quarter), that will hopefully offset the the impact of the 2022 tax increases (buyback tax, minimum corporate tax, etc.). Currently, expectations are for a -3.9% y/y drop in 4Q earnings which I think we’ll beat.
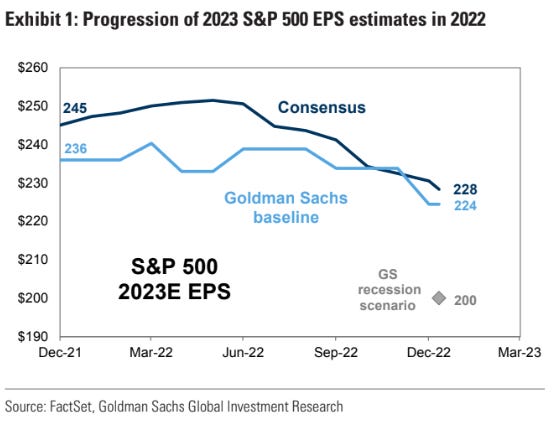
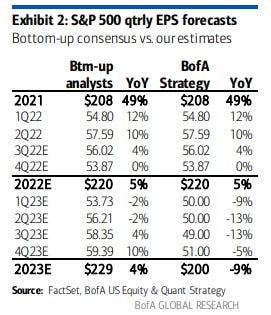
And as a reminder here was Goldman’s estimates, a little below the median (although those have been revised down somewhat as we enter the season with expectations for a -4.6% y/y drop according to Factset as of this week.
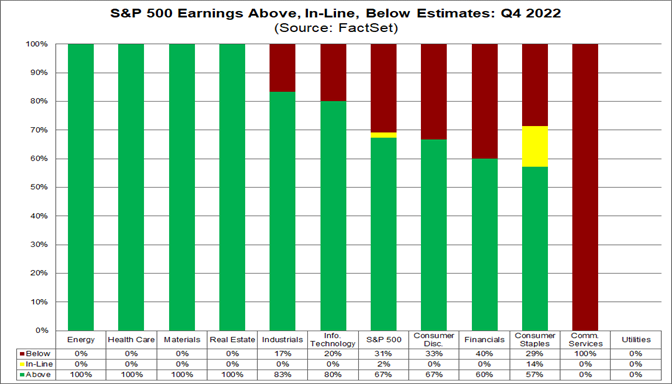
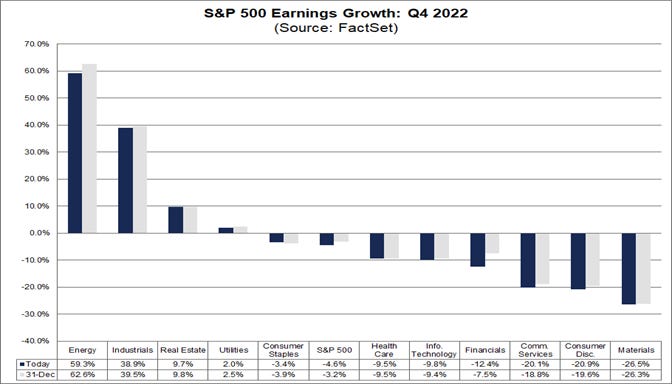
But now we have a full week of earnings under out belt, and of the 53 companies that have reported so far (11% of the S&P 500), overall earnings results are beating estimates by a median of 3.3%, and 67% of those reporting are beating estimates. That is well under the 80% positive surprise seen over the past several quarters, and the beat amount is well under the 5 and 10 year averages (see below). And in a slightly unusual circumstance earnings expectations have deteriorated in the first week to -4.6% y/y. Revenues, though, are much closer to the historical average meaning that there has, in fact, been worse than expected degradation in margins as many have predicted (as discussed at length in previous weeks). Factset.
The fourth quarter earnings season for the S&P 500 is not off to a strong start. To date, the number and magnitude of positive earnings surprises reported by S&P 500 companies are below their 5-year and 10-year averages. Overall, 11% of the companies in the S&P 500 have reported actual results for Q4 2022 to date. Of these companies, 67% have reported actual EPS above estimates, which is below the 5-year average of 77% and below the 10-year average of 73%. In aggregate, companies are reporting earnings that are 3.3% above estimates, which is below the 5-year average of 8.6% and below the 10-year average of 6.4%. The index is now expecting lower earnings for the fourth quarter today relative to the end of last week and relative to the end of the quarter. The blended (combines actual results for companies that have reported and estimated results for companies that have yet to report) earnings decline for the fourth quarter is -4.6% today, compared to an earnings decline of -4.0% last week and an earnings decline of -3.2% at the end of the fourth quarter (December 31).
Negative earnings surprises and downward revisions to earnings estimates for companies in the Financials sector have been the largest contributors to the increase in the overall earnings decline for the index over the past week and since December 31. If -4.6% is the actual decline for the quarter, it will mark the first time the index has reported a year-over-year decrease in earnings since Q3 2020 (-5.7%). Four of the 11 sectors are reporting (or are expected to report) year-over-year earnings growth, led by the Energy and Industrials sectors. On the other hand, seven sectors are expecting a year-over-year decline in earnings, led by the Materials, Consumer Discretionary, and Communication Services sectors.
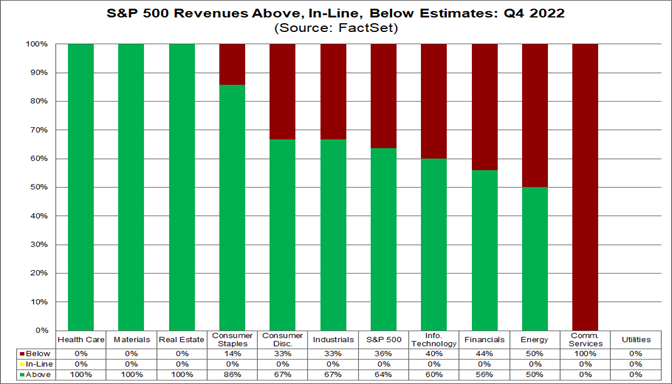
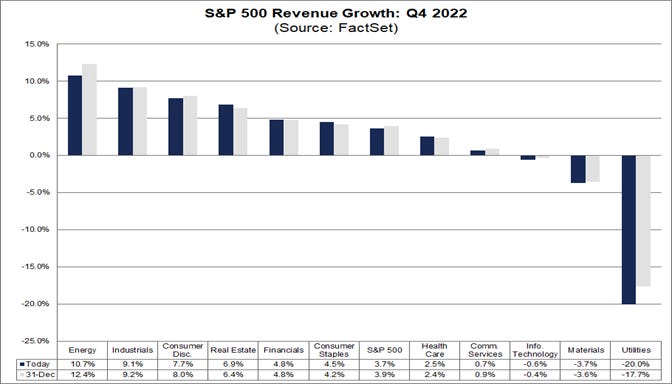
In terms of revenues, 64% of S&P 500 companies have reported actual revenues above estimates, which is below the 5-year average of 69%, but above the 10-year average of 63%. In aggregate, companies are reporting revenues that are 0.3% above the estimates, which is below the 5-year average of 1.9% and below the 10-year average of 1.3%. The index is also expecting lower revenues for the fourth quarter today relative to the end of last week and relative to the end of the quarter. The blended revenue growth rate for the fourth quarter is 3.7% today, compared to a revenue growth rate of 3.8% last week and a revenue growth rate of 3.9% at the end of the fourth quarter (December 31). Downward revisions to revenue estimates for companies in the Energy and Utilities sectors have been the largest contributors to the decrease in the overall revenue growth rate for the index over the past week and since December 31. If 3.7% is the actual growth rate for the quarter, it will mark the lowest revenue growth rate reported by the index since Q4 2020 (3.2%). Eight sectors are reporting year-over-year growth in revenues, led by the Energy and Industrials sectors. Three sectors are reporting (or are expected to report) year-over-year declines in revenues, led by the Utilities sector.
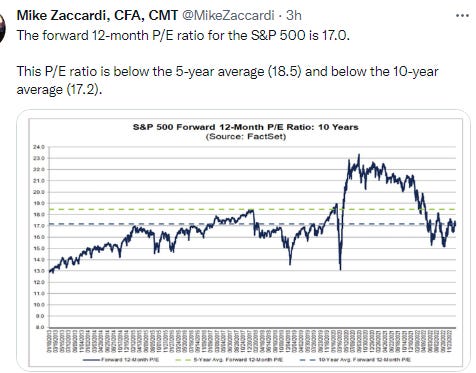
The forward 12-month P/E ratio is 17.0, which is below the 5-year average (18.5) and below the 10-year average (17.2). However, it is above the forward P/E ratio of 16.7 recorded at the end of the fourth quarter (December 31), as the price of the index has increased while the forward 12-month EPS estimate has decreased since December 31. During the upcoming week, 93 S&P 500 companies (including 12 Dow 30 components) are scheduled to report results for the fourth quarter.
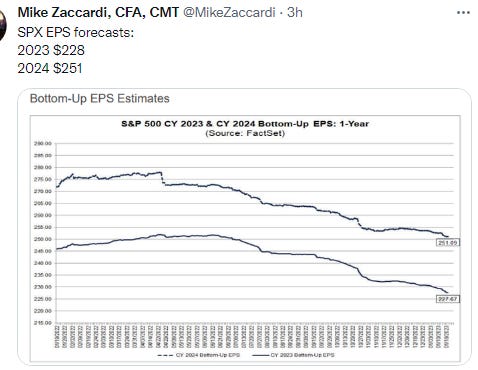
And looking forward to 2023, those expectations have drifted to just below $230, while 2024 are currently at $253.
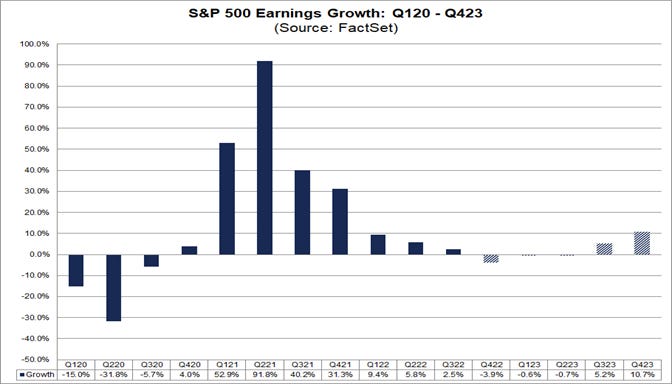
Looking ahead, analysts expect earnings declines for the first half of 2023, but earnings growth for the second half of 2023. For Q1 2023 and Q2 2023, analysts are projecting earnings declines of -1.1% and -1.2%, respectively. For Q3 2023 and Q4 2023, analysts are projecting earnings growth of 4.6% and 10.5%, respectively. For all of CY 2023, analysts predict earnings growth of 4.2%.
At the sector level, 10 of the 11 sectors have witnessed a decline in estimated earnings for the first half of 2023 since September 30, led by the Consumer Discretionary, Communication Services, and Materials sectors. Overall, six sectors are now projected to report a year-over-year decrease in earnings for the first quarter, and three sectors are predicted to report a year-over-year decrease in earnings for the second quarter. The Materials and Health Care sectors are the only two sectors predicted to report a year-over-year decrease in earnings for both quarters.
But as noted above almost every major bank is looking for more softening than what we’ve seen so far.
Morgan reiterated $195 base case, $180 bear case.
And RBC sees the current pace of earnings cuts guiding to $211 for 2023 EPS, but think it’s priced in.
And BBG notes that maybe margins won’t crash as many (Morgan) are calling for.
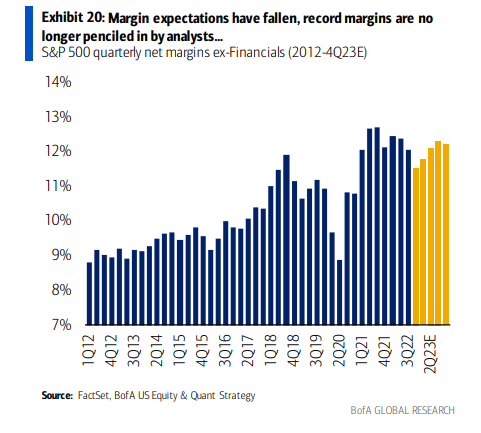
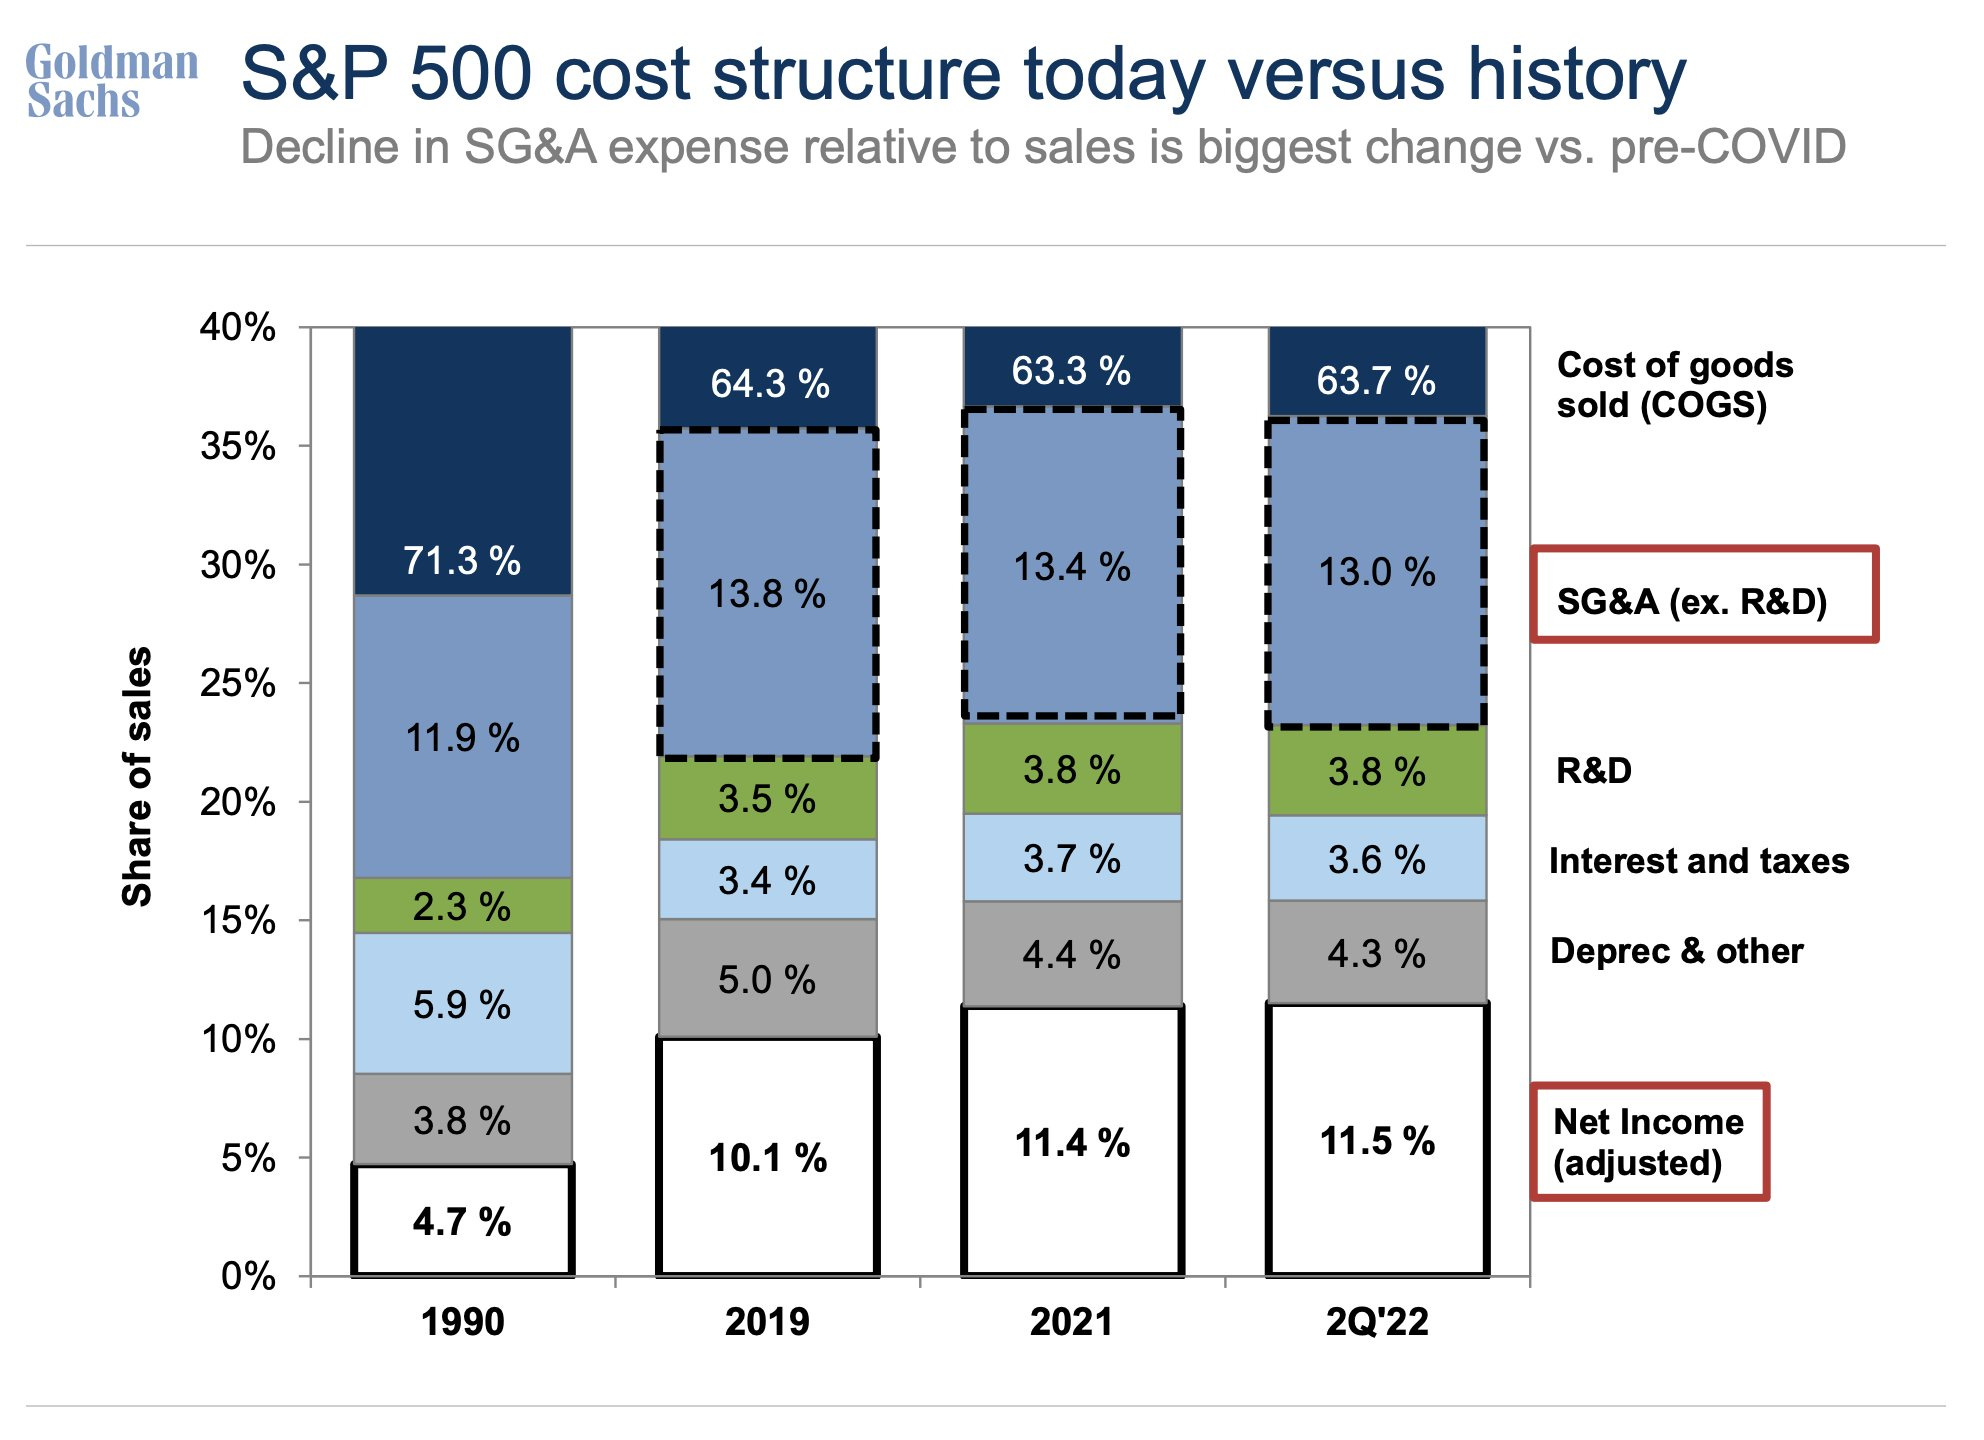
And interesting chart from Goldman showing how cutting overhead has been one way margins have been supported (and we saw a lot of that this week in big tech).
But as long as we don’t get a severe pullback, y/y negative EPS is not necessarily a bad thing.
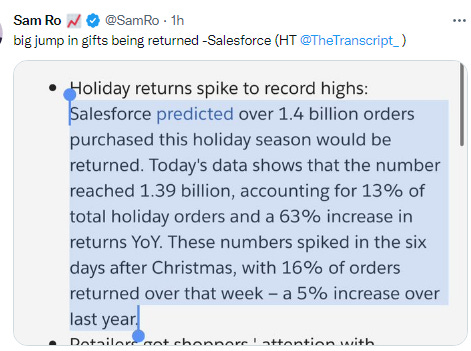
And retailers may be pressured by returns more than usual in coming earnings releases.
But the weaker dollar will be a boost.
As earnings season moves up another gear next week. SA.
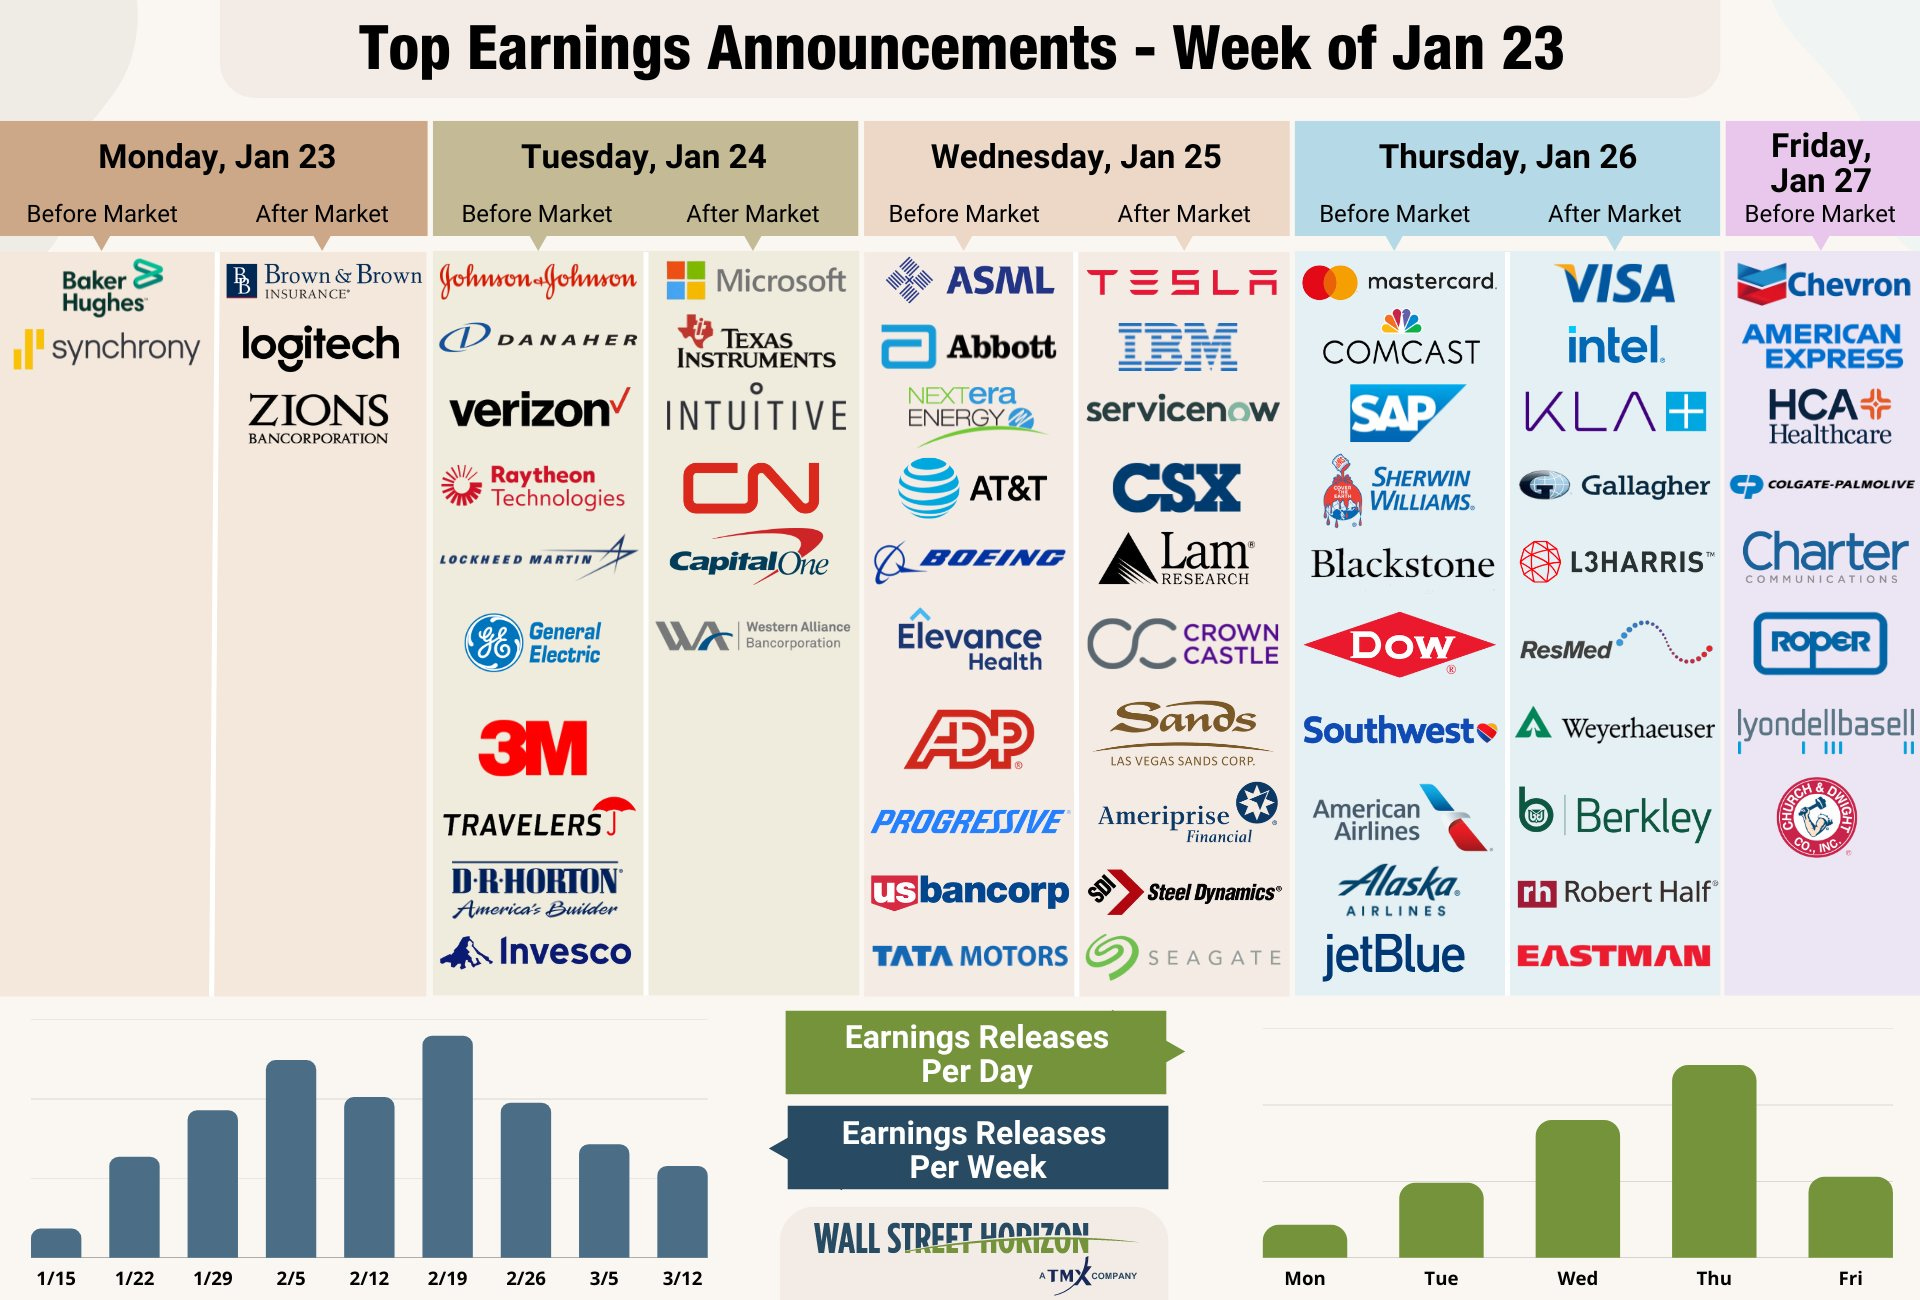
Earnings spotlight: Monday, January 23 - Baker Hughes (BKR) and Synchrony Financial (SYF).
Earnings spotlight: Tuesday, January 24 - 3M (MMM), Johnson & Johnson (JNJ), Verizon (VZ), Lockheed Martin (LMT), General Electric (NYSE:GE), F5 (FFIV), Texas Instruments (TXN), and Microsoft (MSFT).
Earnings spotlight: Wednesday, January 25 - AT&T (T), Abbott Labs (ABT), Boeing (BA), IBM (IBM), and Tesla (TSLA).
Earnings spotlight: Thursday, January 26 - Comcast (CMCSA), American Airlines (AAL), Dow (DOW), Intel (INTC), Comcast (CMCSA), Mastercard (MA), Tractor Supply (TSCO), and Visa (V).
Earnings spotlight: Friday, January 27 - Chevron (CVX), American Express (AXP), and Colgate-Palmolive (CL).
And I’ll keep these charts up for now.
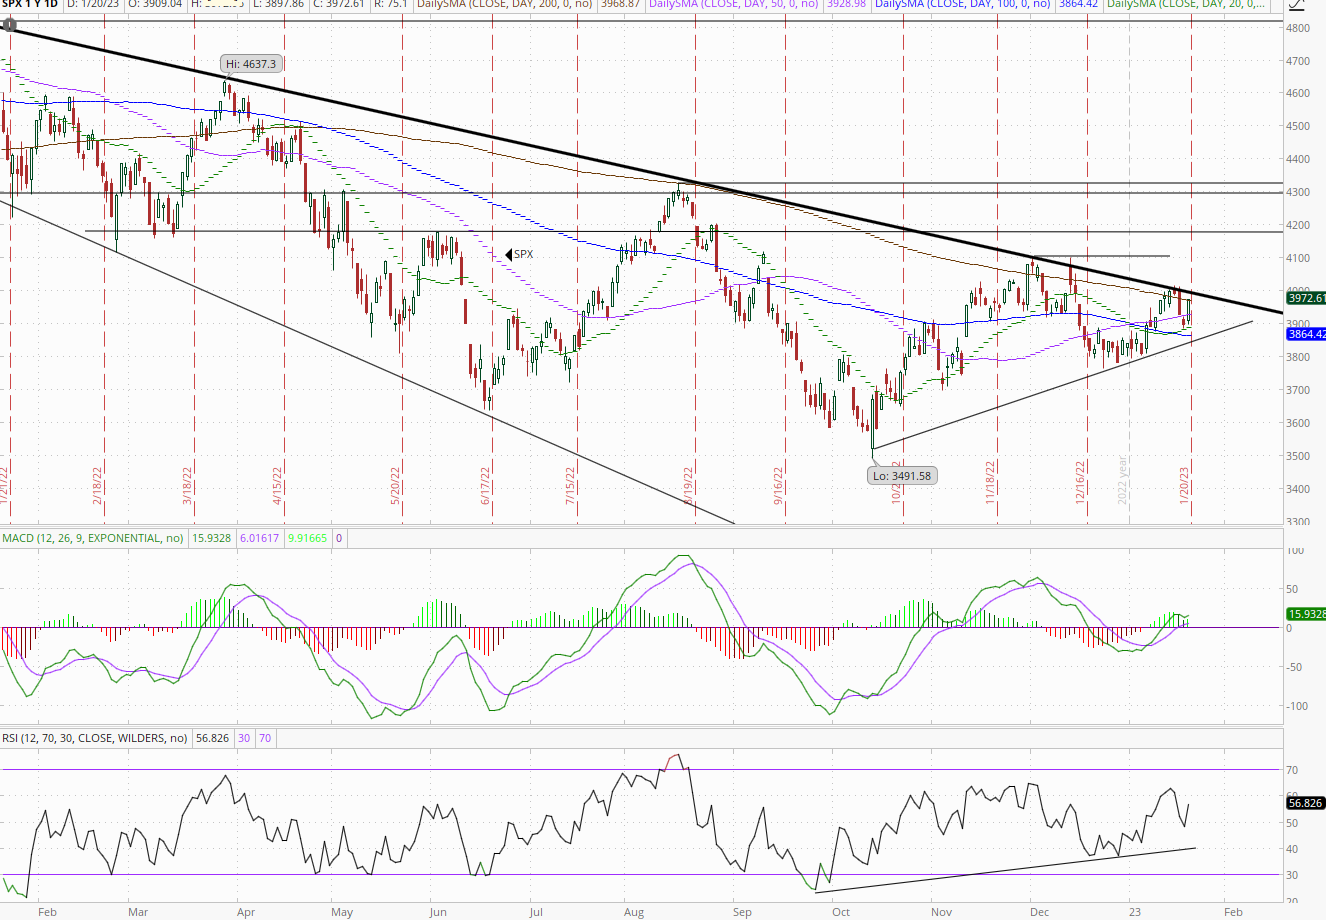
Major Market Technicals
I said last week,
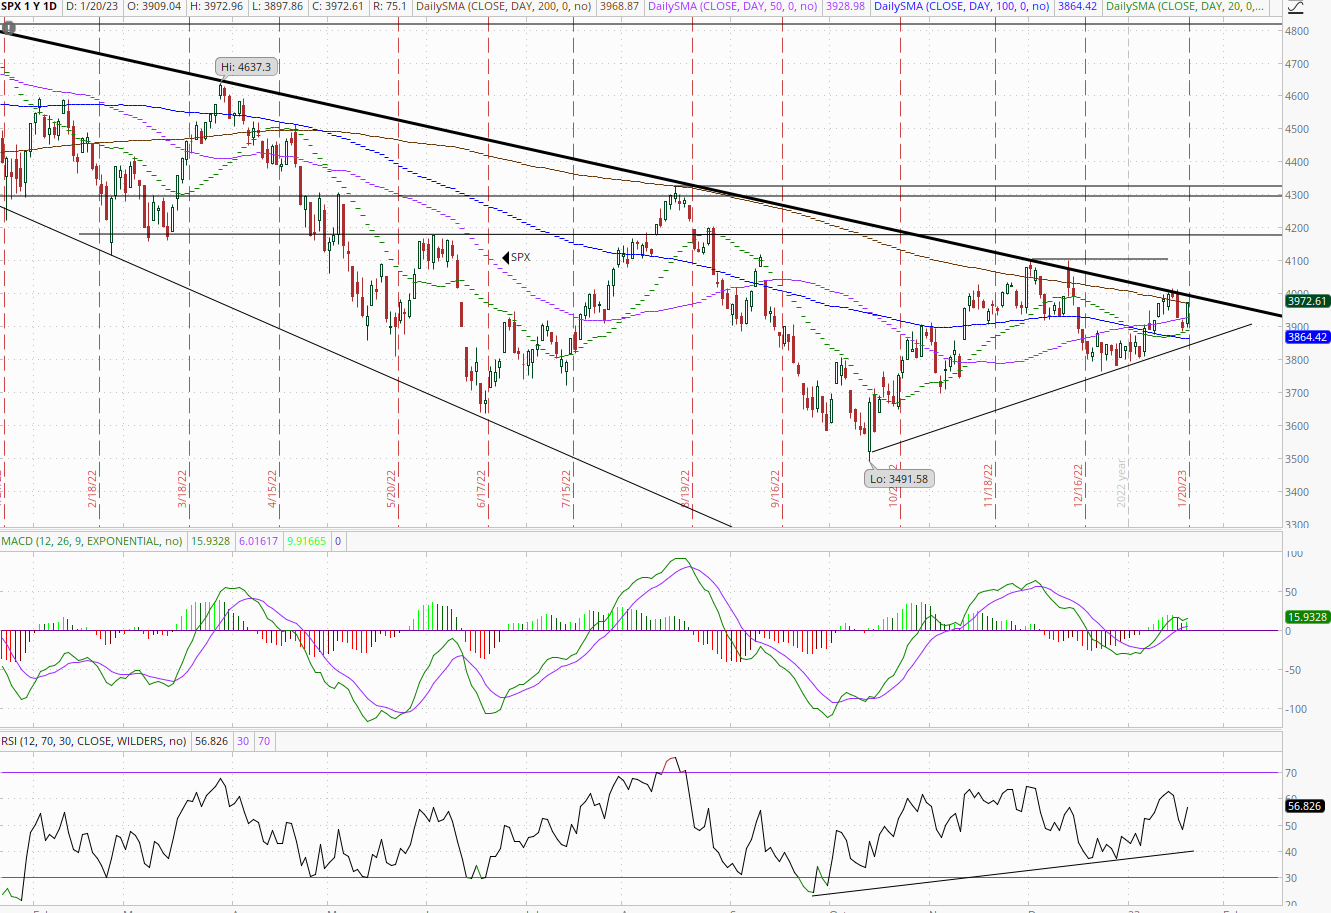
Tthe SPX did manage to get over the 50-DMA (and did get the MACD to just about hit a “go long” configuration (but it was already in a bullish configuration), and even edged over the 200-DMA. As I wrote on Friday,
it also advanced over my trendline (although that one sort of depends on where you draw it), but not quite the also well-watched 4000 level (it got to 3999, yes, seriously). This sets up next week as an important one technically.
I don’t have strong feelings on how much further this goes. Technically, the rally should continue but as we’ll go through we are very overbought short term. Not sure how that all plays out.
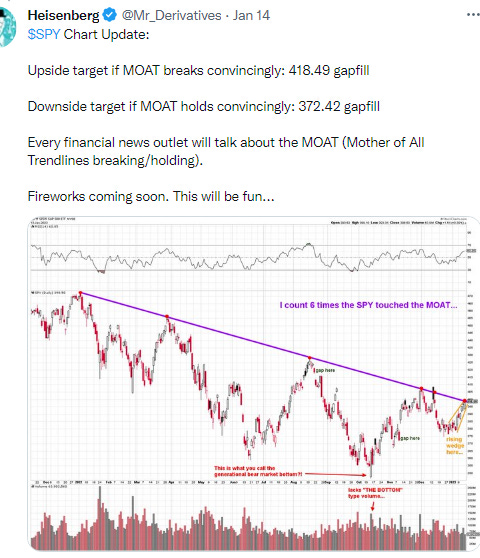
And the way it played out was a pullback before a big Friday rally brought the SPX to just a little below where it ended last week. So another chance to move through the MOAT as it’s been described (Mother Of All Trendlines)). The good news is we’re a little less overbought than this time a week ago (but still definitely on the overbought side).
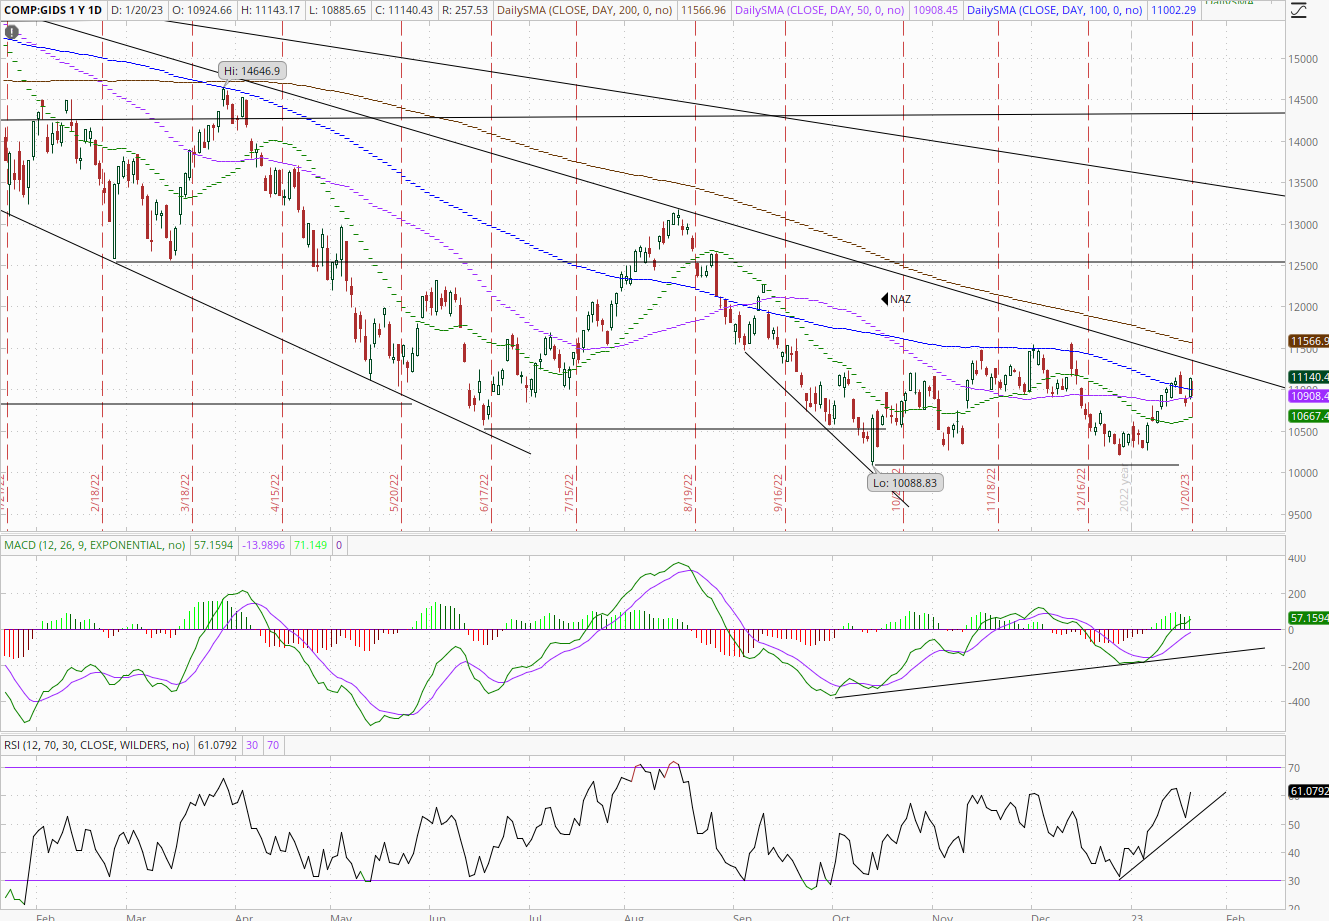
The NDX and Nasdaq Comp have similar charts (Nasdaq Comp is below). They also are now up to their MOAT’s and have supportive daily technicals.
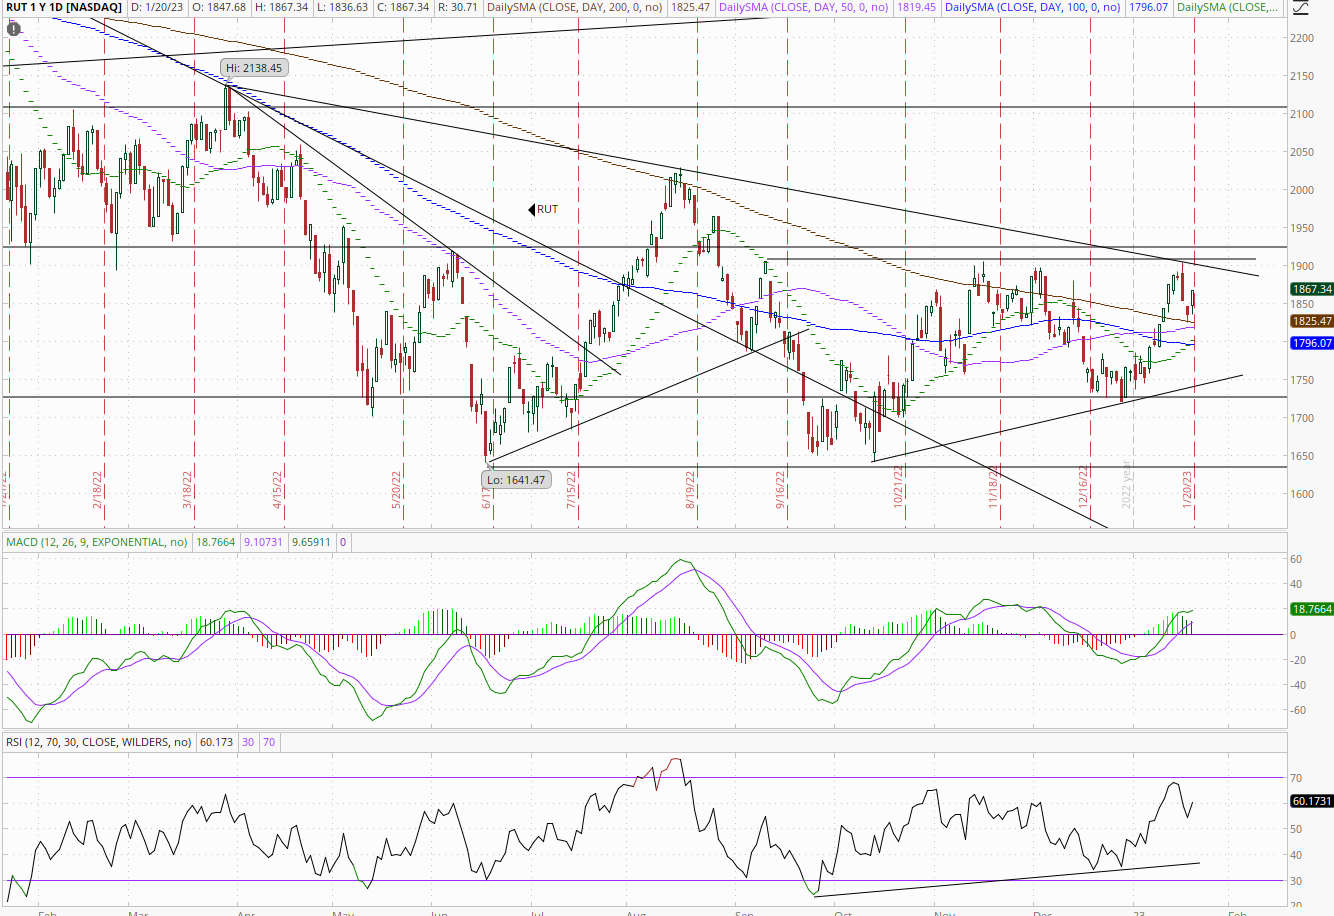
The RUT which has been outperforming the other indices (above its 200-DMA and the trendline from the start of 2022), remains below a more recent trendline (from March) and its September and November highs. Daily technicals here similar to the SPX (good but not as good as the Nasdaq).
Breadth
Breadth which has been strong for the last couple of weeks, was weak on Wednesday and Thursday before rebounding on Friday. We’ll see how this develops as it’s been a supportive factor. I wrote on Friday,
Breadth was also strong although here growth didn’t outperform. 84% of volume was positive on the NYSE, and the Nasdaq had 86%. Issues were 77 and 69%. As I noted breadth had been relatively strong the past two weeks until Wednesday, so this return to strength was nice to see.
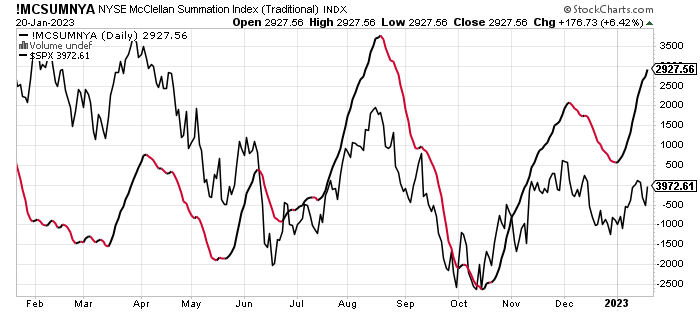
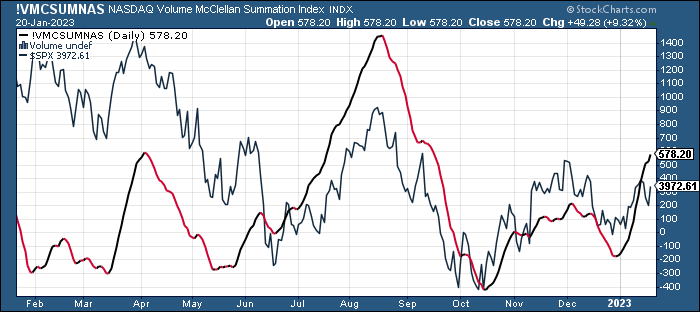
But the McClellan Summation Index (what the average stock has been doing), continues moving higher which is supportive to equities.
As does the volume based version of the Nasdaq.
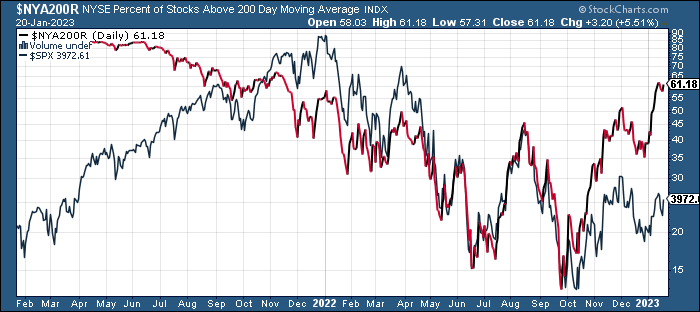
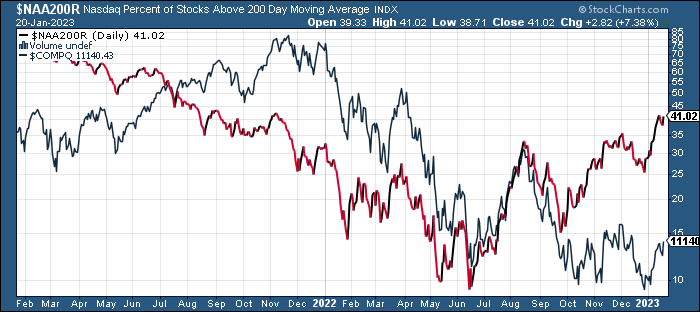
While the % of stocks above 200-DMAs remains the highest its been since the start of the bear market
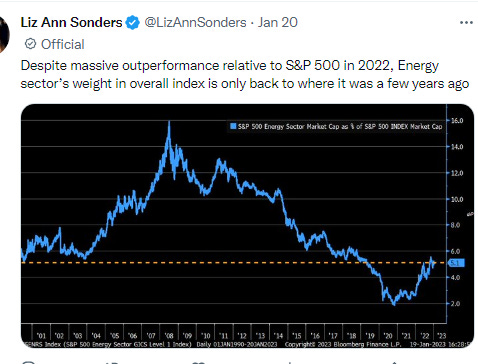
SPX Sectors
After two strong weeks, sector performance last week was overall to the downside although communications (Telecom) really bucked the trend on the back of a very strong Friday with heavyweights Netflix, Google, Disney, and Comcast all up over 3% (Meta was up over 2%). Outside of energy every non-growth sector lost at least -1%:
As you know if you read regularly, my sector theme the last few months as been around a dispersion between sectors (strong vs week).
Ten weeks ago I noted:
We’re starting to see a clearer discrepancy growing between some sectors that are below their 200-DMA and trendlines from the beginning of the year (tech, discretionary, communications, real estate), and others that are above those and are showing strong relative strength (industrials, materials, financials, staples, utilities, and energy).
Since that time, outside of a short consolidation by the leading sectors, not much changed except for utilities which was unable to make headway, and staples and healthcare also started to pull back last week, although they remained above their 200-DMAs. But financials and materials had very good weeks to join industrials, staples, and energy as the clear leaders.
This week, though, we’re seeing more glimmers of potential change as those “weakest” sectors (mostly the growth names plus real estate) outperformed. Now most of them are up to around their 200-DMAs and downtrend lines (communications still has some ground to travel). A break above those would be notable. On the flip side, the “strongest” sectors consolidated this week, but those same five sectors remain the leaders for now. Staples and utilities remain below their 200-DMAs, while health care remains above although has been declining steadily for a month.
In terms of the MACD which is my favorite technical trigger, all of the growth sectors (communications, tech, discretionary), most of the cyclicals (financials, materials, energy (industrials crossed over to a weaker reading), but just one defensive (real estate) are in bullish configurations (“go long” and rising).
And some more charts and tweets on sectors:
Economy
This week on the positive side, we got a better than expected PPI print and continued low unemployment claims. On the negative side we saw a second month of contraction in retail sales (although if you adjust for falling goods prices, it really wasn’t bad) and weak industrial production highlighted by a second month of weak business spending (can’t spin that positively). The housing reports (starts/permits, homebuilder sentiment, and existing home sales) sort of depend on how you look at them. They were mostly better than expected and evidenced some stabilization in the housing market, but the readings were very weak overall (at least compared to the last couple of years).
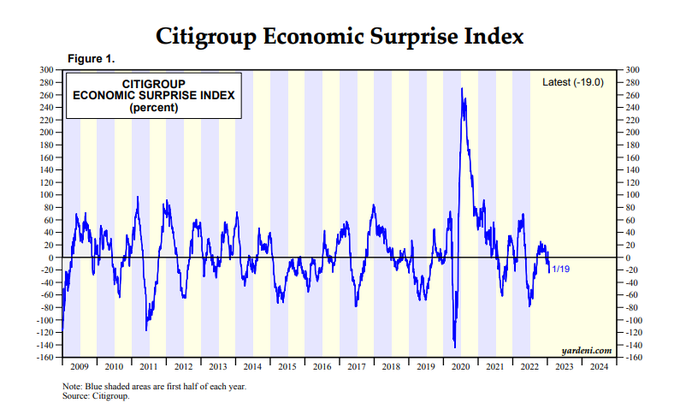
Overall, economic surprises have been deteriorating though.
In addition to goods deflation meaning retail sales weren’t as bad as the headline, as I noted in the report, there’s some question about whether seasonal adjustments are off as December adjusted sales have consistently been weak following the pandemic.
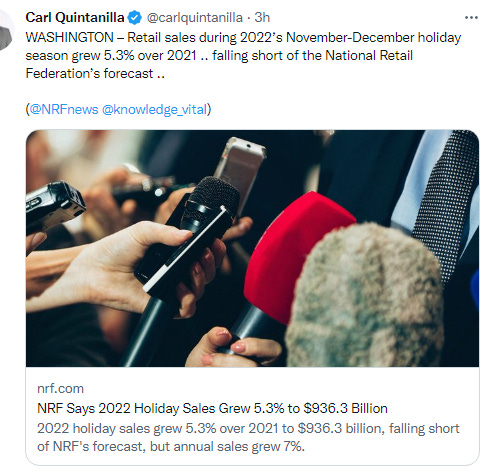
And the NRF found retail sales were up 5.3% y/y Nov/Dec.
And we did get a couple of regional PMI’s.
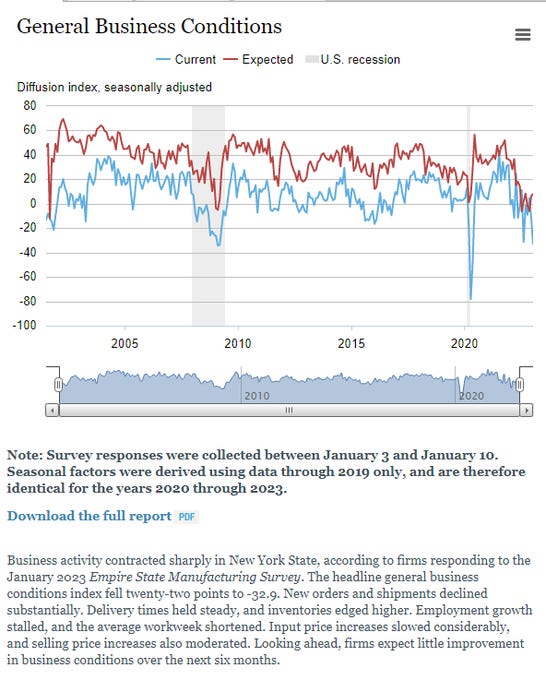
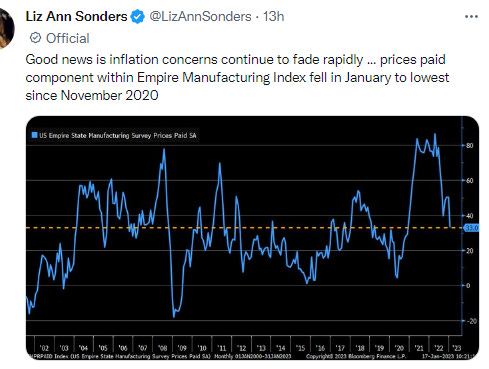
Empire (NY) was notable - it cratered 22 points to its 5th worst reading (and lowest since My 2020). New orders dropped 28 points (to -31), shipments 22 points (to -28), prices 18 (to 33), employment least in 2 yrs, and hours worked negative (indicating a shrinking workweek).
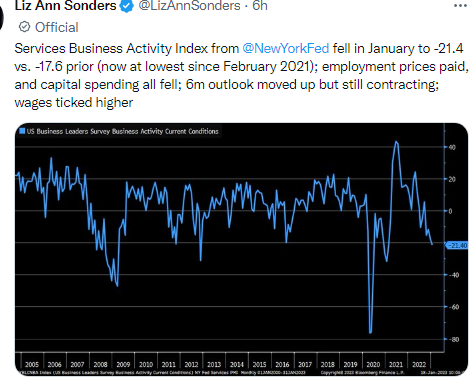
And their services gauge was similarly weak.
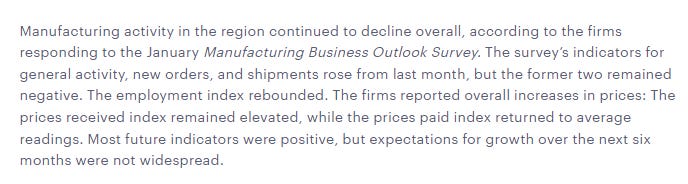
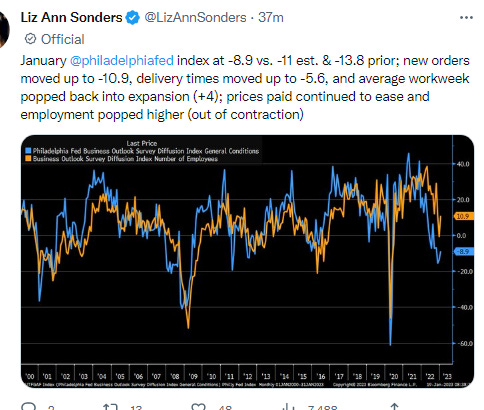
While the Philly Fed Mfg report was also negative, but much less so and unlike Empire beat expectations and improved on December. One constant is that prices paid indexes in both reports softened to around average levels. Hopefully that comes through to consumers soon (if not, it means earnings could continue to come in stronger than expected with margins remaining elevated).
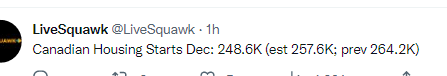
US Philadelphia Fed Business Outlook Jan: -8.9 (est -11.0; prevR -13.7)
And the standard boilerplate on why I care about the economic indicators:
And, again, I follow the economic indicators because stock investing for me (as is probably also the case for most of you) is not my main “job” day-to-day, so I want to be apprised of what’s happening on “Main Street” as much as “Wall Street”. But, also, as I’ve noted too many times to mention, the economy has a direct feed through to stock prices via earnings. Given what you’re buying is a stream of earnings discounted at some multiple, that stream of earnings is pretty important. And every recession has seen actual earnings (not just expectations) decline at least low double digits (even the “mild” recessions and deeper recessions see the -30% or more area). So that’s why it’s important for us to pay attention to whether a recession is coming (unless this time is different). What we’ve seen so far does not qualify as a recession to me (or most economists). But if we do enter into a recession, it’s important to note that not only have stocks never bottomed in advance of a recession, but on average they don’t bottom until nine months after one has started. Of course, we’ve never seen a recession forecast so far in advance as this one, so it’s also possible, like most things this cycle, that you can throw the history book out the window in terms of when the bottom will (or has) occur vis-à-vis the recession starting.
As the Atlanta Fed GDPNow model continues to show strong growth in 4Q although for a second week decelerating.
But the Weekly Economic Index (WEI), an index of ten daily and weekly indicators of real economic activity scaled to align with the four-quarter GDP growth rate, which had fallen for the most part since February until Dec 10th when it started moving higher, getting up to 2.05% in GDP growth over the next 12 months two weeks ago, plummeted this week to +0.87%, just above the meager 0.72% that was forecast four weeks ago (the lowest since March 2021). Its now back below the 13-week trendline. It was 2.35% end of October, 6.16% February 19th (the peak in 2022), and 4.79% a year ago.
And here’s Goldman’s latest.
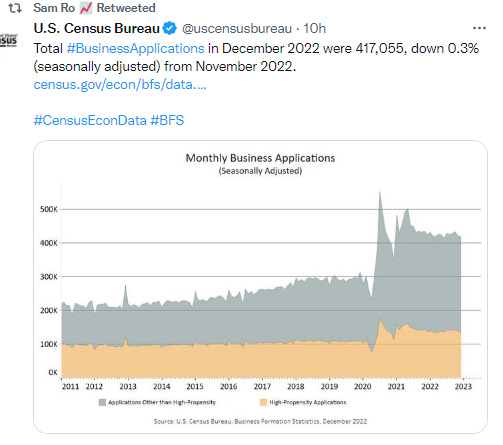
As applications for new EIN’s remain well above pre-pandemic levels.
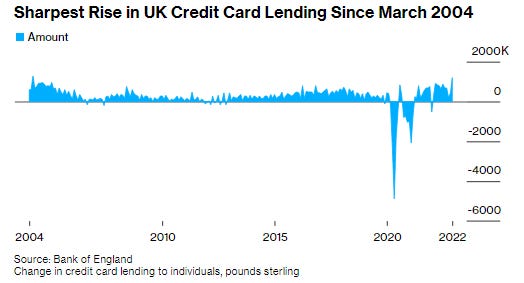
And while rates are soaring on credit card debt.
Overall repayments remain well below pre-pandemic levels as a % of income.
Real Estate
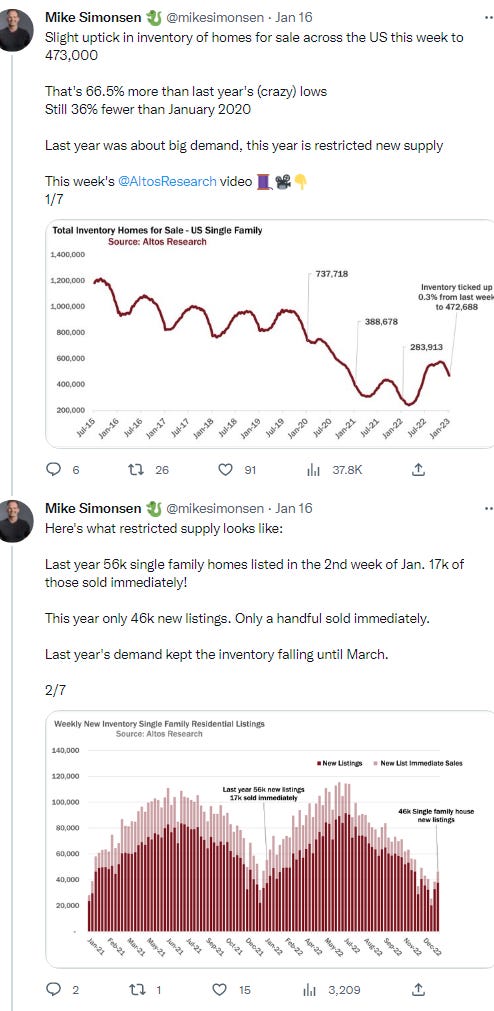
As consistent with the better than expected housing reports this week, Mike Simonsen sees glimmers of the same in his data.
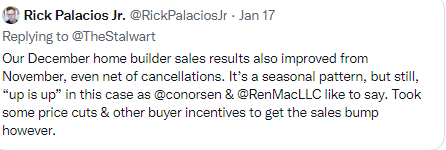
As does Rick Palacios.
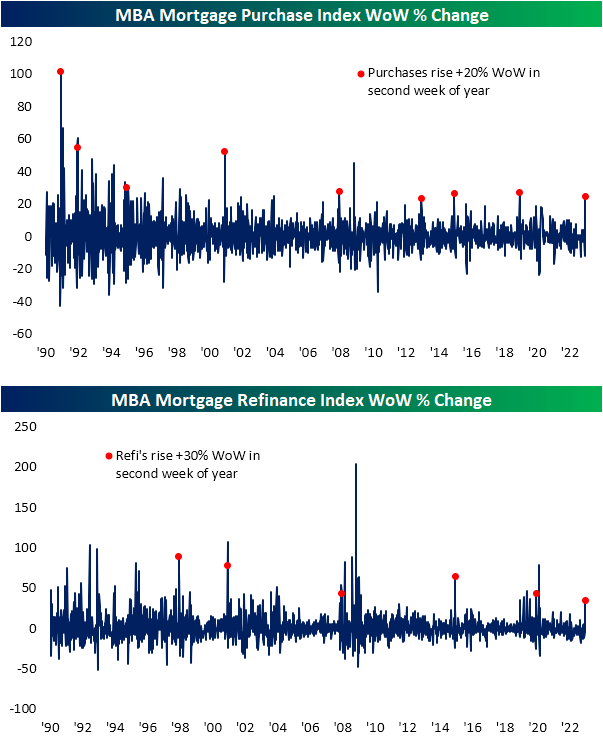
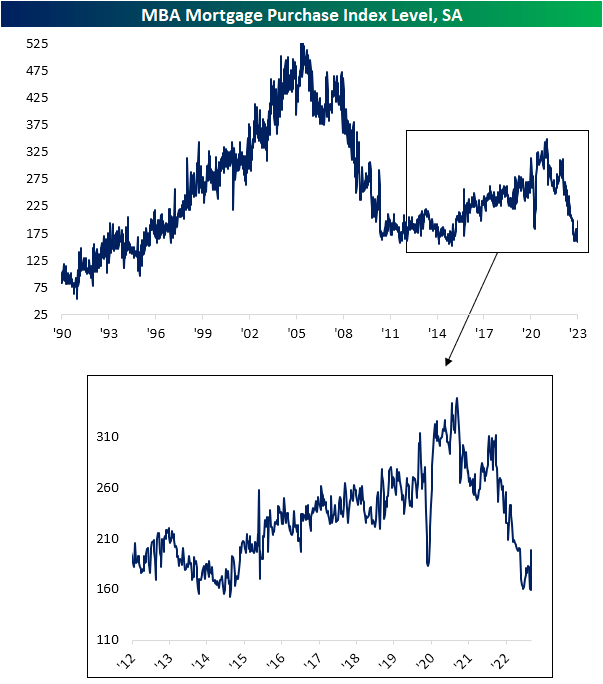
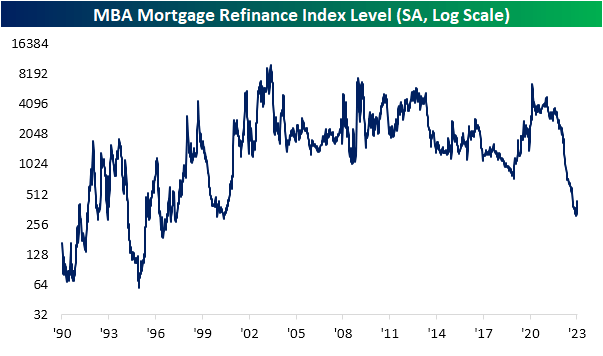
As the weekly MBA Mortgage Applications Index jumped 27.9% with purchase applications rising 25% and refinancing applications increasing 34%. That sounds like a really big jump (and it is the biggest percentage increase since March 2020) until you consider how far they had fallen. Even with those increases they remain down 35 and 81% respectively. You can barely see the uptick on the long term charts. And, as Bespoke noted, it is not unusual. It is something we’ve commonly seen in the second reference week of the year after the holidays, so likely a seasonal adjustment issue more than anything.
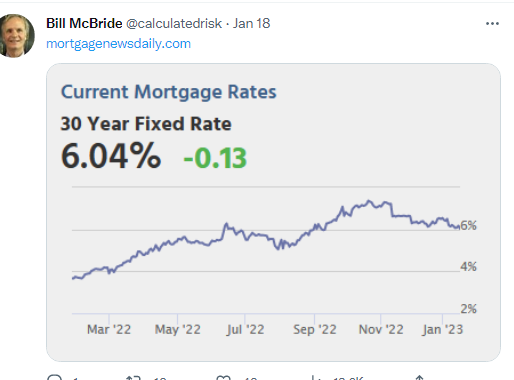
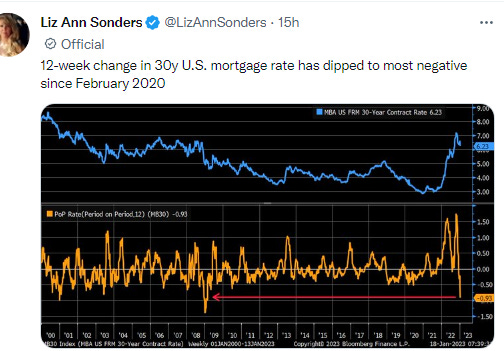
“Mortgage application activity rebounded strongly in the first full week of January, with both refinance and purchase activity increasing by double-digit percentages compared to last week, which included the New Year’s holiday observance,” said Mike Fratantoni, MBA’s SVP and Chief Economist. “Despite these gains, refinance activity remains more than 80% below last year’s pace and purchase volume remains 35% below year-ago levels.” Added Fratantoni, “Mortgage rates are now at their lowest level since September 2022, and about a percentage point below the peak mortgage rate last fall. As we enter the beginning of the spring buying season, lower mortgage rates and more homes on the market will help affordability for first-time homebuyers.” ... The average contract interest rate for 30-year fixed-rate mortgages with conforming loan balances ($726,200 or less) decreased to 6.23 percent from 6.42 percent, with points decreasing to 0.67 from 0.73 (including the origination fee) for 80 percent loan-to-value ratio (LTV) loans.
And since them mortgage rates have continued to trend lower. Now close to a 5-handle.
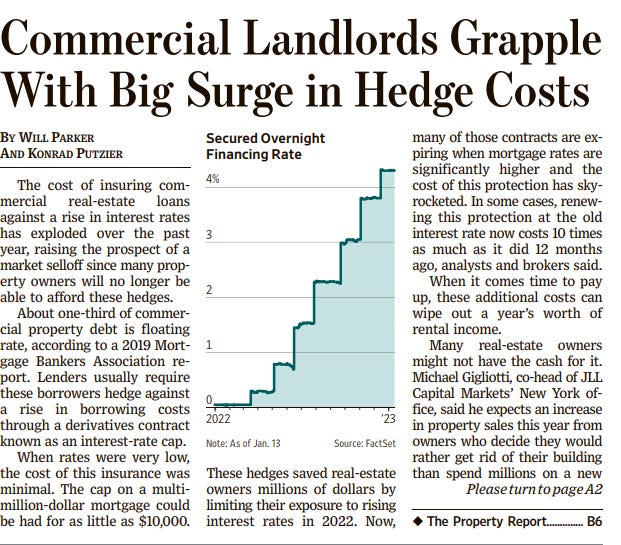
As this is something that I didn’t even realize was a thing (hedging interest rate risk). Makes a lot of sense, although I have a feeling this is to some extent being blown out of proportion in terms of the impact it will have in the big picture.
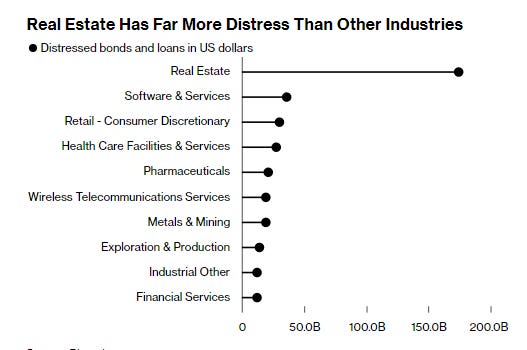
But outside the US distress levels are much higher. BBG.
Distress levels in European real estate are at the highest in a decade, in part because of a decline in liquidity, according to a study by law firm Weil, Gotshal & Manges. UK commercial property values fell more than 20% in the second half of 2022, MSCI Inc. data show. In the US, the drop was about 9%, according to Green Street. Almost $175 billion of real estate credit is already distressed, according to data compiled by Bloomberg — about four times more than the next biggest industry. About one in 10 corporate loans in Europe is already underperforming and showing increased credit risk, according to Jones Lang LaSalle Inc., a real estate broker. “We expect to see some casualties” among UK developers, said Nicole Lux, who studies real estate credit at Bayes Business School. “There will be fire sales.”
Several US banks predict that credit losses will grow this year. In its fourth-quarter results, Bank of America Corp. flagged an additional $1 billion of office property loans with an elevated risk of default or missed payments, while Wells Fargo & Co. expects more stress to emerge in that market as demand weakens. The stress points in commercial property are expected to be at either end of the market: older buildings where the occupier has moved out, and developments that have yet to reach completion.
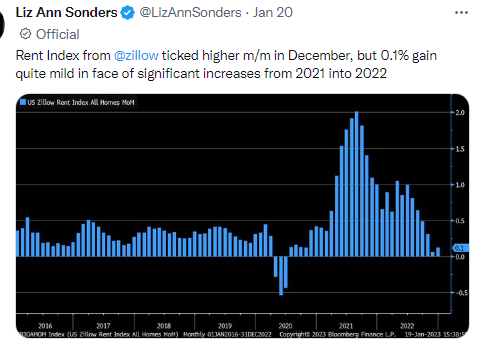
And maybe also getting to a bottom in the rent declines?
Subscribe for free to receive new posts and support my work.
Commodities/Currencies/Bonds
Bonds/Rates/Credit
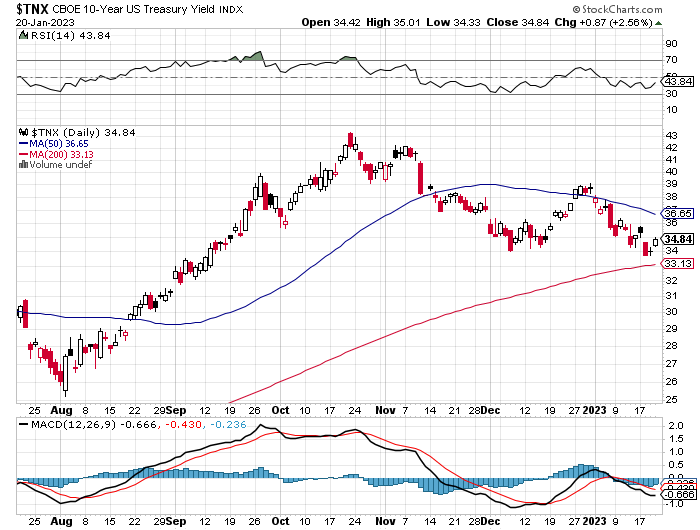
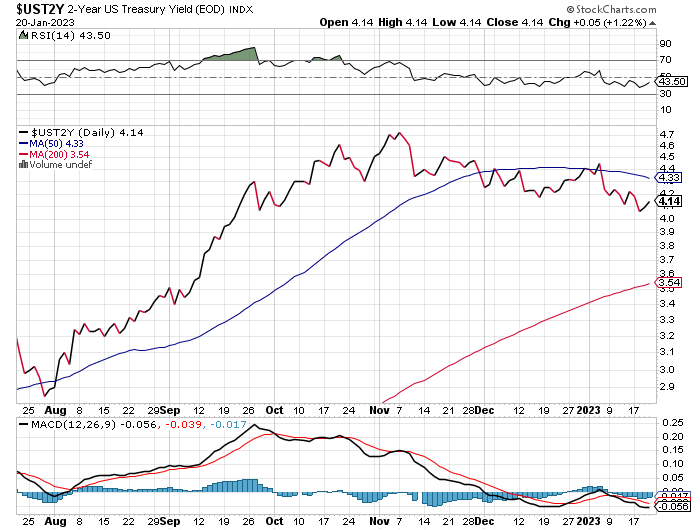
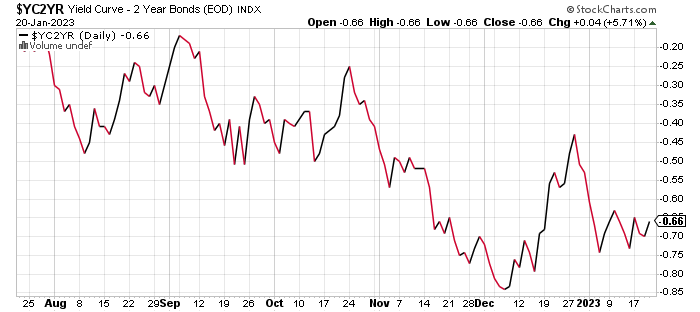
There was no one big event this week unlike the prior couple of weeks, but there was some volatility with yields falling sharply after the “bad news is bad news” on Wednesday discussed already. Yields dropped sharply before recovering somewhat to end the week. The 2-yr Treasury note yield ended the week at 4.20%, while the 10-yr at 3.48%.
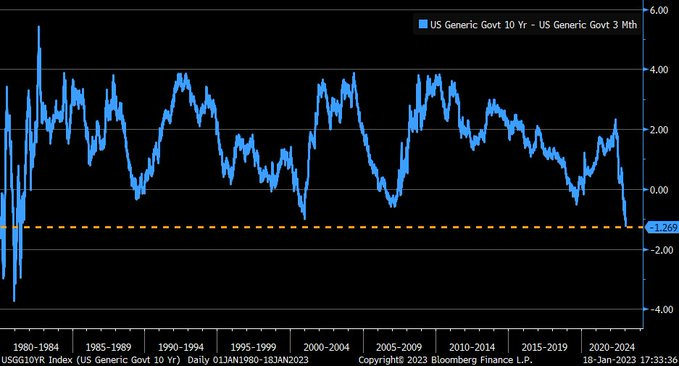
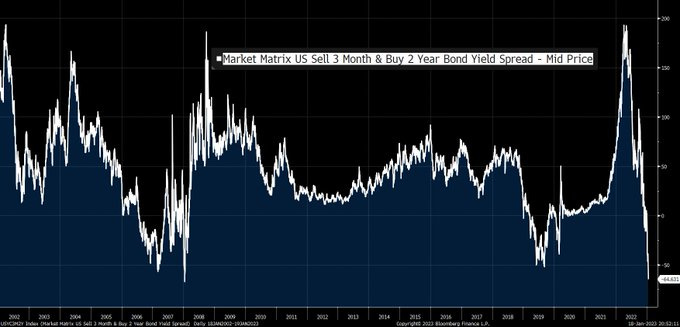
Which saw the 2-10 curve remain inverted but off the most negative levels. The 3 mos/10 yr curve (generally considered a better recession indicator than 2/10), though, moved to new “since-1981” extremes. As short rates will continue to climb until the market is convinced the Fed is done hiking.
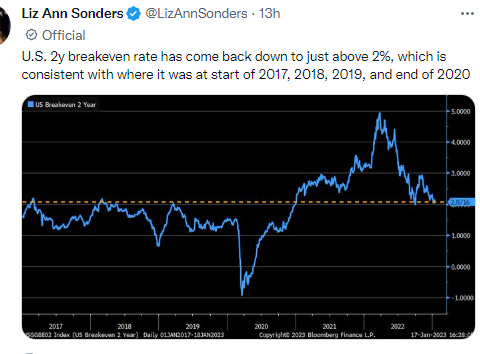
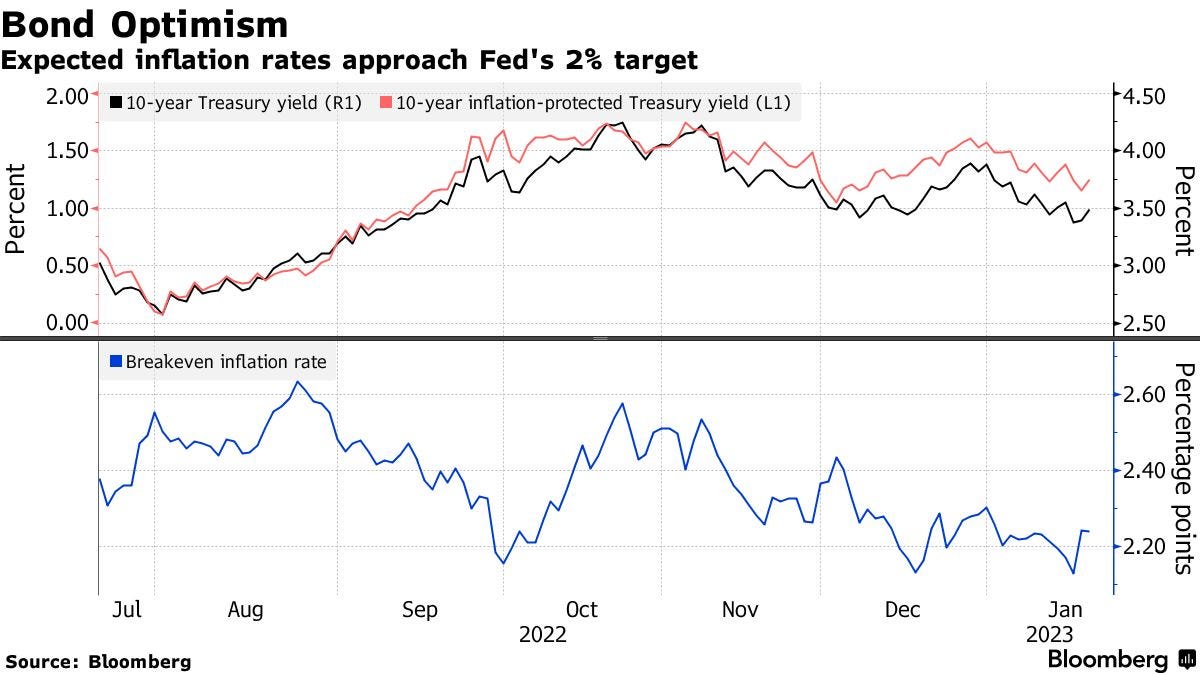
But breakevens do continue to fall.
For 10-year notes, they reached the lowest level of the past year this week, 2.09%. The five-year breakeven inflation rate dropped to 2.13%, within a basis point of last year’s low.
But not all are so sanguine.
Interest-rate strategists at TD Securities this week recommended investors wager on an increase in the two-year breakeven inflation from around 1.95% to to 2.65%. Progress on inflation reflects mainly goods prices, while the growth rate for services other than housing “is likely to be sticky on the way down,” Priya Misra, TD’s head of global rates strategy said in a note. “For months now people have had the conviction that inflation is behind us and so there’s been a big rush into bonds,” said Ben Emons, senior portfolio manager at NewEdge Wealth. If China reopening causes an inflation pop or a recession doesn’t materialize, it’s going to be a problem.
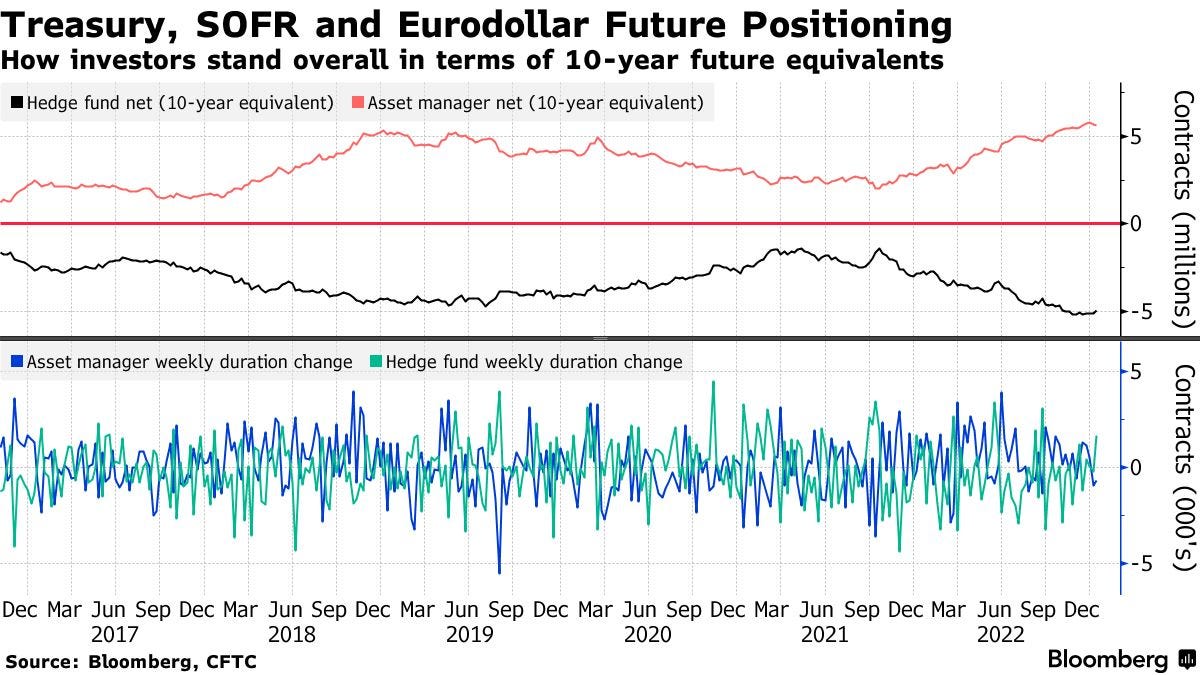
As it looks like some of the strength has been about a short-covering rally. BBG.
Hedge funds rushed to cover their Treasury short positions in the lead up to December inflation data as talks of a brewing recession heat up. The action was on display in futures last week, where a combined 170,000 of 10-year note equivalents were covered by the money managers, the biggest drop in bearish duration wagers since September. Short bets in two- and 10-year note futures were cut the most, as traders started to ramp-up expectations that the Federal Reserve will move to a downsized 25 basis-point rate hike at the February meeting, rather than continuing on the current path of 50 basis-point increases. Most of the short covering from hedge funds took place in two- and 10-year note futures, while the combined paring of short positions across two-, five-, 10- and ultra-long bonds amounted to $18.1 million per basis point in risk. Hedge fund net short in two-year note futures is now the least since October.
I had been saying for much of December that I thought yields were too low if the Fed is going to 5% (something, though, that remains to be seen). I had said I would not be surprised to see the 10-year hit 4% and the 2-year at least 4.75 if not 5%. Remember the 2-year has never peaked below the ultimate terminal rate. The peak in the 2-year so far has been 4.73%. That said, as I noted two weeks ago Bloomberg Intelligence believes if the terminal rate were to be 5.5% their model says fair value on a two-year would be 4.6%. That combined with market expectations that the Fed won’t get over 5% has me starting to think we might have seen the peaks in rates.
As more strategists agree with that view. Bloomberg sees 3% in the 10-year by year-end and Morgan now 3.15%. That would be great, but as of now IDK.
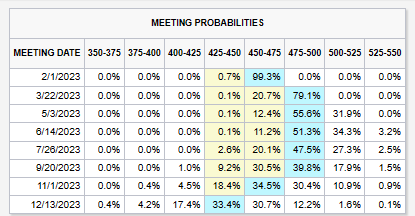
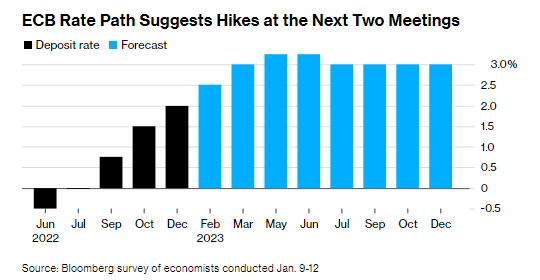
In terms of expectations regarding the Fed, the expected terminal rate pricing remained around 4.9% . They continue to see a peak in March. The first cut though has moved up to November, something I’m sure the Fed didn’t want to see despite their protestations noted below that there will be no cuts in 2023. Also, the February meeting now has a 99% probability for a 25bps hike, so that seems like a done deal (especially after the Timiraos article noted below). In addition, there’s now a net 20% chance of no hike in the March meeting (up from 10% last week).
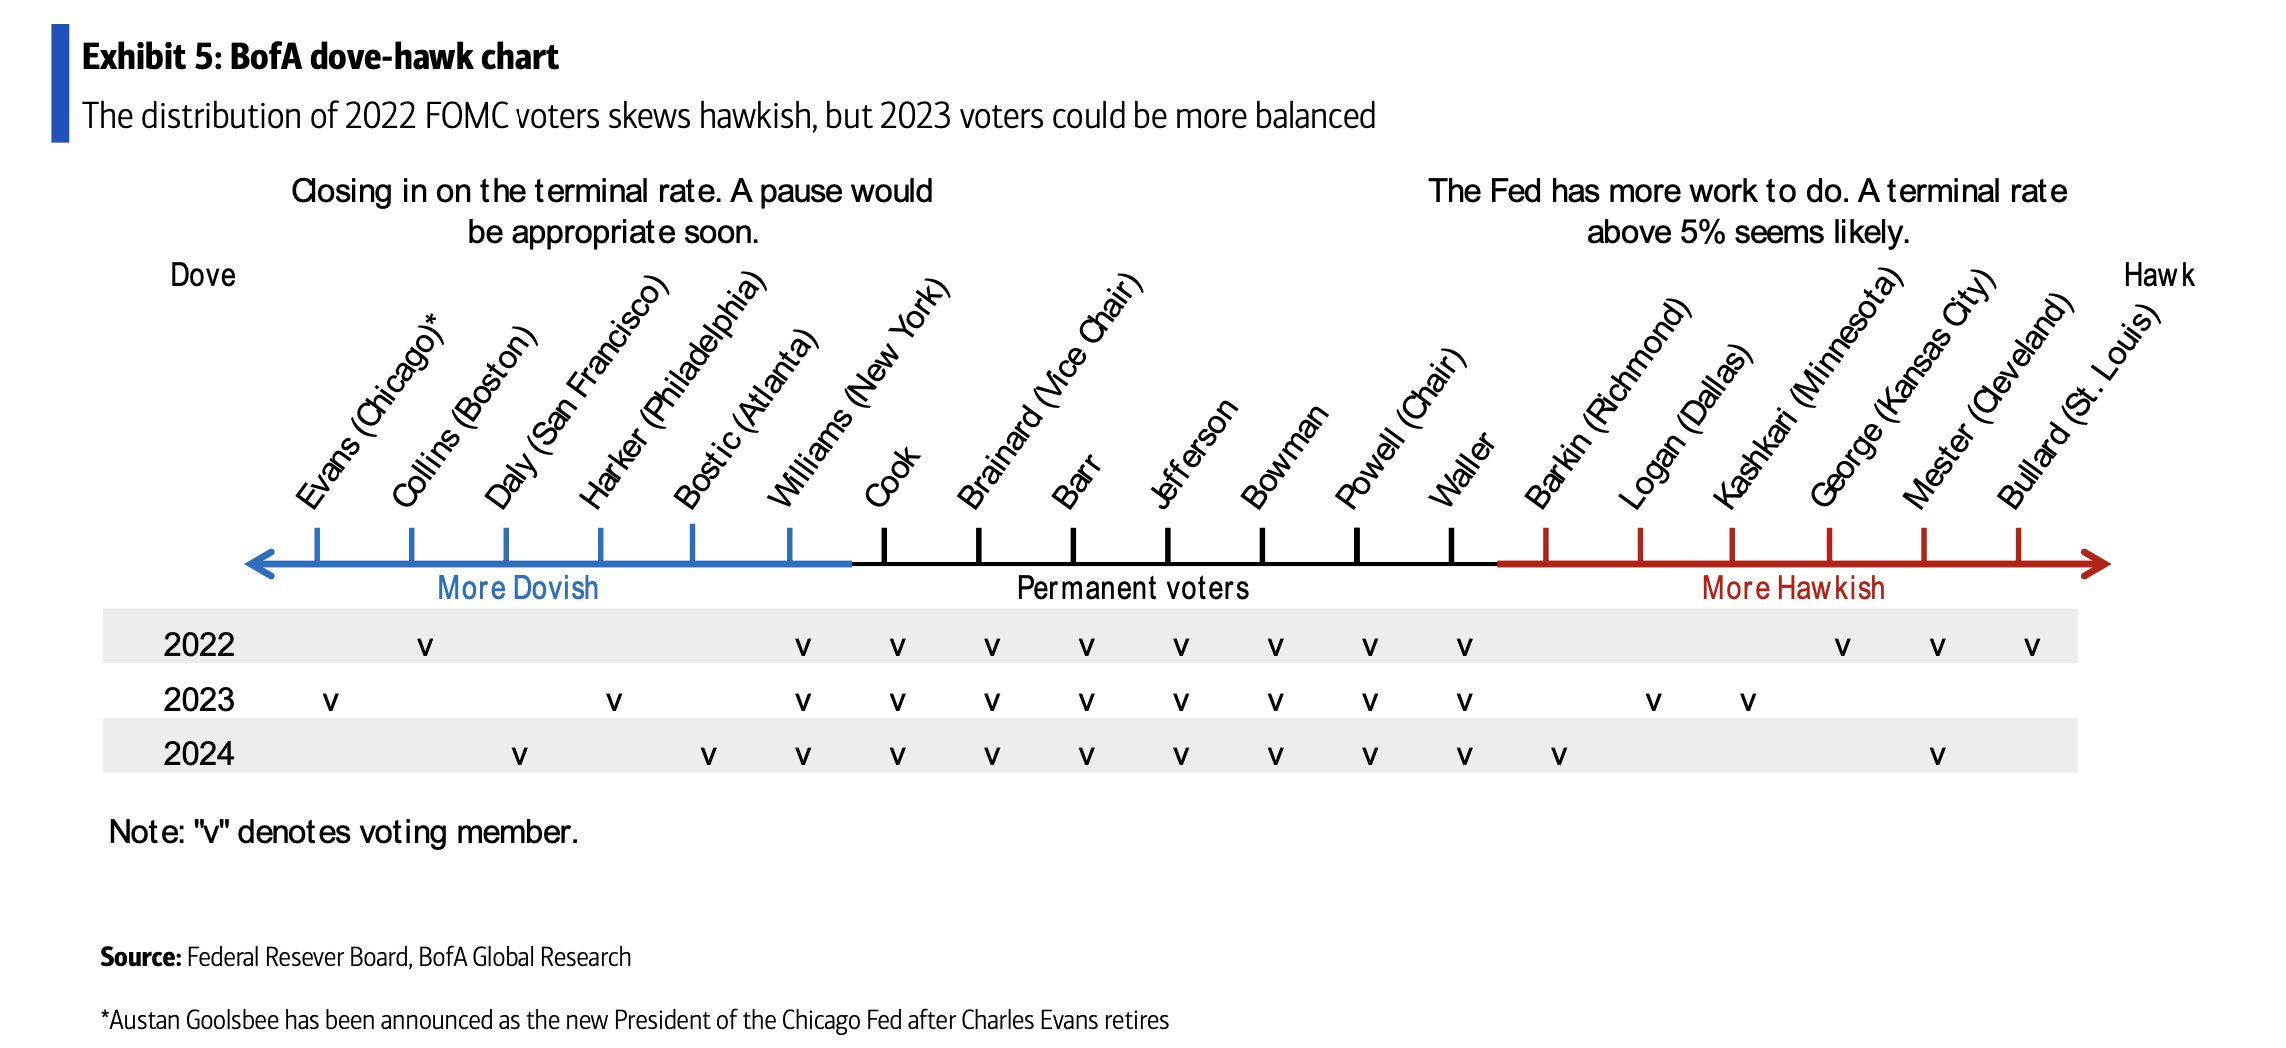
And this was the last week before the blackout period for Fed members to get their thoughts in, so they of course took full advantage. The comments from Brainard and Williams were the ones I focused on (the last bullet) as those are the most important members after Powell on the committee. I also noted that Waller, one of the more hawkish members, is looking for 25bps hikes at this point. He was also the last speaker before the quiet period. I also thought Brainard’s comments about wages not necessarily feeding into core inflation was interesting given her role as the number 2 official. To the extent she can get the Fed off this fascination with needing a higher unemployment rate, I think it would be constructive.
St. Louis Fed President James Bullard said policy is “almost” in restrictive territory but not quite. Policy has to stay on the “tighter side in 2023,” Bullard said in an online Wall Street Journal interview, noting that he penciled in a forecast for a rate range of 5.25% to 5.5% by the end of this year in the Fed’s dot plot of projections. Asked if he would be open to raising rates 50 basis points at the meeting in two weeks’ time, Bullard said, “Yes, why not go to where we are supposed to go, where we think the policy rate should be for the current situation?” “You’d probably have to get over 5% to say with a straight face that we’ve got the right level of the policy rate that will continue to push inflation down during 2023,” St. Louis Fed President James Bullard said Wednesday. “We want to guarantee, to the extent we can, that inflation will come down and get back on a steady path toward the 2% target. And we don’t want to waver in that, because one of the problems in the 1970s is that inflation kept coming back just when you thought you killed it.”
Cleveland Fed President Loretta Mester said in an interview with The Associated Press published Wednesday that the Fed needs “keep going” but didn’t say how big a rate increase she favored when officials meet Jan. 31-Feb. 1. “We’re not at 5% yet, we’re not above 5%, which I think is going to be needed given where my projections are for the economy,” she said. “I just think we need to keep going, and we’ll discuss at the meeting how much to do.” “We’re beginning to see the kind of actions that we need to see,” Mester, president of the Federal Reserve Bank of Cleveland, said. “Good signs that things are moving in the right direction ... That’s important input into how we’re thinking about where policy needs to go.”
Recent US inflation reports have been encouraging, but the rate of increases in prices is still too high to ease off monetary restraint, Federal Reserve Bank of Richmond President Thomas Barkin said (not a voter). “I would want to see inflation convincingly back to our target” before easing up on rate hikes, Barkin said in an interview with Fox Business Tuesday. “You just can’t declare victory too soon.”
Dallas Fed President Lorie Logan and Philadelphia Fed chief Patrick Harker laid out the case on Wednesday for another downshift in the central bank’s tightening campaign when officials next meet. “A slower pace is just a way to ensure we make the best possible decisions,” Logan told an event at the University of Texas at Austin’s McCombs School of Business. “We can and, if necessary, should adjust our overall policy strategy to keep financial conditions restrictive even as the pace slows.” Harker, reiterating comments he made last week, said increases of 25 basis points would be appropriate going forward. “I think we get north of 5 - again we can argue whether it’s 5.25% or 5.5% - but we sit there for a while,” he told an event hosted by the University of Delaware. Logan, in her Austin remarks, also said she would rather risk management be responsive to data than lock in on a specific goal.
Kansas City Fed President Esther George, who is retiring this month, said officials don’t want to raise interest rates by so much that policy becomes overly restrictive and the economy can avoid a sharp downturn. George, whose led the bank since October 2011, is stepping down as required by mandatory retirement rules for Reserve Bank presidents. She won’t participate in the upcoming Federal Open Market Committee meeting on Jan. 31 and Feb. 1. A successor hasn’t yet been appointed. “We are reaching a point I think where it will be important to start looking around corners,” she said.
Federal Reserve Governor Christopher Waller, one of the more hawkish officials at the US central bank, has joined other policymakers in backing another moderation in the size of rate increases when they next gather. “I currently favor a 25 basis-point increase at the FOMC’s next meeting at the end of this month,” Waller said Friday at the Council on Foreign Relations in New York, referring to the rate-setting Federal Open Market Committee. “Beyond that, we still have a considerable way to go toward our 2% inflation goal, and I expect to support continued tightening of monetary policy.” Waller’s speech was the last scheduled public comments before the US central bank enters a quiet period ahead of its Jan. 31-Feb. 1 policy meeting. Other officials have also supported slowing the pace of tightening again amid cooler inflation, including Philadelphia Fed President Patrick Harker, who repeated that message earlier on Friday. “We’ve got to wait and see through the summer how inflation is going,” he said. “If the markets are right and inflation is coming down, and it looks like wages and everything are falling into line, that is great news, I’ve got no problem saying we should think about changing policy.” “We have a different view, that inflation is not going to just miraculously melt away,” he said, adding that the Fed also has to insure that it doesn’t rebound and that means holding rates at a higher for longer to manage that risk. Waller has been a forceful advocate of maintaining restrictive policy and requiring substantial evidence of cooling inflation before easing up on the tightening campaign.
Two senior Federal Reserve officials said the central bank was making progress in its inflation fight, but it would take time to bring inflation back to the Fed’s 2% target. Fed Vice Chair Lael Brainard indicated in remarks Thursday she was supportive of slowing the pace of rate rises to a more traditional quarter percentage point at the central bank’s next policy meeting, which is Jan. 31 to Feb. 1, joining a number of colleagues. New York Fed President John Williams said at a separate event Thursday evening he was encouraged by signs interest-rate increases were having their desired effect in slowing growth and keeping consumers’ and businesses’ expectations of future inflation in check. “We are seeing the shifting gears of tighter monetary policy having the desired effects,” he said during a speech to bond market analysts in New York. But, he added, “we still have a ways to go to get” the Fed’s policy rate “to the level that I think is sufficiently restrictive to achieve our goals.” Mr. Williams and Ms. Brainard serve as senior advisers to Fed Chair Jerome Powell as part of an inner circle that helps shape the policy-making agenda ahead of Fed meetings. “Even with the recent moderation, inflation remains high, and policy will need to be sufficiently restrictive for some time to make sure inflation returns to 2% on a sustained basis,” Vice Chair Lael Brainard said Thursday at an event hosted by the University of Chicago Booth School of Business. The moderation “will enable us to assess more data as we move the policy rate closer to a sufficiently restrictive level, taking into account the risks around our dual-mandate goals,” Brainard said. “I think what’s important here is not what happens at each meeting but I think we’ve still got a ways to go,” Williams said. “This is a period where we’re getting a lot of new information.” “It is likely that the full effect on demand, employment, and inflation of the cumulative tightening that is in the pipeline still lies ahead,” Brainard said. “That said, there is uncertainty about the timing and magnitude.” She also is one of the few officials who is offering a different perspective on the labor market. “It remains possible that a continued moderation in aggregate demand could facilitate continued easing in the labor market and reduction in inflation without a significant loss of employment,” Brainard said Thursday. To the extent that non-wage costs “may have been responsible in part for important price increases for some nonhousing service sectors, an unwinding of these factors could help bring down nonhousing services inflation,” she said. The key question for the Fed, Ms. Brainard implied, is whether the price of services such as restaurant meals, car repairs, and hotel stays are rising because of cyclical factors such as tighter labor markets or, instead, whether they went up due to the surge in energy and commodity prices and the supply-chain bottlenecks that sent up the prices for many goods in 2021 and early 2022 but are now fading. Some Fed officials are uneasy about tighter labor markets because they fear inflation could continue to run well above the Fed’s 2% target if employees can bargain for bigger raises that keep paychecks and prices rising in lockstep. But Ms. Brainard’s speech reflected more skepticism about the potential for such a wage-price spiral to develop given the Fed’s aggressive rate rises last year.
And here are a couple of cheat sheets that I’ll keep up for the time being.
Brainard’s decision not to push back against the undue easing of financial conditions linked to the rebound of US equites was a tacit endorsement of the rally in Treasurys and one of the reasons our conviction is high that the 10-year sector won’t revisit the >4% zone for any meaningful period of time, if at all, during 2023. — Ian Lyngen and Ben Jeffery, BMO
And from Nick Timiraos on the upcoming Fed decision. WSJ.
Federal Reserve officials are preparing to slow interest-rate increases for the second straight meeting and debate how much higher to raise themafter gaining more confidence inflation will ease further this year. In recent public statements and interviews, Fed officials have said slowing the pace of rate increases to a more traditional quarter percentage point would give them more time to assess the impact of their increases so far as they determine where to stop. Most Fed officials projected in December the rate would rise to a peak between 5% and 5.25%. That would imply two more quarter-point increases after the likely bump next month. Investors in interest-rate futures markets expect the Fed to make two more quarter-point increases—at the coming meeting and again at the Fed’s subsequent meeting in mid-March, according to CME Group. Officials could use their postmeeting statement on Feb. 1 to indicate they expect to continue raising rates as they probe where to pause. But they are unlikely to provide precise guidance because coming decisions will depend heavily on new data about the economy. Some could call for delaying any pause if the economy doesn’t weaken much in the months ahead. They think the time between when the Fed raises rates and when they slow the economy is relatively short and the economy will soon feel the worst of any policy-induced slowdown. Others could argue for a somewhat earlier pause, believing the effects take longer to play out or could be more potent.
And a few weeks ago I started looking at shorter term spreads to look at the overall implied Fed Funds path. In that respect the 3mos/2yr has gotten the most inverted since 2019 (when the Fed was actually cutting rates) and before that 2007-2008 which was also around the start of rate cuts. (Joe Weisenthal)..
And the Fed’s Beige Book had some optimism about inflation. BBG.
Growth in US prices is expected to ease in the year ahead, contacts surveyed in the Federal Reserve’s latest Beige Book said. “Selling prices increased at a modest or moderate pace in most districts, though many said that the pace of increases had slowed from that of recent reporting periods,” the Fed said Wednesday in the report, published two weeks before each meeting of the policy-setting Federal Open Market Committee. “On balance, contacts across districts said they expected future price growth to moderate further in the year ahead.”
The survey showed that employment continued to grow at a modest-to-moderate pace in most districts. “Many firms hesitated to lay off employees even as demand for their goods and services slowed and planned to reduce headcount through attrition if needed,” the survey stated. “With persistently tight labor markets, wage pressures remained elevated across districts, though five Reserve Banks reported that these pressures had eased somewhat.”
But the survey also indicated growth concerns. “On balance, contacts generally expected little growth in the months ahead,” according to the Beige Book, which noted that overall activity was relatively unchanged since the prior report.
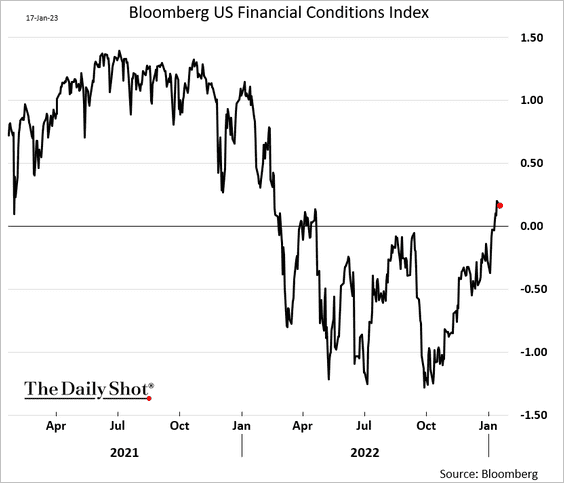
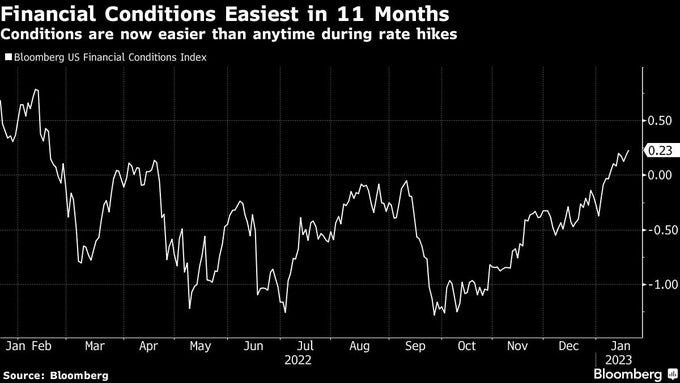
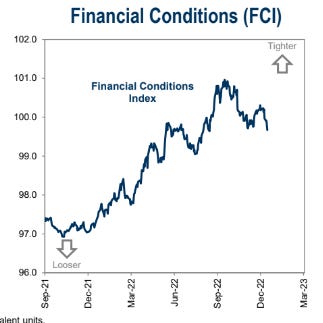
As financial conditions continue to ease.
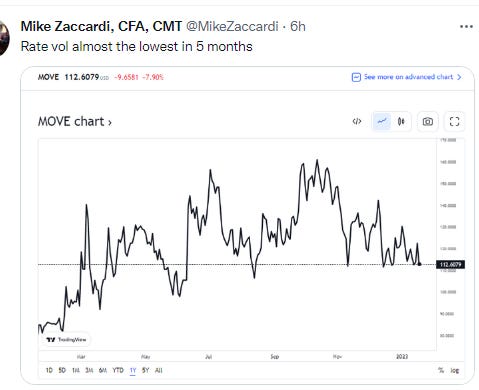
As rate volatility has come in considerably from the highs, but remains elevated (and likely will for the time being due to low liquidity).
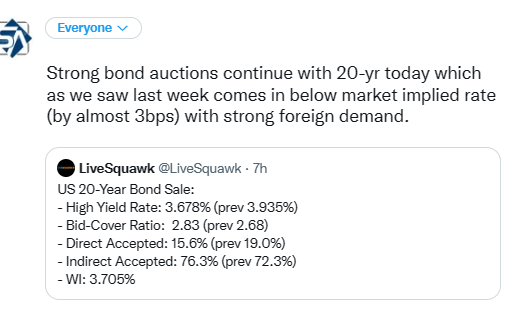
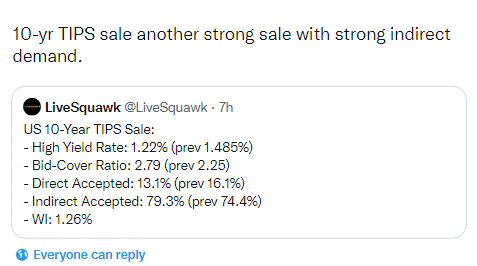
And more solid bond auctions this week with increasing foreign demand.
Thursday’s auction 10-year Treasury Inflation Protected Securities, or TIPS. The auction drew a yield of 1.22% — about 4 basis points below it was trading at the bidding deadline, a sign demand exceeded expectations. Primary dealers were awarded a record low share of 7.6%, sidelined by customer bids. Total bids were 2.79 times the amount on offer, the highest ratio since 2019.
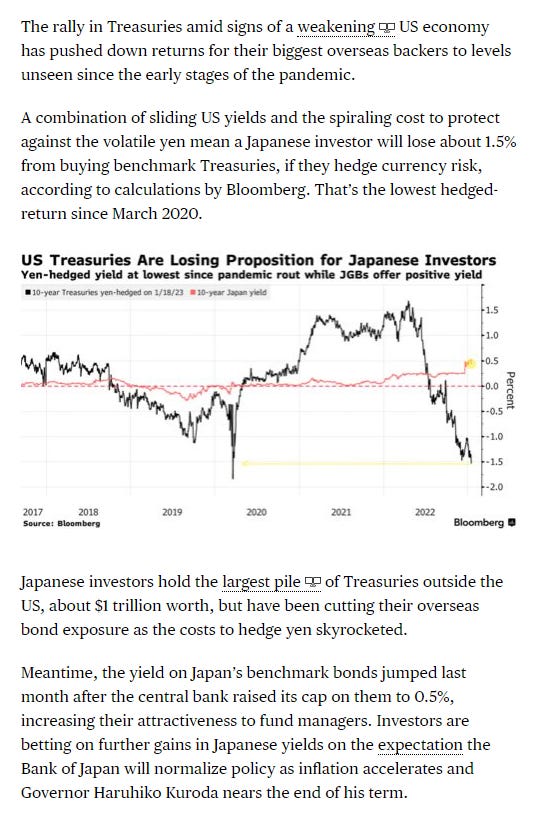
And that’s despite returns to Japanese investors falling towards recent lows.
But it is consistent with overall strong flows into bond funds discussed at length in the Flows section.
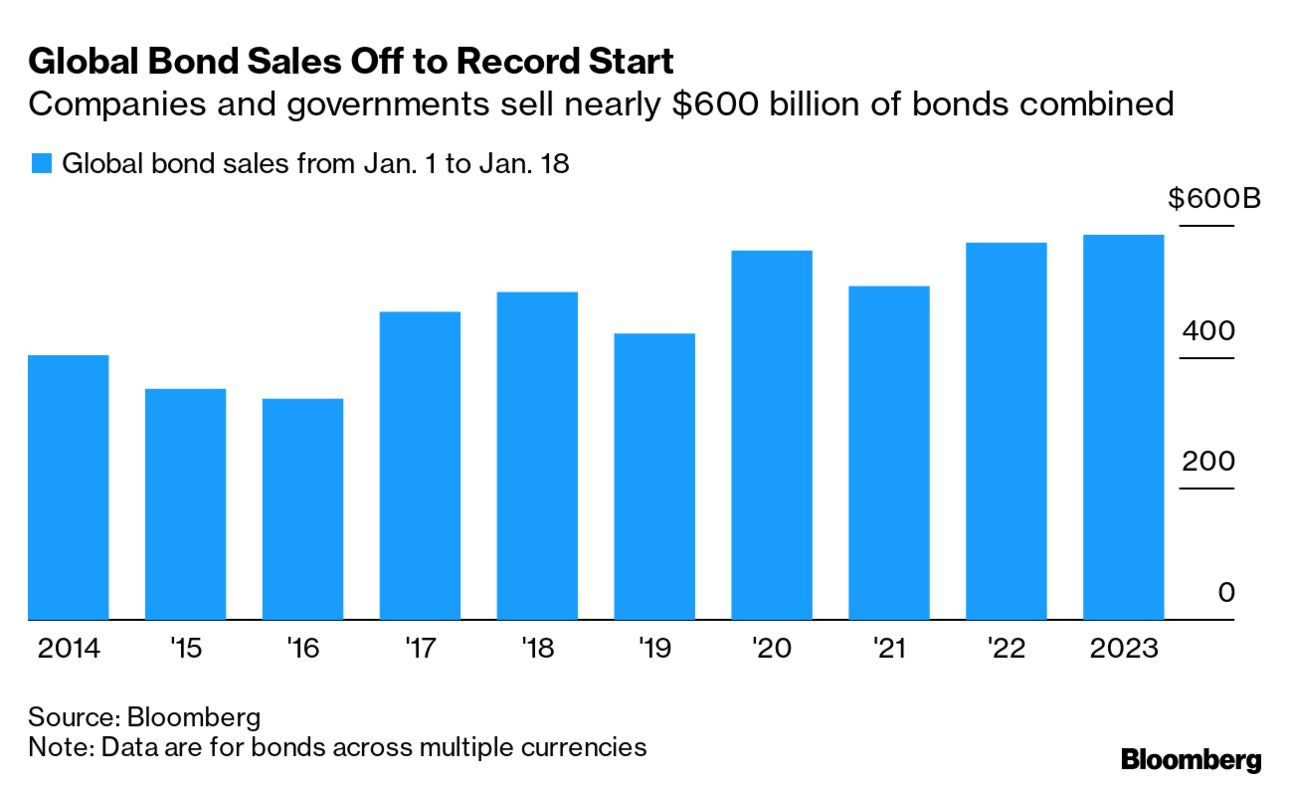
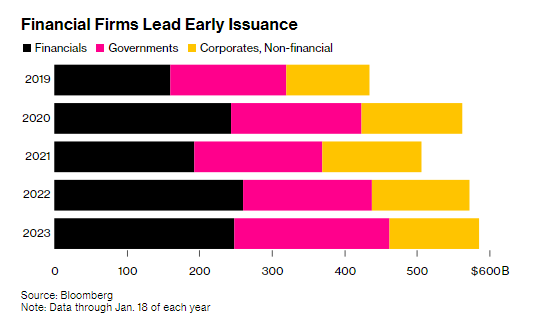
BBG - The best start to a year for bond returns is helping fuel an unprecedented debt-sale bonanza by governments and companies around the world of more than half a trillion dollars. Borrowers looking to raise fresh financing after getting turned away for much of 2022 are suddenly encountering investors with a seemingly endless appetite for debt amid signs inflation is cooling and central banks will call a halt to the harshest monetary tightening in a generation. Excess demand for offerings, falling new issue concessions and the largest inflows into high-grade US credit in more than 17 months has helped make this year’s January borrowing so far the busiest ever.
Global issuance of investment- and speculative-grade government and corporate bonds across currencies reached $586 billion through Jan. 18, the biggest tally on record for the period, according to data compiled by Bloomberg. More issuers were pricing deals on Thursday. US investment-grade credit spreads hit their tightest in nine months this week, while in Europe they were the lowest since May. At 123 basis points in the US, they are far from highs of about 200 basis points typically seen during recessions. Bloomberg Intelligence forecasts US investment-grade bonds will return 10% this year after their worst performance in half a century in 2022. That’s more than double their forecast for US junk debt, as higher-quality notes often benefit more than junk when economies slow. Emerging-market and investment-grade euro-denominated credit should advance 8% and 4.5% respectively, according to the analysts.
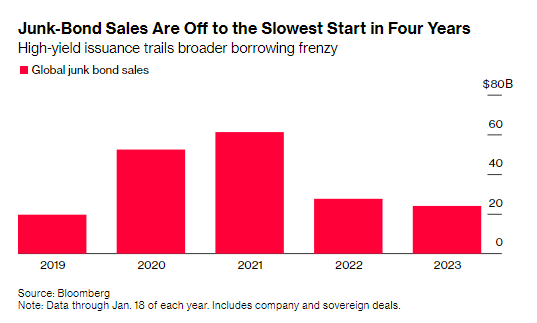
Financial firms have led the charge in global issuance this year as a sector, with year-to-date sales topping $250 billion. In Europe, sales from banks are already at the highest on record for any single month with over €100 billion ($108 billion) of new bonds, according to data compiled by Bloomberg. But offerings from high-yield corporate and government issuers are running at the slowest pace since 2019, with about $24 billion priced through Jan. 18. Sales of notes with a three-year tenor or less have climbed more than 80% to $138.5 billion from the same period just two years ago, after yields surged in 2022. By contrast, issuance of bonds with maturities of 10 years or more has slipped.
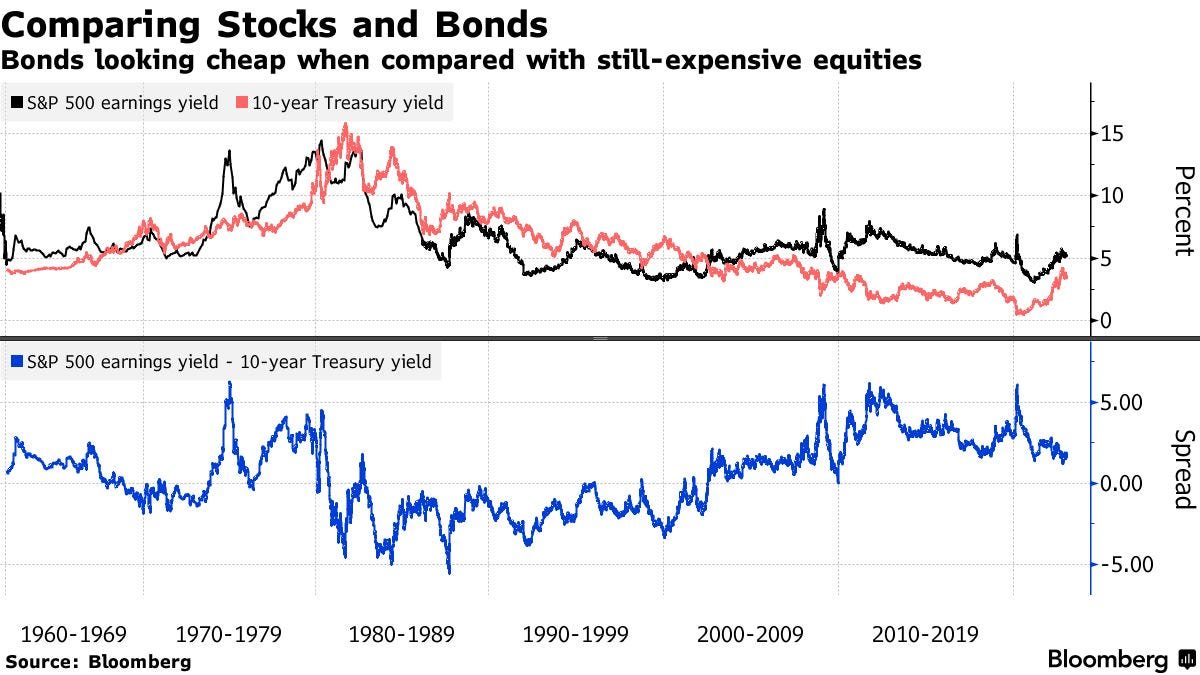
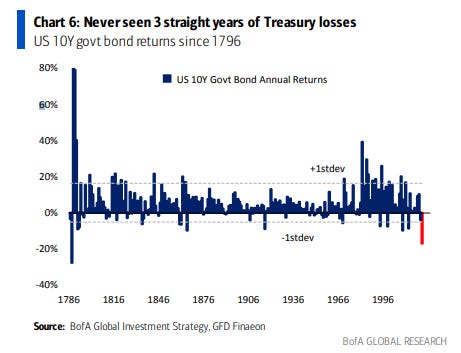
And despite the recent run, bonds continue to look inexpensive compared with equities. BBG.
A rough comparison of yields suggests the recovery in Treasury prices has room to run when viewed next to a still-expensive equity market. The $32 billion iShares 20+ Year Treasury Bond exchange-traded fund (ticker TLT) has climbed 6.7% in 2023, and just logged a 50-day advance that topped 12.5% — something that in the past has occurred only when a recession is close at hand or fears over one are high, according to Nicholas Colas,co-founder of DataTrek Research. Even after 2022’s historical selloff, the so-called Fed model — which plots the S&P 500’s earnings yield against the yield on 10-year Treasuries — shows that the S&P 500 “pays out” roughly 5.2% in earnings, versus roughly 3.5% on the benchmark US bond. That’s close to the slimmest advantage for stocks in the past decade. “The bond market is demonstrably cheap to the stock market,” DoubleLine Capital’s Jeffrey Gundlach said on a recent webcast hosted by his company. “I recommend not a 60/40 portfolio, but more like a 40/60 portfolio, or even a 60/25/15 portfolio — bonds, stocks and then other things in the 15%.”
And of course, there’s this reason to be optimistic.
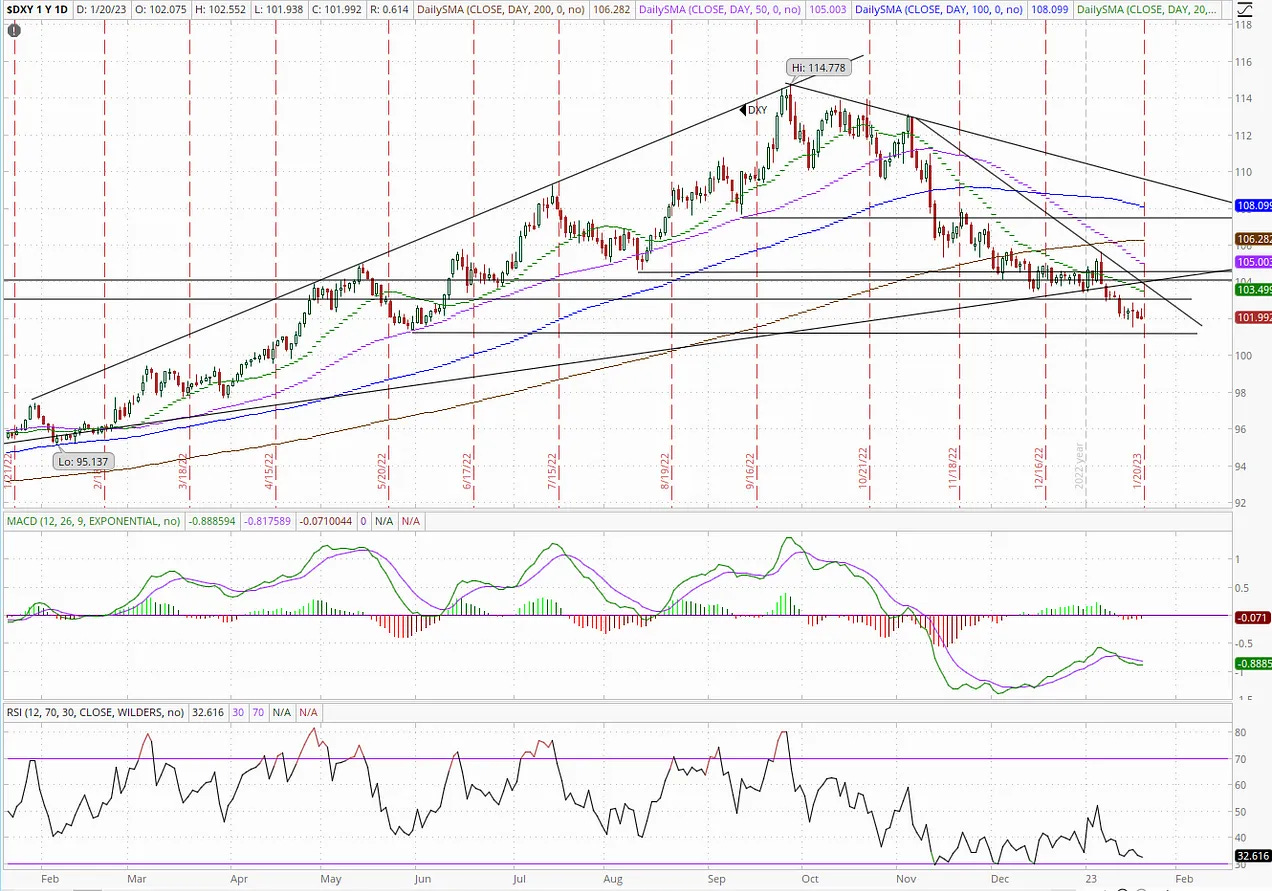
The dollar finished the week at a 6-month closing low, and slightly below 102 for the first time since last June although by less than a cent. Seems though like it’s trying to form a short-term bottom in this area. A lot of resistance overhead though, and for now the overall trend is down.
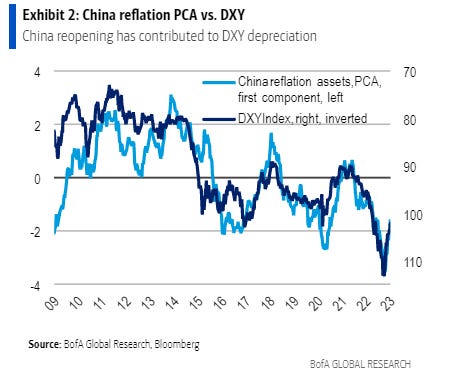
And according to Bank of America Corp. strategists, who tracked a measure of Chinese “reflation assets” against a dollar index, the correlation between the two, which has tightened since November, suggests sentiment around China’s emergence from Covid-19 lockdowns will continue to move the greenback. “The recovery in China reflation sentiment has likely been an important driver of dollar depreciation, potentially more than US rates which have not fallen much,” wrote strategists Adarsh Sinha and Janice Xue in a note dated Tuesday.
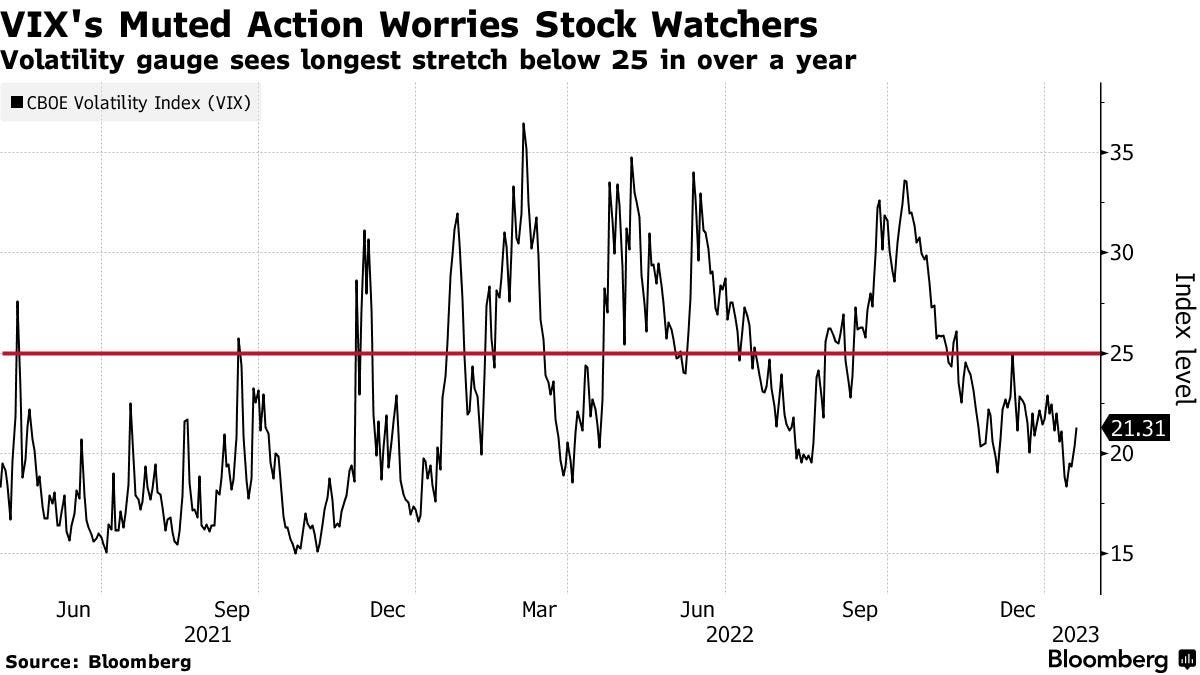
VIX
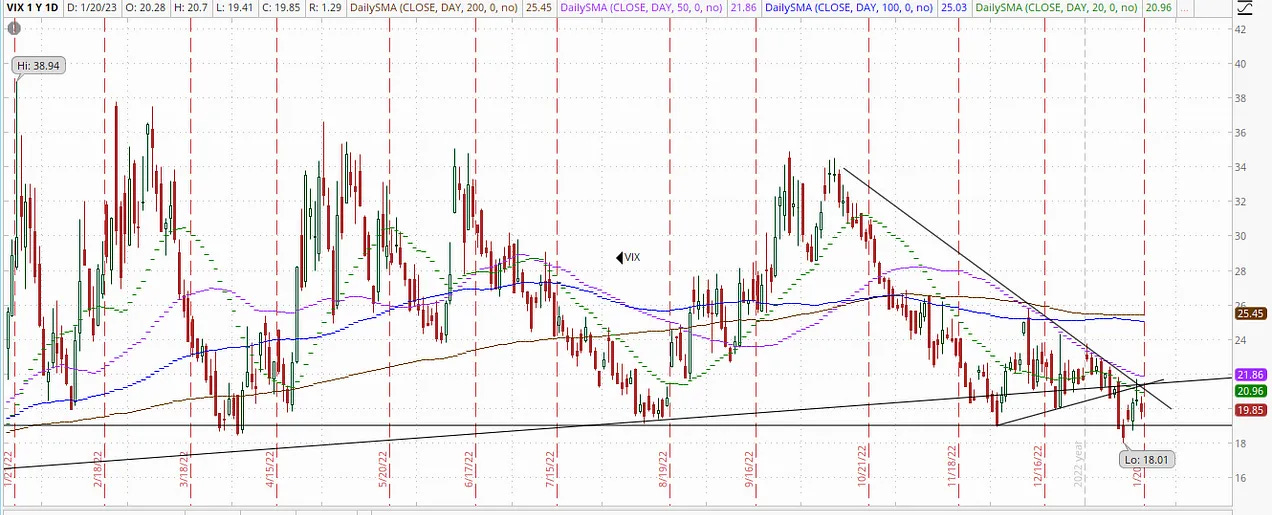
I noted last week it had fallen to the lowest in a year, perhaps setting up for a bounce. And a bounce is what we saw to start the week before it failed at the downtrend line although did end the week higher than it started.
As longer term (VIX is 30-day volatility) remains below 2022 levels.
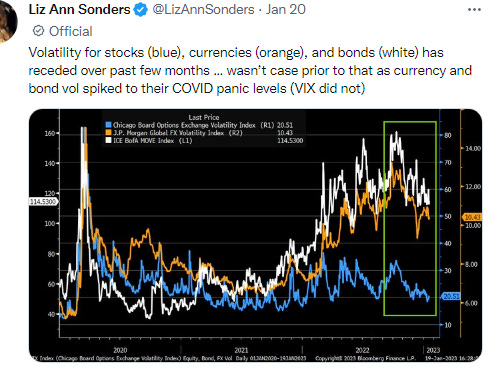
And it’s not just stock volatility that has come in. Hopefully this will mean things will be a little less volatile going forward, although market liquidity in all of these markets remains low so it’s likely to remain elevated for now.
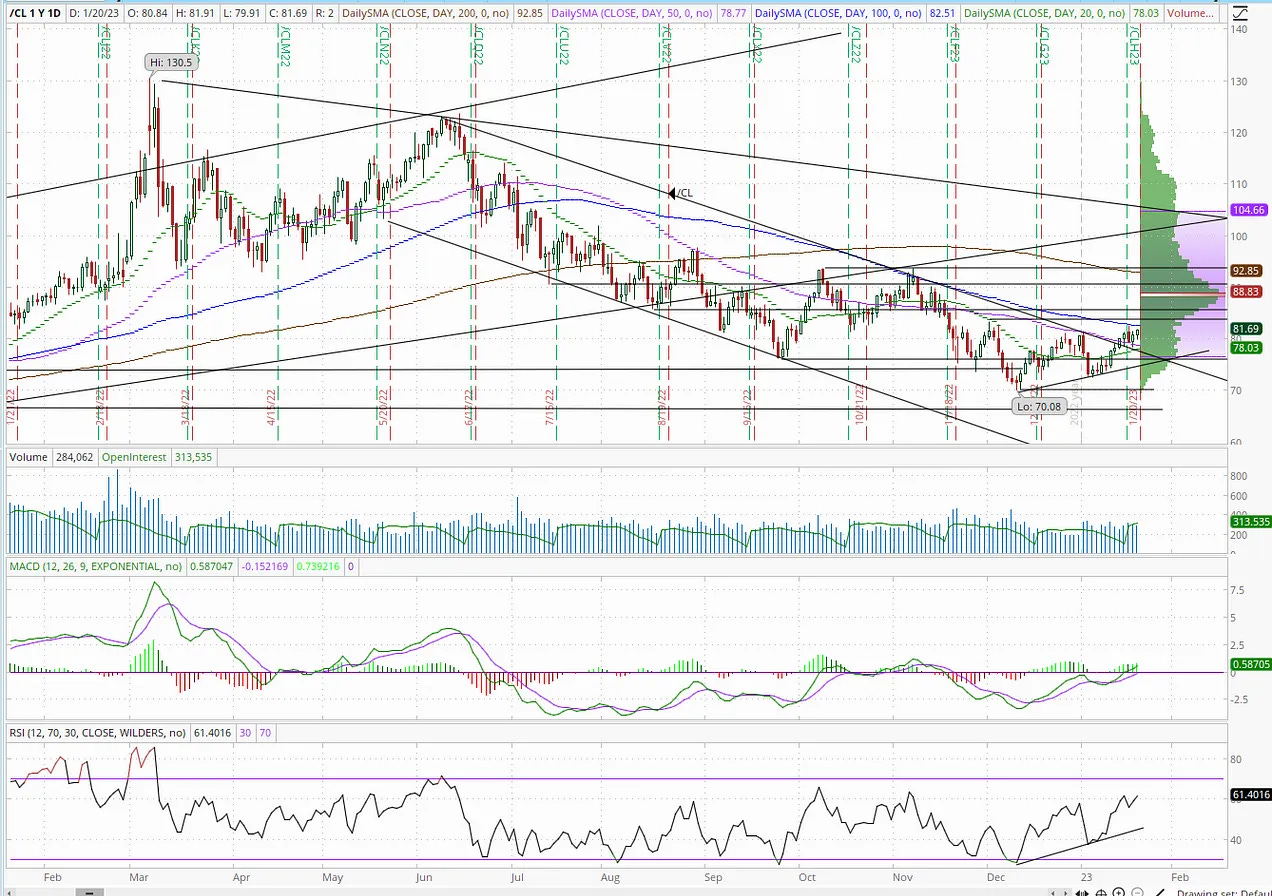
Crude (/CL)
I noted a week ago that WTI had gotten through resistance setting up a run to the $83 level as my next target. It made it there Wednesday, and I said we’d either see a pullback or short consolidation. I said “for now, I think it has a decent chance to move through that resistance. If not it might pull back to the uptrend line.” And while Thursday it consolidated remaining between the 100-DMA (above) and 50-DMA (below), but Friday it moved back to the top of the range and closing at the highest level since November. Still remains below the 100-DMA but the daily technicals remain positive.
“Over the near term, rising product exports and directionally improving consumer demand will continue to support strong Chinese refinery runs and crude imports,” RBC Capital Markets analyst Michael Tran wrote in a note to clients.
Goldman Sachs Group Inc. reiterated its case for higher crude prices. Commodity markets are now pricing in a recession “that we don’t believe is going to materialize,” the bank said in a Jan. 16 note.
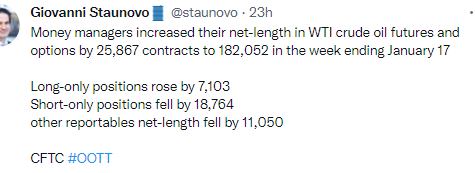
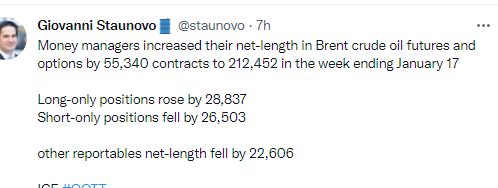
And after taking a week off money managers were back to buying although a lot was short covering.
But overall positioning remains historically (last 10 years) very low. Coming into the week net positioning (longs vs shorts) was in the 21st percentile of all years since 2013.
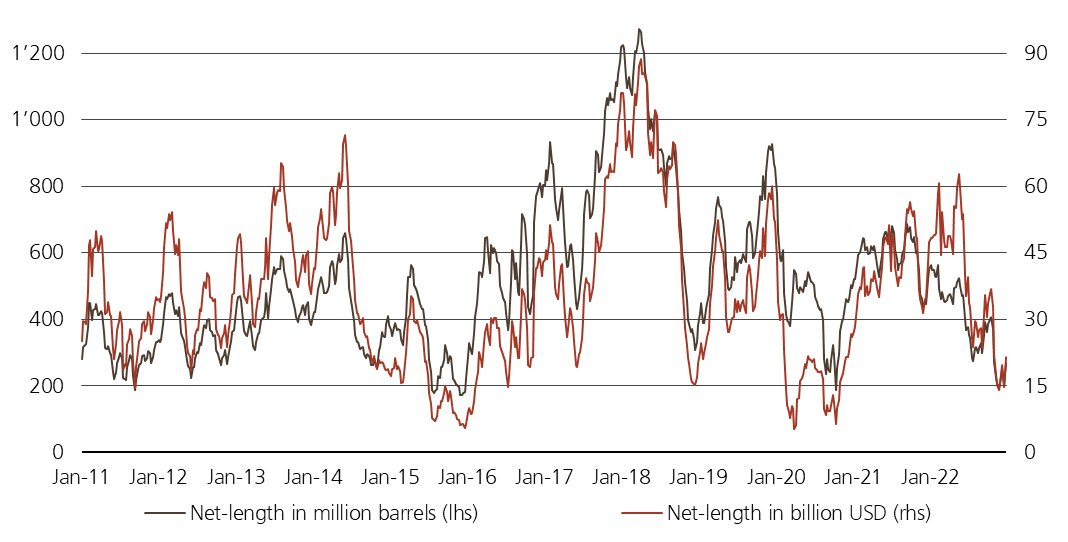
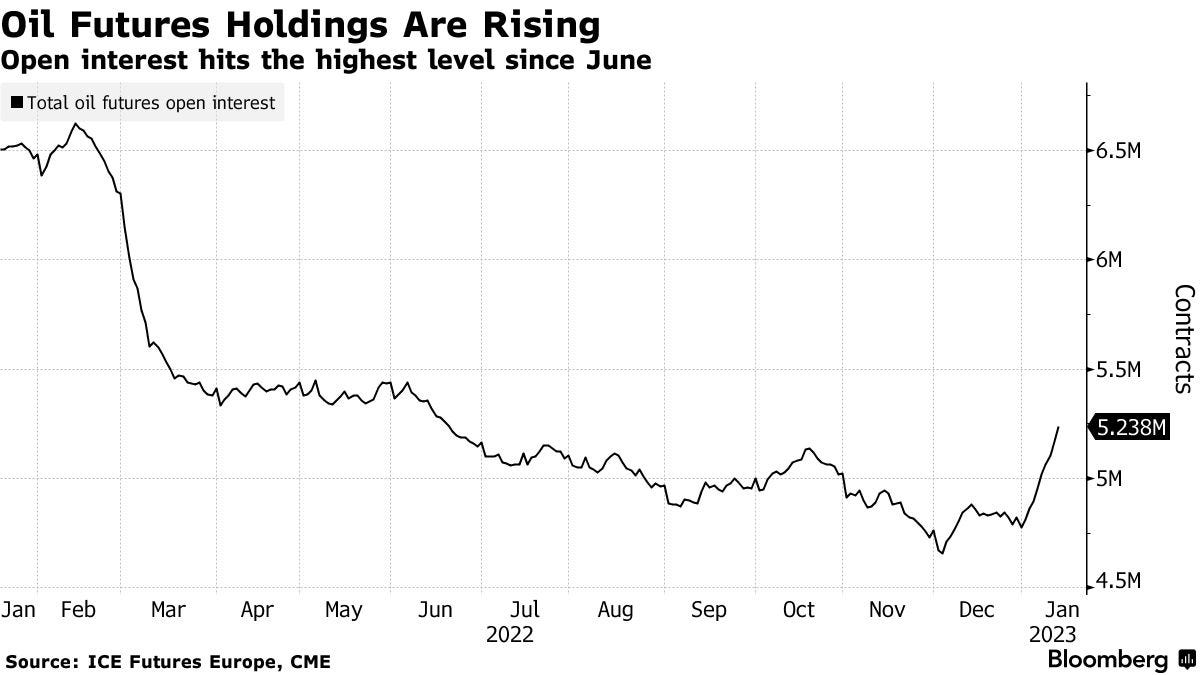
And open interest also improves off of 7-year lows but remains way below pre-pandemic levels.
BBG - The number of oil futures contracts held by traders rose to a six-month high, buoyed by optimism that China’s reopening of its economy will spur extra demand for raw materials. Total open interest, as it is known, rose to 5.24 million contracts in the most recent data, the highest since June 20. Holdings are up by about 10% so far this year. A lack of liquidity has plagued oil markets since traders rushed for the exits in the aftermath of the price spike toward $140 a barrel that followed Russia’s invasion of Ukraine.
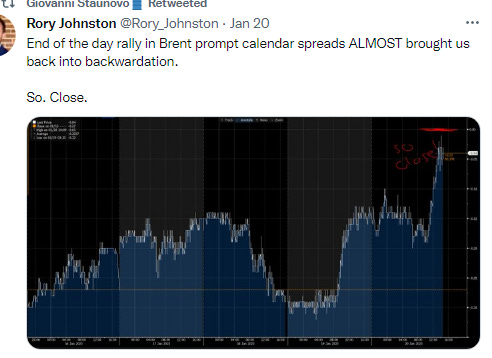
And a more bullish posture was also evidenced by calendar spreads which almost got back to backwardation for the prompt month. Rory also reported that the net positioning across the petroleum complex saw the largest increase since April 2020.
But while positioning is extremely low in crude it’s more full in distillates where bullish long positions outnumber bearish short ones by a ratio of 3.89:1 (64th percentile for all since 2013). For crude it is 2.82:1 (21st percentile).
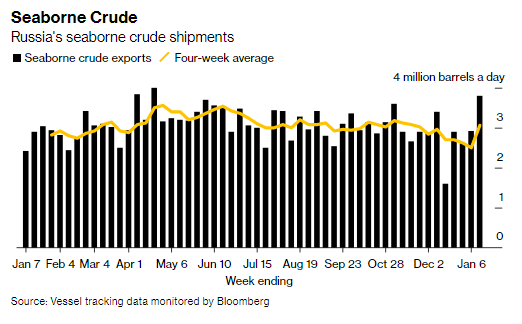
And below is why Russian barrels will continue to flow despite all of the various restrictions (once they are imported into a country and processed they are no longer “Russian” products).
And that was evident in Russian exports last week hitting the highest level since April. BBG.
Suggesting that the country has -- for now -- overcome an initial hit to flows that followed European sanctions. Aggregate volumes of Russian crude rose by 876,000 barrels a day, or 30%, to 3.8 million in the week to Jan. 13. Baltic shipments were up by 626,000 barrels a day from the previous week, while those from the Black Sea and the country’s Pacific ports also expanded. The data are highly volatile, depending on the timings of when individual shipments depart and things like weather conditions and work at ports. The country is increasingly reliant on its own ships and a so-called “shadow fleet” of usually older ships owned by small, often unknown companies that have sprung up in recent months. European-owned tankers can still carry Russian crude, as long as it is sold at a price below a $60 a barrel cap, introduced at the same time as the import ban. But fewer are now doing so. The volume of crude on vessels heading to China, India and Turkey, the three countries that emerged as the only significant buyers of displaced Russian supplies, plus the quantities on ships that are yet to show a final destination, jumped in the four weeks to Jan. 13 to average 2.84 million barrels a day. That’s up by 504,000 barrels a day from the period to Jan. 6, and the highest since Bloomberg began monitoring the flows in detail at the start of 2022.
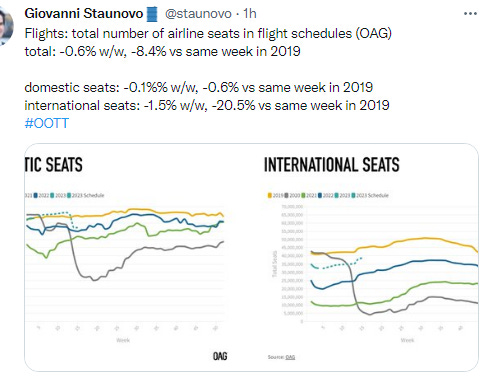
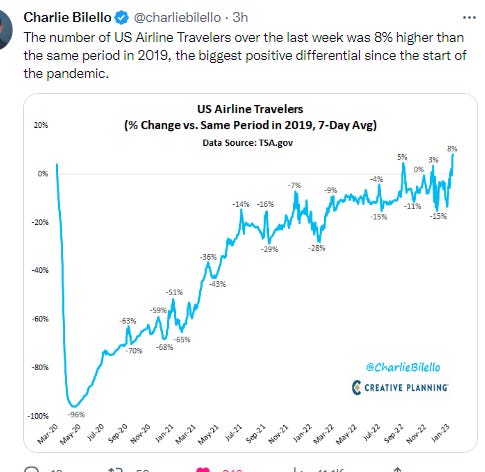
And while domestic flights have recovered to 2019 levels, international remains 20% below. China accounts for a large part of that, but not all of it.
But in the US it’s back.
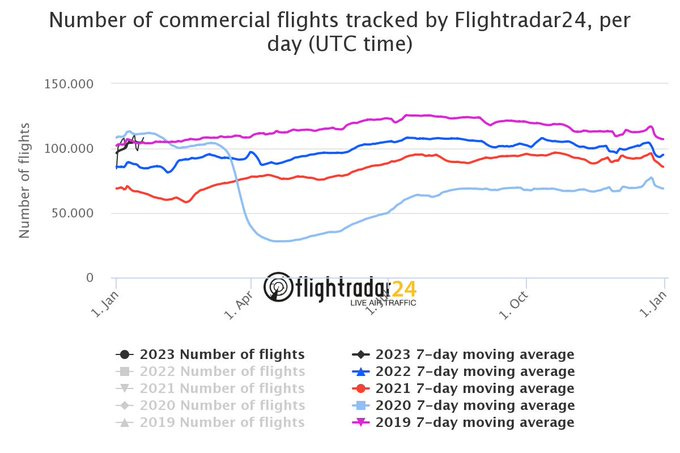
And according to this tracker, total flights are back to pre-pandemic levels.
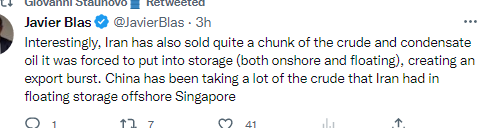
As China is using those export quotas.
And it’s not just Russian oil that China has been buying more of.
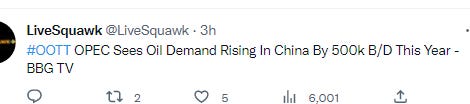
As OPEC sees a 0.5mbd increase in demand from China this year.
But remains cautious not raising its overall demand forecast. WSJ.
The Organization of the Petroleum Exporting Countries, in its closely watched monthly market report, warned Tuesday that China’s reopening could be bumpier than expected and pointed to risks, such as a flare-up in Covid-19 cases, that could delay a rebound in crude demand. The Vienna-based oil producers’ group kept its forecasts for global oil-demand growth steady for the second month in a row. Its forecasts for global economic growth this year were also left unchanged for a third month, though OPEC revised slightly higher its expectations for the economies of Europe and the U.S.
The cartel expects global oil-demand growth will slow this year to 2.2 million barrels a day, from 2.5 million barrels a day in 2022. It expects global oil-demand to average 101.8 million barrels a day this year, compared with 99.6 million barrels a day in 2022.OPEC’s cautious outlook stands in contrast to that of many oil analysts and some investors, who are betting that China’s reopening will be a key factor that could see oil-demand rebound and push oil prices higher this year after several months in the doldrums.
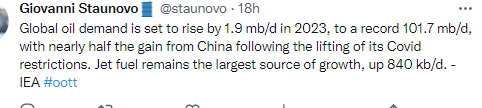
But the IEA is one of those upgrading their 2023 global demand outlook.
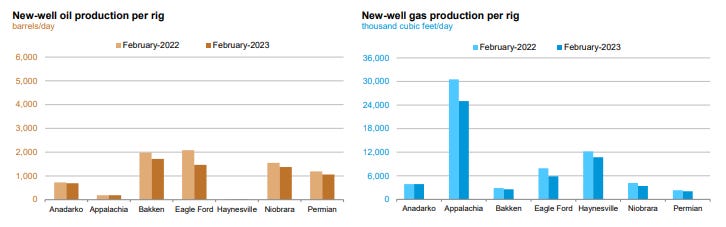
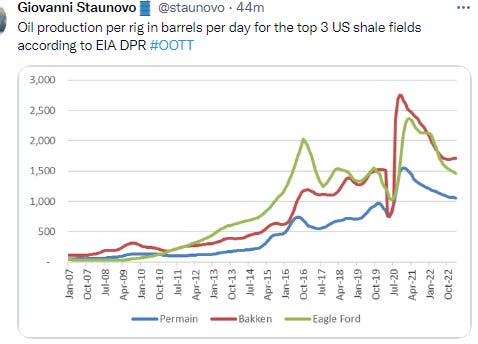
And I’ve noted previously that one of the headwinds to production growth is that the best drilling spots have been drilled at this point, so production of new wells should start to decline. This is from the most recent EIA report.
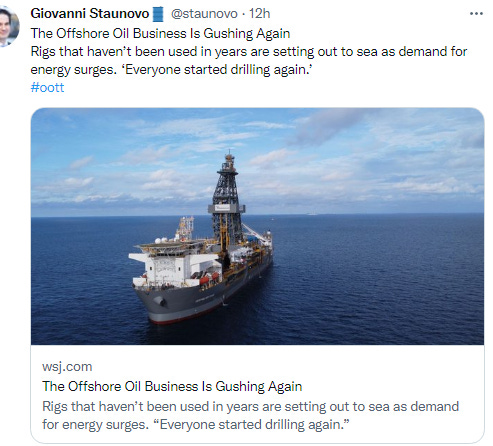
Which is why continued investments are necessary. And a lot of that now is offshore.
Of roughly 600 rigs worldwide that were available to lease for offshore projects in December 2022, about 90% were working or under contract to do so, according to research firm Westwood Global Energy Group. That was up from roughly 63% five years earlier. “[W]e basically have full utilization of the high-end drillship fleet,” said Noble Chief Executive Robert Eifler. Many new offshore bets are gravitating to South America and the Mideast. The Atlantic Ocean coastlines of Brazil, Guyana and Suriname are bristling with drillships due to a big production push from Brazil’s national oil company as well as several significant oil finds made in neighboring waters in recent years. Saudi Arabia and the United Arab Emirates are each relying heavily on offshore drilling to increase their oil production capacity by 1 million barrels a day as of 2027, bringing their totals to 13 million and 5.5 million, respectively. As much as 80% of Saudi Arabia’s new capacity will come from offshore sources, according to research firm Evercore.
But with respect to that IEA upgrade, as I’ve mentioned numerous times take any estimates from the IEA with a big grain of salt.
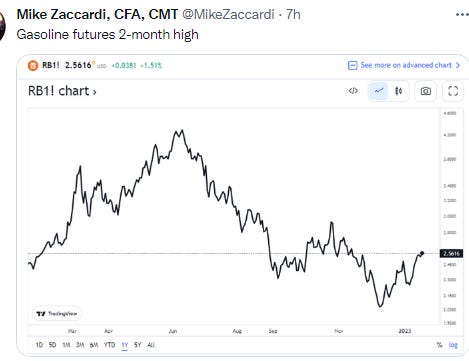
As gas prices continue to creep higher.
And we could see prices move higher temporarily on supply disruptions from Canada. SA.
Multiple oil pipeline outages across western Canada have disrupted petroleum flows to the U.S. and global markets, Bloomberg reported Friday. Canada is a major supplier of crude to U.S. refiners, and the supply disruptions have raised prices for the low-sulfur grades produced by Canadian upgraders.
As well as from the continued issues with refining as noted in the weekly EIA report. There is also a lot of scheduled refinery maintenance this spring as refiners catch up. RTRS.
U.S. oil refiners plan twice as many refinery overhauls this spring as usual, aiming to resume maintenance delayed by the pandemic and by the lure of record-high margins, according to data provider IIR Energy and Reuters reporting. The size of the planned outages suggests supplies of gasoline and diesel could tighten and margins rise as the European Union's Feb. 5 ban on imports of Russian petroleum products takes effect, increasing the call on U.S. fuels. At least 15 U.S. oil refineries plan maintenance ranging from two to 11 weeks through May, tallies by Reuters and refining intelligence firm IIR Energy show. By mid-February, U.S. refiners will drop some 1.4 million barrels per day of processing capacity, double the five-year average, according to IIR. "A lot of plants didn't want to shut down last year when margins were strong, but they have to get this work done," said John Auers, refining analyst with Refined Fuels Analytics. Fuel-producing margins have crept higher on the outages. The gasoline crack spread is hovering around $26 per barrel, $5 higher than a year ago. Heating oil margins are $58 per barrel, more than double the year-ago level.
Nat Gas (/NG)
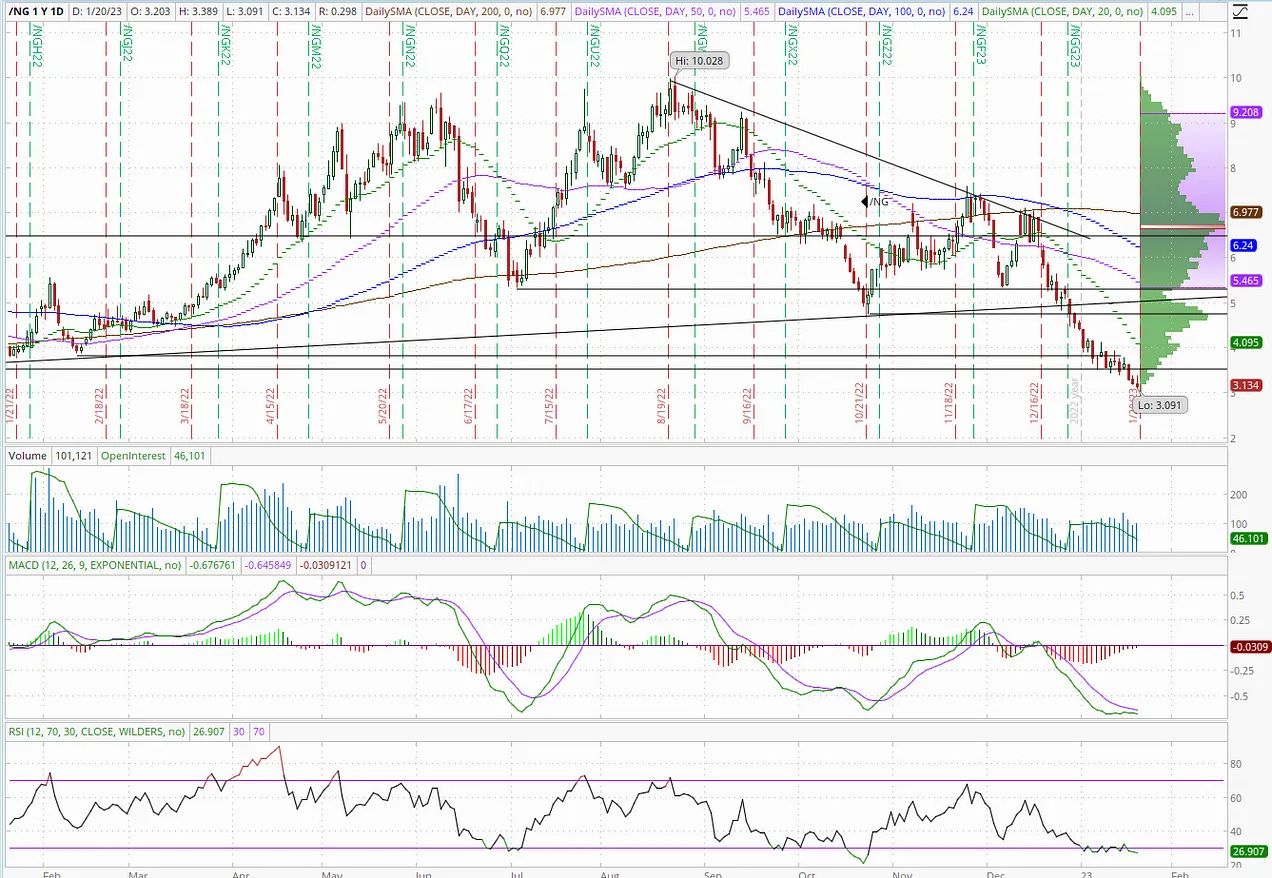
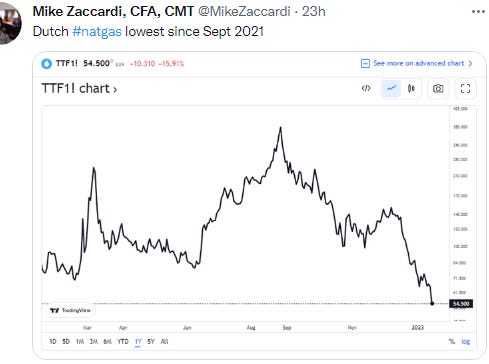
On nat gas, I noted two weeks ago a “must hold” area at $3.50. Wednesday that level broke, which I emphasized is problematic with no good support until the low 2’s. Since then it has continued to decline, moving to the lowest since June 2021. As I said Wednesday, “it will bounce somewhere, but where is the question.” If it can maybe move sideways, I think it could be sooner than later, but it needs a few days at least of stabilization.
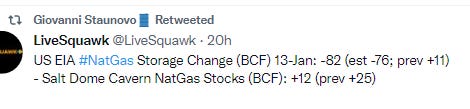
As even a better than expected storage draw couldn’t help.
As the EIA drops their forecast for nat gas prices. Natural gas futures aren’t on board with this looking for $3 gas until next winter.
In our January Short-Term Energy Outlook (STEO), we forecast the natural gas spot price at the U.S. benchmark Henry Hub will average $4.90 per million British thermal units (MMBtu) in 2023, more than $1.50/MMBtu lower than the 2022 average. We expect prices to stay nearly the same in 2024 as dry natural gas production continues to grow in the United States and outpaces domestic natural gas demand and exports for most of the year. We forecast the Henry Hub price will average close to $5.00/MMBtu in the first quarter of 2023; both winter weather and liquefied natural gas (LNG) exports at near-capacity volumes will lead to greater natural gas demand, which will result in higher prices in the United States.
We expect natural gas prices to decline in the second quarter of 2023, then stay relatively flat for the rest of the year as a result of:
We expect U.S. natural gas production to increase by about 2% in 2023, averaging between 100 Bcf/d and 101 Bcf/d for the year. We expect natural gas consumption to decline in the electric power sector as more renewable electric-generating capacity comes online and overall electricity consumption declines as a result of cooler summer weather than last year. No new U.S. LNG export facilities are planned to come online in 2023; without new facilities, U.S. LNG exports will not increase.
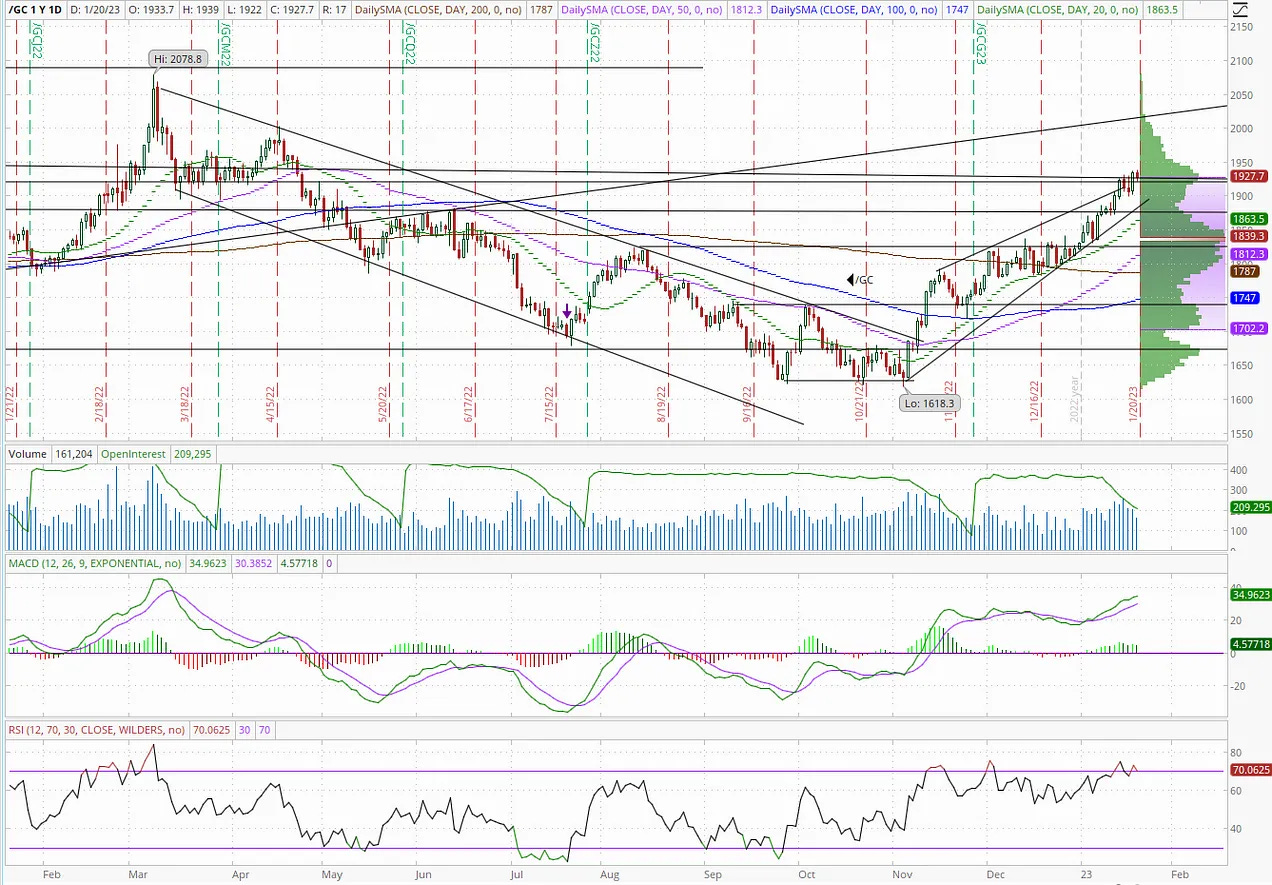
Gold (/GC)
And on gold as a reminder last week the metal jumped Thursday and Friday blowing right through $1900 resistance and going straight to the next resistance level at $1930. As I said,
If it can make it through that, not much between it and $2000. Clearly it has some strong buying behind it, but it’s starting to get pretty overbought. I really think a consolidation here makes sense, but I thought that Thursday.
And while Tuesday and Wednesday we did see consolidation, gold made its move Thursday, pushing through that $1930 resistance, now with that clear path to $2000, although it’s getting overbought again. It finished little changed on Friday falling just below the $1930 level. I’m not ready yet to call for a pullback but one continues to make sense.
“Gold is overbought and needs to correct,” Rhona O’Connell, an analyst at StoneX, wrote in a note. “The $2,000 mark is on the relatively distant horizon, but if it were to be attained in the near future then it would almost certainly be a case of ‘blink and you miss it.’”
Other commodities
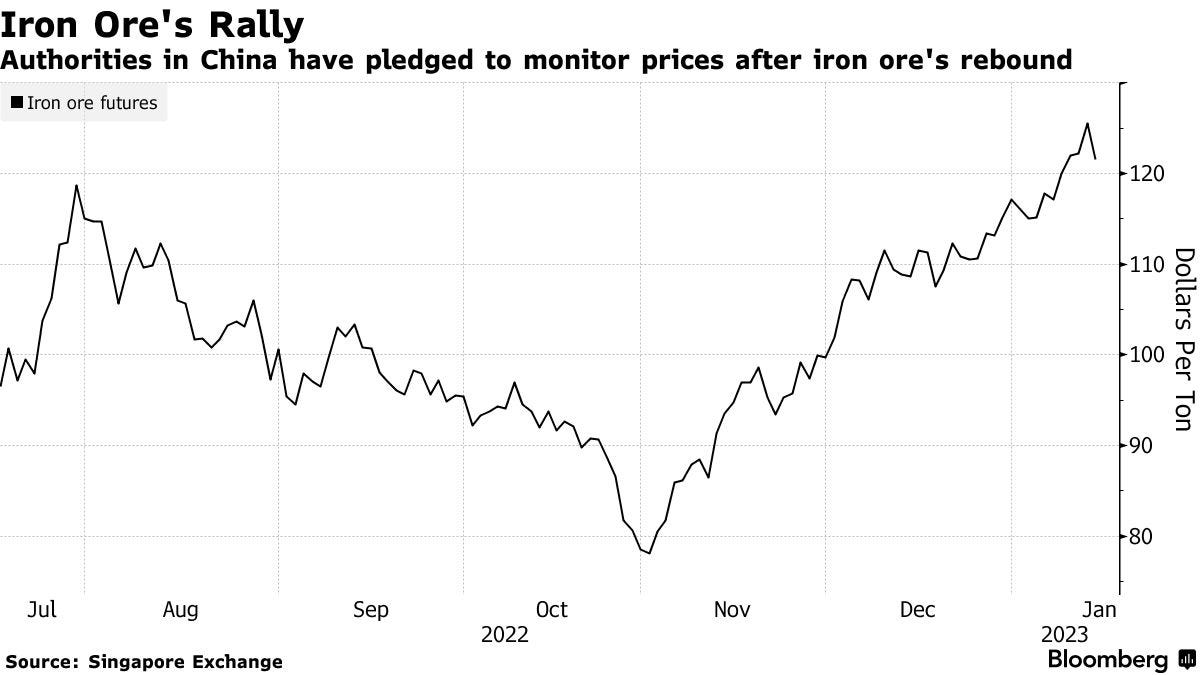
On Monday, iron ore declined after China’s top economic planner said it would tighten supervision of pricing after the steelmaking ingredient’s surge in recent months.
Authorities in China are also seeking to bolster their influence over iron ore pricing in the longer term by consolidating purchases on behalf of about 20 of the country’s largest steelmakers. A new state-owned company called China Mineral Resources Group is poised to become the world’s biggest buyer of the material as soon as this year, people familiar with the situation said last month.
Copper held on to its fifth weekly increase in London, its best run since May 2021, with global supply risks persisting and inventories near historic lows.
Subscribe for free to receive new posts and support my work.
Asia
I have a relatively low exposure to Asian stocks currently (just some small positions in some Chinese tech companies (which I have mostly sold out of at this point) and a few Japanese industrials and banks as well as country ETF positions in VNM and INDA).
I had thought mid-2022 that Chinese stocks (and then other Asian stocks given how big of a regional influence China is) could be a good place to be the rest of last year, particularly as we approached and move through the party Congress in October, but China had a harder time getting things straightened out than I had expected, and up until a month ago they seemed to be in no hurry to end the Covid Zero policy that will keep their economy in check until they can get past it. That has changed in a hurry. Covid Zero is now a thing of the past, and as I noted in this space last year, when that happens, I expected a lot of fiscal support to get things moving, which we’re starting to see, and I expect more of. I, like everyone else, had thought this all would be much slower, but so far they’re going pedal to the metal, although a big test will be upcoming weeks with the huge Lunar New Year migration that is in process. Beijing has also been making mostly the right noises as it relates to a better relationship with tech firms, etc., which is also very positive. I think all this means that China could be a very good place to be invested in 2023 if you can deal with the political risk (I have kept my exposure low for now but will watch for a pullback in Chinese ETF’s).
India is also region I am very interested in as I talk about more below. Their data of late has been much better than most of the rest of Asia, and they overtook the UK last year as the 5th largest world economy. I have been meaning to do a little longer write-up on them but keep running out of time. I’ll get it out at some point.
Finally, I also think Japanese stocks are set for a nice rebound at some point. They are very “cheap” with the index trading around 9x P/E. That said, Japan remains in a tricky situation with the currency weakening dramatically as they try to maintain yield curve control, but they seem to be on a path to letting that go. I’d imagine we’ve seen a peak in weakness for the yen. Data in Japan also has generally been more positive than the rest of Asia, although it’s been more mixed the last couple of months.
China
Many markets in Asia, including China, will be closed next week for Lunar New Year celebrations. And it looks like people are already
The CSI 300 Index rose 0.6% on Friday, capping a fourth straight week of gains. The gauge has surged a little more than 19% from an Oct. 31 low, led by consumer stocks and financials, as investors bet on an outburst of retail spending and improved business environment following President Xi Jinping’s moves to exit Covid Zero and focus on growth. The CSI gauge is up 8% so far in 2023 after capping its first back-to-back annual losses since 2011 last year. Global funds were net buyers of shares listed in Shanghai and Shenzhen for a 13th straight day on Friday, the longest purchasing streak since May 2020. They have raised their holdings by 112 billion yuan ($16.5 billion) in January, on pace for a monthly record, according to data compiled by Bloomberg. The Hang Seng China Enterprises Index of Chinese stocks listed in Hong Kong — which suffered more during the relentless equity selloff — has rebounded faster. That measure climbed 2.3% on Friday and is up almost 12% this year. Trading in Hong Kong stocks will resume on Jan. 26. “Foreign investors are really materially underweight China equities, and this is material, because we don’t have to worry about investors selling the rally,” George Efstathopoulos, a portfolio manager at Fidelity International, said in an interview. “We think earnings bottomed out last quarter.”
Bridgewater Associates is “strongly bullish” on short-term Chinese debt, after its onshore enhanced All Weather fund reaped a 7.4% gain last year amid wild swings in local markets to help it double assets under management. The All Weather Plus No. 2 fund’s performance was mainly driven by a 4.1% excess return relative to cash generated by the quantitative part of the strategy, according to its December investor letter seen by Bloomberg. “Active management” contributed 1.3% as profits in commodities and bonds offset losses in stocks, the document showed. The company’s onshore hedge fund unit expanded assets to more than 20 billion yuan ($3 billion) after additional fundraising near the year end, people familiar with the matter said, requesting not to be named because the information is private. While China’s dismantling of its Covid Zero policy will bolster economic activity, the rebound “may not be very strong” as seen in other developed nations, according to the company’s letter. “Based on such macroeconomic background, we are currently strongly bullish on short-term bonds,” Bridgewater said. Bonds tend to outperform when growth trails expectations, it added. The company was also a backer of long-term bonds, while being “moderately” optimistic on stocks with attractive valuations, and “moderately” pessimistic on commodities, according to the letter, which cited its views as of Dec. 31. Bridgewater launched its first China onshore yuan fund in 2018, and upgraded the model in 2019 by adding active management. Its assets exceeded 10 billion yuan in 2021, the first among global firms competing in the so-called private securities fund market, the Chinese equivalent of hedge funds.
Chinese New Home Prices (M/M) Dec: -0.25% (prev -0.25%)
China's Q4 GDP 0.0% qtr/qtr (expected -0.8%; last 3.9%); 2.9% yr/yr (expected 1.8%; last 3.9%). - December Retail Sales -1.8% yr/yr (expected -8.6%; last -5.9%) - December Industrial Production 1.3% yr/yr (expected 0.2%; last 2.2%) - December Fixed Asset Investment 5.1% yr/yr (expected 5.0%; last 5.3%). - December Unemployment Rate 5.5% (expected 6.0%; last 5.7%)
In some suspiciously robust data, fourth quarter and December GDP data came in better-than-forecast which added to optimism it may be primed for a recovery. Still, China’s economy grew at the second slowest pace since the 1970s last year as Covid restrictions hammered activity. Gross domestic product in the world’s second-largest economy grew 3% in 2022, the National Bureau of Statistics said Tuesday, higher than the median estimate of 2.7% in a Bloomberg survey of economists. For the final quarter, the economy expanded 2.9% from a year earlier, topping economists’ forecasts for 1.6% growth.
Industrial output rose 1.3% from a year ago, higher than a forecast of 0.1%
Retail sales contracted 1.8% versus a predicted 9% decline - medicine logged a 40% y/y surge, food jumped 10.5% and automobiles climbed 4.6%; clothing, restaurants, cosmetics, household electronics, jewelry all saw double digit declines
Fixed-asset investment gained 5.1% last year, largely in line with forecasts
The urban jobless rate fell to 5.5% last month from 5.7% in November; youth unemployment rate came in at 16.7%. It hit a record of almost 20% last year. ”China’s fourth-quarter GDP should be viewed with both concern and a degree of relief. The overshoot relative to expectations will assuage worries about a crash. The data were still very weak — there’s no hiding the fact that the economy took a very heavy blow from the messy exit from Covid Zero and outbreaks that swept across the country in December. Even so, high-frequency indicators suggest that the economy may have have bottomed. We see a solid rebound taking hold in 2Q23.” - Chang Shu and Eric Zhu, BBG. The median estimate in a Bloomberg survey of economists is for growth to accelerate to 4.8% this year, although some major banks like Morgan Stanley, Bank of America and Citigroup Inc. expect growth to be closer to 5.5% or higher. Regardless of what the data was, though, markets have moved on to what is presumed to be much better days in 2023.
Data released along with GDP showed that the population shrank in 2022 for the first time in six decades, the NBS said Tuesday, with repercussions for the labor market, demand for housing and the country’s pension system. China had 1.41 billion people at the end of last year, 850,000 fewer than the end of 2021, according to data released by the National Statistics Bureau on Tuesday. That marks the first drop since 1961, the final year of the Great Famine under former leader Mao Zedong. Some 9.56 million babies were born in 2022, down from 10.62 million a year earlier, the lowest level since at least 1950, despite efforts by the government to encourage families to have more children. China’s birth rate, or the number of newborns per 1,000 people, declined to 6.77 last year, the lowest level since at least 1978. Due to the decline, the Chinese economy may struggle to overtake the US in size and the nation could lose its status as the world’s most populous country to India this year. The data released by the National Statistics Bureau show 62% of the population were of working-age, which China defines as people aged 16 to 59, down from around 70% a decade ago. “China cannot rely on the demographic dividend as a structural driver for economic growth,” said Zhiwei Zhang, president and chief economist at Pinpoint Asset Management. “Going forward, demographics will be a headwind. Economic growth will have to depend more on productivity growth.”
Also on Tuesday the Chinese central bank injected CNY504 billion via reverse repos ahead of the holiday, the most since January 2019.
China's December FDI 6.3% (last 9.9%)
Plans are under way for US Treasury Secretary Janet Yellen and her Chinese counterparts to hold meetings in Beijing and Washington later this year, continuing the governments’ efforts to ramp up face-to-face engagement to improve ties.
Japan
Big news of the week was the BoJ making no major changes despite widespread speculation that they would further tweak their yield curve control regime.
Marc Chandler - The Bank of Japan stood pat. In a unanimous decision, the BOJ left its Yield Curve Control intact, sending the yen sharply lower. Japanese government bonds and stocks rallied. The 10-year JGB yield fell back top 0.40% from the 0.50% cap and the Nikkei rallied 2.5%. The BOJ will continue to buy bonds as needed. It will boost its loan facility to commercial banks to help fund their purchases of bonds too. Last Thursday and Friday, banks took about JPY4 trillion (~$30 billion). Governor Kuroda said he would not rule out offering the funds at a negative rate, i.e., paying the banks to buy government bonds. The BOJ itself spent about $75 billion buying bonds in the last two sessions of last week and bought about $23 billion more on Monday and Tuesday's operations. The BOJ updated its economic forecast. This fiscal year's CPI was tweaked to 3.0% from 2.9%. Next year's CPI was left steady at 1.6%, and the following year’s was raised to 1.8% from 1.6%. The takeaway is that the BOJ is signaling that it still does not expect the recent rise of inflation to be sustained. Growth forecasts were reduced. Growth this fiscal year, which ends in March, is now seen at 1.9% rather than 2.0%. Next year's growth forecast was pared to 1.7% from 1.9%, and the following year's to 1.1% from 1.5%. The next BOJ meeting is on March 9. It will be the last one that Governor Kuroda chairs before retiring in early April.
BBG - The Bank of Japan pushed back against intense market speculation of policy change by ramping up the defense of its stimulus framework, prompting sharp slides in the yen and bond yields. The BOJ’s updated forecasts also showed that officials still don’t see inflation staying above 2% in a sustainable manner over the coming years, offering a justification for continued stimulus even after Kuroda steps down in April. The earlier-than-expected release of the statement pointed to consensus on the BOJ board despite the strength of market bets that it must be close to buckling on a policy stance that is out of sync with major peers including the Federal Reserve, the European Central Bank and the Bank of England. “This means there’s a higher chance the BOJ will pass the current policy framework on to the next leadership rather than changing it under Kuroda,” said Hideo Kumano, executive economist at Dai-Ichi Life Research Institute. “March is a period for corporate earnings and the BOJ wouldn’t want to rock the boat and cause confusion then.” Kuroda also said a further widening of the band around the BOJ’s yield target was not needed. He indicated he wouldn’t rule out paying banks to borrow money via the loan provision program. In the runup to the gathering, speculation heated up as 10-year yields repeatedly breached its new ceiling of 0.5%. The central bank bought around 3 trillion yen ($23 billion) of government bonds over Monday and Tuesday in addition to almost 10 trillion yen defending its stimulus framework on the final two days of last week. As a way of shoring up its defense, the bank said Wednesday that it would decide on the interest rate for certain loans to commercial banks. Until now, these loans have essentially offered free money to banks for up to 10 years that they can use to buy bonds, thereby helping the BOJ keep yields down. “I won’t rule out the possibility of negative rates being applied to the fund supply operations, but either way we’ll operate flexibly within the enhanced perimeters,” Kuroda said, hinting at a potentially more aggressive use of this tool.
UBS Asset Management and Schroders Plc are sticking with bets Japanese government bond yields will rise on the expectation the BOJ will eventually stop capping the 10-year benchmark at 0.5%, even after it kept the so-called curve control policy unchanged Wednesday. Torica Capital Pty also expects the central bank to fall in line and shift toward the global trend of raising rates. “We see no reason to square up shorts,” said Tom Nash, a money manager at UBS in Sydney, referring to his reluctance to close out bearish bets on Japanese bonds. “The yield-curve-control policy is not consistent with the current economic and political landscape and will need to be dismantled.” Bowing to market pressure would “erode their credibility at a time they need it the most,” said Omar Slim, co-head of Asia ex-Japan fixed income at PineBridge Investments in Singapore. “The mother of all pivots is under way, but it will come in phases.” Some funds say pressure on the BOJ will intensify as market functionality deteriorates. Investors have little to lose by shorting Japanese debt as the BOJ will allow yields to rise gradually as part of a move to normalize policy, said Raymond Lee, chief investment officer at Torica in Sydney.
Japanese National CPI (Y/Y) Dec: 4.0% (exp 4.0%; prev 3.8%) -National CPI Ex-Fresh Food (Y/Y) Dec: 4.0% (exp 4.0%; prev 3.7%) Japan's core CPI was up 4.0% yr/yr in December, representing the sharpest rate of increase since 1982. The result matched economists’ estimate, and was led by further gains in energy and food costs. Processed food prices grew at the fastest pace since 1976, while electricity and gas prices both continued to jump more than 20% from the year before. Economists say the result won’t budge Governor Haruhiko Kuroda’s view that the inflationary trend is set to cool. A slowdown in prices is also expected by economists given that government subsidies will sharply lower energy costs in the coming months. Either the December or January inflation figure is likely to be the peak, they say. Still, economists have brought forward their expectations of policy change at the bank to coincide with the first or second meeting of a new governor set to succeed Kuroda in April. Market watchers say change could still come before then. The pressure from rising costs may make it harder for companies to make the kind of wage gains the BOJ says it needs to see before moving toward policy normalization.
Japanese Machine Tool Orders (Y/Y) Dec P: 1.0% (prev -7.7%)
Japanese PPI (Y/Y) Dec: 10.2% (exp 9.5%; prev 9.3%) -PPI (M/M) Dec: 0.5% (exp 0.3%; prev 0.6%)
Japan's November Tertiary Industry Activity Index -0.2% m/m (expected 0.2%; last 0.5%)
Japan's November Core Machinery Orders -8.3% m/m (expected -0.9%; last 5.4%); -3.7% yr/yr (expected 2.4%; last 0.4%).
November Industrial Production 0.2% m/m (expected -0.1%; last -0.1%) and Capacity Utilization -1.4% m/m (last 2.2%)
Japan' December trade deficit JPY1.449 trln (expected deficit of JPY1.653 trln; last deficit of JPY2.027 trln). -December Imports 20.6% yr/yr (expected 22.4%; last 30.3%) -Exports 11.5% yr/yr (expected 10.1%; last 20.0%)
Business confidence at big Japanese firms slid in January with manufacturers showing a negative reading for the first time in two years, the Reuters Tankan survey found, reflecting a slow recovery from the pandemic amid a global economic downturn and rising living costs. The drop in morale could undermine policymakers' hopes for Japanese firms to boost investment and accelerate wage hikes that would outpace rises in inflation. The Reuters Tankan index for big manufacturers stood at -6 in January, down from +8 last month, with car, electronics and textiles manufacturers among the gloomiest sectors. The negative reading - the first since January 2021 - indicates that the number of firms that said business conditions were poor was greater than those that said they were good. It was the most pessimistic reading since December 2020. Morale was much stronger in the service sector, with that index at +20 in January, a drop from +25 in the prior month which was its highest level in more than three years. Among non-manufacturers, only the real estate and construction sectors had negative readings.
India
S Korea
South Korea's December PPI -0.3% m/m (last -0.3%); 6.0% yr/yr (last 6.2%)
South Korea’s early trade data showed a decline in exports persisting this month in the latest sign of a global economic slowdown. Average shipments that exclude working-day differences decreased 8.8% in the first 20 days of January from a year earlier, the customs office said. That follows a 9.6% decline for the full month of December. Headline exports fell 2.7% through Jan. 1 to 20. Chip sales dropped 34% and shipments to China fell 24.4%. Waning semiconductor demand is at the heart of the decline in Korea and analysts surveyed by Bloomberg expect the country’s economy to have probably contracted last quarter, partly due to falling exports. Trade performance has far-reaching implications for Korea as the economy relies heavily on global commerce to drive growth. Korea’s exports will probably be 4% lower this year than in 2022, while imports will decline 8%, according to a Korea International Trade Association forecast.
Australia
Australian Melbourne Institute Inflation (M/M) Dec: 0.2% (prev 1.0%) -Melbourne Institute Inflation (Y/Y) Dec: 5.9% (prev 5.9%)
Australia's January Westpac Consumer Sentiment 5.0% (last 3.0%)
Australia's December Employment Change -14,600 (expected 22,500; last 58,200) and full Employment Change 17,600 (last 33,200). December Unemployment Rate 3.5% (expected 3.4%; last 3.5%) and Participation Rate 66.6% (expected 66.8%; last 66.8%).
January MI Inflation Expectations 5.6% (last 5.2%)
Russia
Europe
I like European stocks longer term, but in the near term they obviously have a lot of issues, particularly if they have to continue to cut industrial production due to energy costs. That said, the data of late has been more encouraging. It looks more and more like severe recessions are off the table. As I said all through 2022, longer term I think there’s a lot to like, including energy companies (on a pullback), automakers, and European banks that have strong financial positions and pay good dividends. There are quality companies in other areas as well of course (pharma, etc.). I have positions in many of those companies currently although I have been more of a seller than a buyer this year. Like in the US, balance sheets are in much better shape than previous recessions.
And blessed with much warmer than normal temperatures and strong winds, the chances of Europe getting through this winter without huge issues looks more and more likely (next winter could be a different story if Russian flows remain shut off).
But many say the big run in European shares may be due for a pause. BBG.
After making its best ever start to a year, the Stoxx 600 Index will end 2023 at 452 points, according an average response in the Bloomberg survey of 19 market forecasters, implying a 1.2% drop from Wednesday’s close. That’s even after several investment banks raised their view since last month’s poll, including those at Goldman Sachs Group Inc. and Barclays Plc. “Even though we have raised our price targets, we still expect only weak returns,” said Goldman equity strategist Sharon Bell, who this month increased her forecast to 465 points from 450. With risks for stocks still high, and earnings set to weaken further, bonds and cash are clear alternatives, she said.
European equities have performed strongly in January, with the Stoxx 600 climbing about 7% and taking returns to nearly 19% since the low of Sept. 29, beating the US by 11 percentage points in local currencies. Cyclical stocks including retail, travel, banks and technology have led the rally, spurred by faster-than-expected reopening in China, the avoidance of a deeper energy crisis, and signs that inflation is slowing. Additionally, the economy has been holding up better than expected, with fewer economists now forecasting a recession, implying earnings may fall by less than first feared. “So long as rates volatility subsides, equities can cope with a mild profit recession,” said Barclays strategist Emmanuel Cau. He raised his year-end target for the Stoxx 600 to 475 from 450 this week, implying around 5% upside for the rest of the year, and sees a more modest 6% drop in European earnings in 2023 than the 12% decline he had previously predicted.
For Bank of America Corp. strategist Milla Savova, the rally in Europe has defied contracting business activity in Europe and the US, both of which are running at recessionary levels. Should economies weaken in line with BofA’s projections, Savova sees the Stoxx 600 falling about 20% to 365 by mid-year. Yet she expects a rebound in growth to fuel a bounce to 430 by year-end. The range of predictions has widened since last month, with ZKB having the most optimistic target of 510, implying nearly 12% upside from Wednesday close. TFS Derivatives has the most pessimistic view at 380 points, representing 17% downside.
According to January’s BofA European fund managers survey, 70% of survey respondents seeing upside for European equities over the coming 12 months, up from 58% last month. More broadly, allocations to the region have been rising, with 4% of global investors overweight, compared with a 10% underweight in December. That’s the highest reading since February 2022.
EU
According to Bloomberg, European Central Bank policymakers are starting to consider a slower pace of interest-rate hikes than President Christine Lagarde indicated in December, according to officials with knowledge of their discussions.
While the 50 basis-point step in February she signaled remains likely, the prospect of a smaller 25-point increase at the following meeting in March is gaining support, the officials said, asking not to be identified because talks on the matter are confidential.
And economists polled by Bloomberg predict the deposit rate will be raised to a peak of 3.25% — from its current level of 2% in three steps. The survey shows two half-point hikes at the February and March meetings, followed by a 25 basis-point increase in May or June. The median analyst prediction then envisages cutting the rate back to 3% at the start of the third quarter. Such a scenario would suggest a drastic turn of events that the ECB doesn’t envision. Most of its officials see rates remaining where they are after the so-called terminal rate is reached and none have called for rate cuts. The economists polled reckon the core price gauge — which excludes food, energy and other volatile items — will peak at an average of 5.1% this quarter, before retreating to 3.5% in the final three months of 2023.
Eurozone's January ZEW Economic Sentiment 16.7 (expected -14.3; last -23.6)
Eurozone's December CPI final read -0.4% m/m (expected -0.3%; last -0.1%); 9.2% yr/yr, as expected (last 10.1%). - December Core CPI 0.6% m/m, as expected (last 0.6%); 5.2% yr/yr, as expected (last 5.0%).
November Construction Output -0.81% m/m (last 1.00%)
Germany
German Wholesale Price Index (M/M) Dec: -1.6% (prev -0.9%) -Wholesale Price Index (Y/Y) Dec: 12.8% (prev 14.9%)
Germany's January ZEW Economic Sentiment 16.9 (expected -15.0; last -23.3) and January ZEW Current Conditions -58.6 (expected -58 .3; last -61.4). German investor sentiment was in positive territory in January for the first time since the Ukraine war began as signs point to a milder recession over the winter months than initially feared, the ZEW economic research institute said on Tuesday. The forward-looking expectations component from this month’s poll conducted by Germany’s ZEW economics institute soared to 16.9 points to rocket past the market forecast of -15.0 and December’s reading of -23.3. The ZEW said that its indicator for the next six months was in positive territory for the first time since February 2022, and it was the fourth consecutive improvement in the confidence measure. ZEW President Achim Wambach said a more favorable situation on the energy markets and energy relief measures by the German government in particular contributed to the index's 40.2-point leap in January. “For the first time since February 2022, the month in which the war in Ukraine began, the indicator points to a noticeable improvement in the economic situation over the next six months,” Wambach noted. “The more favourable situation on the energy markets and the German government’s energy price caps have contributed to this in particular. Accordingly, the earnings expectations of the export-oriented and energy-intensive sectors have gone up significantly. The prospect that the inflation rate will continue to fall has brightened expectations for the consumer-related sectors.” Readings for both the outlook and present environment in the Eurozone also improved, the ZEW said.
December CPI (final read) -0.8% m/m, as expected (last -0.5%); 8.6% yr/yr, as expected (last 10.0%)
Germany's December PPI -0.4% m/m (expected -1.2%; last -3.9%) ; 21.6% yr/yr (expected 20.8%; last 28.2%)
France
Italy
Italy's December CPI 0.3% m/m, as expected (last 0.5%); 11.6% yr/yr, as expected (last 11.8%)
Italy's November trade surplus EUR1.445 bln (expected deficit of EUR1.800 bln; last deficit of EUR2.057 bln)
Spain
U.K.
U.K.'s November Average Earnings Index + Bonus 6.4% yr/yr (expected 6.2%; last 6.2%) -November three-month employment change 27,000 (expected 5,000; last 27,000) -November Unemployment Rate 3.7%, as expected (last 3.7%) -December claimant count change 19,700 (expected 19,800; last 16,100) Pay excluding bonuses rose by an annual 6.4% in the September-to-November period, the biggest increase since records began in 2001, not counting jumps in the COVID-19 period which were distorted by lockdowns and government support measures. Pay including bonuses also rose by 6.4%, the Office for National Statistics said. Economists polled by Reuters had expected total pay and the ex-bonuses measure to rise by 6.2% and 6.3% respectively. The ONS said Britain's jobless rate held at 3.7%, in line with the poll, close to its lowest in almost 50 years. Employment rose by a faster-than-expected 27,000. "The latest labour market data maintain the pressure on the by the Monetary Policy Committee to raise interest rates by another 50 basis points next month, rather than slow down," Samuel Tombs, an economist with Pantheon Macroeconomics, said. The number of days lost to strikes rose again in November and the period since June saw more days lost to industrial action than in any six months for over 30 years, the ONS said. Private-sector total pay rose by an annual 7.1% in the three months to November compared with 3.3% in the public sector. Despite the pay acceleration, the soaring rate of inflation means households are still seeing their spending power shrink. Total pay, adjusted for the consumer prices index, fell by 3.9% between September and November compared with the same period in 2021. A larger fall had not been seen since 2009. There were also signs that Britain's tight labor market was losing some of its inflationary heat. Vacancies in the October-to-December period fell for a sixth time in a row and were down on an annual basis - by 85,000 - for only the second time since the lockdowns of early 2021 but were still a lot higher than before the coronavirus pandemic. The economic inactivity rate - or the share of people not in work and not looking for it - fell in the three months to November to 21.5%, 0.1 percentage points lower than the previous three-month period. But the rate was 1.3 percentage points higher than immediately before the pandemic.
U.K.'s December CPI 0.4% m/m, as expected (last 0.4%); 10.5% yr/yr, as expected (last 10.7%). -December Core CPI 0.5% m/m (expected 0.4%; last 0.3%); 6.3% yr/yr (expected 6.2%; last 6.3%). -December RPI 0.6% m/m (expected 0.7%; last 0.6%) and Core RPI 0.5% m/m (last 0.5%) UK inflation dipped for a second month in December, boosting hopes that the worst cost-of-living crisis in a generation may be starting to ease. Consumer prices rose 10.5% from a year earlier, the Office for National Statistics said Wednesday. That’s slower than the 10.7% gain in November and a peak above 11% in October, when domestic energy bills surged. The data “suggests the peak has now passed” for inflation, said David Bharier, head of research at the British Chambers of Commerce. “But this simply means that prices will stabilize at a much higher level than one year ago.” Chancellor of the Exchequer Jeremy Hunt said he has more to do to bring down the cost of living. The cost of motor fuels fell along with the price of clothing and shoes. Food costs accelerated at the quickest pace since records started in 1989, a worry for low-income families who spend a greater proportion of their income on essentials such as food.
“Inflation eased slightly in December, although still at a very high level,” said ONS Chief Economist Grant Fitzner. “However, this was offset by increases for coach and air fares as well as overnight hotel accommodation. Food costs continue to spike with prices also rising in shops, cafés and restaurants.” Underscoring concerns about persistent inflation, a core measure of prices that excludes energy, food, alcohol and tobacco prices, was unchanged at 6.3%. Inflation in the services sector accelerated to 6.8%. “For those hoping that inflation would simply just fall out of the system quickly, that is a scenario that is unlikely to come to fruition,” said Marcus Brookes, chief investment officer at Quilter Investors.. “Services are now driving inflation as companies have had to increase wages just to get staff on their books.” Fuel prices were 11.5% higher in December compared to a year earlier, down from 17.2% in November. “December’s drop in UK inflation is unlikely to deter the majority of Bank of England policy makers from delivering another 50 basis-point hike next month. Core inflation is proving sticky, which alongside rapid wage growth, elevated expectations and a more resilient economy, suggests price pressure could prove more persistent. We see the benchmark rate peaking at 4.25% in March, but there’s an increasing risk it will need to go higher to bring inflation down.”
—Dan Hanson and Ana Andrade, Bloomberg Economics. Investors anticipate rates to peak at around 4.5% by mid-year.
British house prices registered the most widespread falls in 13 years last month as buyer demand and sales activity weakened more sharply than expected in the face of higher borrowing costs and the risk of a recession, a survey showed on Thursday. The Royal Institution of Chartered Surveyors (RICS) house price balance, which measures the difference between the percentage of surveyors seeing rises and falls in house prices, slumped to -42 in December from -26 the previous month. December's figure was the lowest since October 2010 and below the -30 that economists had forecast in a Reuters poll. Looking at the year ahead, the balance for price expectations edged down further from November. Overall in Britain, agreed sales continued to weaken, RICS said, falling to -41. New buyer enquiries dipped marginally while the number of people putting their house up for sale was the weakest since September 2021. In contrast to property price falls, rents are expected to push up, RICS said. Demand in the rental market was set to slow further after sinking to its weakest in nearly two years last month, but fewer landlords were offering properties.
U.K.'s December Retail Sales -1.0% m/m (expected 0.5%; last -0.5%); -5.8% yr/yr (expected -4.1%; last -5.7%) - December Core Retail Sales -1.1% m/m (expected 0.4%; last -0.3%); -6.1% yr/yr (expected -4.4%; last -5.6%) UK retail sales fell unexpectedly last month, finishing the worst year on record as a brutal cost-of-living squeeze pointed toward more pain ahead for the economy.
A 6.1% drop in the volume of goods purchased in shops and online reported by the Office for National Statistics on Friday was the sharpest since records started in 1989. The situation complicates the Bank of England’s response to inflation, which despite ticking down for a second month in December remains near a 41-year high and is more than five times the targeted rate. Money markets pared bets on where interest rates will peak by 2 basis points to 4.53% according to swaps tied to policy meeting dates. Retail sales fell 5.8% from a year ago including fuel sales, the sharpest December decline since records began in 1997, the Office for National Statistics said Friday. That was more than the 4% drop economists had expected. The drop in December was driven by non-food sales as “consumers cut back on spending because of increased prices and affordability concerns,” the ONS said. Supermarkets reported people stocked up early for Christmas then pared back in December. In a sign of how red-hot inflation is eroding consumers’ spending power, sales were 13.6% higher in value terms in December compared with pre-Covid levels, but volumes were 1.7% lower. The highest increase in consumer debt in over 18 years appears to have helped some parts of the UK’s retail sector, with Britons borrowing to buy products ranging from high-ticket electronic items to basics such as milk. A borrowing binge has taken off in the UK with credit card activity rising at its fastest pace since March 2004, an increasing number of pensioners using buy-now-pay-later and retailers reporting that many shoppers are turning to finance. Bank of England data shows that credit card lending to individuals jumped by £1.19 billion ($1.47 billion) in November — the highest monthly increase since March 2004 E-commerce accounted for 25.4% of total sales, down a half percentage point.
In related news, British consumer sentiment fell for the first time in three months in January, returning near to historic lows as concerns about the economy and the soaring cost of living tightened the squeeze on household finances, research showed on Friday. Market research firm GfK said its measure of confidence declined 3 points to -45, the third lowest reading since records started in 1974. A Reuters poll of economists forecast a rise to -40 from December's -42.
The GfK index, which is not seasonally adjusted, usually rises in January.
Sentiment towards major purchases declined especially sharply this month. "With inflation continuing to swallow up pay rises, and the prospect of some shocking energy bills landing soon, the forecast for consumer confidence this year is not looking good," Joe Staton, GfK's client strategy director, said.
Other Int’l
As headline CPI for Canada comes in a little cooler than expected but core a little hot.
Canadian CPI (Y/Y) Dec: 6.3% (est 6.4%; prev 6.8%) - Canadian CPI NSA (M/M) Dec: -0.6% (est -0.5%; prev 0.1%) - Canadian CPI Core - Median (Y/Y) Dec: 5.0% (est 4.9%; prevR 5.1%) - Canadian CPI Core - Trim (Y/Y) Dec: 5.3% (est 5.2%; prevR 5.4%)
BBG - Inflation and the Bank of Canada’s favored measures of underlying price pressures are cooling, suggesting that an expected increase to interest rates next week may be the last one for a while. Two key yearly measures tracked closely by the central bank — the so-called trim and median core rates — edged lower, averaging 5.15% from an upwardly revised 5.25% a month earlier. The data support the view that the end of one of central bank’s most aggressive tightening cycles is in sight, with Governor Tiff Macklem likely to deliver one more hike on Jan. 25 before pausing. While lower gasoline prices led to a large pullback in December’s headline inflation rate, slower price growth was offset by increases in mortgage interest costs, clothing and personal care supplies. Shelter was again among major contributors to price gains, with mortgage interest and rent up 18% and 5.8% from year ago, respectively. Grocery prices also eased marginally. The cost of food purchased from stores rose 11% from the previous year, compared with 11.4% in November, with price growth hovering around 11% for the last five months. After Tuesday’s report, overnight swaps traders put the odds of a 25-basis-point hike at nearly 90%, up from about 80% earlier.
And home prices are falling. BBG.
Canadian home prices fell by the most on record in 2022, as rapidly rising interest rates forced a market adjustment that may have further to go. The country’s benchmark home price fell 1.6% in December to C$730,600, bringing the total decrease since February’s peak to 13.2%, the Canadian Real Estate Association said Monday. The decline was the biggest peak-to-trough falloff since the group started compiling the data in 2005. Last year also saw the biggest price decline for a calendar year since records began, with a 7.5% drop overall. Compared with November, the number of sales in December rose 1.3%, while new listings fell 6.4% as more prospective sellers opted to try and wait out the market weakness.
But inflation expectations are going in the wrong direction.
And their housing market continues to cool.
But the good news is they’ve got quite a bit of excess savings.
As EM continues to get a lot of hype.
Next Week
SA - Earnings reports will dominate the conversation around stocks next week with Tesla (NASDAQ:TSLA), Microsoft (MSFT), Visa (V), Mastercard (MA), Johnson & Johnson (JNJ), and Boeing (BA) some of the heavyweights due to report. Federal Reserve speakers will be in a blackout period ahead of the February FOMC meeting, but economic reports will still pour in. Updates on the S&P Case-Shiller Home Price Index, new home sales, durable goods orders, and consumer sentiment could reinforce the expectation for a recession in the U.S. and set the table for a 25-point rate increase from the Fed, instead of a 50-point hike.
While last week had a data heavy Wednesday, next week will be Thursday and Friday, although the leading indicators on Monday and flash PMI’s on Tuesday are important reports. Key reports later in the week will be 1Q GDP, durable goods orders (particularly business cap ex) on Thursday, and the personal income and spending/PCE prices on Friday.
But one thing we won’t have to deal with is a lot of Fedspeak as they remain in their blackout period. It seems they’re set for a 25bps hike as discussed in Bonds absent something out of left field during the week.
And internationally the big focus will be PMI’s Tuesday and the Canadian rate decision but here’s some other data/events from LiveSquawk and ING.
Tuesday 24 January
(Throughout the day) – EZ, UK, US Jan Flash PMIs
Consensus: EZ Manufacturing 48.5 points (prev 47.8)
“Flash PMIs for January are out on Tuesday, which we also expect to show a broad continuation of the positive trend seen in recent months, with the services PMI just about picking up from contractionary territory,” Oxford Economics wrote. “The manufacturing PMI also looks set to improve, although firms are likely to cite weakening demand and order cancellations as negative factors. But even here, we think expectations are doing the heavy lifting in terms of pushing the aggregate index up.”
Wednesday 25 January
09:00 – German Ifo Business Confidence
Consensus: Business Climate 90.6 points (prev 88.6)
“The Ifo Business Climate Index (BCI) for January will probably add to signs that the German economy has been resilient in the face of the energy crisis,” Capital Economics said in a note. “We will review our GDP forecasts for Germany in the coming weeks, but we no longer think a recession this year is a done deal.”
15:00 – BoC Rate Decision
Consensus: Rate Hike of 25 basis points to 4.50%
“The Bank of Canada convenes for the first time in 2023 after having raised the policy rate by 50 basis points to 4.25% in December,” S&P Global wrote. “Expectations for a further lifting of rates had been bolstered by strong jobs data, but this hawkishness has been offset by a further cooling of inflation. A 25-basis point hike is still expected, but a pause should not be ruled out.”
And here’s a nice trading calendar I came across from NYSE that I’ll just leave up for the year.
Misc.
As reverse repo use remained in the $2T - $2.5T range it’s been in for the past year or so, although at the lowest it’s been this year. For now it continues to evidence plenty of liquidity looking for a safe home.
Overall
So let’s go through the list of items that I think are most important to the direction of markets:
The Fed - From last week:
As long as inflation continues to decelerate, the tension between the Fed and markets will be eased as we have been seeing. In addition, just the simple fact that Fed has already raised rates to current levels makes the difference between market pricing and the Fed dot plot relatively insignificant. After 450 basis points of rate rises, whether you do another 25 or 75 is relatively minor. Going a lot higher than 75bps or holding a lot longer (past the end of 2023) than the market expects will matter, but there is no reason for that to occur as long as inflation continues to cooperate. And as to the latter, that’s something the Fed will continue to say (that they’re holding into 2024) but until we get there the market will likely continue to fade (again assuming that inflation continues to decelerate). So while the Fed might cause some wobbles, I am thinking they will become perhaps a little less front and center, again, as long as inflation continues to cooperate (have I said that enough times?). That said, they will continue to want to avoid big market rallies which substantially loosen financial conditions, so you can expect the language to remain towards the hawkish side for now. They also are deathly afraid of a resurgence in inflation. So as you can tell my focus will be squarely on the data and less on what the Fed says for the next few months.
And that’s basically what we saw this week, although the Fedspeak has started to diverge a little, with a growing minority who think we need to start to pay more attention to the impacts of the rate rises more generally (“look around corners” as Esther George put it). As noted in the Bonds section, we’re also seeing more members thinking that a rise in unemployment may not be necessary, something that I think will attract more followers as we move through 2023. This could set the stage for some interesting internal conversations starting as early as the March meeting.
Earnings - This is now center stage. As I noted three weeks ago,
This will be a critical point for 2023. Do earnings hold up or do they crack? I think they will continue to be “better than feared”, but if not we’re likely looking at a new low for this bear market or at least a revisit.
So far they’ve mostly held up, although as noted in that section the beat rate is very low. Hopefully that improves as we move forward.
Technicals - As I have said the last two weeks, the technical situation is very positive but hasn’t been enough to get through resistance. We get another chance this week, and this time we’re a little less overbought (but still fairly overbought, just not at the extremes of last week).
Breadth - This continues to be a tailwind, although as I noted last week not quite as strong as two weeks ago.
Institutional Flows - Given that institutional flows dwarf all other flows when they are moving in and out of the market, these always have to be taken into account. We know positioning remains extremely low, although it appears there may have been some short-covering going on last couple of weeks (raising the net length a bit). As I have been saying the past few months
it’s just a question of when not if they decide to really reengage (we’ve had pockets of buying but nothing sustained). Even more so than most other indicators, this one can stay very weak indefinitely. At some point the reengaging of institutional players will be a massive tailwind. But even if they don’t fully reengage they will continue to jump on rallies and drawdowns keeping things volatile.
As I also said the last couple of weeks, if we do get the SPX to push over resistance we could see “pile on” from systematic traders. As Charlie McElligott noted last week (HR):
“Funds are moving much faster to grab into ‘risk-on‘ expressions and/or unwind legacy ‘risk-off‘ positioning in order to not start the year in a hole,” McElligott said, noting that performance betas versus a month ago suggest re-risking. Macro funds’ beta to equities and crude is up markedly, and a short-dollar preference is evident in higher betas to the euro, lower dollar-yen betas and a higher beta to gold. Charlie attributed that to an “ahead-of-schedule disinflationary regime change hit[ting] simultaneously in conjunction with a better-than-feared global growth trajectory.”
Retail - As noted periodically in the flows section retail had a rough year in 2022. Positioning here remains much more full than institutional, although they also do have a lot of cash on the sidelines to put to work at some point.
Sentiment - I noted in October that sentiment was turning more positive, and it continued to move more bullish each week until stalling out in early December, and then starting to turn less bullish three weeks ago. That changed last week with it turning more bullish, and that continued this week. So this is not yet a headwind but also not the tailwind it was even at the start of the year.
Bespoke - For the AAIIsentiment survey, bullish sentiment has risen up to 31%. That 7 percentage point jump makes for the largest week-over-week increase and the highest reading since the week of November 17th. Bearish sentiment plummeted to 33.1% of respondents, which is down sharply from just a month ago when more than half of those responding reported as pessimists. The four straight weeks of declines is now the longest such streak since August leaving bearish sentiment only 0.2 percentage points above the second half of 2022’s low reached in the first week of November. As a result of the big moves, the bull-bear spread has narrowed all the way to -2.1. As we have frequently noted over the past few months, we are currently on a record streak of 42 weeks in a row with a negative bull-bear spread. This week’s reading is now the narrowest reading in the spread during that streak.
Below, we show our sentiment composite combining the AAII bull-bear spread with that same spread from the Investors Intelligence survey as well as the NAAIM Exposure index. At the moment, sentiment is only slightly more bearish than the historical norm with the composite at -0.14; it is one of the least pessimistic readings of the current streak. In other words, across surveys sentiment may not have turned bullish, but it appears to be much less bearish than at other points in the past year.
And Helene’s followers are bullish for a fifth straight week, and at an increased rate from last week. As I said two weeks ago, they have generally been right when bullish readings cluster.
Seasonality - As you know at this point, history continues to dictate a strong first quarter, although we remain in a weaker period.
And this is from three weeks ago, but I’ll leave it up for January - from JPM on the January Effect (via Doug Kass)
JANUARY EFFECT
US Market Intel finds that the January Effect is most significant following years where the SPX had a double-digit gain or loss.
Over the last 50 years, the SPX has had a loss that exceeded 10% on eight occasions (2022, 2008, 2002, 2001, 2000, 1977, 1974, and 1973). Following those 7 years (2022 omitted), the succeeding January produced a negative return 5x (71% hit rate) with a -61bps average return (-156bps median return).
Considering each January of the last 50 years, 22x January's monthly return has been negative. Of those 22 years, 15x a negative January has produced a negative Q1 (68% hit rate).
For the 22 negative return January's, the average return is -3.6% (-3.3% median).
For the 15 negative return Q1's, the average return is -6.4% (-4.9% median).
US MKT INTEL VIEW: the data suggests that we will have a negative January and Q1, which aligns with the Marko/Dubravko hypothesis that sees the SPX revisiting 2022 lows driven by a hawkish Fed amid a deteriorating economic backdrop. Further strength in USD with bond yields moving higher likely resets SPX earnings expectations lower with additional multiple contraction.
Although generally January’s have not been great the last 20 years.
And as noted the upcoming week is relatively weak seasonally.
So, overall, as I noted last week, earnings and data will be the big focus for now, particularly with the Fed on autopilot for the next meeting. Last week I was dubious that we could get through resistance given how overbought the market was (although we still remain overbought just not such extremes). This week I’m a little more optimistic, particularly if we can some systematic flows, but emphasis on a little. Breadth remains pretty good though (and ended the week strong) which is an additional tailwind. The beginning of the week is relatively light on data and with no Fed speakers it’s definitely possible we see a rally over resistance. Thursday and Friday will be more about reactions to the data, and all week earnings will be a moderate factor, so any of those have the potential to push us one way or the other. On the negative side, it’s a weak week seasonally, and, well, we are in a bear market for now, so all else equal the general path is down until that’s been broken. We also are still fairly overbought after not having fully reset the more extreme overbought conditions from last week.
Portfolio Notes
Sold out of GS, EFX, HSBC. Had all of the TTE position called away (as well as small pieces of PAA and MMP).
And thought this was interesting given ET and EPD are my two largest positions.
Cash = 55% (this is much higher than I held pre-3Q21, 25% above average since then).
Shorts: SPX (2%), QQQ (2%), XLE (3%)
Positions (after around the top 20 I don’t keep track of their order on a frequent basis as they’re all less than 0.5% of my portfolio).
Core positions (each 3% or more of portfolio, total around 25%) Note the core of my portfolio is energy infrastructure, specifically petroleum focused pipelines (MLP’s due to the tax advantages). If you want to know more about reasons to own pipeline companies this is a decent primer, but I’m happy to answer questions or steer you in the right direction. https://spac.tortoiseadvisors.com/resources/insights/commentary/the-case-for-energy-infrastructure-as-a-real-asset/
EPD, ET, MMP, PAA
Secondary core positions (each at least 0.5% of portfolio, total around 25%)
GOOGL, ENB, AMZN, KMI, WFC, MSFT, CTRA, MPLX
For the rest I’ll split based on how I think about them (these are all less than 0.5% of the portfolio each)
High quality, high conviction (long term), roughly in order of sizing
Higher risk due to business or sector issues; own due to depressed valuation or long term growth potential (secular tailwinds), but at this point I am looking to scale out of these names on strength. These are generally much smaller positions outside of the top three below.
Note: CQP, EPD, ET, MMP, MPLX, PAA, WES all issue K-1s (PAGP is the same as PAA but with a 1099).
Reminder: I am generally a long term investor (12+ month horizon) but about 20% of my portfolio is more short term oriented (just looking for a retracement of a big move for example). This is probably a little more given the current environment. I do like to get paid while I wait though so I am a sucker for a good well supported dividend. I also supplement that with selling calls and puts. When I sell a stock, I almost always use a 1-2% trailstop. If you don’t know what that is, you can look it up on investopedia. But that allows me to continue to participate in a move if it just keeps going. Sometimes those don’t sell for days. When I sell calls or puts I go out 30-60 days and look to buy back at half price. Rather than monitor them I just put in a GTC order at the half price mark.
To see more content, including summaries of most major U.S. economic reports and my morning and nightly updates go to Neil’s Newsletter Substack for newer posts or https://sethiassociates.blogspot.com for the full history. You can also follow me on Twitter at @neilksethi