The Week Ahead - 2/4/24
A detailed look at US equity markets covering fundamentals, technicals, positioning, the economy, the Fed, and everything in between
Short glossary:
SPX = S&P 500
Naz = Nasdaq Composite
NDX = Nasdaq 100 (100 largest stocks in the Naz)
RUT = Russell 2000 (smaller stocks)
DMA = Daily Moving Average (the moving average over the given time period (20, 50, 100, 200 days normally)).
MACD = Moving Average Convergence Divergence (basically a trend indicator)
RSI = 14-day Relative Strength Index (basically what it sounds like)
On my charts, the lines are 20-DMA (green), 50-DMA (purple), 100-DMA (blue), 200-DMA (brown)
Source abbreviations: BBG = Bloomberg; WSJ = Wall Street Journal; RTRS = Reuters; SA = Seeking Alpha; HR = Heisenberg Report
If you're a new reader or maybe one who doesn’t make it to the end feel free to take a second to subscribe now. It’s free!
Or please take a moment to invite others who might be interested to check it out.
Also please note that I do often add to or tweak items after first publishing, so it’s always safest to read it from the website where it will have any updates.
As always, apologize for typos. I’ve given up on having time to do a read through, but I figure better to send it out without a read through than not send it at all.
As a reminder to ease reading for those who read each week, as I reuse a lot of language week-to-week and/or leave in legacy material for reference, I leave anything from prior weeks that hasn’t changed in italics. Only new content will be non-italicized.
For any posts from me w/embedded materials you can go to X to get those (Neil Sethi (@neilksethi) / X (twitter.com).
Next Week
Note that THERE WILL BE NO “WEEK AHEAD” NEXT WEEK (OR DAILY UPDATE FRIDAY). After a series of injuries derailed my plans previously, I am finally going to start competing in brazilian jiu-jitsu, something I have been meaning to do for years (I am a brown belt (so been doing it for a long time) but had a succession of injuries that kept preventing me from competing (I have previously just done competitions in kickboxing)) I have the IBJJF Atlanta Open this weekend as a “toe in the water” comp before the Pan-American Championship in March in Orlando. I’ll do some more over the summer leading up to the World Master (“Master” is what they call anyone over 30 ;-)) in late August, which is the world’s largest jiu-jitsu tournament in Vegas. I will likely not be able to put out a weekend update any of those competition weeks either.
After what could end up being the busiest week of the year (there’s a lot of year left though), we get a welcome breather with a very light week next week at least as far as economic data goes. Just a handful of economic reports including services PMIs, trade balance, consumer credit, and jobless claims. We do though get two more important reports next week. One is the quarterly Senior Loan Officer Opinion Survey (SLOOS) which is closely monitored by the Fed in terms of lending conditions. I’d imagine it will continue to show conditions remaining tight but with the tightening bias continuing to moderate as we saw in the last survey. We’ll also get 2023 revisions to the CPI reports. Those have already been mentioned by some Fed members as something they want to see to confirm that inflation did, in fact, come down as much as we thought it did.
But we’ll ramp up the Fed speaking schedule again now that the blackout is over. I'd imagine we'll hear a lot of what we heard on Wednesday (and perhaps tonight) from Powell (need to wait a little longer for rate cuts, etc.). I'll be interested to see if we get more thoughts on QT's taper/end.
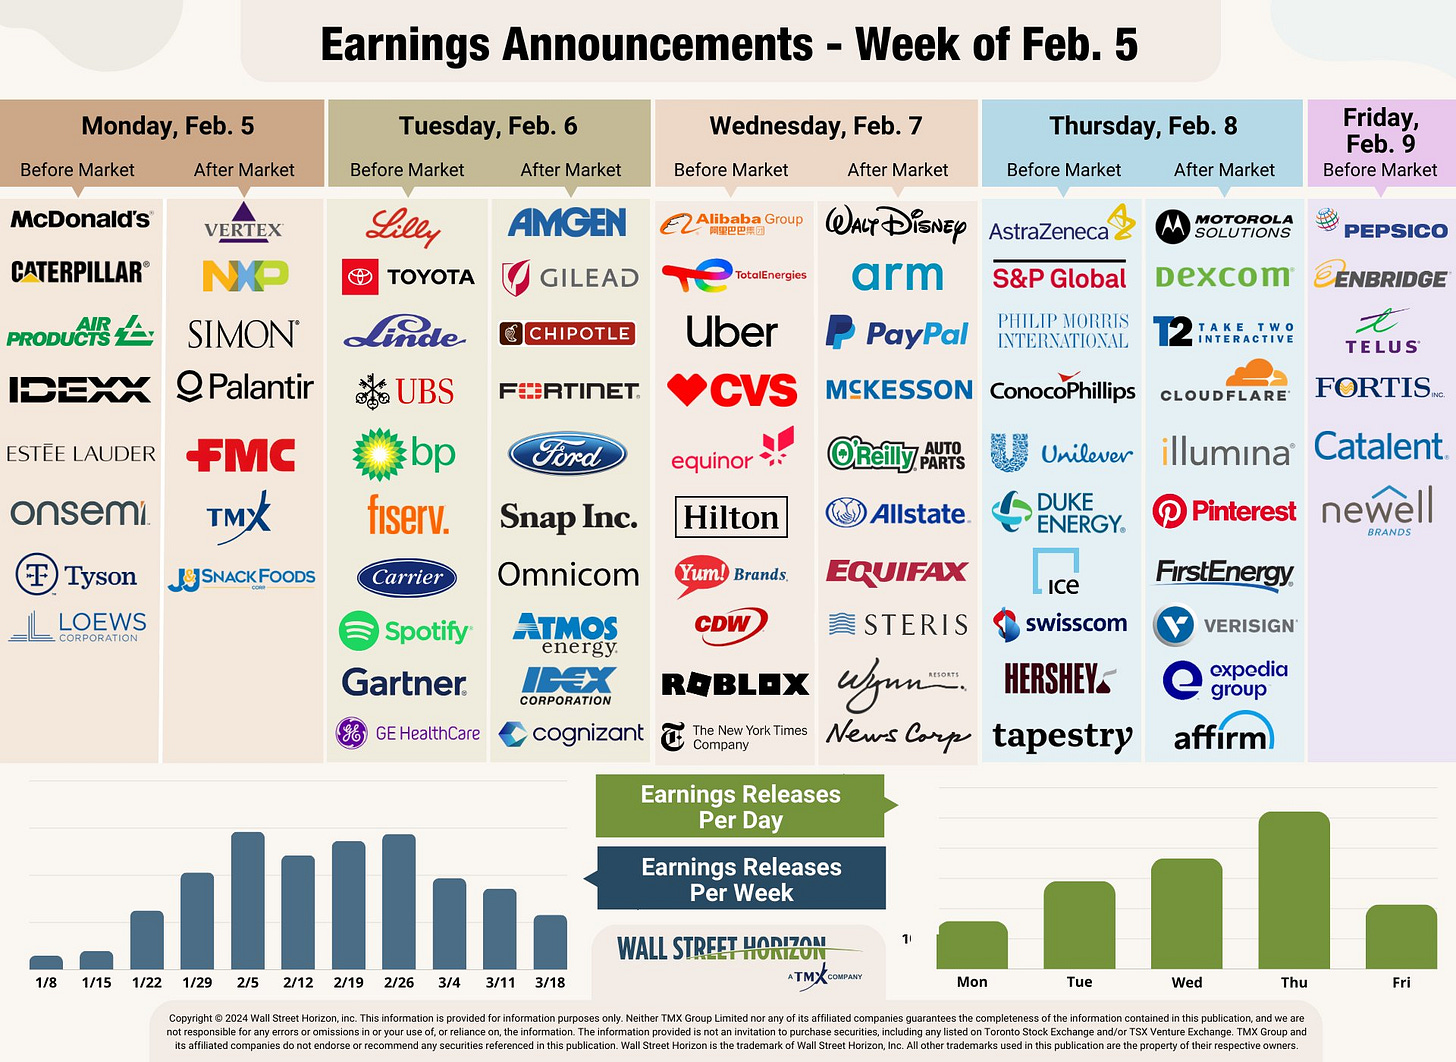
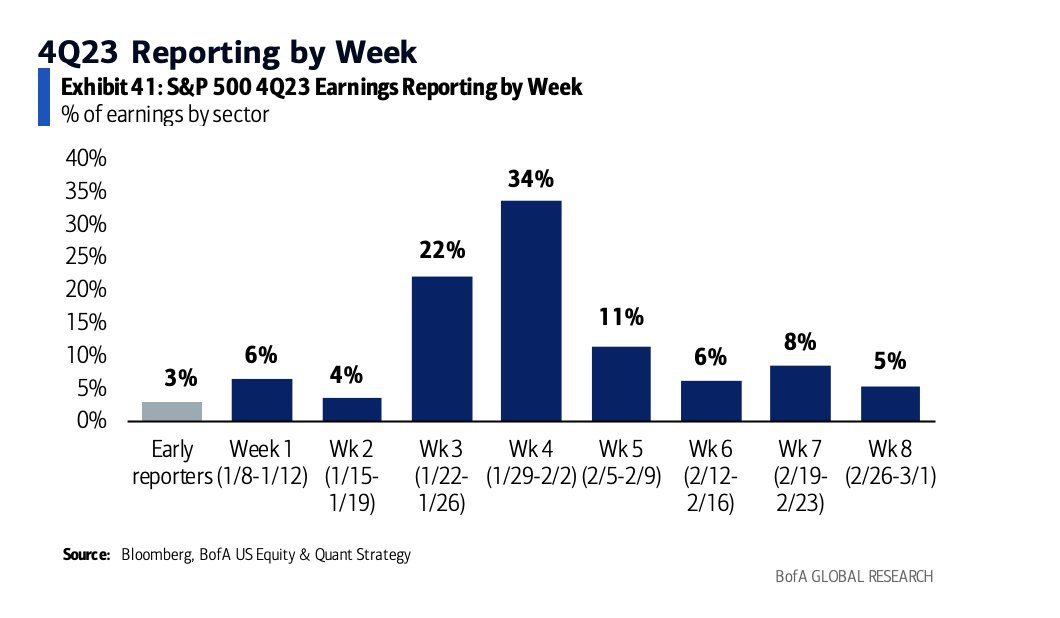
And while we dial it back in terms of market cap of earnings reports next week (11% after 34% this week), in terms of number of reports, we step it up to over 1500 companies reporting.
We’ll also get back to the Treasury auctions with $54B in 3-yrs, $42B in 10-yrs, and $25B in 30-yrs Tues-Thurs. Some believe part of the increase in rates Friday was an "early auction concession". We'll see.
Earnings spotlight: Monday, February 5 - McDonald's (MCD), Caterpillar (CAT), Vertex Pharmaceuticals (VRTX), Tyson Foods (TSN), NXP Semiconductors (NXPI), and Estee Lauder (EL).
Earnings spotlight: Tuesday, February 6 - Eli Lilly (LLY), Toyota Motor (TM), Centene (CNC), Amgen (AMGN), Ford Motor (F), and BP (BP). See the full earnings calendar.
Earnings spotlight: Wednesday, February 7 - Alibaba (BABA), CVS Health (CVS), Fox Corporation (FOXA), McKesson (MCK), Disney (DIS), Uber Technologies (NYSE:UBER), and PayPal (PYPL).
Earnings spotlight: Thursday, February 8 - ConocoPhillips (COP), Philip Morris (PM), Duke Energy (DUK), Expedia (EXPE), Take-Two Interactive (TTWO), Pinterest (PINS), and Kenvue (KVUE). See the full earnings calendar.
Earnings spotlight: Friday, February 9 - PepsiCo (PEP), Newell Brands (NWL), and AMC Networks (AMCX).
Internationally, highlights are global services PMIs, China CPI, German exports, factory orders and production, central bank decisions from Australia to India to Mexico are likely to see interest rates unchanged, while the Paris-based OECD will update its forecasts.
Statistics Canada will release jobs data for January. The focus is on wage growth, which is still rising at a 4% to 5% yearly pace even as the labor market eases.
The Reserve Bank of Australia meets after slower-than-expected inflation in the final quarter of 2023 spurred speculation over a policy pivot by mid-year. Economists expect the bank to keep its cash rate target steady at 4.35% on Tuesday. The focus will fall on comments by Governor Michele Bullock, who’ll hold her first post-meeting press conference as the market weighs prospects for a rate cut in May or June.
On Thursday, the Reserve Bank of India is also expected to keep borrowing costs unchanged. Japanese wage statistics on Tuesday will help shape perceptions on whether the Bank of Japan will end its negative rate regime in March or April. China publishes key inflation data Thursday that will probably confirm deflation gripping the economy, with January’s CPI estimated at minus 0.6% versus minus 0.3% a month earlier.
Eurozone highlights include German export and industrial production figures as well as the release of the European Central Bank’s survey of consumer inflation expectations. Aside from Germany, production reports for December from Italy and Spain are due. Traders on Monday will keenly watch Turkey’s inflation numbers for January.
In Latin America, the coming week will see January consumer price data from Brazil, Chile, Colombia and Mexico following Peru’s Feb. 1 report that inflation slowed to within a whisker of the target range. Colombia may see a near 100 basis-point tumble in the headline reading, Brazil’s print is expected to hit the target range for a third straight month, and analysts forecast a 14th-straight month of slowing in Chile. It’s Mexico where the disinflation trend may wobble as some analysts project a move back up toward 5%. At this week’s rate setting meetings, Banxico will be in no hurry to cut. Analysts forecast a hold at 11.25%, where borrowing costs have been since last March, but Peru is all but certain to deliver a sixth straight quarter-point cut, to 6.25%, with inflation now just 2 basis points outside its 1% to 3% target range.
And here’s BoA’s version.
And here’s a calendar of 2024 central bank meetings.
Market Drivers
So let’s go through the list of items that I think are most important to the direction of equity markets:
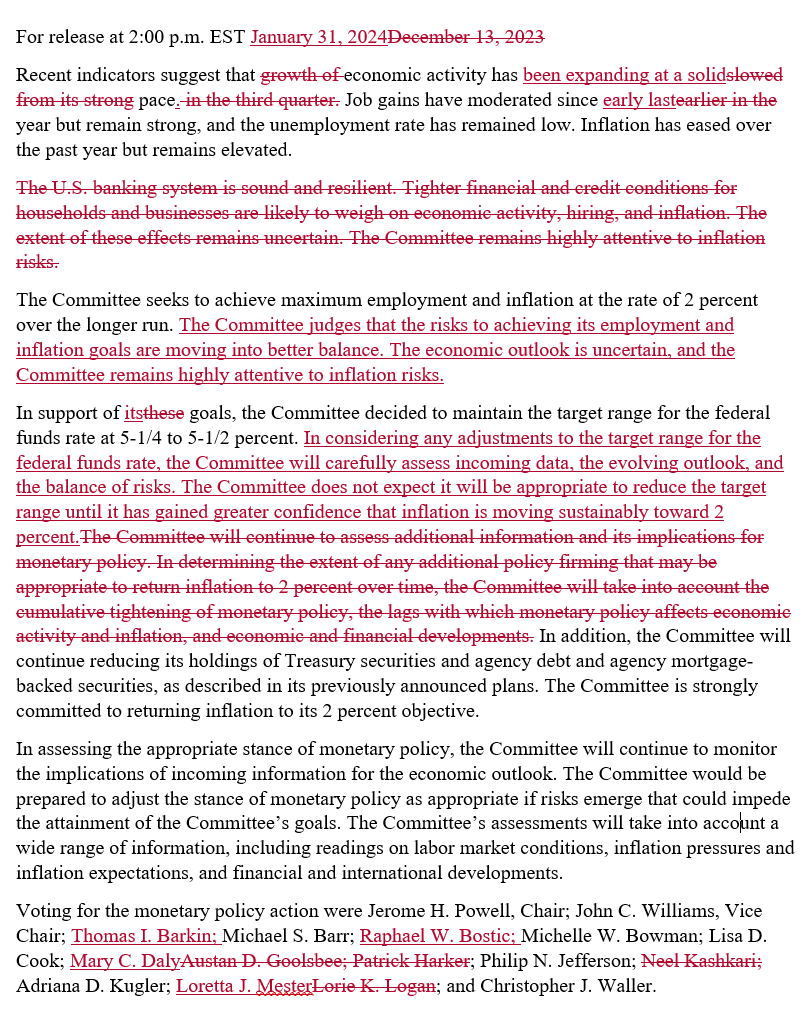
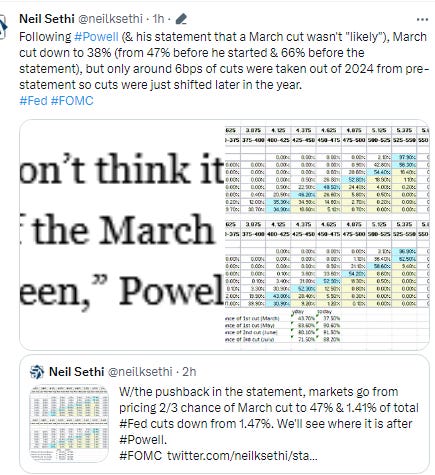
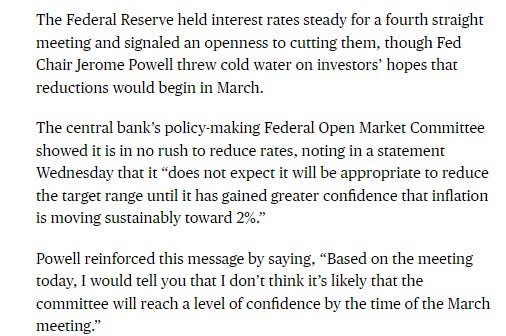
The Fed/Bond Market - A packed week in this area. Of course the main event was the Fed itself in its policy meeting. I went over it in part on Wednesday but copied over those tweets here (as a reminder you can see all the tweets with embedded materials here (Neil Sethi (@neilksethi) / X (twitter.com)). The short of it was some pushback by the statement and then Powell on a March rate cut which saw the probability fall from around 90% prior to the meeting to around 40% (and they’d fall further from there as I get to in a minute). His overriding commentary was that things were progressing fine, but the committee wanted to see them progress a bit longer before cutting rates. Much of the press conference was spent with reporters trying to tease out what that meant. The overall impression I took away was that as Powell really wants consensus, and he’s not exactly sure what the more hawkish members are looking for in terms of how much longer PCE needs to hold around the 2% level, so we’ll sort of just have to wait and see I guess. There was also almost no questions about the balance sheet/QT until the very end, and about all Powell said was that they’d be looking at it at the March meeting. That said he made it clear his expectation was that RRP wouldn’t have to drain to zero, which means QT is coming sooner than later, likely at least teed up at the March or May meetings.
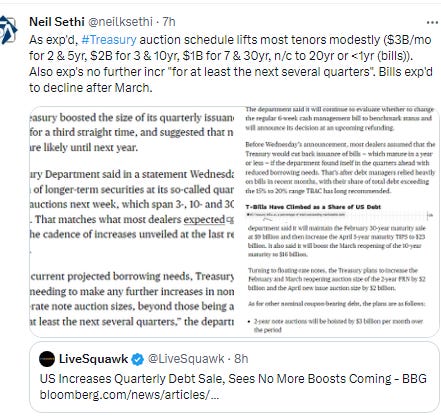
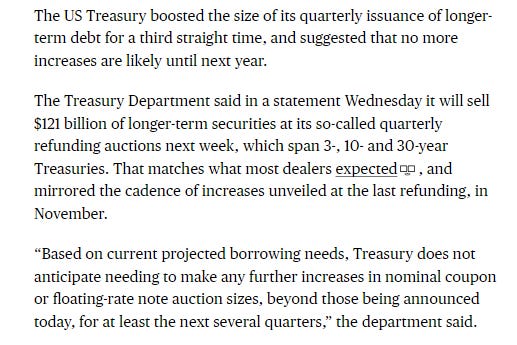
And while Wednesday seems so long ago, we also got the schedule for 1Q Treasury auctions which came in as expected which cleared a key event risk.
In that regard, as noted at the top, we’ll get auctions of 3, 10, and 30-yr notes and bonds this week.
And after all of that we saw almost all the March rate cut calls pushed back.
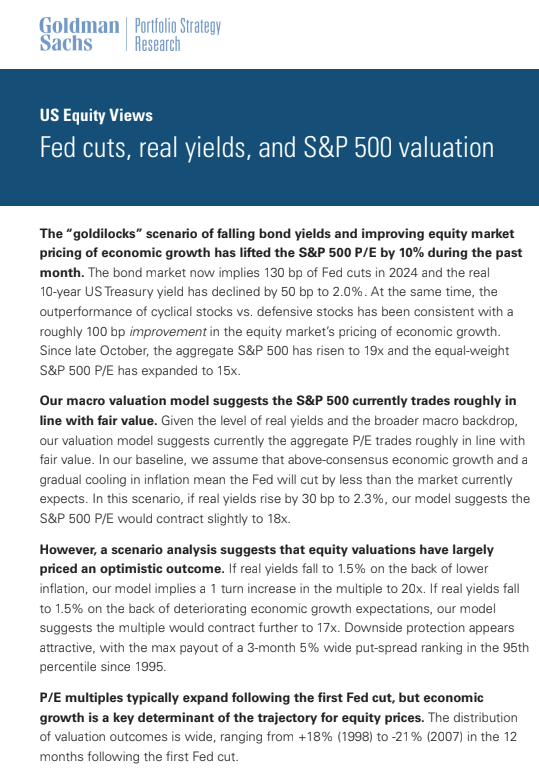
Goldman pushes first Fed cut back to May but still looks for five 2024 cuts & 3 more in 2025.
“We think that the best explanation for today’s meeting is that FOMC participants with a range of different views have compromised on likely starting a bit later,” economist David Mericle wrote in a note.
BoA also pushes out their call for the first cut from March but in their case to June absent an unexpected weakening in the labor market. They also push out the start of tapering QT to May (from March). Barclays also pushed out to May.
And ING sticks with their May call, but then sees 5 2024 cuts and 4 more by mid-2025 but this was pre-NFP.
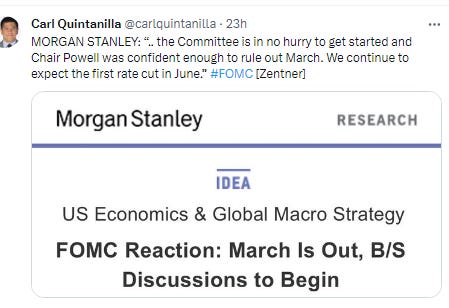
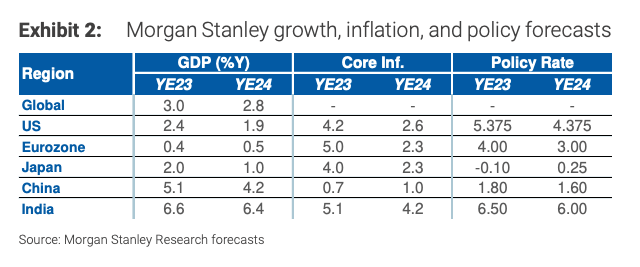
While Morgan Stanley sticks with their June call.
And as noted, the market also pushed back its expectations for a March cut but it basically just moved them down the line with still nearly 6 cuts priced in going into the payrolls report on Friday.
But as discussed in the Friday update, the Non-Farm Payrolls report upset the applecart a bit further coming in almost 2x expectations on the headline with average hourly earnings a full 2x expectations. There was a lot of caveats under the hood, but that drove the action as I went through As discussed that saw a big repricing in Fed cuts taking out a full cut.
Fed rate cut expectations as noted fell sharply pricing out almost a full cut for 2024. March fell to just 21%, a cut by May still is 72%, but that’s down from 96% yesterday, a June second cut is 66% from 97%, and a 3rd cut in July cut is 58% from 96%. The December 2024 implied rate is now 4.13% w/2024 rate cuts at 124 bps down from 147 yesterday.
“A March rate cut now appears increasingly unlikely,” said Jason Pride at Glenmede. “The more likely trajectory is two-three cuts this year beginning around summer.”
“Well, I think we can officially kiss a March rate cut goodbye, and more than likely a May,” said Alex McGrath at NorthEnd Private Wealth.
“The dramatic upside surprise to both jobs and wage growth means that a March rate cut must be off the table now, and a May cut is also now potentially on ice,” eema Shah at Principal Asset Management noted.
The strong market gains remain at nearly unprecedented levels — with shifting expectations on the Fed outlook “unable to crack the momentum,” said Mark Hackett at Nationwide. “Investors remaining on the sidelines are beginning to capitulate, which when paired with the return of share repurchases following earnings season, should act as a tailwind for markets,” Hackett noted.
“January’s US employment report is crazy strong,” ING’s James Knightley remarked, even as he detailed a number of “contradictions” from the release. The subject line of the quick reaction email from BMO’s US rates team read: “STRONG payrolls hit Treasury market.” The all-caps was in the original, and it should be noted that the bank’s Ian Lyngen isn’t generally prone to hyperbole, and certainly not for the sake of it.
So the bar for a March cut seems very high at this point (although notably we still have two CPI/PCE reports and one jobs report between now and then, so you never know). May seems very reasonable if inflation continues to cooperate but there will only be one incremental jobs and CPI/PCE period as it’s on the first of May, so June is lining up as a very likely starting point as there will be a ton of data between now and then, and that meeting will also have an update to the Summary of Economic Projections.
We heard from three speakers since the meeting, Chicago Fed President Austin Goolsbee who isn’t a 2024 voter, one of the nore dovish members, who noted the jobs report might not have been as strong as it looked on the surface, and it shouldn’t necessarily mean the Fed should push off cuts (although parroting Powell he said he hadn’t seen enough yet to start cutting).
While Governor Bowman (perm voter), a more hawkish member, didn’t disappoint saying it was too early to discuss rate cuts. She also notably criticized VC Barr's bank capital proposal saying it would push lending to non-regulated areas.
But most importantly we heard from the Chair himself tonight in a Sixty Minutes interview although disappointingly he parroted himself from Wednesday. Treasury yields rose modestly on the reiteration of no March cut. He did though reiterate that not all members were on board with cutting this year.
So we’re basically in a holding period waiting to get more data. In terms of my expectations, as I said the last few weeks:
as you know I have been proud to note that despite all of the ups and downs over the past 9 months I hadn’t changed my outlook in any material way (looking for rate cuts when core PCE got to 2.5% and/or unemployment over 4% with a negative payroll print and/or something new “breaking”). At this point, with 6-month core PCE falling below 2% (and with Fed officials noting 6-month inflation as a key metric in the FOMC minutes), I think we could see a rate cut at any time, but still feel that March is pushing it. That said, there’s still a lot of data between now and then (two more jobs and CPI/PPI reports most importantly). But I (and I think the Fed) need to see more before rate cuts become a real possibility given the Fed’s utmost desire to not be a reprise of the Arthur Burns Fed that let their foot off before inflation was fully tamed (while I also believe today’s situation is nothing at all like the ‘70’s).
And as noted the one piece of key data we did get, the jobs report, did nothing to accelerate the timeline. So per my note above,
the bar for a March cut seems very high at this point (although notably we still have two CPI/PCE reports and one jobs report between now and then, so you never know). May seems very reasonable if inflation continues to cooperate but there will only be one incremental jobs and CPI/PCE period as it’s on the first of May, so June is lining up as a very likely starting point as there will be a ton of data between now and then, and that meeting will also have an update to the Summary of Economic Projections.
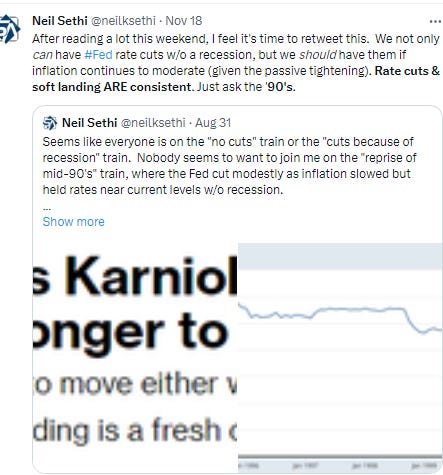
For that reason, as you know, I like very much the 1995 analogy here. Some cuts to reflect the lower inflation rate, but leaving rates in restrictive territory to keep the pressure on prices.
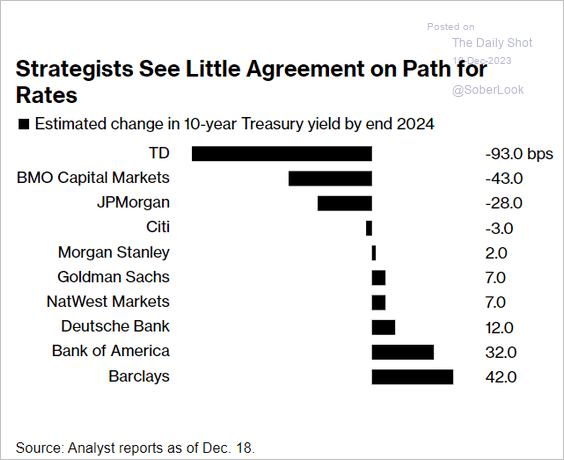
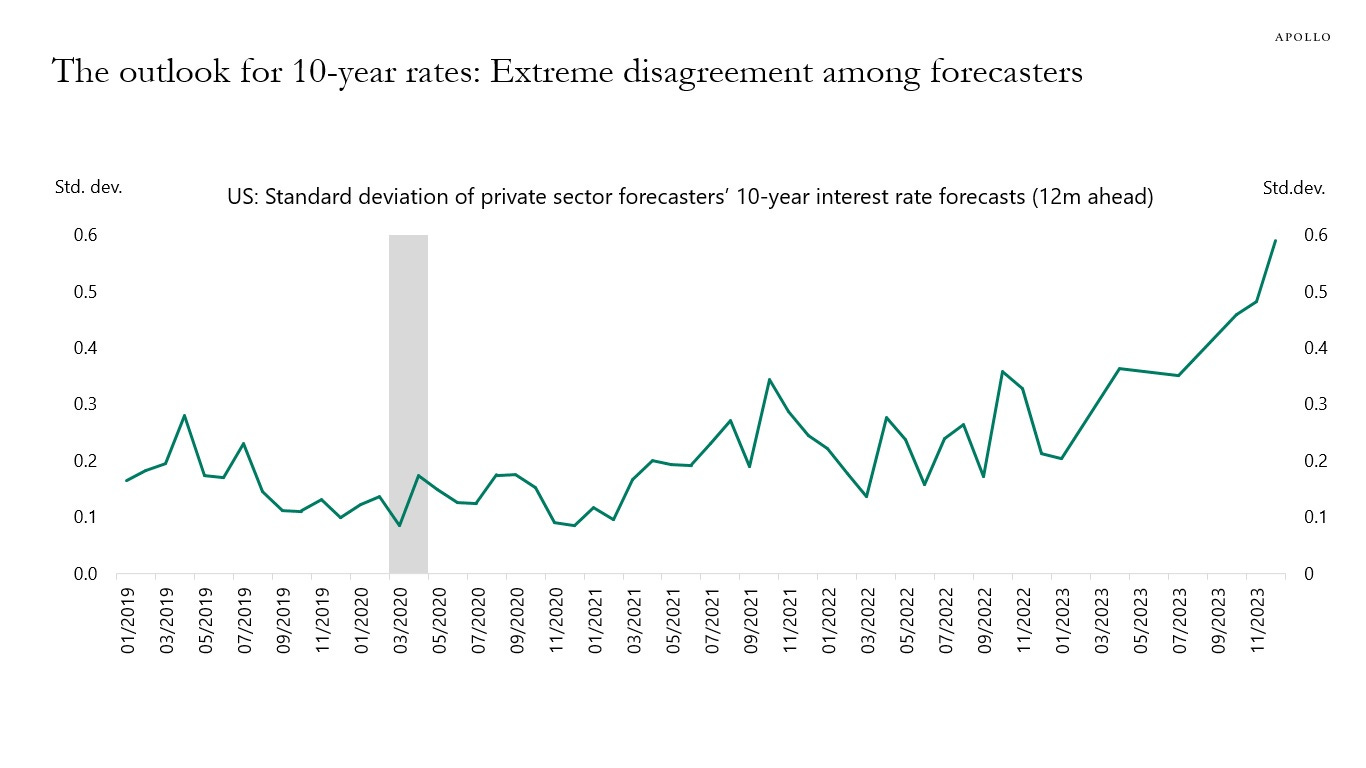
And getting back to the markets, as noted as we came into 2024 there continues to be a relatively big dispersion in thinking about what’s next from here for bonds. As I noted there seemed to be some delineation between those who think we’ll be mostly sub-4% and those who think we’ll mostly trade to the other side of that. Since then most forecasters haven’t changed their thinking much, although haven’t heard any calls for 5% the last two weeks.
And with the big change in Fed expectations we saw the grind lower which gained steam last week reverse sharply, although longer durations remained down on the week, with the 10yr back under that key 4.1% level.
Yields jumped on the NFP report and pricing out of Fed cuts. The 10-yr yield ended up 17 basis points (so basically back to where it was on Wednesday) at 4.03% still down -13 basis points for the week though, the 2-yr note yield was up 19 basis points (so did get back all of the week’s decline) to 4.37%, and the 30-yr bond yield ended up 12 basis points at 4.22%, still down -14 basis points for the week.
In terms of CTA (trend follower) positioning BoA says they had already pared long positions so the move lower in prices (up in yields) likely didn’t have much impact, but they certainly won’t be adding.
And with the jump in 2yrs the 2/10 curve this week fell back to -0.33%.
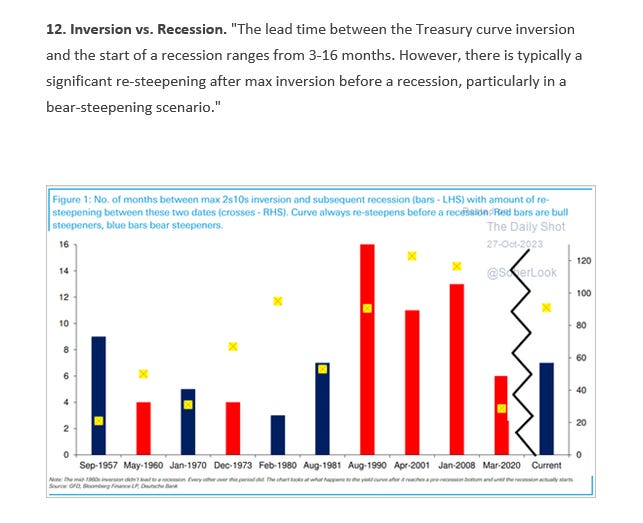
And with respect to the inversion, this was IMO a very interesting post from Jurrien Timmer at Fidelity. He mapped out the path of equities following every “peak inversion”. The results are slightly concerning in that from this point in time following a peak inversion we’ve never seen the equity markets without a significant drawdown.
And bond volatility also saw a small jump after grinding to the least since Sept, although still elevated as compared w/pre-2022.
But as a reminder, the inventor of the MOVE index, Harley Bassman, thinks it will move lower.
And as a reminder Goldman also thinks bond volatility will drop although remain above pre-pandemic levels.
And notably we saw the first pause in the constant grind lower in the Chicago Fed National Financial Conditions Index since November while its adjusted counterpart actually rose slightly after they hit the lowest since Nov 2021 and Jan 2022 respectively.
But as Jurrien Timmer notes, despite financial conditions indices looking loose most members of the Fed continue to say things are "restrictive" as they're laser focused on the real rates of interest, and as Jerome Powell made clear earlier this month less interested in market conditions, although some since have seen the fall in rates as making things less restrictive (Laurie Logan in particular).
While long term inflation expectations fell sharply last week to the lowest of the year at 2.23% as judged by the 5-yr, 5-yr forward rate (exp'd inflation starting in 5 yrs over the following 5 yrs).
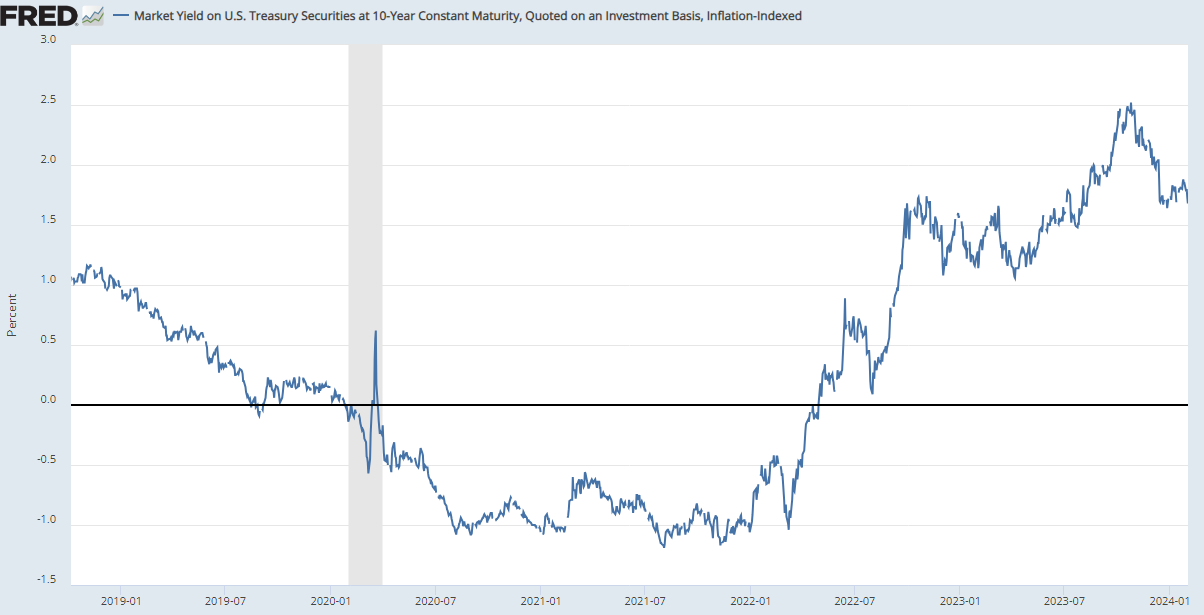
But while long term inflation expectations fell, it wasn’t enough to keep the 10-yr real Treasury yield from also falling to the least of the year at 1.68%, -84bps points from the high in Oct. Still they remain at a level the Fed considers “restrictive”.
And we also saw the 10yr term premium fall back after almost hitting positive territory last week, now -0.18%, still in negative territory which is something the Fed had said they were keeping an eye on (they clearly would prefer it be positive).
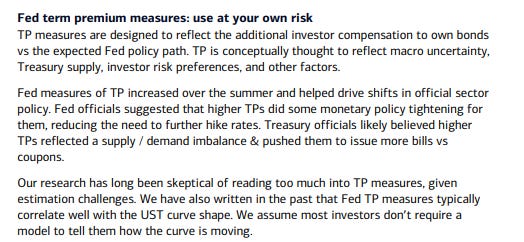
And I’ve decided for now to keep in this background on the term premium for reference purposes:
Typically described as the extra yield investors demand to own longer-term debt instead of rolling over shorter-term securities as they mature, the term premium, in the broadest sense, is seen as protection against unforeseen risks such as inflation and supply-demand shocks, encapsulating everything other than expectations for the path of near-term interest rates.
The problem is it’s not directly observable. Various Wall Street and central bank economists have developed models to estimate it, often with wildly conflicting results. The one thing that most market observers, including Federal Reserve Chair Jerome Powell, can agree on is that in recent months the term premium has soared, likely fueling the dramatic ascent in long-term rates that only recently has started to fade.
The implications for the trajectory of monetary policy are substantial. Powell and other Fed officials have said that the jump in the term premium could hasten the end of their interest-rate hikes by squeezing growth in the economy, effectively doing some of the work for them as they try to rein in inflation. Yet with traders having long struggled to handicap the Fed’s next moves, some warn the central bank’s focus on the notoriously hard-to-understand feature of the US government debt market is making it even more difficult to anticipate the path of rates going forward.
“It seems like a strange door for the Fed to open,” said Jason Williams, a global market strategist at Citigroup Inc. “It’s puzzling as the term premium is something that by definition you can’t know, which the Fed realizes but still is saying its rise is important and can offset some potential hikes.”
The term premium, as its name implies, has historically been a positive number, with the New York Fed’s widely-followed 10-year ACM model — named after creators Tobias Adrian, Richard Crump and Emanuel Moench — averaging about 1.5 percentage points since the early 1960s, as far as the data goes back. More recently, however, it’s been decidedly negative, touching a record low -1.66 percentage points in March 2020.
Yet between mid-July and mid-October it went on a tear. Over the span the measure surged more than 1.3 percentage points, flipping to positive for the first time since 2021. Another popular gauge created by the Fed’s Don Kim and Jonathan Wright shows the metric rising by a more modest, yet still significant, 75 basis points over the span. While both measures have come in between 20 and 35 basis points from their late October peaks, they remain well in positive territory.
“The thing that makes it hard to model the term premium is that God doesn’t tell you what the expected path that short rates are going to be over the next 10 years,” said Former Fed Governor Jeremy Stein, who’s now an economics professor at Harvard University. He’s warned that estimates for the neutral policy rate may be overly influenced by near-term expectations, resulting in term premium measures that are too high.
Although note that some like BoA are skeptical of the usefulness of term premium estimates.
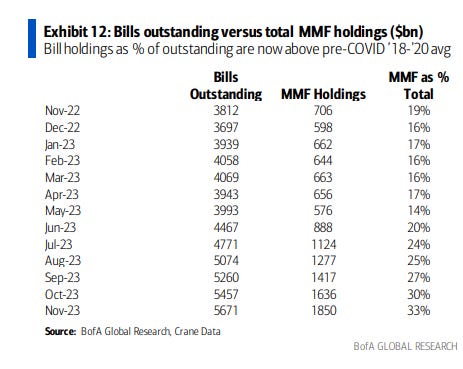
And as noted, I’ve moved the RRP discussion to this section, because as BNY Mellon’s John Velis remarked “[t]he QT debate is less about monetary policy for macroeconomic reasons and more about balance sheet policy related to money market plumbing,” In that regard, we’ll continue to keep get auctions of T-bills (<1 yr) which everyone assumes will continue to be picked up by RRP as money market funds (MMF’s) shift out of the RRP facility due to the slight pickup in yield they can get from Treasuries (as of the end of 2023 they held a larger share of bills than pre-pandemic, 33% of the total). Charts below as of YE 2023.
Which has MMF maturities now back to pre-pandemic levels.
Although MMF’s are overall moving more into commercial paper and similar private holdings from government.
And in that regard, RRP balances fell to $504B on Thursday, the least since 1H 2021, and now down around -$1.7T since the debt ceiling deal (and start of the Treasury refilling the TGA). RRP is down -$283B in 2024 alone. As noted above this is something the Fed will be discussing at the March meeting. As noted I would expect some sort of plan for slowing QT by no later than the May meeting if it continues to fall at this pace.
And I also noted this BBG article with some good background on this subject in December where they note the Fed’s target using past guidance would be around 9% of nominal gross domestic product or $2.6T. This is below what others noted later think things will get dicey. Regardless, one thing to watch for I said is an uptick in use of the Fed’s Standing Repo Facility (a borrowing facility available when market participants are hesitant to lend which would evidence scare reserves).
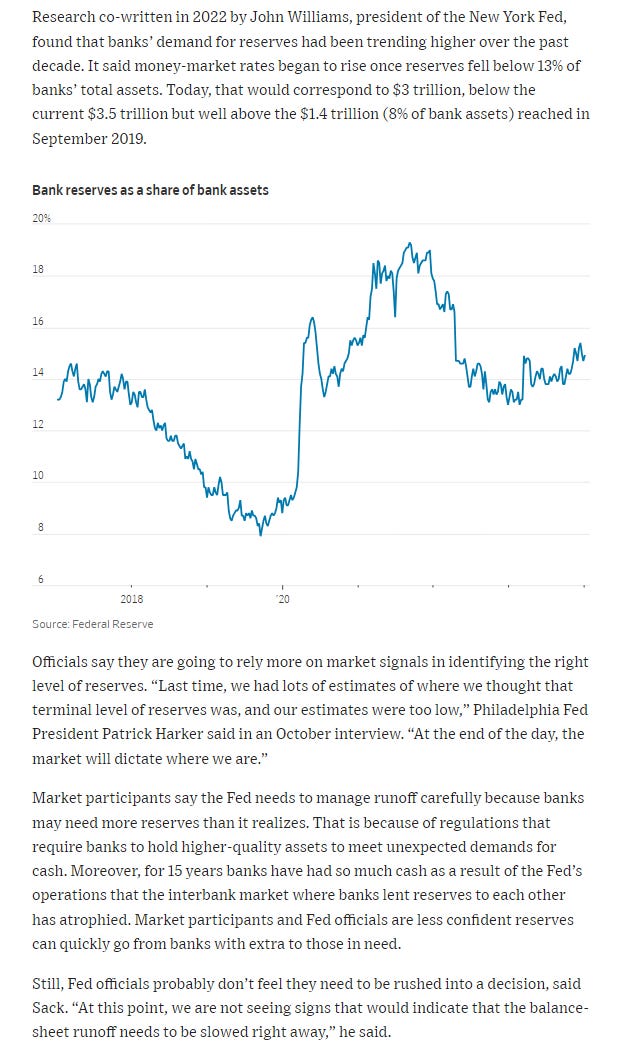
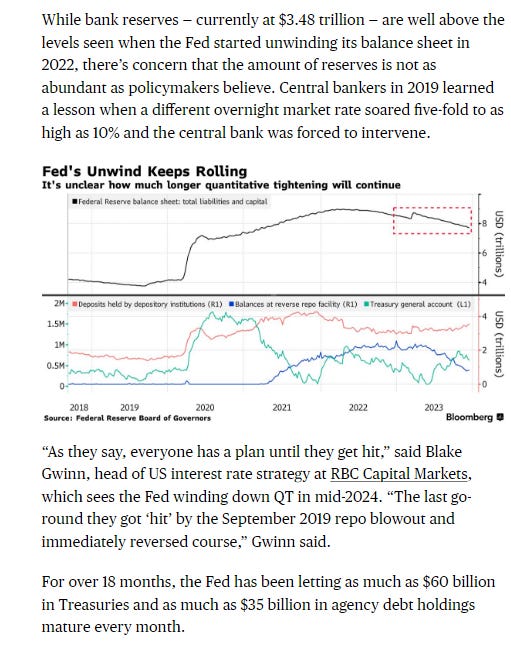
In that regard, Nick Timiraos of the WSJ had an article on the subject last month noting that in 2022 research co-written by John Williams at the NY Fed said that when reserves hit 13% of bank assets money market rates started to rise (indicating funding stresses) which would correspond to $3T not that far below the $3.5T they currently sit at.
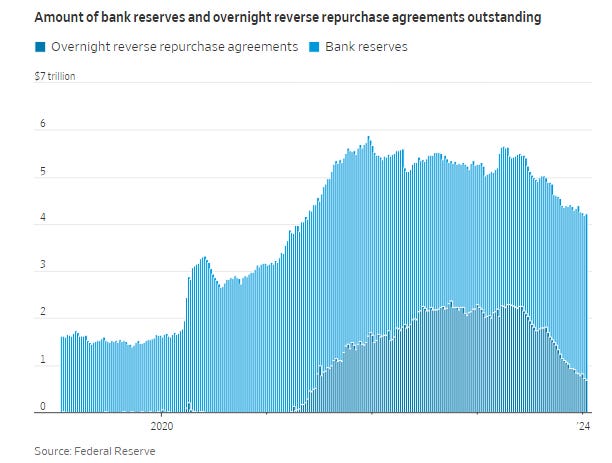
The article also included a nice longer term chart of bank reserves and RRP levels.
So the key question is just where the line is when RRP balances/bank reserves are “too low”. We’re clearly not there yet, but as the Fed learned in the disastrous 2018 episode, it’s hard to tell in advance when you’re there. John Williams, nd Raphael Bostic from their statements appear to be focused on bank reserves which have continued to climb higher (now the highest since 2022), while others such as Laurie Logan seem to believe for a variety of good reasons that banks won’t be allowing reserves to dip, so a focus on RRP is important as when that runs out so perhaps will the capacity to absorb the growing T-Bill supply. It seemed from his answer to the RRP question this week that Powell is at least somewhat on board with that.
And BoA thinks Logan has a point:
Commercial banks have been paying up via large time deposits & other borrowings to offset retail deposit outflows, stabilize the size of their balance sheets, & hold higher liquidity buffers (Exhibit 2, Exhibit 3). These factors have supported increased growth in reserve balances.
Which (that banks won’t be willing to give up their reserves) is consistent with their expectations for reserves to increase versus decrease.
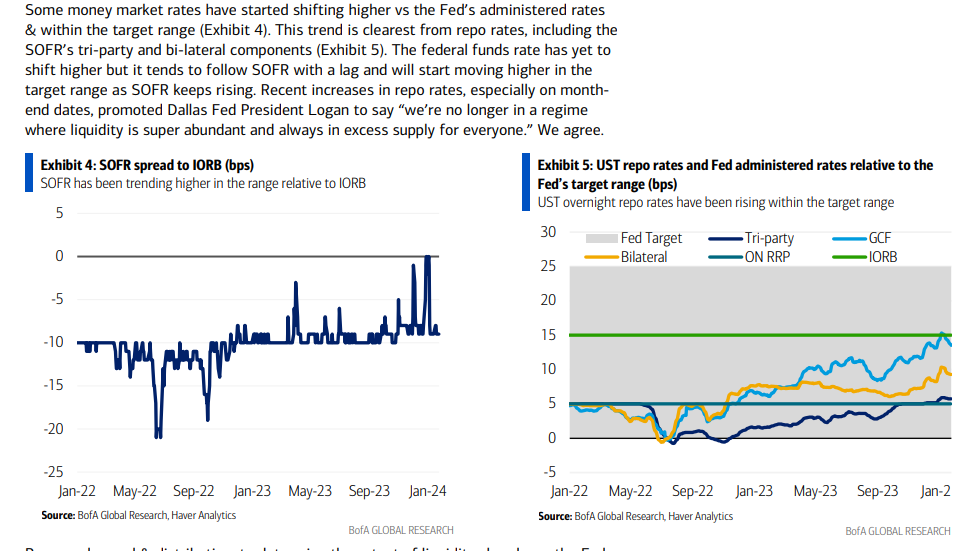
And rising money market borrow rates also indicate we’re moving in the direction of reserve scarcity.
Which as seen BofA come around to the Laurie Logan side of the argument. Previously they had thought that RRP would drain to zero, but now see it getting “low” at $200-250B.
In early Jan Logan wrote: “we should slow the pace of runoff as ON RRP balances approach a low level.” We are not sure of Logan’s judgement around the ON RRP “low level” but believe it is likely $200- 250b (see Logan and QT: QT taper now in March). At the recent ON RRP run rate, the low level of $200-250b could be reached in March. The prior considerations drove us to revise our timing for QT slowdown announcement to the March FOMC. We acknowledge uncertainty around this estimate and will revise our expectation with Fed guidance. Not all Fed officials agree with Logan’s assessment but we overweight her views given her familiarity & expertise on technical aspects of monetary policy implementation. Other Fed officials have argued for slowing QT once there is sustained SRF use, but we don’t see the logic of adding liquidity via SRF & continuing draining liquidity via QT; if there is sustained SRF use, the Fed will likely cease QT shortly thereafter. We expect Logan’s views on QT & policy implementation to sway others within the Fed.
Barclays also thinks that RRP will not drain to zero and QT could be pared as early as May or June which I think is note unreasonable (at least June).
And as noted ending 2023 the economics team at BOA also sees QT ending in June. I think June is very early for it to stop but can definitely see it slowing by then.
And Goldman also sees a tapering announcement in May leading to a Q1 2025 end to QT.
And FWIW BMO several weeks ago noted the 6.4% of GDP level as the “no mas” point for reserve drain in past episodes, well below the current 11.5%. That said they noted
So far, “the risk of reserve scarcity similar to September 2019 [has been] low on the Fed’s list of worries [but] with bill issuance set to stay lofty as a share of overall debt outstanding and QT continuing to shrink SOMA, the state of the funding market is a space to watch,” Lyngen wrote. “The risk remains that the removal of liquidity doesn’t play out in linear fashion… necessitat[ing] a more dovish shift in policy sooner than Powell would prefer.” (HR).
And some background on the 2018 meltdown in markets following Powell’s infamous statement that QT was “on autopilot”. I’d imagine that’s a moment he’d like to not repeat.
And I’ve talked weekly about the the favorable terms of the BTFP (new post-SVB Fed emergency lending facility) in particular the rate arbitrage due to the expectations for lower fed funds in future months lowering the borrow rate well below the discount window interest rate return for parking excess reserves creating an arbitrage for banks to take advantage of where institutions borrow from the facility and then park the proceeds in their account at the Fed to earn interest on reserve balances. Well, that arbitrage was ended last week, and, unsurprisingly, BTFP levels fell back.
Getting back to rates, as I’ve been noting the past few months,
while I think there’s a decent chance we have seen the peak in yields (if they do make it back to 5% (or even 4.5% at this point (or I guess even 4.1% based on recent market action)), I think there’s a wall of buyers, but I also don’t think we’re going to see sub-3% 10-year Treasury yields anytime in the near future (even sub-3.5% to me seems a stretch). So while it’s a wide range, I expect 10-yrs to trade in the 3.5-4.5% range for at least the next few months dependent of course on the economy not deteriorating rapidly or inflation seeing an unexpected resurgence.
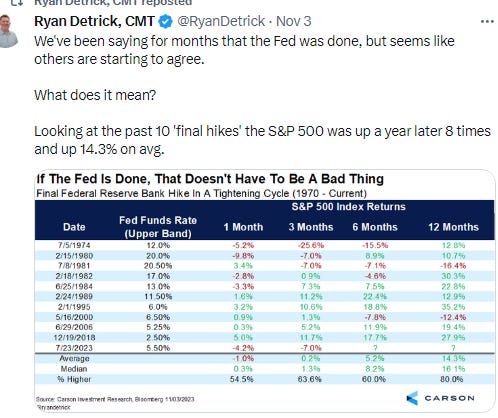
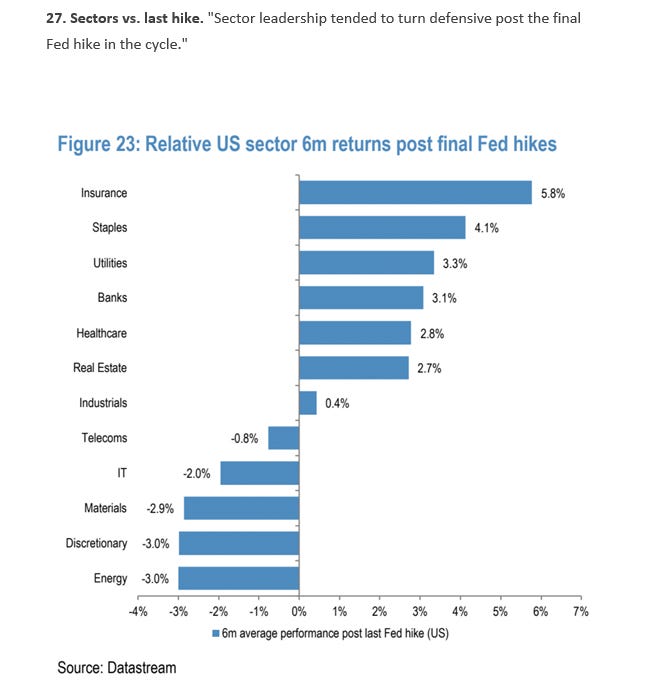
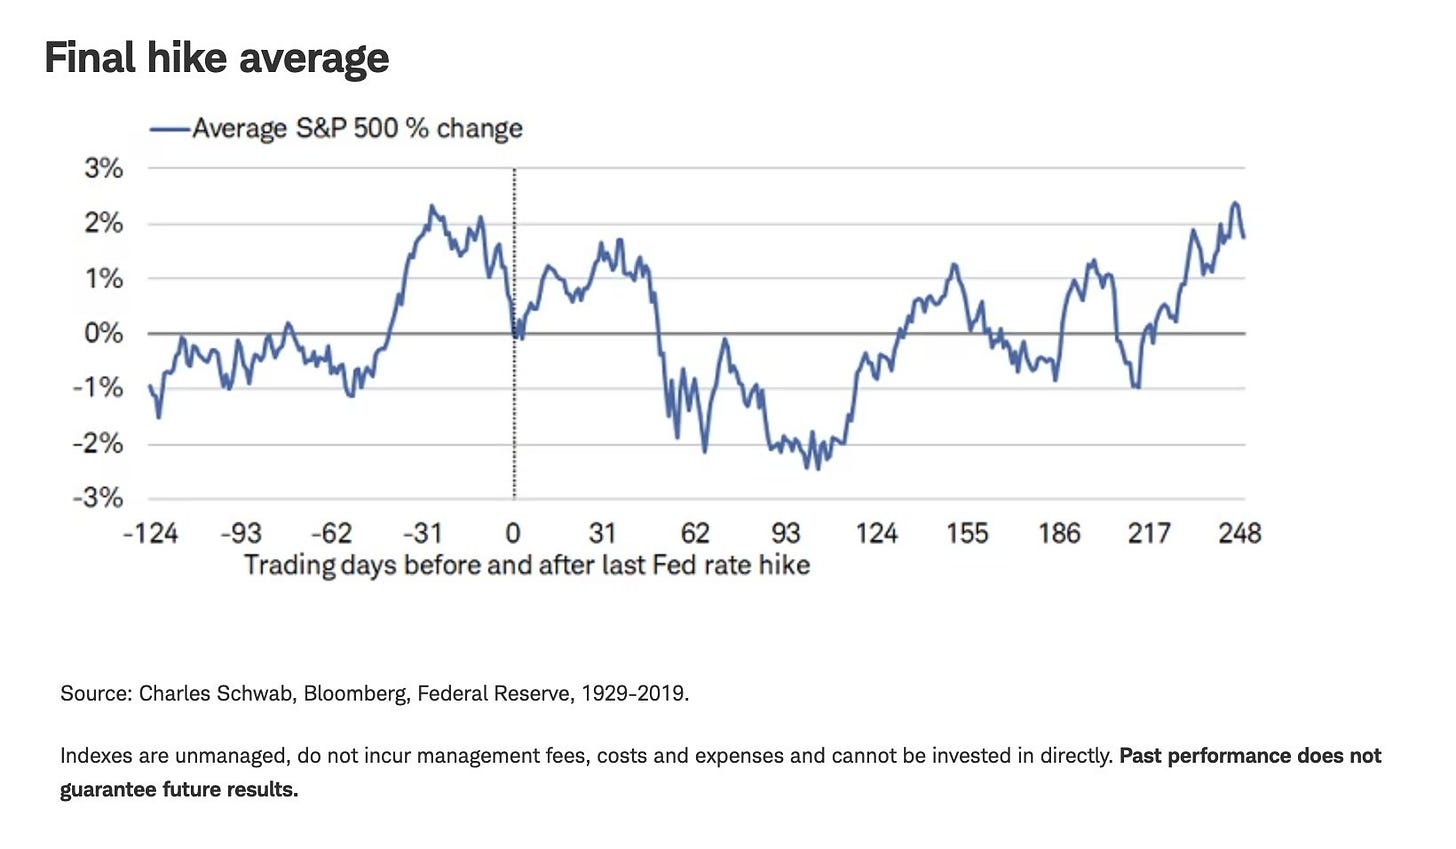
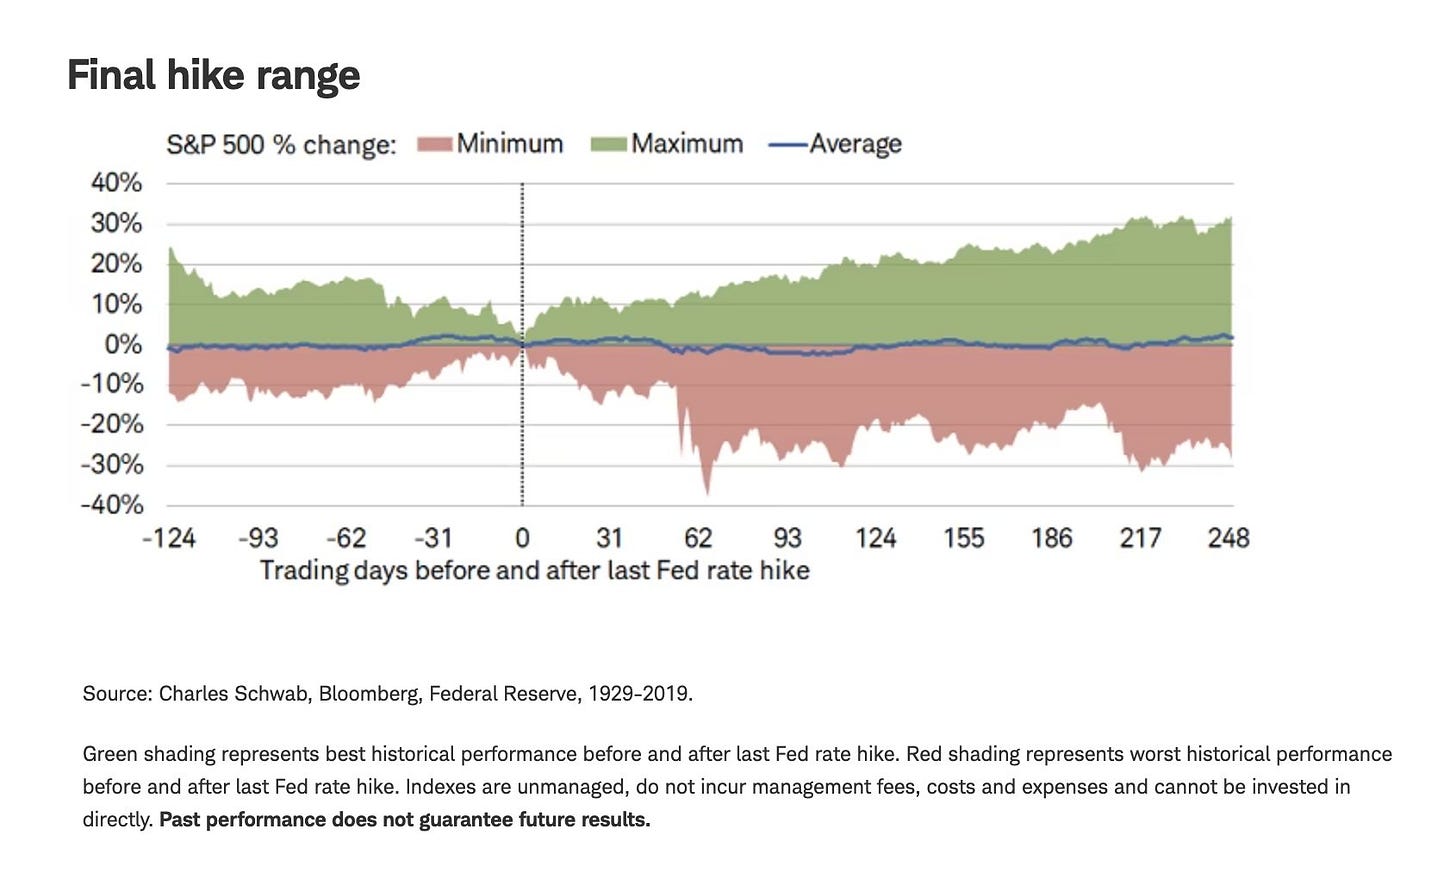
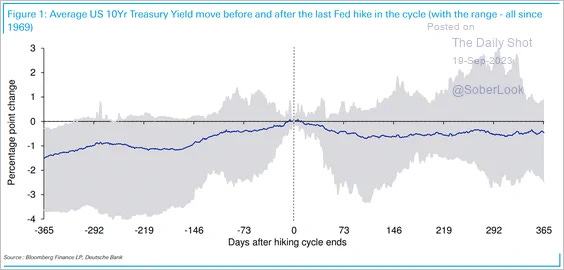
And keeping up those “final hike” charts for now. I said that before because I wasn’t sure if it was the final hike. Now I think we’re pretty sure July was the last one. Also note that there is relatively high dispersion in the data points and not a ton of samples so these need to be taken with a big grain of salt.
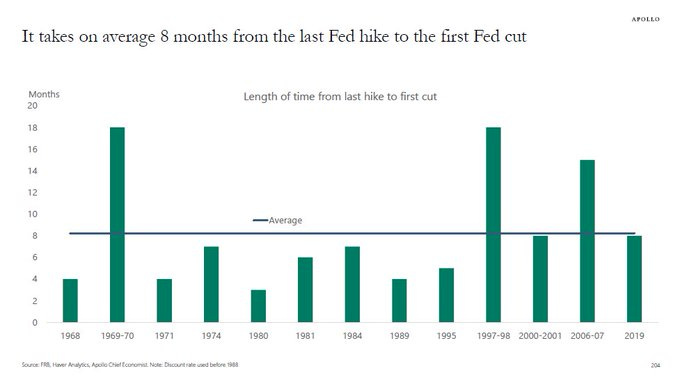
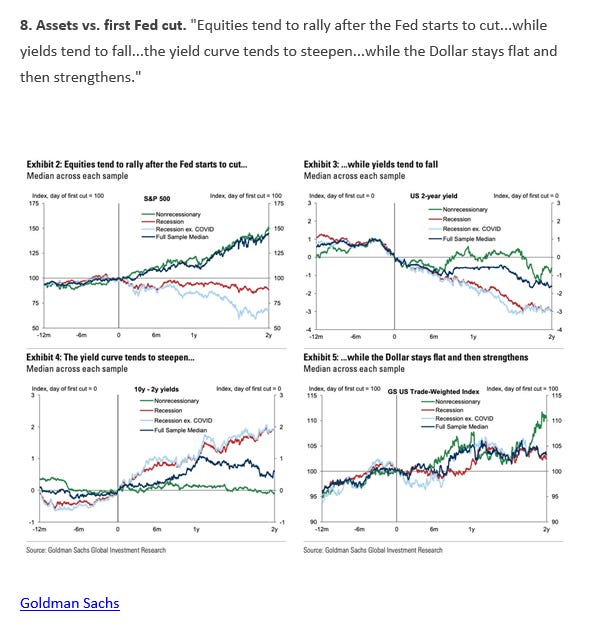
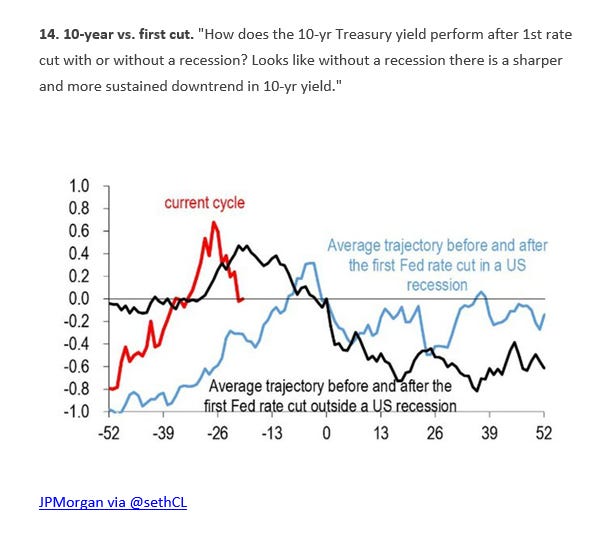
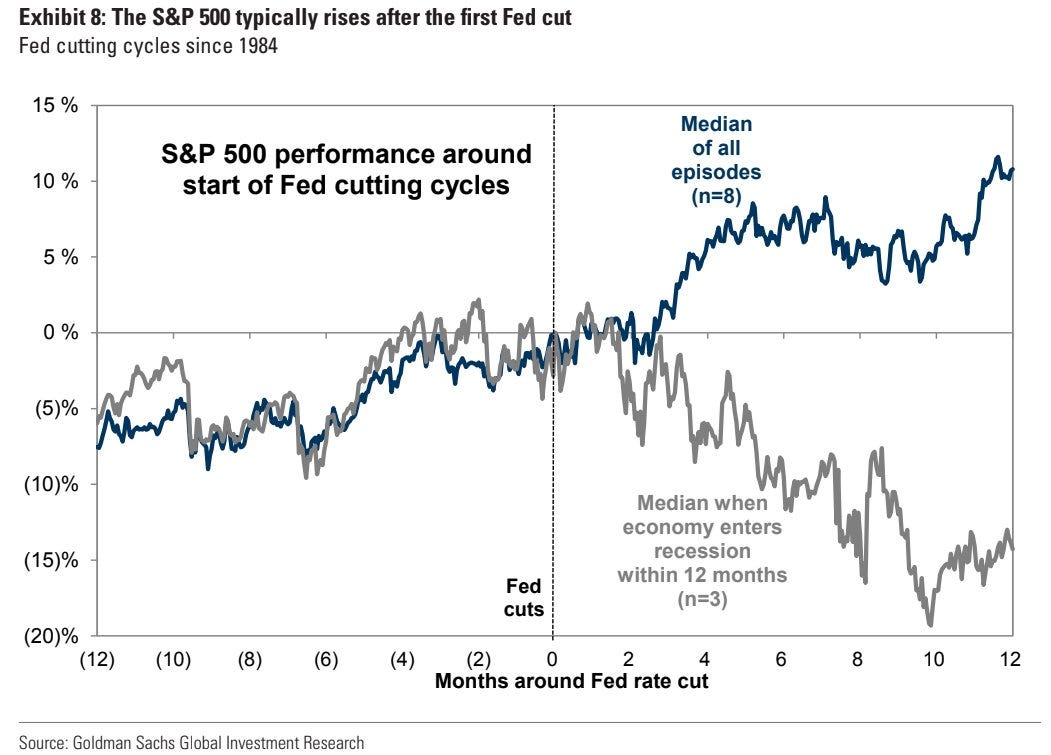
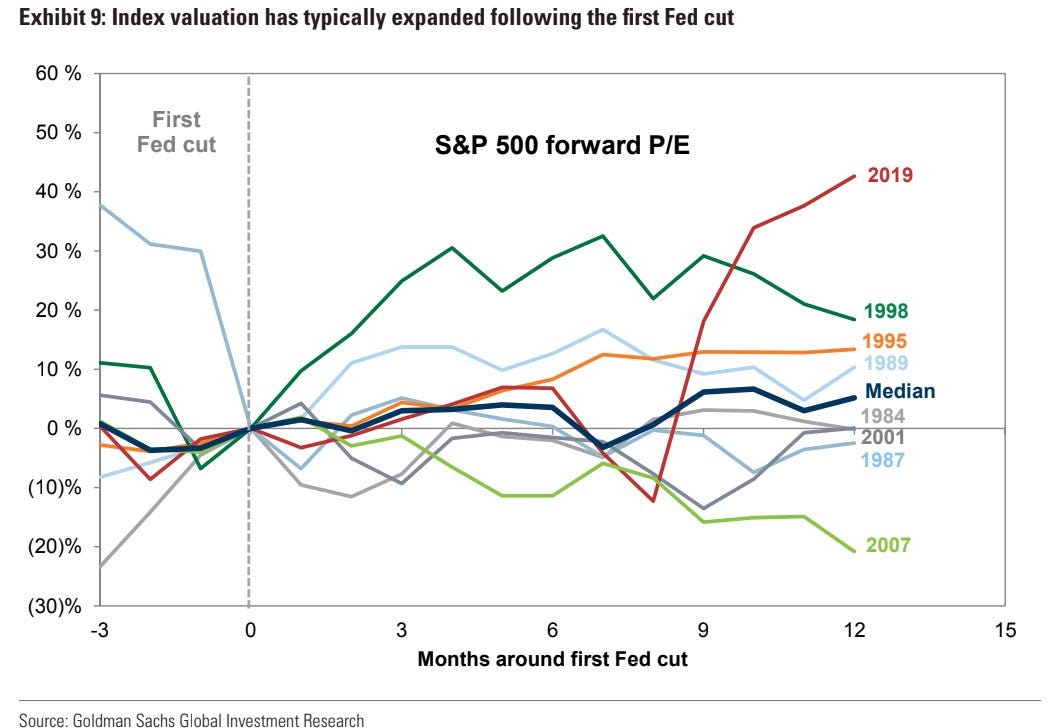
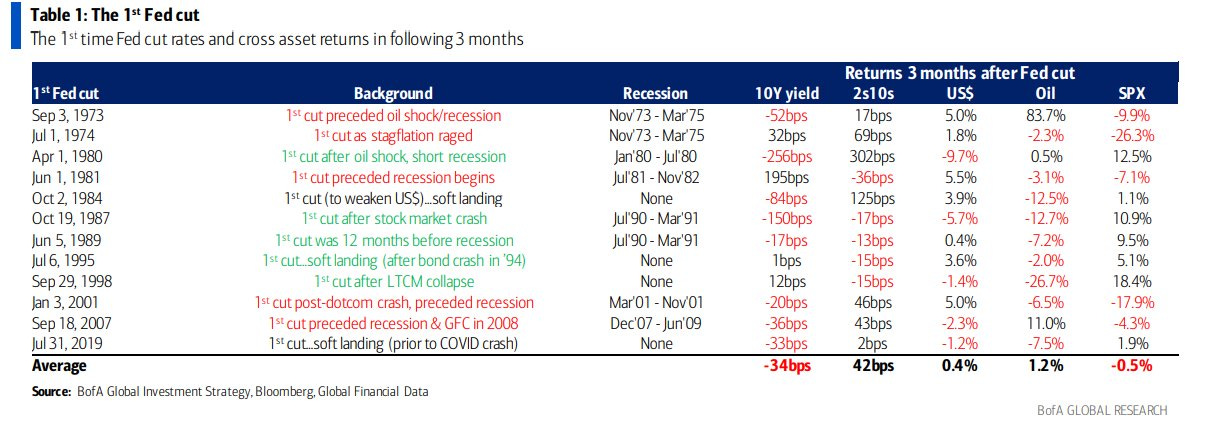
But soon those will be retired, and we’ll be looking at more and more “first Fed cut” stuff. As noted previously, though, this really comes down to a question more about a recession than anything else.
Great chart from Citi which brings home 2024 is not so much all about Fed cuts (which are likely coming) but more about whether those are "adjustment" cuts or whether those are "recession" cuts.
And note that equity performance after curve uninversion (if that’s a word) is a similar story (recession vs no recession).
Earnings - As I noted coming into 2023,
Along with the path of inflation this is a critical point for 2023. Do earnings hold up or do they crack? I think they will continue to be “better than feared”, but if not we’re likely looking at a new low for this bear market or at least a revisit to the lows.
And as I noted coming into 2024,
2024 won’t be much different in that regard, although the big difference between this year and a year ago is nobody is looking for a big earnings drawdown this year. Instead, the question is whether we get anything like the robust growth that is currently priced in (around 12% y/y), particularly for the back half of the year. As you know I have my doubts, but I’m open to the idea. FWIW BBG’s excellent strategist Gina Martin Adams has said that by her work markets were pricing 0% growth in EPS [probably a little more now]. I think that’s based on her feeling that 20x is a “fair” multiple, which I have a hard time disagreeing with as discussed later. But regardless, with markets already trading at around a 20 multiple, there’s not much room for further multiple growth, so earnings will most likely have to do the heavy lifting to support further gains in equity markets.
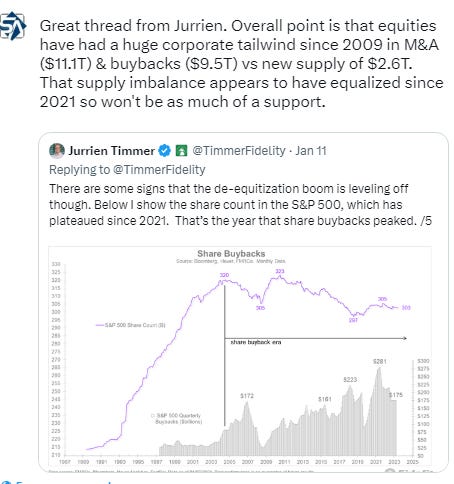
And in that regard, Jurrien Timmer had a great thread with an analysis I've never seen before positing that its either an earnings expansion or a multiple expansion driving stock gains but typically not both. We've gotten the multiple expansion, so now it's time for the earnings to come through.
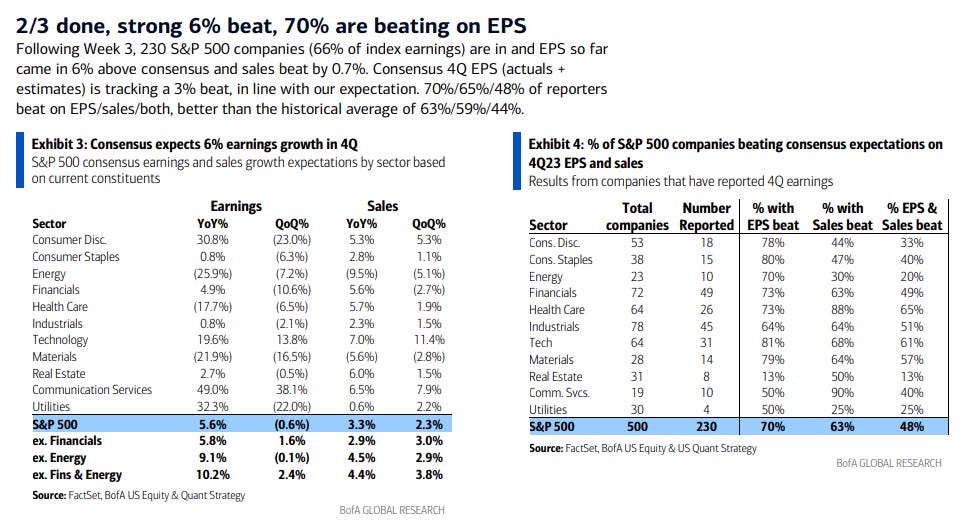
But as noted since November, 4Q expectations had deteriorated markedly coming into and through the first week of the season on the back of relatively weak guidance (65% of 111 issued guidance was negative (above 5 & 10 yr avgs)), and then on the back of weaker than expected results from the big banks. As of the start of earnings, Q4 was expected to see a decline of -0.1% down from growth of +1.3% last week (and down 84% from where it stood September 30th (8.1%)). But as DB and Goldman noted the big drop in 4Q expectations set up a big beat.
And with a huge week of earnings under our belt (with now 46% of companies having reported through Thursday (although 66% by market cap)) 72% have beaten, up from 62% two weeks ago, but still below the 5-year average of 77% and 10-year average of 74%. Thankfully though the massive -18.1% reports vs expectations two weeks ago has now flipped to +2.6% above estimates still though significantly below the 5-year average of +8.5% & 10-year average of +6.7%). BoA forecasts a 4% beat (see below). That said, Factset notes that of the companies reporting since Jan 19th, 75% have beaten by an avg of 7.3%. That brings expectations for 4Q up over three full percent to +1.6% from -1.4% last week, compared to -0.3% to start the season (and +1.5% coming into the year). “Positive earnings surprises reported by companies in multiple sectors (led by the Health Care, Information Technology, Energy, and Consumer Discretionary sectors) were the largest contributors to the increase in overall earnings for the index during the past week.” These have helped offset the miserable performance from financials to start the season.
Turning to 2024, as I’ve noted in past weeks, it’s 2024 that we need to start watching for, and analysts had penciled in a nice jump of almost 12% to over $247 when we started the 3Q reporting season. That had held up much better than normal since July through the end of 2023, but as noted two weeks ago has seen some signs of finally coming down as is more typical since we’ve moved into 2024. As of this week it’s at $242.65, now down over $2 the last four weeks, and around $3.95 from the start of Q3 season. That’s still much better than what we’ve historically seen, but it’s catching up. Even with the declines though we’re still talking about a healthy double digit increase. That said, Q1 is at 3.6% which seems very reasonable. Q2 and Q3 have also come down to 9.4% and 8.1% respectively but Q4 2024 remains a tall order at 19.0% (but that’s still down from 21% a week ago). As always of course the question will be if earnings can exceed whatever bar the market has priced in.
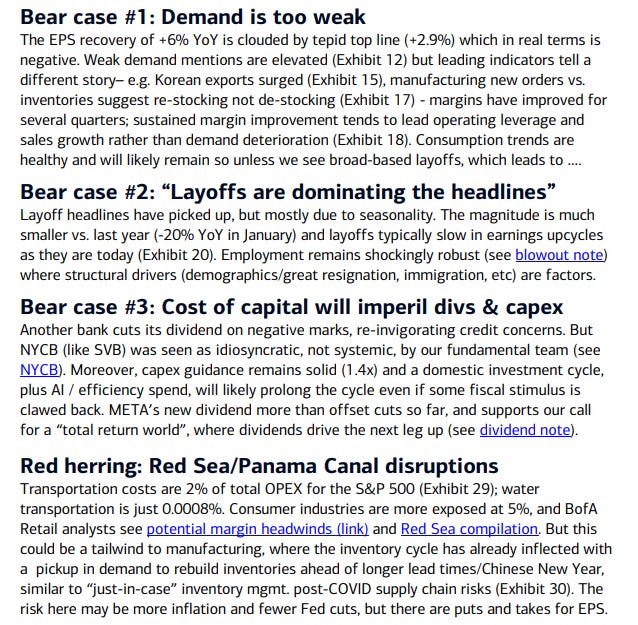
While BoA lays out 3 “bear cases” to 2024 earnings (and why they currently see them as not an issue).
Also, as noted in earlier reports, both GS and BofA agree with my pessimism about 2024, both looking for more around 5-6% in 2024 earnings growth, although they are above consensus for Q4. A little surprisingly, Morgan Stanley (who was perhaps the most aggressive at calling for sub-$200 earnings in 2023 now sees $2I5 as their base case (which clearly is too low), but now sees $229 (+7%) in 2024. In addition to that +7% EPS growth in 2024, Wilson sees earnings growing +16%(!) in 2025. As Mike Wilson noted this week, he was “too bearish in terms of expected magnitude of the decline.” While all are below the +12% consensus, it's certainly no earnings collapse that would require a big market correction. And of course given their market caps, much depends on the top 5 stocks to deliver robust y/y earnings (exp's are for +34%).
But Goldman says they see upside risk to their EPS forecasts in 2024 of $237 (a little below consensus at $242).
US corporate earnings may exceed current forecasts in 2024, powered by a strong economy and falling interest rates, said strategists at Goldman Sachs Group Inc.
S&P 500 companies’ earnings per share are forecast to rise 5% to $237 this year, the team led by chief US equity strategist David Kostin predicted in a weekly research note.
“We see potential upside to our EPS estimate from stronger US economic growth, lower interest rates, and a weaker dollar” despite lower oil prices, the strategists said.
While a BBG survey of users in early January found 50% think 2024 estimates are too high. Leaving this in to see how it goes.
And with much being of made of profit margins with those more bearish looking for margins to contract back towards pre-pandemic levels while those more bullish think they will maintain or perhaps even extend, so far they’ve come in below prior quarter, prior year, and 5-yr average so I guess more in the bear’s camp although they improved this week from 10.7% last week.
And luckily for many companies that have reported, the market is rewarding positive earnings surprises reported by S&P 500 companies around average but punishing negative EPS surprises reported by S&P 500 companies less than average.
To date, the market is rewarding positive earnings surprises reported by S&P 500 companies near average levels and punishing negative EPS surprises reported by S&P 500 companies less than average. Companies that have reported positive earnings surprises for Q4 2023 have seen an average price increase of +1.1% two days before the earnings release through two days after the earnings release. This percentage increase is slightly larger than the 5-year average price increase of +1.0% during this same window for companies reporting positive earnings surprises. Companies that have reported negative earnings surprises for Q4 2023 have seen an average price decrease of -1.0% two days before the earnings release through two days after the earnings. This percentage decrease is smaller than the 5-year average price decrease of -2.3% during this same window for companies reporting negative earnings surprises.
So for now we will as I said coming into 4Q earnings (as I did with 3Q (and 2Q and 1Q and 4Q22, etc.), that earnings will continue to come in sufficient to avoid any sort of large selloffs in the markets:
This is not going to be “the quarter” we get the great “reckoning” in earnings expectations to the bears sub-$200 number. As I said last week, “if we continue to beat the lowered bar, it will be a support,” and so far it definitely has been. But with the economic resilience, strategists are becoming more convinced we’re getting to the end of the earnings recession, and remember what I’ve written previously: Stocks normally bottom well in advance of earnings so if 2Q23 was the bottom for earnings then stocks bottoming in October makes sense.
But note the huge disparity between the mega-cap growth stocks and small caps. If you're looking for a reason why the QQQ is at a record high and RUT is lagging, this pretty well encapsulates it.
And Factset notes that as of this week, using analyst bottom-up price targets, they’re now expecting a over 5,300 SPX this year up from 5280 last week. Remember in 2023 they were within a couple percent which is unusual. Typically they are 7.2% too high, although they’ve undershot 4 of the last 6 years.
The bottom-up target price for the S&P 500 is 5340.48, which is 8.9% above the closing price of 4906.19. At the sector level, the Energy (+20.5%) sector is expected to see the largest price increase, as this sector has the largest upside difference between the bottom-up target price and the closing price. On the other hand, the Industrials (+5.5%) sector is expected to see the smallest price increase, as this sector has the smallest upside difference between the bottom-up target price and the closing price.
And of course you can always choose your own inputs to the P/E model.
And on the importance of earnings (and dividends):
Economy - As I’ve written over the past year, part of my earnings optimism has been due to the economy holding up better than expected. While earnings only track the economy loosely (and markets look forward 6-12 months), there is a clear correlation between recessions, lower earnings, and lower stock prices. As noted last week,
So far, though, the economy has held in, and while coming into 4Q23 we had seen clear signs of deceleration from the red hot economy of a year ago, the 4Q GDP print showed the economy running hotter than most everyone expected on an inflation-adjusted basis with consumption, government spending, and exports all above expectations with investment slowing but also remaining relatively robust. We also saw strong business spending in the durable goods report, an inflection higher in both manufacturing and services PMI’s as well as both new home and existing home sales (as well as purchase mortgage applications the highest since April) and exports and continued low levels of jobless claims. An economy teetering on the brink of recession this does not seem to be.
And this week provided more confirmation that if anything we seem to be seeing an economic reacceleration. Home prices moved higher, consumer confidence improved, job openings remained robust, while ADP was weak, the NFP report was generally considered a blowout as I went through on Friday, claims ticked up but remain low, productivity is strong, construction spending is strong, business spending hit an ATH, and the manufacturing PMIs showed continued improvement.
Which saw the Citi economic surprise index continue its bounce off the zero line now the highest since November.
Although I should also note while there is a correlation as noted above, a soft landing for the economy doesn’t necessarily equate to a strong stock market as Jurrien Timmer points out.
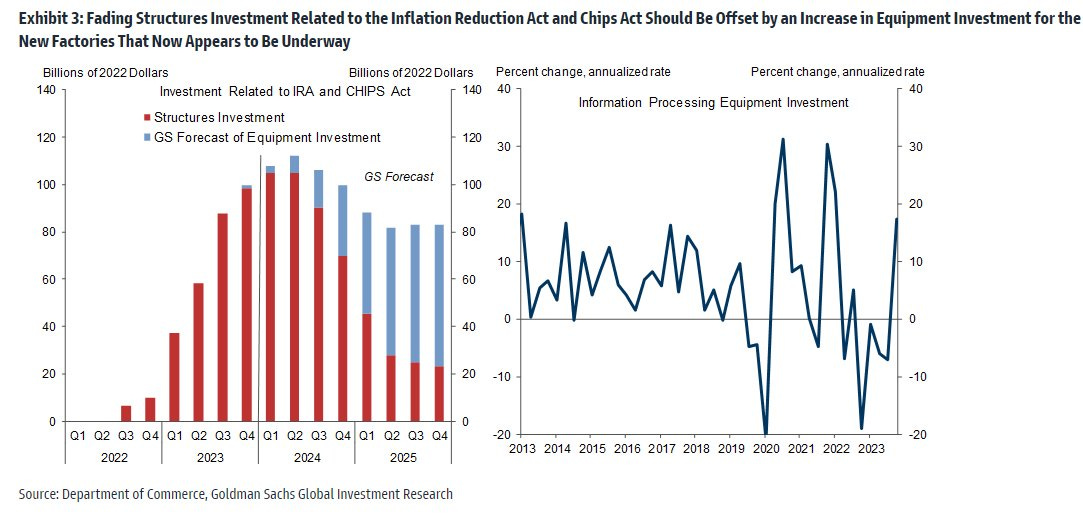
And on the IRA, I’ve taken out the background information (look back to the November 24 report for that) but suffice to say it will be an ongoing economic support likely into 2024.
Meanwhile the Weekly Economic Index from the Dallas Fed (which is scaled as y/y rise for GDP vs year ago quarter (not Q/Q)) as of Jan 27 improved to 1.7% from the downwardly revised 1.36% the prior week (this data series has constantly been revised lower since I’ve been following it). This pulled the 13-wk avg down to 1.90% still around the highest since 2022 but well under actual GDP. This series is more useful in terms of direction vs level.
BTW here’s the components if you’re interested.
And after Atlanta Fed came in closer than consensus for another quarter in 4Q (2.4%) 1Q 24 jumps to 4.2% w/every component but exports upgraded. Consumption from and private investment to 4.9 & 1.7% from 3.6 & -0.3%. Net exports to 0.18% from 0.27%.
While NY Fed’s GDP nowcast which was in line with the Atlanta Fed for 4Q23 moved up to 3.31% from 2.80% still below Atlanta Fed’s 4.2% (which will likely be higher next week after today’s NFP report (that added +0.32% to NY’s estimate)).
And the St. Louis Fed GDP tracker still wasn’t updated this week but was again the lowest of the three at 2.0% for 4Q compared with 2.4% for the NY and Atlanta Fed versions compared with the 3.3% first estimate.
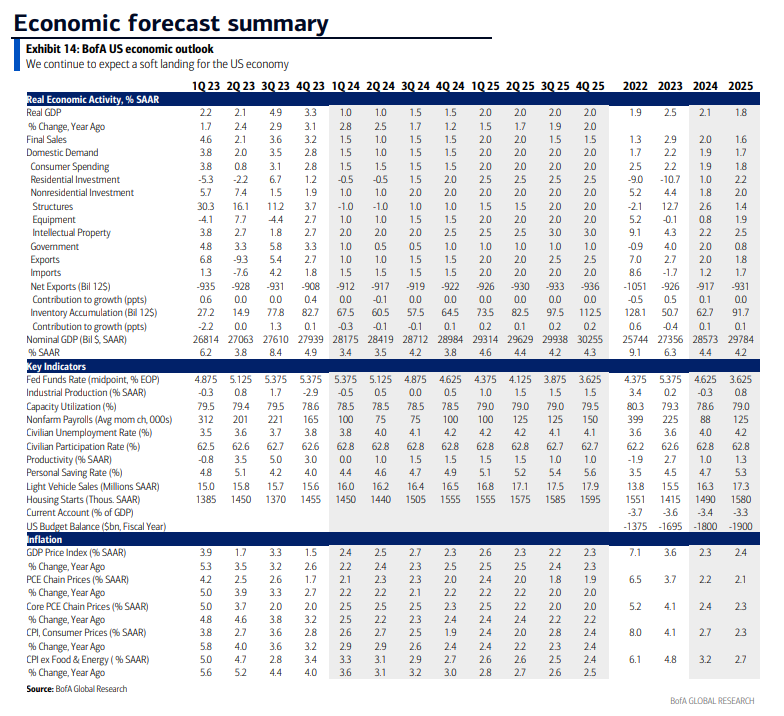
And BoA who was well below the 4Q first estimate of 3.3% at 1.9% also hasn’t technically released their 1Q estimate but they have a summary of economic projections that shows it at 1.0%, which is far too low. They expect 1.2% y/y in 4Q24.
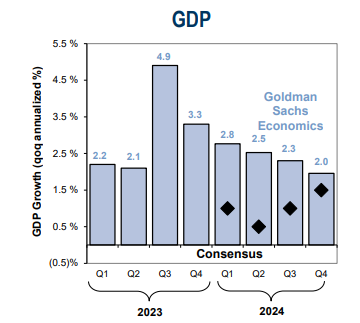
While Goldman who last second raised 4Q to 2% leaves 1Q at 2.8% .
And Morningstar had seen 1.7% GDP for Q4 (so nearly 50% off) but falling from there to sub 1% for most of 2024, so take that with a grain of salt.
While as a reminder Morgan Stanley was looking for 1.9% GDP in 2024 to start the year.
And JPM saw +2.0% in Q4 and +0.7% in 2024. They saw core PCE ending next year at 2.3% with four rate cuts all in the 2nd half. Again that was all back at the start of the year
And Deutsche Bank also on the weaker side at just +0.6% for 2024 at the start of the year.
And some other economy stuff (newest towards the top).
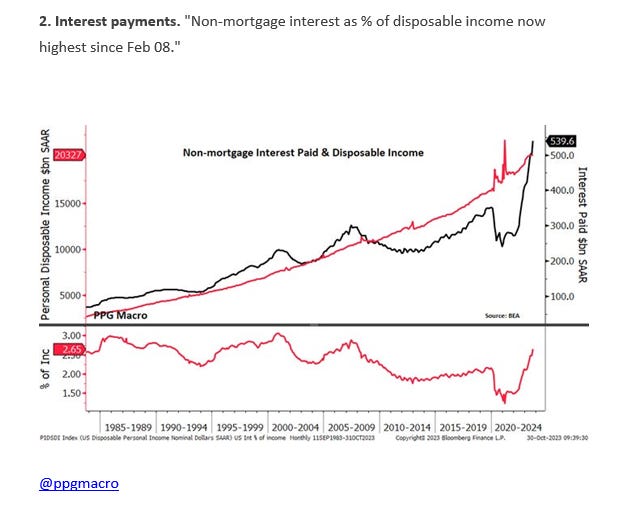
BI - money market funds are now generating more than $22B a month in interest income. If all spent, that would add "more than 1% to GDP.”
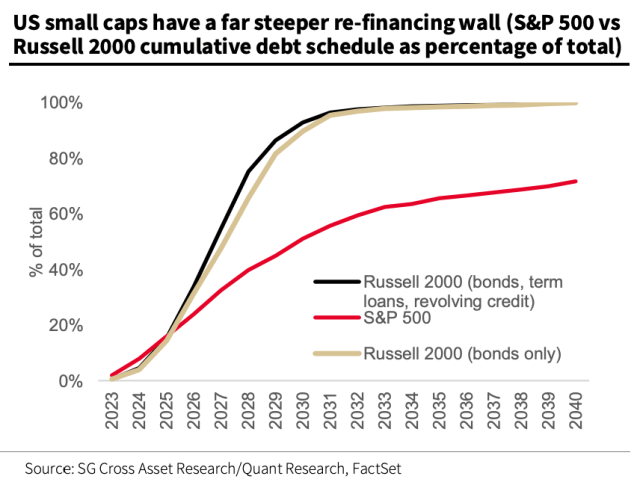
But importantly, it’s critical to note the disparity between large cap corporates and “everybody else”. As you move down the cap spectrum things become more dicey. That said, as rates move down it becomes a tailwind for these borrowers
Around a third of debt on Russell 2000 firms’ balance sheets is floating rate. That figure for S&P 500 companies is just 6%. Net debt to EBITDA for small-caps is 2.9x. It’s 1.7x for the S&P.
“The strain of higher rates is even more acute for small, private businesses,” Kostin remarked, noting that according to Goldman’s estimates, around 50% of small business debt is either credit lines, short-term loans or other floating-rate debt.
And while I still lean to the “no recession” camp, I also continue to respect the historical track record of things like a 2/10 curve inversion, LEI’s, etc., which have been screaming recession:
it’s very important to keep in mind that with things like recessions and bear markets, they generally are not expected (which is why I was dubious when the consensus was one was coming). I was actually less concerned about a recession (very mild one) than I have been since the end of June (2022).
To that point, Anna Wong, BBG’s excellent chief economist, looked back to 2007, two months before the recession started, and found job gains in that month were 166k and the Fed meeting noted a lot of comments about a potential “soft landing”.
So while I feel good about things today, I can’t say conclusively I’ll feel as good about them six months from now. That’s the unfortunate nature of a Fed tightening cycle.
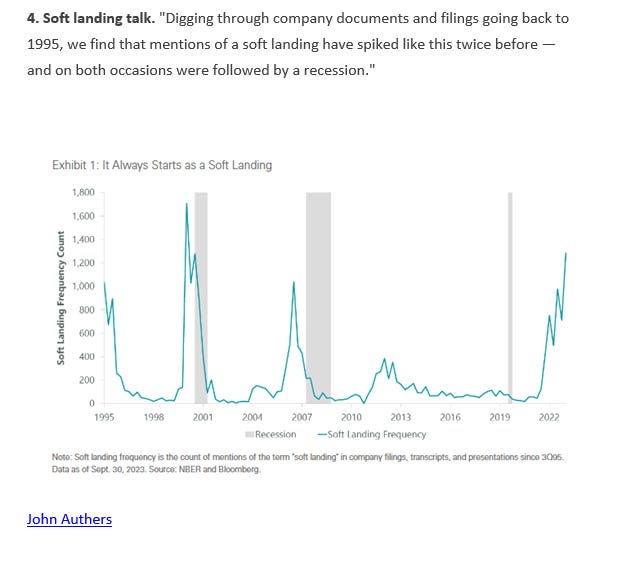
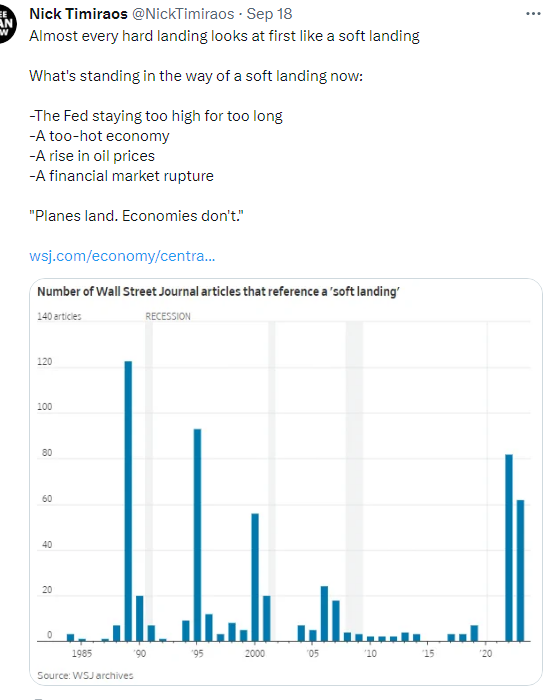
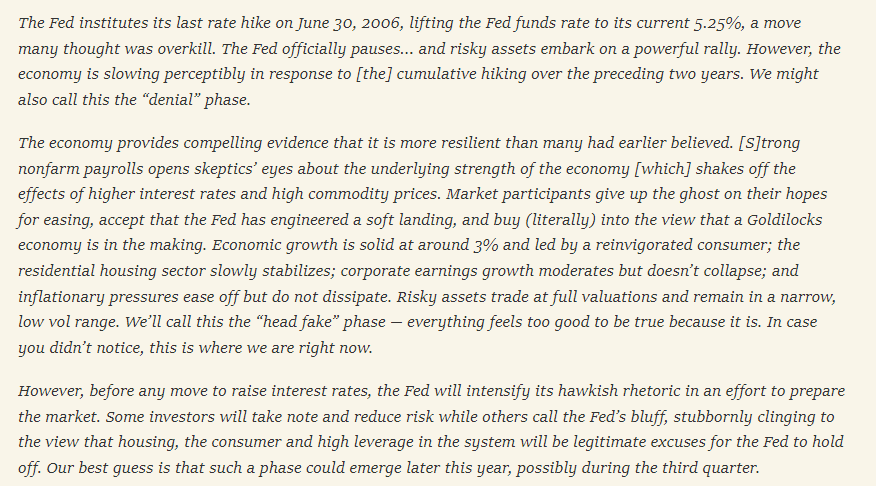
This concept (that a hard landing starts off looking like a soft landing) is something that is gaining more and more traction in the financial community. Soft landing talk preceded all of the last 4 recessions prior to Covid. The reason is that economic data deteriorates on a nonlinear basis which is not how humans think, so it's tough to see coming. Unfortunately there’s really no good way I know of to parse out in advance which way things will go, so the best we can do is just continue to watch the indicators.
And Marko Kolanovic touched on this as well quoting this note from Edward Marrinan in January 2007:
Multiple - This stays the same as it has for the last few months but with the earnings recession in the rearview window, as noted since late May, we didn’t get to the multiple levels we’ve seen in previous earnings recessions as earnings overall held up better than a “normal” earnings recession, and there are other factors (lower volatility, the trend higher in multiples overall the last two decades for a variety of reasons (more stable economy with smaller and shorter recessions, less risk of financial catastrophe, lighter asset models with more intangibles, etc.)) that make a higher P/E more appropriate today than historically. That said, things are getting to the point that at best we can say we’re around a “fair” multiple. Coming into November, we had taken taken the SPX forward P/E down to just 17.1, the least since March and below both the 5-yr average of 18.7 and 10-yr average of 17.5, but with the rally since then, the P/E is now at 20(Bloomberg Intelligence FWIW estimates “fair value” at around 19.5x), so certainly not a tailwind, although remember that the index level P/E is burdened by the top 10 stocks whose growth and extremely stable businesses perhaps justifies their P/E’s. Valuations for the equal-weighted SPX are more reasonable (and for small caps as discussed below arguably cheap) although both of those are also well off their lows in October as well. Regardless as I have repeatedly noted valuations are not a great tool for anticipating stock price moves except over long time frames (years).
But unfortunately, [valuations] are not that helpful in understanding what markets will do over shorter periods of time.
And some say they’re worthless.
"When we look at the relationship between the market's multiple and forward returns, it's nonexistent," Citi US equity strategy director Drew Pettit told Yahoo Finance. "The correlation between returns and PE is almost zero over the past 20 years."
To this end, Citi argues that even if lofty valuations were to be used as reason to not buy stocks, comparing the S&P 500's valuation now to earlier points in history is akin to comparing apples to oranges. Pettit points out the composition of the S&P 500 isn't the same as it was 10 or 20 years ago due to the quarterly rebalancing of the index that kicks out sputtering companies and adds up-and-comers.
While Goldman looks to real yields for their multiple. If they decline to 1.5% (we’re just a little above that) they believe that supports a 20x P/E.
And Jonathan Levin also argues considering the changing composition of the SPX, things aren’t really “stretched” at all.
Particularly if you think we’re going to see a “bubble like” move.
Technicals - I said two weeks ago,
while I continue to think a deeper consolidation than a week is coming at some point, I’ve given up for now trying to guess when it will come. We had about as good a setup as I could paint for a notable pullback, but all we got was a couple of percent of downside movement…with the SPX breaking to new highs, it would be a bit surprising if we didn’t see some extension absent a black swan type event.
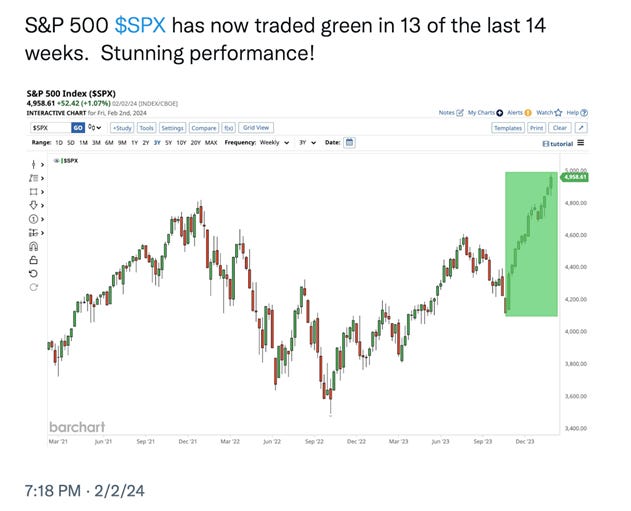
And since then we’ve seen continued “extension” fueled by big cap tech earnings with the SPX up for the 13th week in 14 as was the Nasdaq. As I said last week,
For now at least the technical condition while showing signs of divergence (MACD and RSI at lower highs) remains relatively positive, so while I continue to watch for a pullback, I’m not betting on one yet. The Nasdaq is similar, but the RUT remains challenged by resistance, failing at the 2000-2010 level multiple times [the past two weeks]. It’s technicals are also weaker.
From Friday’s note:
.The SPX (+1.1%) pushed back to new ATHs today consistent with yesterday’s note that “market continues to have a lot of momentum and support.” That caps the 13th up week in 14. Also, the gains the last two days have turned the daily technicals back to positive even if momentum is lower keeping that negative divergence in place.
On a weekly chart, the SPX is the most overbought since July 2021.
The Nasdaq Composite (+1.3%) also eked out a new 2yr high. It has a similar technical situation.
RUT (-0.6%) though not able to follow up with another green day, and its technical situation is much less constructive. Starting to get “fan lines” which are a technical pattern I’ll get into more if we get a third one.
Some other technical notes:
As noted last week, longer term there’s a lot to like about the market but shorter term things are less clear.
Breadth/Sectors - Last week I said,
I can finally say, after several weeks of poor breadth to start the year, that we got a week of overall pretty good breadth. This is another factor which makes think it could be longer before we see a notable consolidation.
And while breadth started the week strong on Monday, it deteriorated overall compared to a week ago with just Thursday seeing anything approaching good breadth. Friday was terrible.
From the Friday update:
SPX sector breadth decelerated to just 6 of 11 sectors up with no non-growth sector up over +0.65%. The growth sectors all up at least 1.3%. Defensives lagged.
Here’s the stock-by-stock SPX chart from Finviz.
Positive volume really disappointing. NYSE just 31% and Nasdaq 43%. Issues were just 31 and 37%. New highs-new lows remained better on the NYSE with 123, still though down from 151 Wednesday (when the SPX was down 80 points) while Nasdaq was just 11 (it was 153 on Monday).
With the mixed breadth this week, the McClellan Summation Indexes (what the avg stock is doing) were flat on the NYSE (due to the weakness in Russell 2000 stocks) but the Nasdaq continues to edge higher (although not at all like the steep line we saw 4Q23.
And the 10-DMA of the new high-new low indices (thin blue line) also made progress although continue to lag price (negative divergence).
While % of stocks above their 200-DMAs continue to hold near recent highs although also lag price somewhat.
But % of equities trading above 50-DMAs have seen more softening, so an even great negative divergence with price.
While the equal-weighted SPX vs cap-weighted ratio remains around the lowest since the pandemic.
While IWM:SPY (small caps to large caps) after bouncing around the end of January resumed its trip towards the all-time lows from November.
But SPX sector breadth remained good with nine green sectors of eleven (the most of any week this year). Eight sectors were up +0.8% or more (up from six the prior week), although none up over 4% (we had two the prior week (but discr was +3.8%)).
Consumer Staples +2.1%. Utilities +0.4%. Financials +0.8%. Communications +1.6%. Healthcare +2.%. Industrials +1.9%. Information Technology +0.8%. Materials +0.8%. Energy -1.6%. Consumer Discretionary +3.8%. Real Estate -0.4%.
Taking this out to all stocks the gains a little less robust with communications in particular flipping from a strong up week to a down week.
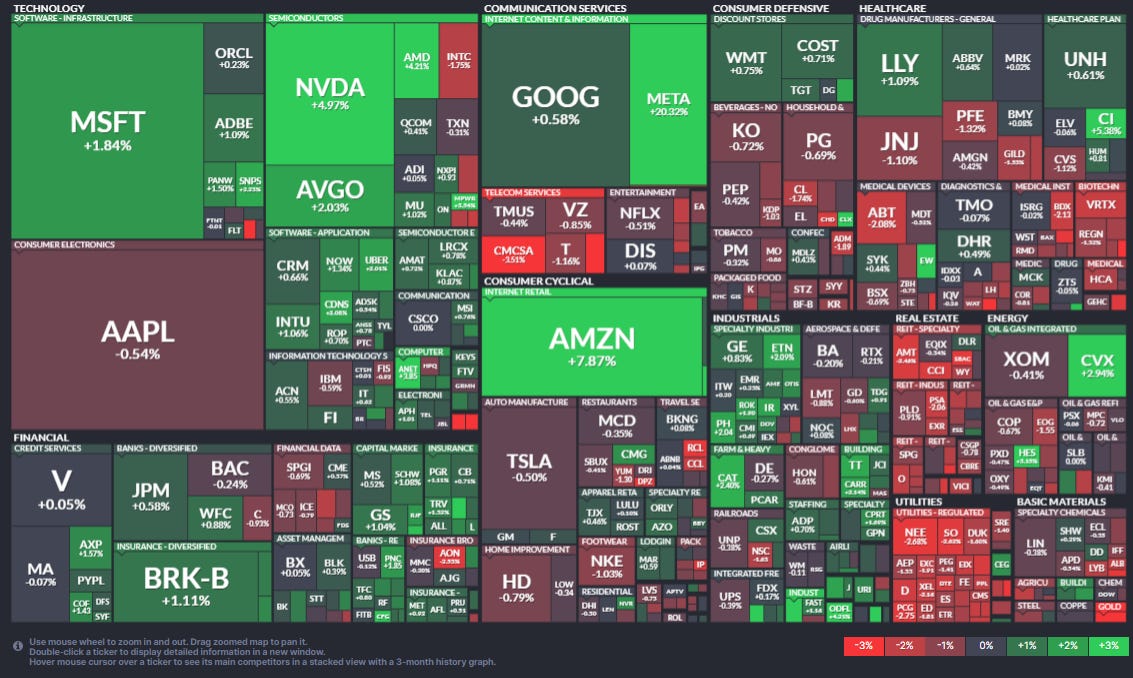
Here's the SPX heat map from last week. Mag 7 performance was all over the place.
So overall after a few weeks of breadth deteriorating coming into two weeks ago, we have seen improvement although it seems now to be reserved more for larger stocks.
But also some issues.
And as noted Friday was awful.
Flows/Positioning -
In terms of equity flows, BofA using EPFR Global data saw another week of inflows, the 10th in 14 weeks +$20.1B, now +$223.7B last 32 weeks. Tech led inflows for 4th week +$2.1B, +$8.9B last three weeks, and has taken in +$36.7B over the last 28 weeks. Materials saw a rare inflow, only the 2nd in 11 weeks +$0.3B, while financials returned to outflows, the 20th in 24 weeks, -$0.4B, energy an 11th week -$0.4B, utilities led outflows 12th in 16 weeks -$1.1B, the 4th largest outflow on record, healthcare 17th in 22 weeks -$0.4B (-$9.8B last 18 weeks), and consumer the 16th in 17 weeks, -$10.2B the last 17 weeks.
US saw 11th inflow in 16 weeks, +$9.2B, +$106.2B last 20 weeks, with ~+$86B the last 12 weeks. Europe saw a 46th week of outflows in 47 weeks -$0.7B (now -$5.3B after -$66.9B in 2023), and Japan the 5th inflow in 6 weeks +$1.2B, $3.2B YTD after +$7.3B in 2023. EM equities saw an 9th week of inflows +$6.8B, after the largest inflow on record last week with $0.7B to China, after the largest since July 2015 (and second most on record) last week (4 week inflow +$21.1B largest on record), and +$0.1B to India). So far in 2024 China and India are +$1.0B and +$1.8B respectively. EM took in +$91B in 2023. US large caps saw 19th inflow in 23 weeks, +$11.5B, +$75.0B last 12 weeks after $125B in 2023, while small caps saw a 4th week of outflows to start the year, -$0.8B, -$4.3B last 4 weeks. US value saw first inflow in 5 weeks +$0.7B (but -$10.0B so far in 2024 after a record -$73B in 2023).
Bonds saw their 43rd inflow in 45 weeks at +$5.9B, after the largest since Jan 2023 last week, with IG/HG seeing a 14th week of inflows +$5.9B and $45.2B the last 5 weeks and the 40th inflow in 44 weeks, after +$162B in 2023. Treasuries saw the largest outflow in 7 weeks -$3.6B. Treasuries took in $177B in 2023, a record (and along with 2022 in a completely different universe in terms of flows than any year previously). Bank loans saw only their 4th outflow in 17 weeks (-$0.1B), while HY saw the 13th inflow in 14 weeks +$2.8B (+$20.0B last 12 weeks (combined with IG it was the largest 4-week inflow since Sep 2020)). EM debt saw the 23rd outflow in 25 weeks, (-$0.2B) after -$37.0B in 2023, while TIPS saw a rare inflow (only the 3rd in 21 weeks) +0.3B, largest since July. TIPS bled a record -$33B in 2023. Munis saw a 4th week of inlows +$0.4B.
Gold returned to outflows (6th week in 7 and 30th in 34 weeks -$0.5B, while cash continued to see inflows +$15.2B now +$171B YTD. The total over the last 11 weeks is +$604B. Cash in 2023 took in a record +$1.3T and +$3.1T since 2019.
ICI data on money market flows showed an even larger cash inflow than EPFR data with +$41.7B in the week to Jan 31st, leaving the total sitting in MMF’s as of Wednesday at a cool $6T, a new record after 2023’s $1.77T of inflows.
And Goldman’s Scott Rubner continues to caution against downside as he has thrice before over the past two months due to elevated positioning.
While BofA says their work indicates that “CTAs are likely benefiting from their long equity positions in the S&P 500 and NASDAQ-100 which according to our model were put on in size in early December. Both indices closed the week at new all-time highs implying that CTA positions are at or near high-water marks leaving the move required for a stop-loss unwind relatively farther.” On the RUT though they see selling it appears. 4767 is their sell trigger for the SPX (which just keeps drifting up with price now at -3.9%). They’re currently 76% max length SPX, 74% NDX, but just 42% RUT (down from 67% last week), so as noted previously, there’s a good amount to sell on the large cap indices if/when that sell trigger gets hit.
But volatility targeters (risk parity) who had continued to see positioning grind higher as realized volatility has declined seven straight weeks (at one point this week it was the lowest since Nov 2021) saw three straight days of 1% moves. “Realized vol correspondingly moved higher and leverage in S&P 500 vol control strategies could be forced to unwind. Strategies could have been selling into this past Friday’s close and as well may need to unwind more on Monday next week.” Given their full positioning this could be a headwind this week.
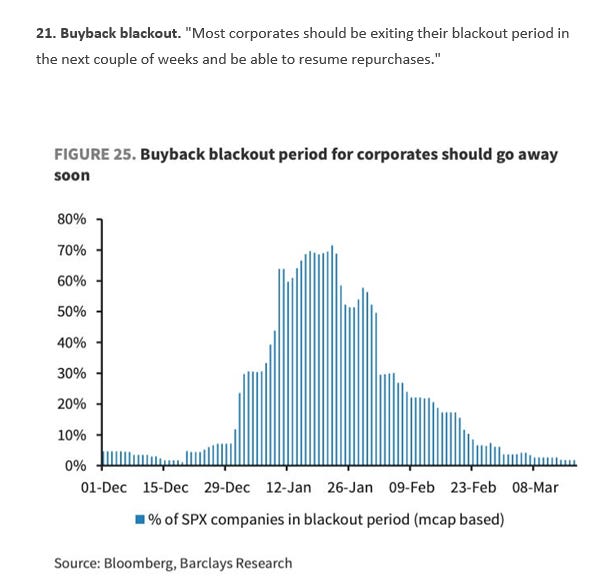
And we should be out of the buyback blackout window now (not that it mattered much when we were in it).
Goldman sees SPX companies pulling back on R&D, cap ex, and dividend to fund more M&A and buybacks in 2024. Still all remain at relatively healthy levels.
Sentiment - Sentiment (which I treat separately from positioning) is one of those things that really only matters at the extremes. After peaking at what I considered an extreme 6 weeks ago, things softened considerably for a few weeks but turned higher last week, and we’re now almost back to where we were (and are past that in some metrics like Investor’s Intelligence and BoA’s Bull & Bear Indicator so if we’re not extreme, we’re awful close.
The 10-DMA of the equity put/call ratio (black/red line) continued to fall sharply last week which is generally supportive to equities (although as the x’d out arrow shows they completely ignored its rise when they generally fall).
While the CNN Fear & Greed Index fell back to 67 from 77, down also from its recent high of 80 (Dec 26th), back into Greed territory.
And Goldman’s sentiment indicator highest of the year at 0.8, but still not “stretched”.
While the BofA Bull & Bear Indicator cont’s its run now at 6.1, a 2.5yr high “on very strong inflows to EM stocks, equity market breadth (51% global stock markets trading > 50dma & 200dma), and robust credit technicals; note hedge funds still short S&P500 and trimming T-bill longs; sentiment unambiguously bullish but not yet extreme bullish…contrarian sell signal of BofA Bull & Bear Indicator >8.0 awaits combo of a. drop in BofA FMS cash levels to 4¼% from 4¾%, b. inflows to EM debt, c. hedge funds long S&P500 futures, d. China/HK stocks rally >10%”
And the BoA Sell Side Indicator “indicates an expected price return of +14% over the next 12 months or 5450 for the S&P 500 by year-end 2024."
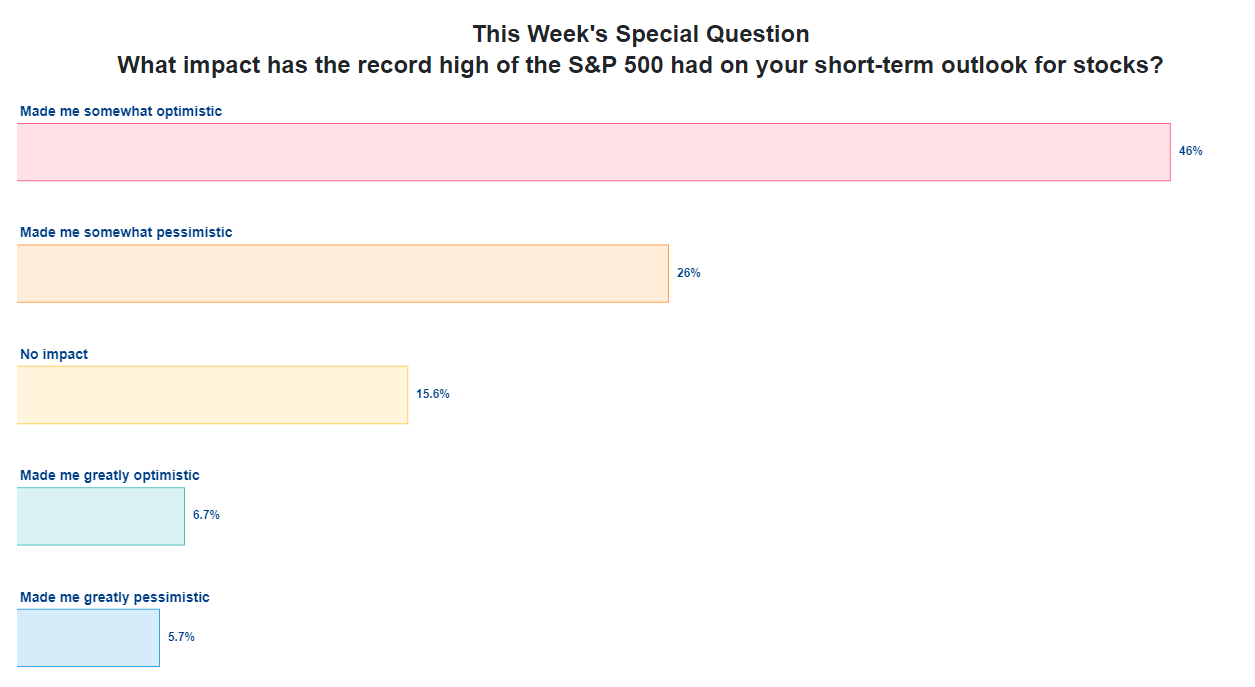
The back and forth in Helene's well populated X poll cont's w/her followers looking for an up week, the sixth change of direction in as many weeks.
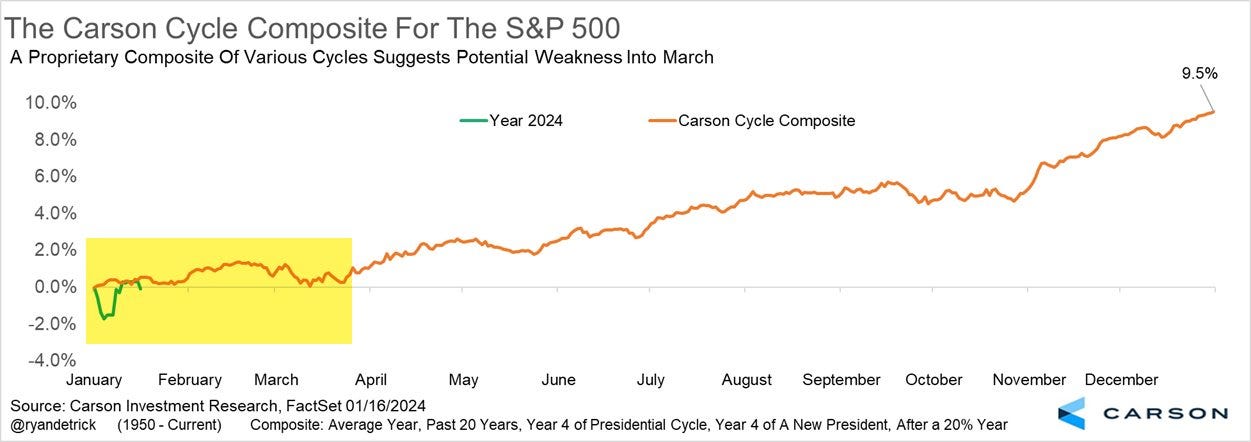
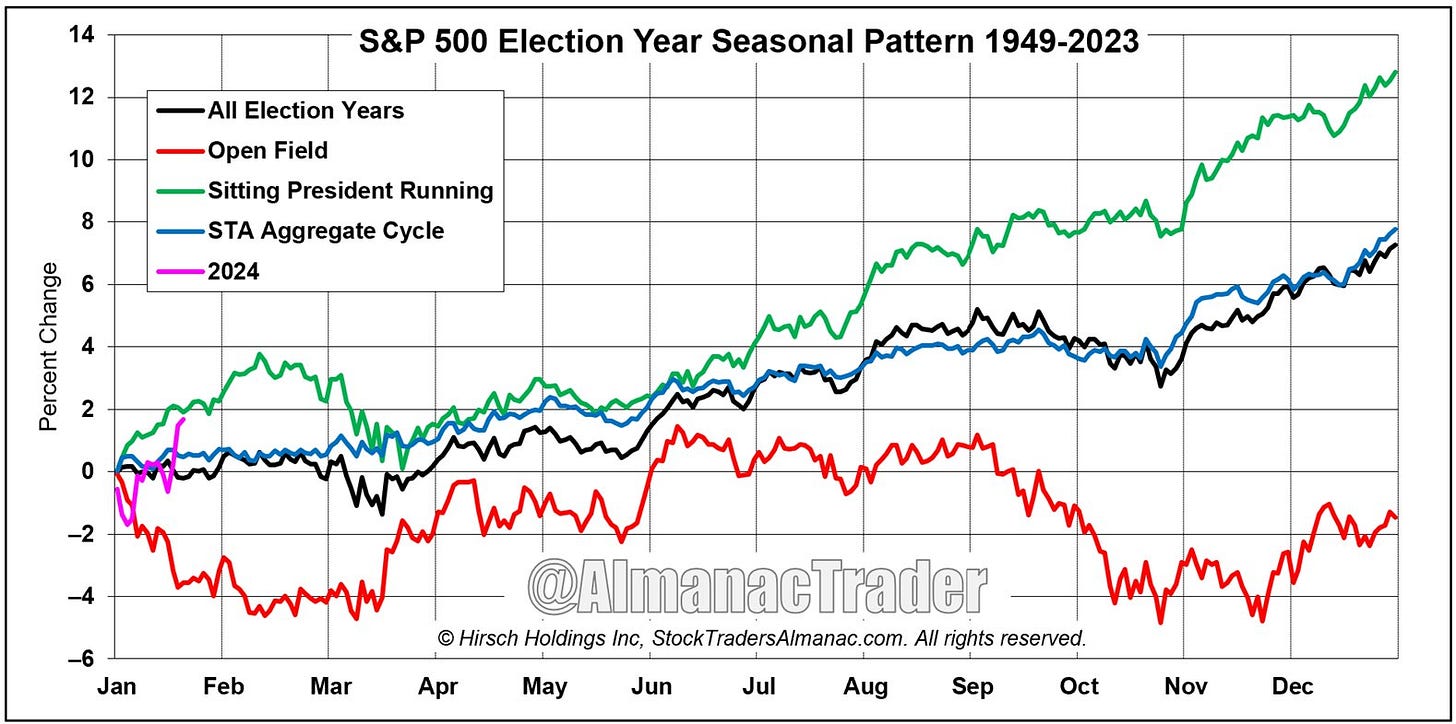
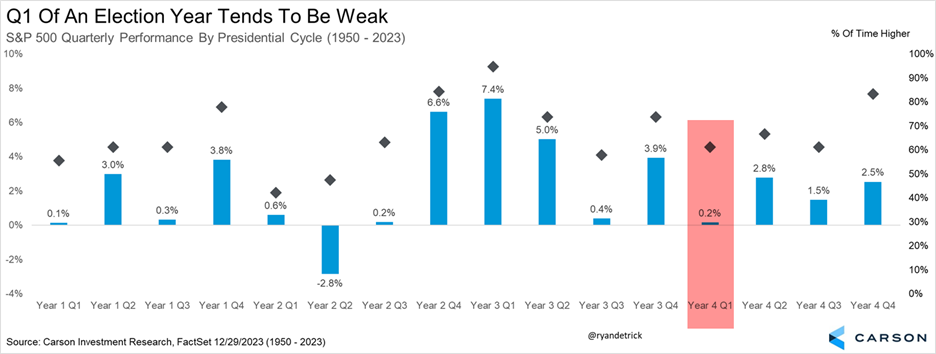
Seasonality - As noted mid-January we’re now firmly into a mostly softer stretch that really extends through the entire first half of the year, but at least we got our positive January (which basically overrides the down Santa period and First Five Days). Still history would say January, 1Q, and potentially the entire 1H will have muted gains. Of course I say that with the SPX up 4% in January alone (probably another reason for a breather).
Since 1938, when the S&P 500 was up in January the next 11-months average a gain of 11.6%. When January is down, the next 11-months average plummets to just 1.2%. No other month comes close to these levels.
the January Barometer has registered 12 major errors since 1950 for an 83.8% accuracy ratio. This indicator adheres to propensity that as the S&P 500 goes in January, so goes the year. Of the 12 major errors, nine have occurred since 2001. Including the eight flat years yields a .730 batting average.
As you can see from the table above, a positive JB has significantly improved the performance over the next 11 months and for the full year compared to when all three January indicators were down. In the prior three years when the SCR and FFD were down, but the JB was positive, next 11-month and full year gains averaged 15.1% and 19.9% respectively. This compares quite favorably to when all three January indicators were down as the next 11-months averaged just 0.2% and full year averaged a loss of 3.6%.
Full years followed January’s direction in 12 of the last 18 presidential election years. But 9 Election Years since 1950 with an up January Barometer are up 100% of the time with an average 15.6% S&P 500 gain.
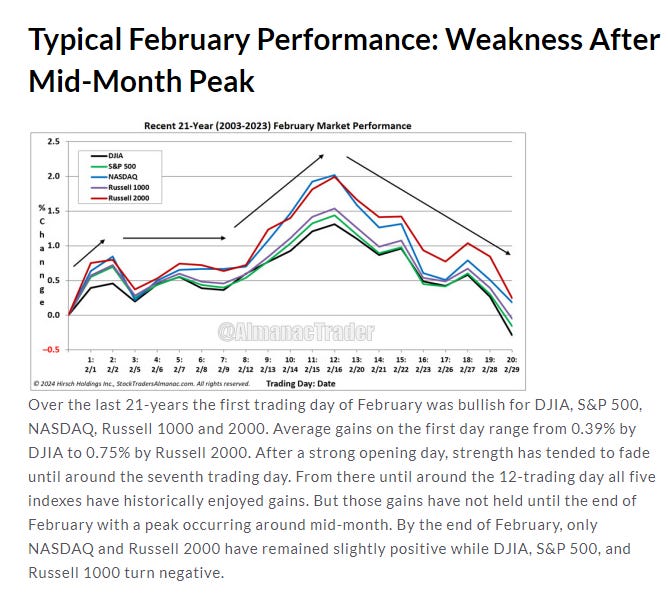
As noted last week February is normally in like a lamb out like a lion. It’s generally up from here through the mid-way point of the month.
In fact those last two weeks of February are historically the worst of the year.
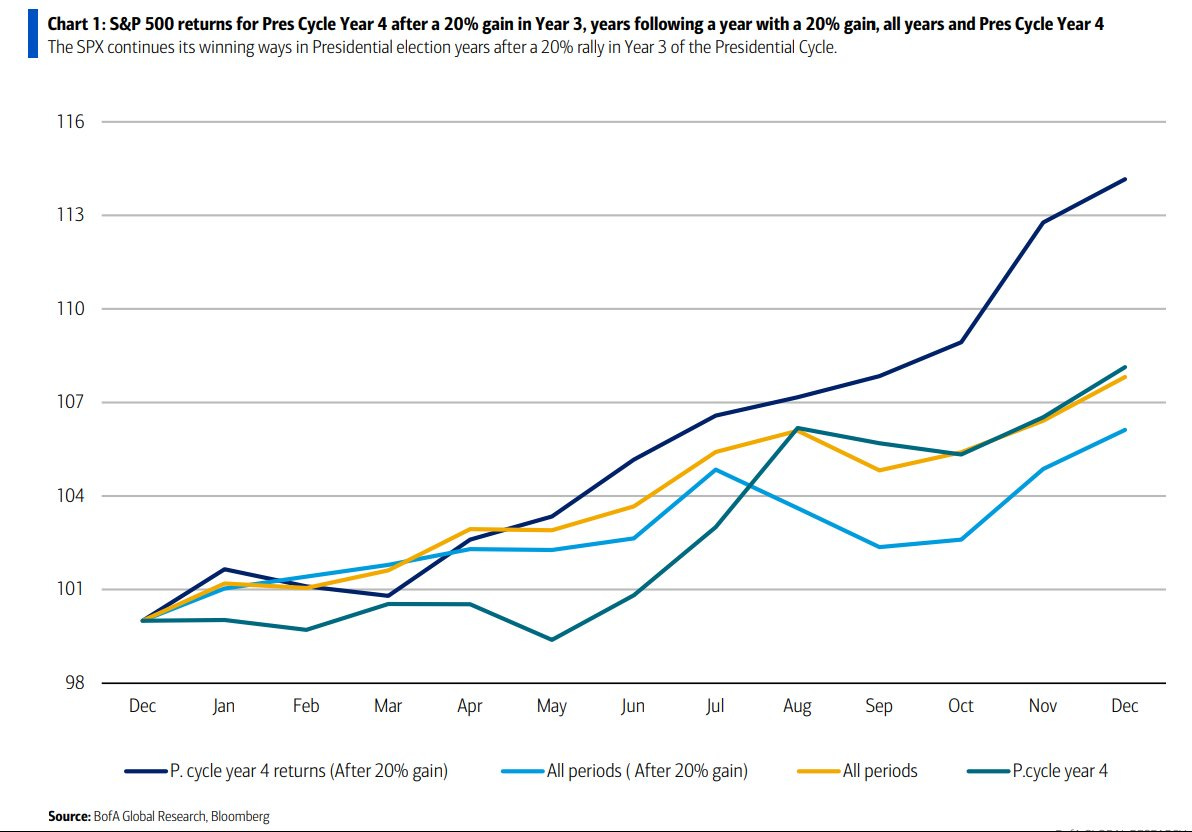
But maybe not after a 20% Year 3.
But we did get our up January.
Only 4 instances of down Santa period and First Five Days, but each time the SPX was up by a median 12%.
But wait, you say, what about years in which the S&P 500 was positive in January and finished the month within 2% of its all-time high after a year in which it gained at least 20%? Sounds ridiculous right? Well Rocky White did the work. 7/7 with 6/7 double digit gains.
And things look even worse when you add in the fact it's a Presidential election year which itself is generally weak historically in Jan (and 1Q & 1H) with an avg return of +0.09%. But w/a negative Santa it's -2.92%. All of 1Q is -2.49% vs +0.14% & 1H -5.4% vs +0.59%.
Analyst Commentary
And the bears who were out in full force when we turned the calendar into 2024 (especially after that down first week) have dialed back considerably as noted last week:
UBS now expects earnings to disappoint, because profit margins are under threat from rising wages and the delayed impact of higher interest rates. “The market is behaving as though weak economic data is good (more rate cuts, lower bond yields),” a team led by Garthwaite wrote. “At some point this relationship reverses.”
Morgan Stanley’s Mike Wilson, who stuck with his prediction of a stock market decline last year while the S&P 500 Index surged 24%, sees opportunities in names outside the so-called Magnificent 7 companies that have powered equity gains through much of 2023. He’s urging investors to buy high-quality, growth names that can generate pricing power.
“In the stock world, I think once again, it’s going to be idiosyncratic — I don’t think it’s going to be as narrow as last year,” Wilson said Tuesday afternoon at the iConnections Global Alts conference in Miami Beach. “The big index is full, it’s priced. For all intents and purposes, the value is not there. The value is underneath the market.”The top-rated portfolio strategist added that the rally is going to see breadth improve, though specifying that “junky small caps” and businesses with weak balance sheets that need to refinance debt at higher normalized rates with the Federal Reserve still keeping monetary policy tight, will continue to falter. He emphasized that smaller, cyclical businesses with leverage remain down substantially over the past two years, even as the broader market has soared back to record highs, and he predicted that many venture capital investments are not being funded and will go to zero.
“That’s the tough love that Jerome Powell delivered,” Wilson said. “And that was necessary because we just had too much excess coming off the Covid boost.”
And the optimists continue to be a little more bold especially now that we got our up January:
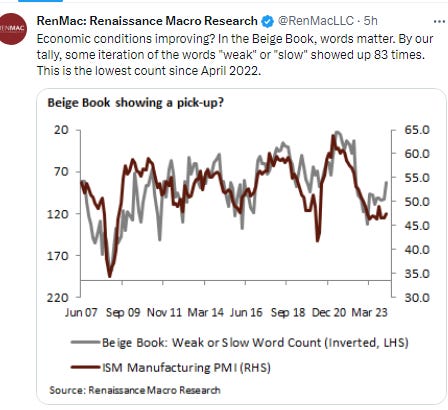
To Neil Dutta at Renaissance Macro Research, strong growth in labor productivity means unit labor costs are under control — which is a good backdrop for company earnings. “It’s hard to get too bearish” with such economic resilience, said Bret Kenwell at eToro. Larry Tentarelli at Blue Chip Daily Trend Report sees the data as “a very bullish sign for the economy” — adding that “we are buyers on any short-term weakness in stocks.”
Final Thoughts
So as you know if you’re a regular reader, I was cautious in early January, become more bullish short term a couple of weeks ago but have remained on the lookout for something to “tip things over”. That’s basically where I remain, but last week was full of potential minefields and the market made it through just fine (at least at the large cap level) helped by some great earnings from large cap tech. This week is very light on potential catalysts (at least on the calendar), so I don’t particularly see anything that will unduly rock the boat. Breadth has been on the weak side but outside of Friday not particularly noteworthy, and as I noted this week the market has a great deal of momentum behind it. Earnings are holding up ok, the Fed is inching towards rate cuts, multiples are stretched but not screaming imminent correction, technicals are also ok (but with negative divergences), and flows remain positive.
That said, the set up is there for some weakness. Seasonality isn’t bad this week but the last half of February is very weak, there are those technical divergences, positioning remains extended, and sentiment is back to relatively frothy. But that said, stocks had every reason to pull back aggressively in early January and didn’t. That counts for something. We’ll eventually see stocks go down or at least sideways for more than a week or two, but right now I have some trouble seeing why they’ll stay down if earnings keep moving higher and inflation doesn’t pick back up. Maybe CPI the week after next will have something to say about that last one.
But just remember when a 10%+ correction inevitably happens, it’s supposed to. That’s most likely not the time to be selling.
Portfolio Notes
I’ve decided I’m spending too much time playing around with small trades (which are costly from a tax perspective) so I’m in the process of consolidating things into fewer stocks with larger positions that I can just sell puts and calls on (which is taxed at ordinary income rates but provides extra “juice” on top of dividends and allows me to hold for 12-months to get the capital gains rates on sales). This has the added advantage of being less time intensive.
Didn’t do much this week other than continuing to recycle puts and calls. Added back the position in GILD which I sold a couple of weeks ago. Also started a position in KVUE.
Cash = 25% (this is more than I want to hold, but I’m looking for a pullback in 1Q to add at this point, held mostly in SGOV and MINT but also TLH (if you exclude the longer duration bonds, cash is around 20%)).
Did put on some SPX and QQQ shorts end last day of December, but haven’t added. Around 1% total.
Positions (after around the top 20 I don’t keep track of their order on a frequent basis as they’re all less than 0.5% of my portfolio).
Core positions (each 5% or more of portfolio total around 20%) Note the core of my portfolio is energy infrastructure, specifically petroleum focused pipelines (MLP’s due to the tax advantages). If you want to know more about reasons to own pipeline companies this is a decent primer, but I’m happy to answer questions or steer you in the right direction. https://spac.tortoiseadvisors.com/resources/insights/commentary/the-case-for-energy-infrastructure-as-a-real-asset/
EPD, ET, PAA
Secondary core positions (each at least 0.5% of portfolio, total around 10%)
ENB, GOOGL,
For the rest I’ll split based on how I think about them (these are all less than 0.5% of the portfolio each)
High quality, high conviction (long term), roughly in order of sizing
BAC, WFC, CTRA, DIS, XOM, USB, DVN, KMI, MAC, LAZ, SHEL, MPLX, CVS, KHC, ANAC, K, T, BWA, TRP, SCHW, TLH, VNOM, APA, ADNT, PFE, O, GSK, HBAN, SWKWS, C, CQP, MTB, EQNR, OXY, RHHBY, STLA, NTR, E, CMSCA, ING, WES, VZ, SQM, PFF, VSS, BMY, TFC, DAL BTI, AM, GILD, JWN, ARCC, GM, NEM, AES, VOD, AM, BWA, DAL, VSS, BAYRY, ING, TLH, ETRN, VZ, NTR, CRM, SWKS, RRC, FRT, BMY, FANG, CI, DGS, SNOW, PXD, E, INDA, FIS, JWN, VWAPY, CMCSA, GM, BMWYY, EOG, NXPI, DDAIF, BUD, CVE, SOFI, BEP, SAN, TEF, SPG, KVUE, KT, PLTR, F, TSM, KLG, VNM, MFC, TD, LYG, BMO, FSK, ORCC, EMN, MDT.
High quality, less conviction due to valuation
AAPL
Higher risk due to business or sector issues; own due to depressed valuation or long term growth potential (secular tailwinds), but at this point I am looking to scale out of these names on strength. These are generally much smaller positions outside of the top few.
ILMN, AGNC, PYPL, FXI, TPR, ORAN, CHWY, TIGO, SWN, URNM, ACCO, CLB, WBA, PARA, TEVA, LUMN, HBI, TCNNF, TCEHY, SBH, YUMC, EEMV, PK, VNM, CURLF, GTBIF, TPIC, NCLH, SABR, NSANY, BTI, VNQI, CCJ, ST, WBD, LADR, BNS, EWS, VTRS, IJS, NOK, SIL, WVFC, LBTYK, DOCU, CMP, TAP, BBWI, GPN, ZM, JTKWY, CAL, EWZ, CZR, LAC, MBUU, TLRY, HRTX
Note: CQP, EPD, ET, MMP, MPLX, PAA, WES all issue K-1s (PAGP is the same as PAA but with a 1099).
Reminder: I am generally a long term investor (12+ month horizon) but about 20% of my portfolio is more short term oriented (just looking for a retracement of a big move for example). This is probably a little more given the current environment. I do like to get paid while I wait though so I am a sucker for a good well supported dividend. I also supplement that with selling calls and puts. When I sell a stock, I almost always use a 1-2% trailstop. If you don’t know what that is, you can look it up on investopedia. But that allows me to continue to participate in a move if it just keeps going. Sometimes those don’t sell for days. When I sell calls or puts I go out 30-60 days and look to buy back at half price. Rather than monitor them I just put in a GTC order at the half price mark.
To subscribe to these summaries, click below (it’s free).
To invite others to check it out,


