The Week Ahead - 6/23/24
A comprehensive look at the upcoming week for US economics, equities and fixed income
If you're a new reader or maybe one who doesn’t make it to the end feel free to take a second to subscribe now. It’s free!
Or please take a moment to invite others who might be interested to check it out.
Also please note that I do often add to or tweak items after first publishing, so it’s always safest to read it from the website where it will have any updates.
I know not everyone can be on X several times a day like I can, so I really encourage you to click the link in each daily update to just scroll through that day’s posts, as I am moving away from the time consuming process of going through them to add to the weekly blog.
Also, as a reminder, some things I will still leave in from prior weeks (although much less than before). Anything not updated is in italics. As always apologize for typos, as there’s a lot here, and I don’t really have time to do a good double-check.
The Week Ahead
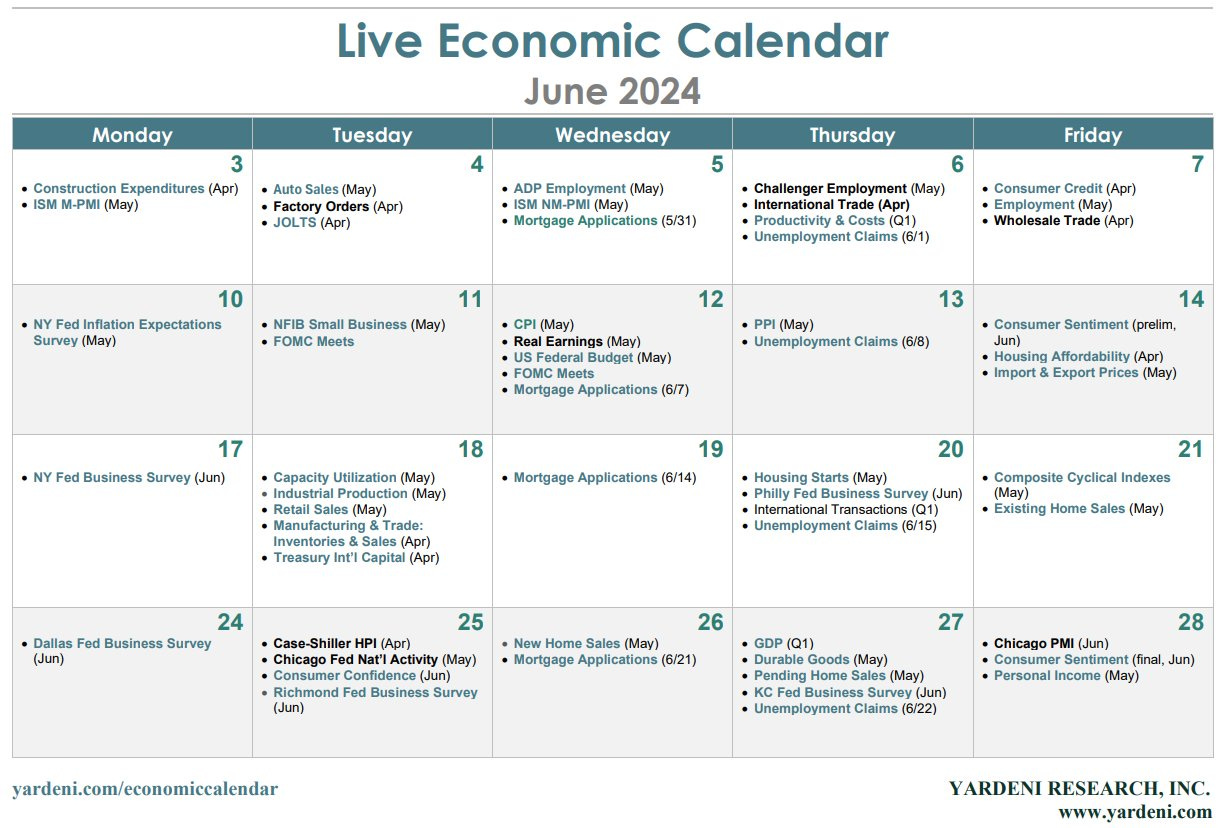
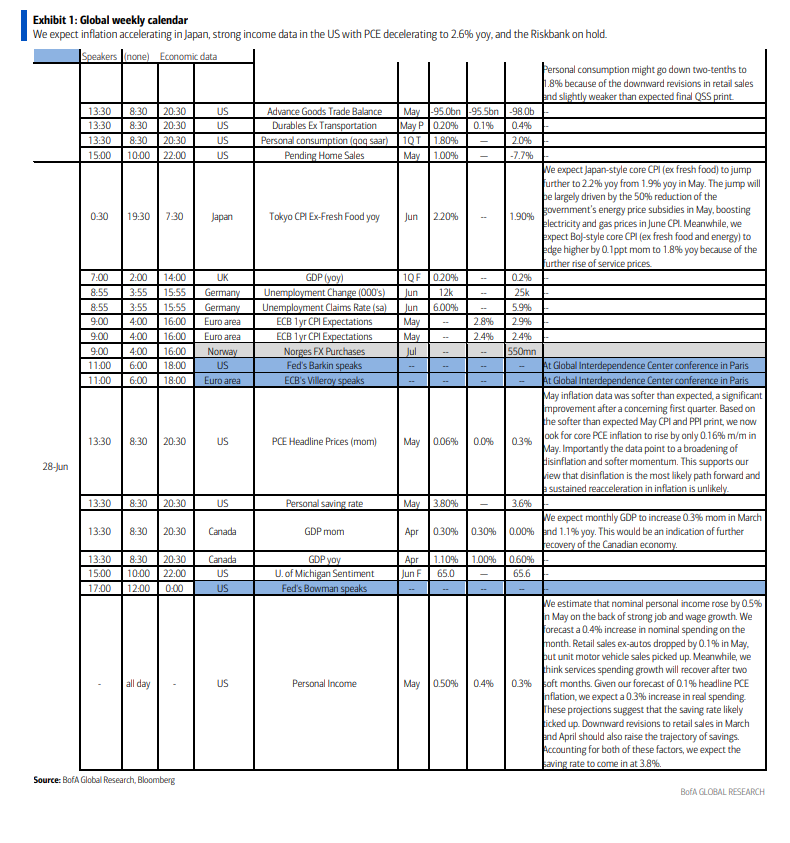
After a slow Monday, it’s a fairly heavy calendar for US economic data in the upcoming week with reads on house prices, consumer confidence, new home sales, jobless claims, the final read on 1Q GDP (which will also give us US corporate profits), goods trade balance, durable goods orders, final U of Michigan sentiment, and the highlight of the week, personal income and spending along with the PCE prices index (the Fed’s favorite prices gauge) on Friday.
We’ll also get our last 2Q Treasury auctions in the form of $69bn in 2yr’s, $70bn in 5yr’s & $44bn in 7yr’s Tues, Wed & Thurs. Hopefully we continue the solid results we got the last few auctions.
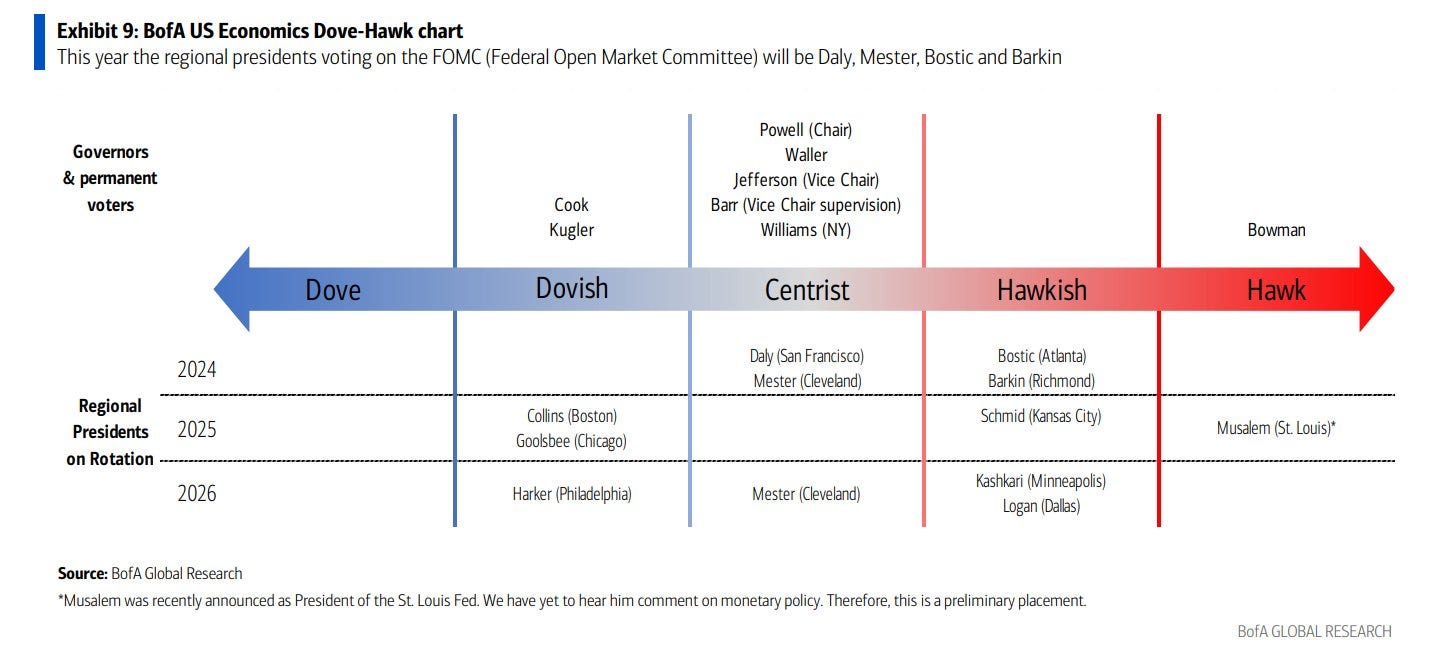
The Fed calendar looks a little lighter than last week. Amongst those on the docket are Waller, Daly, Bowman, Cook, and Barkin, but there will be others (there always are).
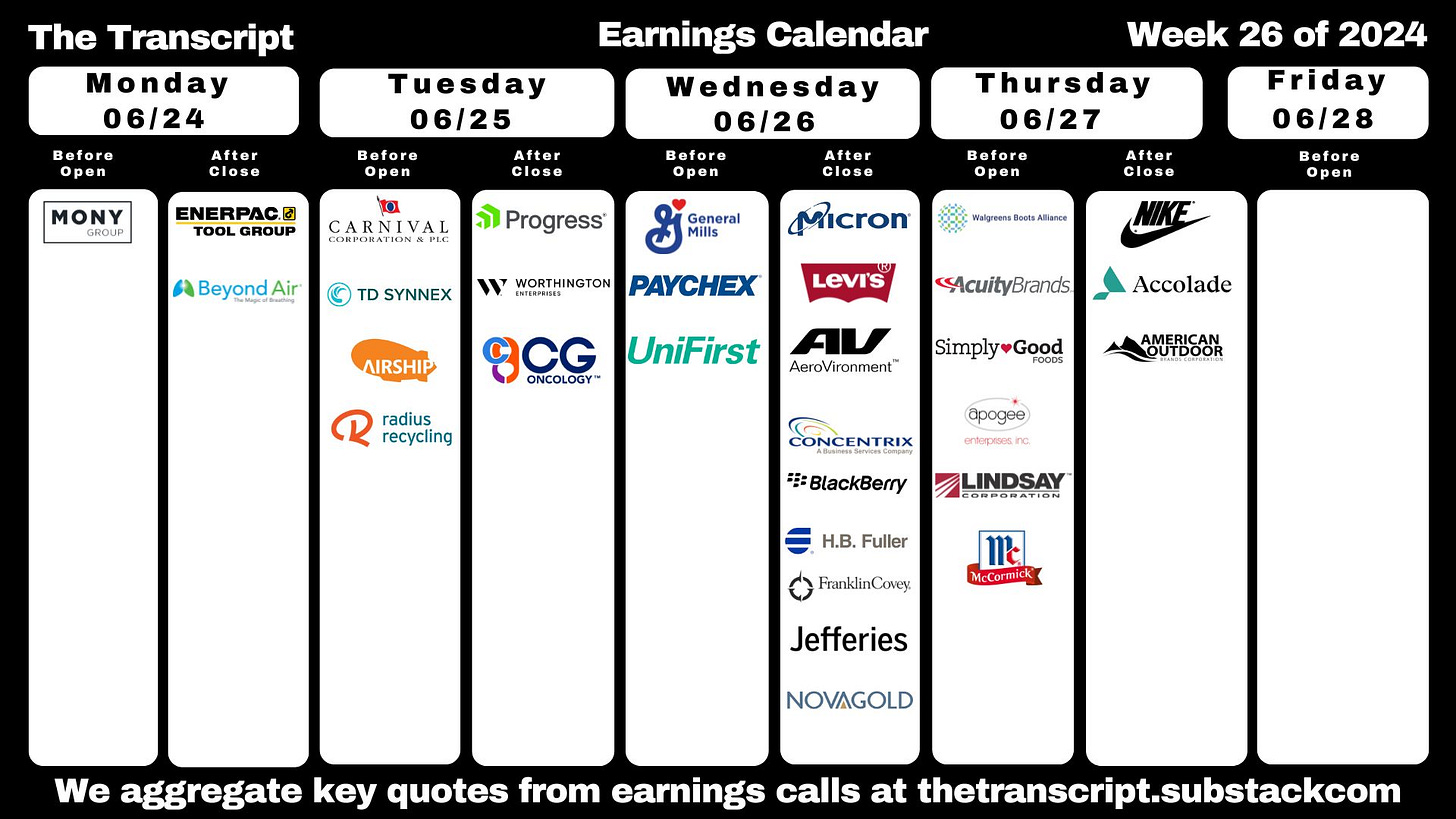
In terms of earnings, while Q2 earnings season don’t "officially" kick off until July 12th w/the big banks, we've gotten some reports already, and we'll get 8 more SPX reporters this week, the largest US domiciled being Micron ($159bn), Nike ($144bn), FedEx ($62bn), Paychex ($45bn), and General Mills ($38bn). Some others include Carnival, McCormick, and Walgreens.
Some other events this week include the results of the Fed’s bank stress tests Wednesday and the Russell’s rebalance Friday both of which could see some volatility in involved names.
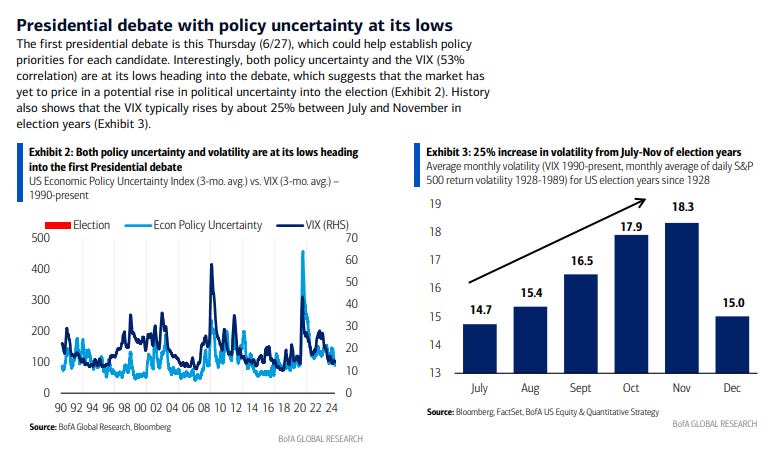
Finally, and definitely not least importantly, we’ll have the first Presidential debate between the (presumed) nominees of the Democratic and Republican parties (this is the first debate prior to conventions, by far the earliest we’ve ever had one) on Thursday night. I’m not sure anyone knows quite what to expect but as BoA notes it could serve as the start to the normal increase in volatility leading up to the election.
From Seeking Alpha (links are to their website):
Earnings spotlight: Monday, June 24 - Beyond Air (XAIR). See the full earnings calendar.
Earnings spotlight: Tuesday, June 25 - Baker Hughes (BKR), Carnival (CCL) and FedEx (FDX). See the full earnings calendar.
Earnings spotlight: Wednesday, June 26 - General Mills (GIS), Paychex (PAYX), Levi Strauss (LEVI), Micron (MU), and AeroVironment (AVAV). See the full earnings calendar.
Earnings spotlight: Thursday, June 27 - Nike (NKE), McCormick (MKC), Walgreens Boots Alliance (WBA), and Acuity Brands (AYI). See the full earnings calendar.
Ex-US we’ll continue to get plenty of headlines surrounding the upcoming French and UK elections. We’ll also get inflation figures in Canada, Japan, France, Spain, Italy, Mexico, Brazil, and we’ll get central bank decisions in Sweden, Mexico, Turkey, Columbia, and Czech Republic amongst others (just the last two are expected to cut rates). China industrial profits and Germany’s Ifo business sentiment index will be among the many other economic releases during the week.
In Canada, central bank Governor Tiff Macklem is set to speak in Winnipeg, consumer price data for May are expected to show core inflation easing for a fifth month, and a gross domestic product release for April along with a flash estimate for May will also provide crucial insight.
Asia gets under way with the release of minutes from this month’s Bank of Japan policy board meeting. The document takes on heightened interest after authorities pledged to cut bond buying, while also saying that investors will have to wait until late July before getting details about the scale of the reductions. Japan will also see a leading indicator for national inflation trends with the release of the Tokyo CPI gauge for June. Bloomberg Economics expects inflation in the capital to have picked up to 2.1%, lifted by an increase in utility prices after the government cut energy subsidies. In other data, China’s industrial profits on Thursday may reflect the benefits of an official push for equipment upgrades, and trade statistics are due during the week in New Zealand, Vietnam, Sri Lanka, Thailand and Hong Kong. South Korea gets two indicators pointing to domestic demand with retail sales and consumer confidence.
In the euro zone, inflation data in three of its four biggest economies will arrive toward the end of the week. The reports are expected to show slowing in France and Spain, with price growth staying weak in Italy. Those numbers may offer encouragement to officials after last month’s setback, when inflation accelerated more than anticipated across the region. The ECB’s survey of consumer price expectations will also be released on Friday. Other reports include Germany’s Ifo business confidence index on Monday, which is anticipated to show further gradual improvement in sentiment among companies in the region’s biggest economy. UK data includes the final GDP release for the first quarter on Friday, including current account numbers.
The Riksbank decision on Thursday will also be a highlight, with Swedish officials widely expected by economists to pause their easing cycle after an initial rate cut last month — presaging a similar move anticipated for the European Central Bank to stay on hold in July, but they may ratify a path of two more reductions this year to bolster an economy that’s forecast by European Union officials to post one of the weakest expansions in the whole bloc. Here’s a quick look at other central bank decisions around the wider region:
On Wednesday, Zimbabwe is expected to cut its key rate for the first time since it introduced a new currency, the ZiG, in April to combat deflation.
Czech policymakers may reduce borrowing costs by 25 or 50 basis points on Thursday, while stopping short of saying that inflation has been beaten.
The same day, Turkey’s central bank will likely hold its rate at 50% as it waits for consumer-price growth to slow from last month’s figure of 75%. Officials are confident borrowing costs will start to drop significantly in the second half.
In Latin America, Mexico’s central bank gets its last consumer price reading on Monday before Thursday’s monetary policy decision, and the data will likely leave Banco de Mexico thoroughly unimpressed. With inflation warming up again and drifting further above target, Banxico is all but certain to stay on hold at 11% for a second meeting. The central bank is the focus in Brazil as it releases minutes of its June 18-19 monetary policy meeting on Tuesday as well as its quarterly inflation report on Thursday. Sandwiched between the two is the mid-month reading of the benchmark consumer price index. Argentina’s economy likely fell into a technical recession at the start of 2024, with deep quarter-on-quarter and year-on-year declines. Analysts surveyed by Bloomberg see a 5.4% year-on-year plunge, the biggest decline since the pandemic. While many of the region’s other big inflation targeting central banks are either sidelined or increasingly hawkish, Colombia’s BanRep is expected to cut by a half point to 11.25% — 200 basis points down from last year’s 13.25% peak — and is on a path to end 2024 at 8.5%.
And here’s BoA’s cheat sheets for the upcoming week.
And here’s a calendar of 2024 major central bank meetings.
Market Drivers
So let’s go through the list of items that I think are most important to the direction of equity markets:
Fed/Bonds
As noted previously this was one of the sections that had grown unwieldy, so I’ve really pared it down. Given I provide daily updates on Fed expectations, Fedspeak, and analyst thoughts on the Fed, it’s duplicative (and time consuming) to gather it all again so, again, I encourage you to look at those (the daily posts) for updates. I will just give more of a quick summary.
I noted two weeks ago that “the dual CPI/Fed day Wednesday will set the tone for trading for at least the rest of the month and perhaps longer,” and as I said last week,
overall that tone is that we took a step closer to rate cuts (although the timing of which is now more uncertain), and bond markets are reacting accordingly. In addition to the CPI we had cooler than expected PPI and import price readings. That said, given the Fed’s now uber-data dependent stance as outlined in the Wednesday report a series of hot July inflation prints would put us back to where we were a week ago.
And in line with that we saw relatively modest moves in both Fed expectations and bond yields this week as detailed in the Friday update. We did get a number of Fed speakers who pretty clearly took July off the table, but otherwise left open the door to a September cut on balance, although there are several, not all of whom though are 2024 voters, who would likely need every inflation print to be constructive to get to a September cut. So as noted above we remain extremely data dependent with literally every CPI/PCE and employment report having a say on if and when a cut happens (the Fed has been clear that in addition to inflation moderating a material degradation in employment would also be a reason to cut).
What seems fairly clear, consistent with what I’ve been saying all year, is that this is a Fed that overall wants to cut, doesn’t want to hike, but also doesn’t want to make a mistake. In that scenario, the “right” course of action is to just do nothing until 1) the data gives the all clear to cut (which as Powell made clear can either be cooler inflation prints or a marked softening in the labor market) or 2) the data absolutely forces a hike. So things remain very much one-sided in terms of the hike/cut balance. A cut is far more likely, it’s just a question of when. As such, all that hot inflation prints do (as long as they’re not too hot) is push rate cuts further into the future.
For now I’m not changing my thoughts from early April, although as I mentioned 8 weeks ago, July is very (very) unlikely (I have noted it would take I think a downside surprise in both May and June inflation prints (we got one) along with significant softening in economic reports, particularly the labor market (which we haven’t gotten)), and now I think we can probably take July off the table:
I’m not jumping to December like many have, as this is a Fed chair (Powell) and top lieutenants (Vice Chair Jefferson and NY Fed President Williams) that really want to cut rates to preserve the soft landing, they just need the data to cooperate. That said, there is clearly a core contingent that believe any pivot to rate cuts will unleash a wave of spending and looser financial conditions (higher stock prices, lower bond yields, etc.), so until we see (a lot) more softening in the data (either inflation or employment), for now there’s no cuts on the table.
Turning back to where we are now, the 2/10 curve inversion remained little changed with both 2’s and 10’s up slightly on the week (in yields) at -0.45%. Since the start of February outside of one week it has remained between -0.3% and -0.47%, so this is towards to the low side of that range.
Also, as noted last week, we’re coming up on 2yrs now since the current inversion started (July ‘22) which will make it the longest on record before a recession started, again denting its usefulness as a recession indicator (at some point there will be a recession, you can pick anything and make that call).
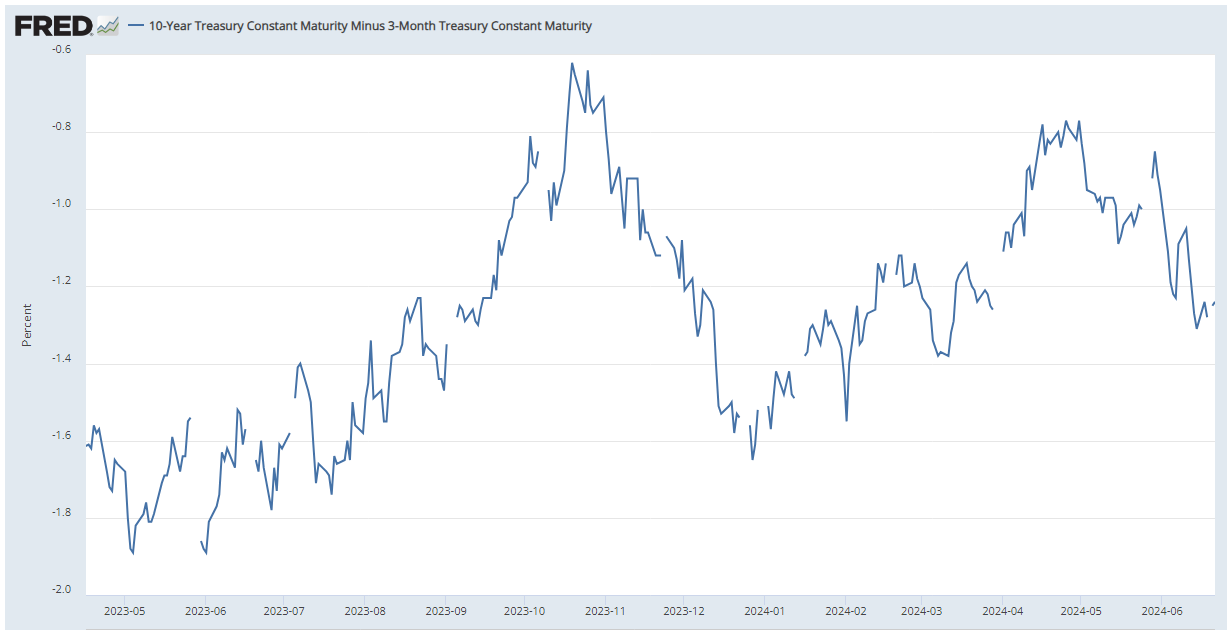
And the 3mos/10yr yield curve (considered a better recession signal than 2/10’s) up edged up to -1.26% from -1.31% the prior week which was the most inverted in 3mths. This inverted slightly later (October) but also is the longest on record now without a recession.
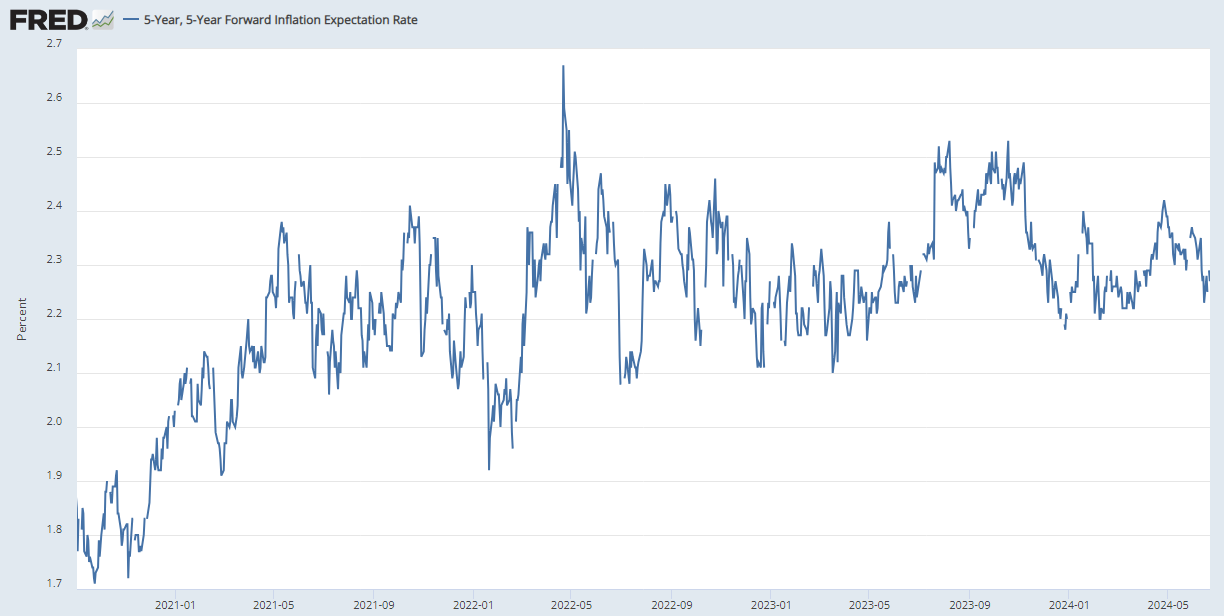
While long term inflation expectations, as judged by the 5-yr, 5-yr forward rate (exp'd inflation starting in 5 yrs over the following 5 yrs) edged higher by 4bps w/w to 2.27% from 3mth lows a week ago.
With the rise in inflation expectations offsetting the rise in yields, 10yr real rates edged towards 2 mth lows at 2.00%, down -3ps w/w.
Shorter-term real yields though (Fed Funds - core PCE from GDP (3mth annualized as of Q1)) edged up to 1.73% on the revision to 1Q PCE core prices, still down from 3.3% in Q4 which had been the highest since since 2007 in Q4 (this only updates quarterly, we’ll get 2Q PCE July 25th).
And the 10yr Treasury term premium edged to 3mth lows at -0.25% (the highs of the year were 3 weeks ago when it popped into positive territory at +0.05%). This is something markets were laser focused on when it hit +0.38% last October, but then lost interest in. I continue to think as you get into 2H of this yr with a lot of talk about deficits and interest costs (i.e., more supply needed), etc., this may resurface as an issue that will push yields higher.
The extended discussion on term premium (what it is, why it’s important, etc.), can be found in this section in the Feb 4th Week Ahead.
As the MOVE index of bond volatility continues to churn in the range it’s been in all month still consistent with the overall downward trajectory since peaking in early ‘23.
While bond volatility was little changed, mortgage spreads edged to a 3mth high on Thursday at 2.63% up 4 bps w/w.
And the Chicago Fed National Financial Conditions Index and its adjusted counterpart (which are very comprehensive each w/105 indicators) in week through June 14th moved to the lowest (least tight) since Nov ‘21 & Feb ‘22 respectively.
While BoA’s financial conditions index has a different take from many others at +0.85 standard deviations above normal in the wk ending June 12th (up +0.15pts w/w) although the language remains the same: “fears over rate hikes have been assuaged by a dovish Fed and favorable inflation data. Overall, we characterize financial conditions as moderately restrictive; above average, but well below prior cycle peaks.”
Turning to the discussion on the Fed’s balance sheet/QT we’ll continue to keep getting steady, sizeable auctions of T-bills (<1 yr) as confirmed in the recent Quarterly Refunding Announcement, and despite a monthly clip of around $800bn in T-Bill (<1 year) auctions, RRP levels have now climbed back into the middle of their range since the beginning of March despite the continued large T-Bill auctions which had previously sucked out $1.8tn since last May. RRP levels briefly dipped on Tuesday to the least since tax day (Apr 15/16th) at $322bn, but saw a quick recover to the $400-500bn range they have been in for most weeks since March 1st, this week just -$20bn below the March 1st level at $421bn.
Despite the stalling, BoA still forecasts RRP to drop to near zero ($60bn) by Oct due to RRP yields falling below those of money markets soaked up by bonds (from Fed QT), the Treasury (with a higher TGA), and currency growth (in dollars). If reserves increase that would also pull from RRP. They see it building again into early 2025 before declining again towards zero.
Despite a small weekly drop in RRP we also saw a small drop in bank reserves w/w of -$7bn bringing them to $3.37tn, still comfortably above the "scarcity" level estimated at around $3-3.25tn. They are +$70bn since June 1, 2022. BoA expects reserves to stabilize at these levels.
For background on various estimates of when reserves will be “too low” see the Feb 4th Week Ahead.
Getting back to rates, I said eight weeks ago 2 year Treasuries were a good buy at 5%, and I had thought we wouldn’t have a chance to get back there again until the next round of inflation reports in June. We got close three weeks ago, but now that seems a ways off with yields near 2mth lows. While hot July inflation prints could see us right back up at those levels, absent that I don’t see yields getting back to the May highs. I also continue to think 4.7% is a good place to ease into 10yr’s (we also didn’t get quite back there last week) with 5% a definite buy level, although I continue to doubt we will see 5% in 10yr’s (even with a round of hot inflation prints) absent rate hikes becoming a real possibility.
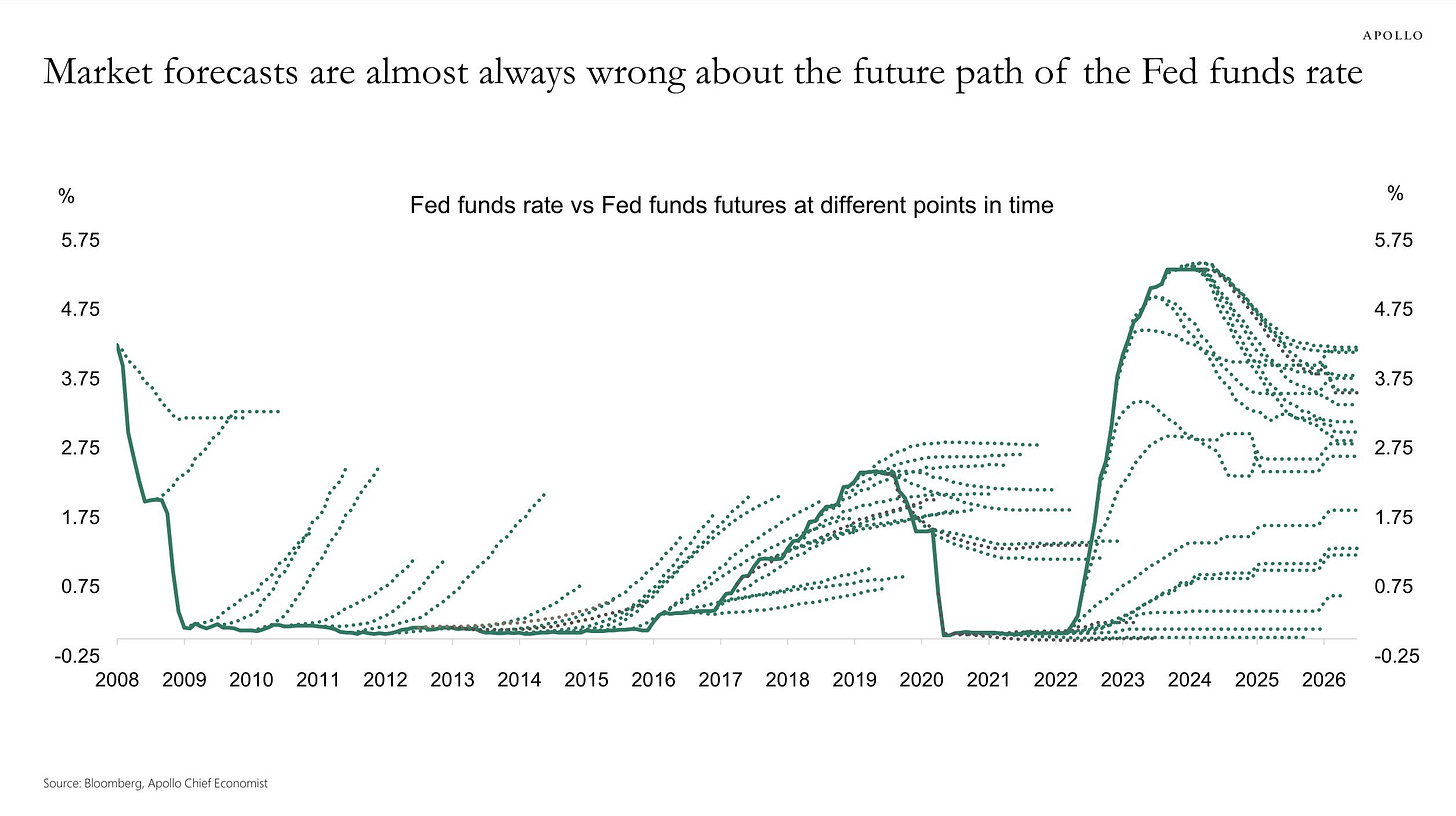
And a nice graphic about Torsten Slok, although you could probably make a similar chart for just about anything related to market expectations.
Also removing all the legacy “final hike” and “first cut” materials, which can also be found in the Feb 4th blog post. I will put in new things if they come up.
Earnings
As a reminder, I have removed most of the background material, which you can get in the Feb 4th blog post. As you know I’ve moved on to 2Q and beyond. You can reference this post from 5/12/24 for stats on 1Q.
Factset had some issues this week so they didn’t update the numbers/charts for 2024 & 2025 beyond noting they see growth rates currently of 11.3% & 14.4% resp, the 3rd time in the last 15yrs the SPX has reported back to back double-digit earnings growth (2017-18, 2010-11, notably both came after 20% drawdowns in the SPX the prior year).
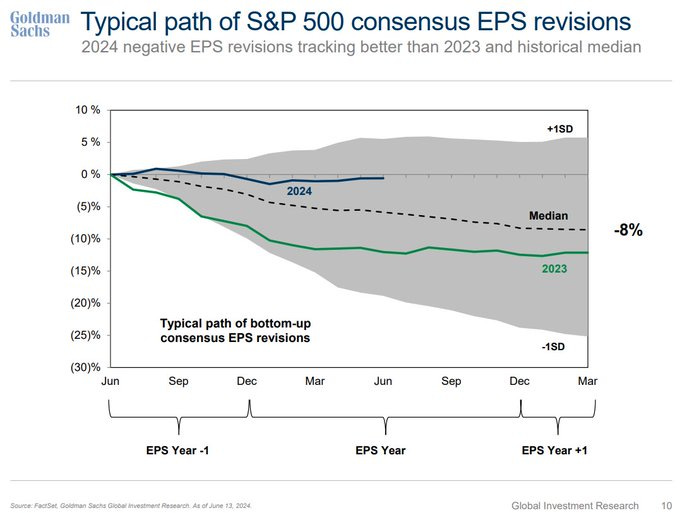
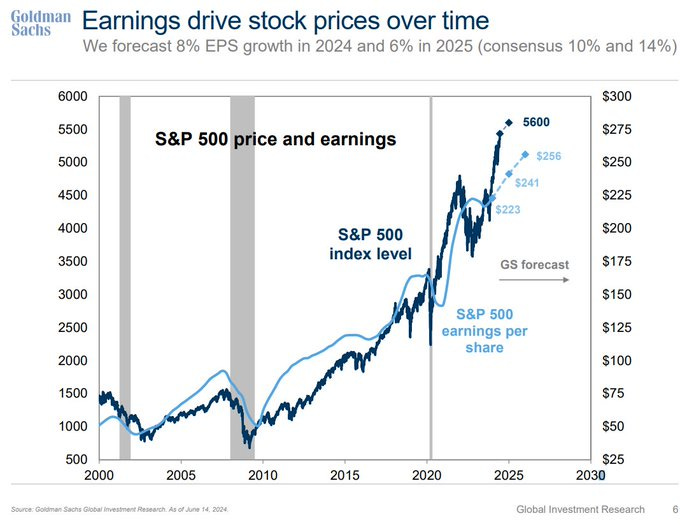
Looking at FY ‘24 expectations, as noted in previous weeks back in July analysts had penciled in a nice jump of almost 12% for 2024 earnings to over $247. Typically we would see that number steadily deteriorate through July of the following year (2024) when it should basically “lock in,” and we can turn to 2025 (earnings generally end the year w/in 2% of where they are estimated in July of that year). But as you know by now we saw very little deterioration in the 2024 earnings number since July ‘23, and that continued this week as expectations fall three cents (after rising seven the prior two weeks so just marking time) to $244.70, just off the highest since the start of 1Q earnings and just around a percent below where we were last July (although as also noted in weeks past, that masks a big discrepancy between the top 10 which have seen earnings revisions increase ~+18% over that time versus the “other 490” who have seen a more typical ~-6% drop). 2025 earnings expectations cont’d to see a bigger upward adjustment moving this week to $279.42 from $279.06 last wk, the highest we’ve seen to date, and up almost $5 from the start of the year.
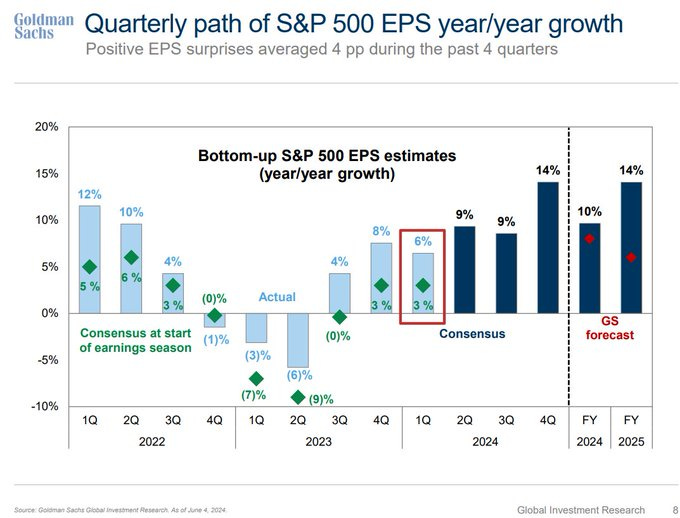
Looking more specifically at the rest of ‘24, Q2 earnings expectations (Q2 season unofficially starts July 12th) now at 8.8% and down from 9.7% eight weeks ago, Q3 remained at 8.2%, while Q4 remained at 17.6%. 2025 up a tenth though to +14.4%. As always of course the question will be if earnings can exceed whatever bar the market has priced in.
Also in considering Q2 earnings, remember that Factset said along with Q1 earnings that actual earnings have on avg come in +7.2% better the past 5 yrs than expectations at the start of earnings season, which would mean that Q2 will be +16%(!) y/y growth if the 8.8% estimate holds (and we get the avg improvement).
Factset’s analysis of analyst bottom-up SPX price targets for next 12 months as of Thursday got back most of the prior week’s 26 point drop +25 points to 5,925 (a 9.0% increase to the close that day) and up ~770 points over the past 17 weeks. Energy (+22.1%) has the largest gap, tech now the least +2.7% replacing utilities.
As a reminder, in 2023 they were within a couple percent, but typically they are b/w 3 and 8% too high (towards the lower end the last 10 yrs). Of course that range masks a wide discrepancy between big up and down years for the SPX.
In terms of analyst ratings, buy and hold ratings continue to dominate at 55 & 40% respectively. Communication Services (63%), Energy (62%), and Information Technology (60%) sectors have the highest percentages of Buy ratings, while the Consumer Staples (46%) and Materials (46%) sectors have the lowest percentages of Buy ratings.
And some other analyst charts/notes on earnings:
Economy
As I’ve written over the past 18 months, part of my earnings optimism has been due to the economy holding up better than expected. While earnings only track the economy loosely (and markets look forward 6-12 months), there is a clear correlation between recessions, lower earnings, and lower stock prices (although stock prices (being as noted forward looking) generally fall in advance of the recession and bottom 6-9 months before the end of the recession). So if you can see a recession coming it is helpful, although very difficult (especially ahead of the market). You can reference this Week Ahead (see the Economy section) for a lot of material on how every recession is preceded by talk of a “soft landing” as close as a month before the start. On the IRA infrastructure act, the November 26 report has good info on how that should be supportive at least through the end of this year. That report also has the notes about how small caps have shorter debt maturity profiles and more of it.
As I’ve been stating since I started doing the Week Ahead posts in mid-2022, the indicators to me are consistent with solid (which at times has been robust) economic growth, and I certainly do not think we’re on the verge of a recession. That said as I’ve noted over the past 8 weeks or so, we have clearly started to see some moderation in key areas like consumption, manufacturing, construction, exports and housing (although this week manufacturing seems to have joined services in rebounding if the flash PMI’s and industrial production numbers are any indication). This week we saw positive news as noted in the flash PMI’s and industrial production numbers, but weaker than expected reads on housing and retail spending (although core spending remained solid (we’ll get a better read on spending with the personal spending numbers on Friday). Jobless claims remained near the highest this year, but many think it’s the same seasonal adjustment issues we saw last year at this time, and regardless they remain quite low historically. But the overall story seems to remain of a 2% (real) economy (which is not surprisingly around where consensus estimates are) which is quite healthy.
Overall the data last week was weaker than expected which now has the Citi Economic Surprise Index down to -28.1 from -5.5 two weeks ago & now the least since Aug ‘22.
While BBG’s economic surprise index now the lowest since 2019.
And GDP estimates are also consistent with a no recession call (again though remembering GDP going into recessions generally doesn’t look like one is coming (it was up around 2% in Q2 & Q3 2008 well after the recession had started)). They are though below (some well below) where they were a month ago.
Goldman down to 1.9% for 2Q.
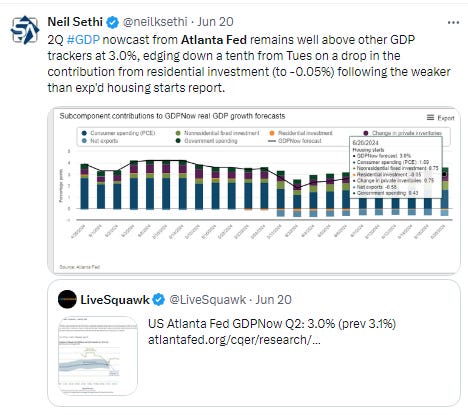
Atlanta Fed saw two updates this week, overall edging down a tenth to a still very robust +3.0% for 2Q.
BoA’s 2Q GDP tracking up two tenths w/w to 2.0%. As a reminder they were one of the closer est’s in 1Q at 2.1% (actual 1st est was 1.6%). They see this as the likely average number through 2026. “Growth should moderate towards 2.0% as the catch-up effect in employment fades and the contribution from fiscal and business investment slows. That said, we see enough resiliency in the consumer to keep the economy in a solid expansion.”
While the NY Fed’s 2Q GDP Nowcast edged lower for a 2nd week to 1.89% from 1.91% as a big boost from industrial production (+0.14%) was offset by -0.08% from building permits & starts and -0.07% from overall data revisions. Q3 though moved up four tenths to +2.17% as data revisions had less impact.
And the St. Louis Fed GDP tracker, which I gave a lot of grief to all of ‘23 as it was way too low but was the closest I saw for 1Q (at 1.71% vs 1.6% actual first est), remains by far the lowest for 2Q falling to just +0.80% from +0.94% a week ago.
While the Weekly Econ Index from the DallasFed (scaled as y/y rise for GDP), which runs a week behind other GDP trackers, as of June 15th remained at the highest since Sep ‘22 at 2.43%, from +2.22% the prior week (revised from +2.73% (this series is consistently revised lower in the following week)), seeing the 13-wk avg continue to improve now +1.82% from 1.78% evidencing upward momentum to GDP.
Here’s the components.
Other economy stuff:
Multiple
Like the other sections, I’ll just post current week items regarding the multiple. For the historical stuff, see the Feb 4th blog post.
With the SPX up on the week, its forward P/E was as well to 20.9 from 20.8 edging towards the highs of the year. The “Megacap-8” P/E is already now at a new high at 30.8 from 29.4. In contrast, mid-caps & small caps are nearer the lows at 15.0 & 13.9.
As BoA reminds us according to their work, valuation matters little in the near term, but is almost all that matters in the long-term.
And some analyst thoughts on valuations.
Breadth
You know if read the daily updates that breadth continues to be weak, but at least saw a tiny glimmer of improvement last couple of days (here’s a link to Friday’s report). Overall the indicators in this section tell the same story (weak breadth but some improvement, particularly for the NYSE). Still it remains one of the bigger divergences between breadth and large cap index levels we’ve seen in a while.
While Nasdaq advance/decline volume line remains supportive of its index, NYSE’s is not (although it improved a little this week and in most other indicators the NYSE made more progress this week).
As % of stocks over 200-DMAs flattened out this week but remaining diverged from price action on both SPX & Nasdaq.
And % of stocks above 50-DMAs also saw very modest improvement end of week after hitting lowest since April.
% of stocks above 20-DMAs saw a little more improvement on the NYSE towards the highs of the month while the Nasdaq remained just off the least since April.
While the equal-weighted SPX vs cap weighted saw a tiny improvement pausing its drop toward the 2009 lows.
And IWM:SPY (small caps to large caps) ratio remains below the levels in 2000.
After the prior week’s tech party in the $SPX, a much broader selection of sectors did well this week with 9 total in the green (after 3 last week) led by discretionary w/6 total sectors up at least +0.9% (after 2 the prior week) so much better breadth this week.
Last week's SPX stock-by-stock chart map from Finviz. A lot more green this week.
Flows/Positioning
BofA using EPFR data in the week through June 19th saw global equity flows remain positive for an 9th week +$25.6bn, the 27th inflow in the last 34 weeks and largest since March, +~$220bn YTD. Equity flows are ~+$369bn the last 52 weeks.
Inflows:
Real estate continues to flip back and forth this week +0.1bn (still -$3.2bn last 11 weeks). largest on record (Harnett s), now +$30.5bn last 24 weeks (and $56.2bn last 46 wks).
Energy saw a rare (last 6mths) inflow, just the 6th inflow in 31wks (and 2nd in 9) +$0.6bn.
Healthcare also rare (of late) inflow (although 2nd in 3 wks) +$0.1bn (still -$16.5bn last 37 weeks).
Real estate continues to flip back and forth this week +0.1bn (still -$3.2bn last 11 weeks).
Commercial services +$0.6bn.
Outflows:
Materials saw the 1st outflow in 7 wks (& 4th in 20 weeks) -$0.5bn (still +$4.3bn last 6 wks).
Utilities 1st outflow in 4 wks and 2nd in 8 weeks (after a 15-week string of outflows (the longest outflow streak since 2003)) -$0.2bn.
Financials 1st outflow in 3 wks -$0.3bn (still +$1.2bn last 3 wks).
Consumer returns to outflows -$0.5 (-$16.6bn last 36 weeks).
Breaking down EPFR data in the week through June 19th by country/style flows:
US 9th week of inflows, +$20.4bn, a record, now ~+$73bn last 9 wks & +$207bn last 30 weeks (~+135bn YTD).
EM 3rd wk of inflows, but just the 6th in 15 wks +$1.6bn, now +$59.1bn YTD, on pace for $122.9bn, as #China saw 2nd week of inflows (+1.3bn & +$3.3bn last 2wks, largest since Feb), although only the 3rd in 12 wks, while #India +$0.8bn after two weeks of record inflows, now +$15.3bn YTD and on pace for largest annual inflow ever. EM took in +$91bn in 2023.
Europe 5th wk of outflows, 66th in 67 wks, -$1.0bn, now -$23.2bn YTD after -$66.9bn in 2023.
Japan returned to inflows for 1st week in 6 (although 15th in 22 weeks after largest 5wk outflow on record +$0.6bn, now +$12.9bn YTD after +$7.3bn in all of 2023.
US large caps continued to see inflows +$4.2bn, the 35th inflow in the last 42 weeks, now ~+$189bn last 33 weeks after $125bn in all of 2023.
Small caps also returned to inflows +$2.5bn (still -$5.2bn last 10 weeks, but now positive YTD at +$0.2bn).
US value even saw a rare inflow +$1.5, just the 6th in 26 weeks (still ~-$30bn in 2024 after a record -$73bn in 2023).
US growth saw a record inflow of $11.9bn.
Looking at EPFR data in the week through June 19th for fixed income saw a 63rd inflow in 64 weeks (and 26th straight) +$6.4bn, now ~+$281bn YTD (annualizing to $584bn):
IG/HG a 34th consecutive week of inflows (60th in 64 weeks) +$5.0bn, now ~$191bn the last 24 weeks, on track for a record $395bn in 2024 after +$162bn in 2023.
Treasuries 18th inflow in 20 weeks (and 7th straight) +$1.2bn.
Munis 20th inflow in 23 weeks (and 3rd straight) +$0.2bn.
HY first outflow in 6wks and just 7th in 33 weeks -$0.2bn, still +$33.4bn last 32 weeks.
Bank loans just 2nd outflow in 17 weeks (and 1st in 9 wks) -$0.3bn, largest since Oct. Hartnett says #ratecuts.
EM debt 2nd week of outflows (and the 35th in 44 weeks), -$0.5bn. EM debt saw -$37.0bn in outflows in 2023.
TIPS another outflow, the 33rd in 41 weeks and 3rd straight, -$0.3bn. TIPS saw record outflows of -$33bn in 2023.
EPFR saw cash funds with a rare outflow, -$15.8bn, still +$299bn YTD (annualizing to more modest but still v healthy $622bn after record $1.3T in 2023 and $3.3T since 2019 through the start of 2024). The total inflow to money markets over the last 27 weeks is ~+$726bn.
Gold/Silver broke 2wk streak of inflows (the 43rd outflow in 55 wks) -$0.3bn (still +$0.9bn last 3 wks).
Crypto funds (#Bitcoin) saw first outflow in 7 wks, -$0.4bn, still +$3.8bn last 7 weeks.
ICI data on money market flows saw a similar outflow in week through Wed as seen in the EPFR data, in the case of ICI the first since Tax Day, -$22bn cutting the YTD total to +$213bn but still leaving the total sitting in MMF’s as of Wednesday at $6.10tn, down from the $6.12tn record high set last week.
Looking at systematic flows, BofA estimates that CTA (trend follower) positioning in NASDAQ-100 futures is “back to very stretched levels” which leads to tighter stop losses “at levels 2.8% lower from Friday’s close." With leveraged ETFs also remaining “at highs," in the event of “a sufficiently large NASDAQ-100 decline, the combination of CTA unwinds and levered/inverse ETF flows could create a more dramatic 1-day drop.” Positioning in the SPX is also “stretched” with an even closer unwind level of 2.5% while the RUT, Europe and Japan are “less stretched though still long.”
Net exposure for the SPX, NDX, RUT, Nikkei225 & SX5E are now estimated at 83, 91, 26, 48, & 46% respectively from 85, 90, 45, 55, & 57% last week (so RUT, Nikkei, & Europe all saw selling for a 2nd week as did the SPX (very mildly) but it and NDX are around the highs of the year.
In terms of gamma positioning, BoA estimates that despite the options expiration
delta-hedgers ended the week net long +$6.6bn (93rd %ile) of SPX gamma, a continuation of the remarkably elevated gamma footprint we’ve seen lately. Furthermore, the current gamma profile indicates that if the S&P were to rise ~1.5% then SPX gamma could set new all-time highs. While this stat is imperfect, as it assumes no new trading activity, we find it striking, nonetheless. This high gamma regime continues to take its toll on 1-month S&P realized volatility which we now estimate to be ~1.6pts (16% of the level).
So we remain strongly positive gamma (if off the the 99th percentile reading from last week) which will continue dampen volatility in both directions and be self reinforcing as long as SPX doesn’t make a sudden move below 5250 (where gamma will flip negative).
And with elevated gamma keeping realized volatility low, BoA estimates that volatility targeters (risk parity) have now increased SPX leverage to the highest in over 2 years. Even with continued low volatility I’m not sure how much room these have to the upside, but there’s certainly a lot of room for them to unwind if there’s any pickup in volatility.
The takeaway from the above is that in the event we see for whatever reason equities quickly pull back sharply (over -2%) there will be a lot of selling from all of the various systematic strategies that could see a -3% pullback quickly turn into a -5% or more pullback.
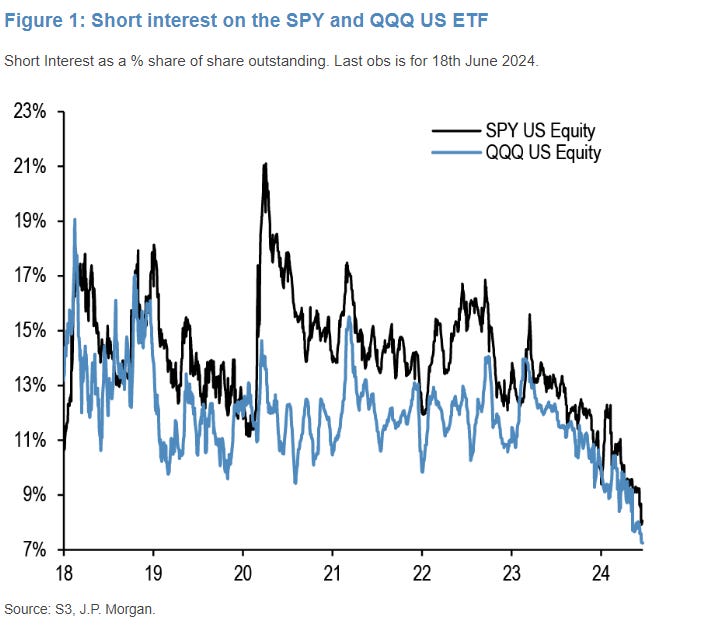
As short interest remains scarce.
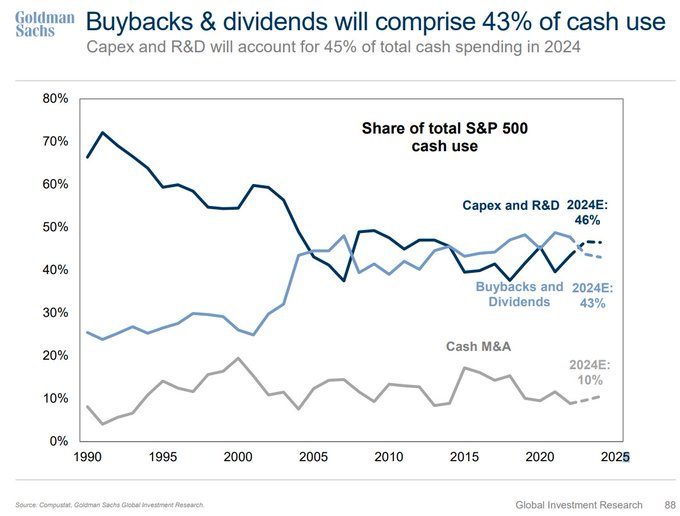
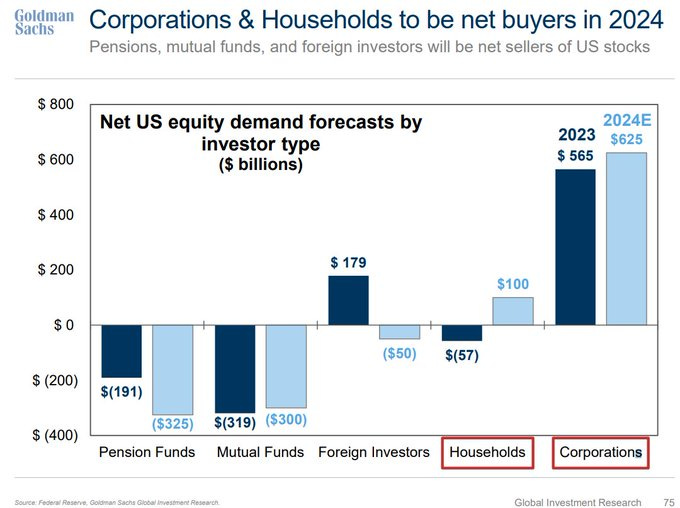
But corporates will continue to be supportive.
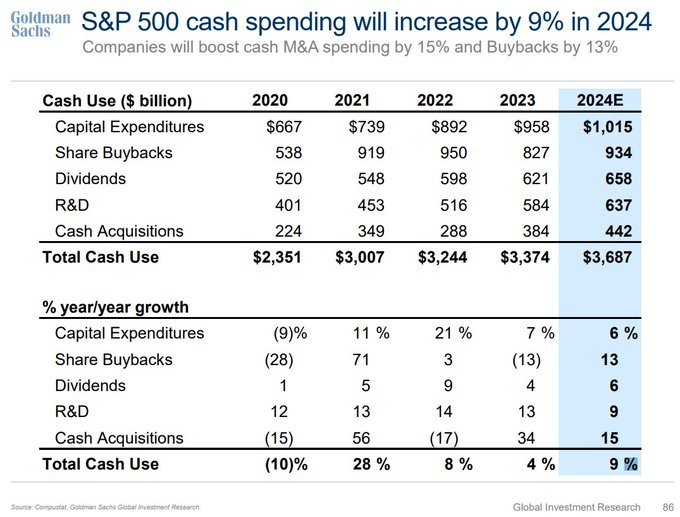
So far though haven’t seen the big M&A boom that was expected.
Analyst Commentary
Bulls continue to remain quite vocal although most if asked will say that “we’re due” for a pullback:
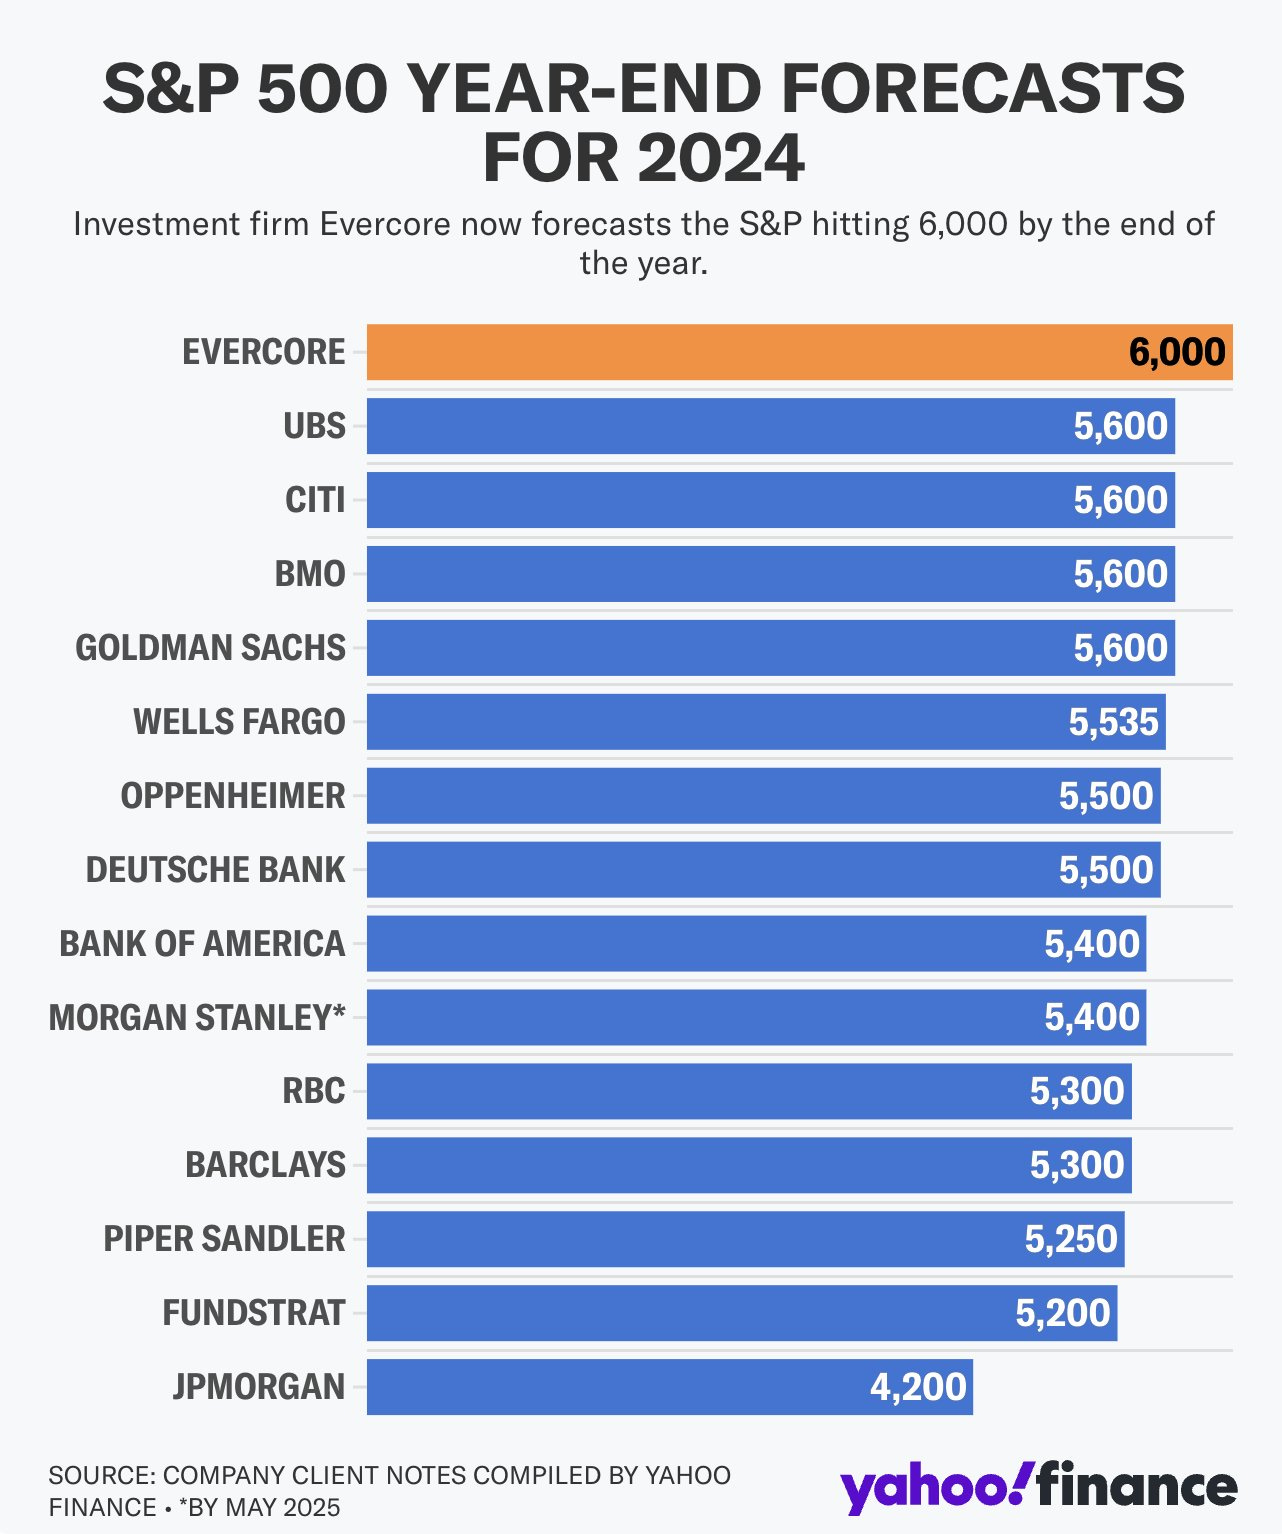
Citigroup strategists raised their 2024 forecast for the S&P 500 to 5,600, becoming the third Wall Street firm since Friday to upgrade its outlook. Ongoing positive earnings revisions and broadening of profit growth to non-tech S&P 500 companies prompted the target upgrade, Citi strategists led by Scott Chronert wrote. They also raised the US to overweight “due to its substantially higher growth tilt relative to Europe, and more defensive nature in episodes of uncertainty,” the strategists wrote in a note.
To Nicholas Bohnsack at Strategas, equity valuations have shifted higher into the upper strata of their historical range where the forward return profile is not particularly robust for new money. “Still, there appears little to put the domestic bull market into abeyance,” he said. “The economy, while showing some signs of softening momentum, is generally strong globally. Market performance remains strong and corporate profits expectations are broadening. We remain bullish ‘til the bill comes due.”
John Stoltzfus at Oppenheimer Asset Management says he remains positive in the outlook for stocks as prospects for improved fundamentals this year show potential to be realized. “That said, history shows us that stocks and other asset class prices don’t go up in a straight line but rather tend to climb the proverbial ‘wall of worry,’ requiring prudent diversification, patience, and a sense of one’s tolerance to risk and fluctuation for private investors and discipline tied to an institution’s mandate for professional investors,” he noted.
Ned Davis Research strategist Ed Clissold raised his year-end outlook on the S&P 500 to 5,725, saying that a modest pickup in earnings growth and the likelihood that policymakers’ next move will be a cut set up equities for more gains in the second half of 2024. “The outlook is not without potential pitfalls,” Clissold wrote. “High valuations and narrowing leadership leave the market vulnerable for bigger drawdowns should the bullish fundamental/macro backdrop falter.”
“We are in a soft landing scenario, central banks have started easing policy or will start to ease soon, and we may be facing a wave of positive productivity shock thanks to technology,” said Benoit Anne, head of investment solutions at MFS Investment Management. “Put all that together and you have a very supportive environment for global equities.”
And as noted last week, “true” bears are few and far between with most former bears either turning bullish (like Julian Emmanuel or Mike Wilson) or slipping into more of a “cautious” stance (“upside is capped”, etc.) which also includes some more bullish (but who have shifted to a more neutral stance awaiting a correction). JPM’s Kolanovic remains a holdout.
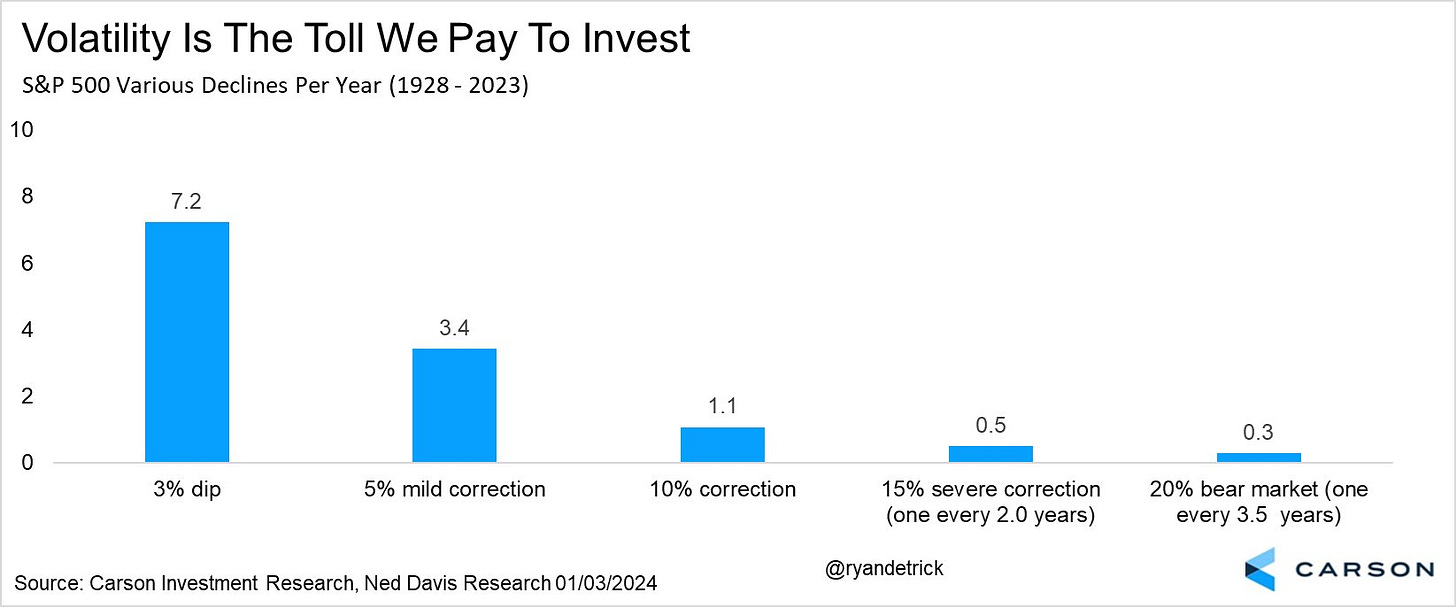
Even in previous bull markets, the upward price appreciation does not typically move in a straight line, said Mona Mahajan, senior investment strategist at Edward Jones. “Overall, the fundamentals and backdrop still remain supportive, but we would expect corrections along the way,” she said, adding that two to three corrections are typical in any given trading year.
“It’s probably not a bad time to take some chips off the table,” said Dave Grecsek, a managing director at Aspiriant. “We’ve had a magnificent run, and the market is looking a little extended.”
“Investors should brace for drama,” said Solita Marcelli at UBS Global Wealth Management. “The second half of 2024 is shaping up to be a time of transition and volatility. The decisions that investors make now will be key to navigating this period effectively.”
“Bullish momentum remains intact for the S&P 500 and Nasdaq, but near-term overbought conditions coupled with deteriorating breadth make equities vulnerable to a pullback or correction,” said Craig Johnson at Piper Sandler.
Keith Lerner at Truist Advisory Services says the firm is downgrading the technology sector to “neutral” after the industry largely outperformed the S&P 500 since their “overweight” call in November. “Although we still have a favorable long-term view of technology, on a shorter-term basis the sector appears extended, and we would not be chasing the sector,” Lerner noted. “That said, the sector appears far from ‘bubble’ territory, and we believe secular tailwinds will persist around artificial intelligence.”
Sentiment
Sentiment (which I treat separately from positioning) is one of those things that really only matters at the extremes (and even then, like positioning, it really is typically helpful more at extreme lows vs extreme highs). Sentiment continues to generally follow the market and it mostly did this week again but unlike the market at new highs, sentiment is not (and some like the Fear & Greed Index is closer to recent lows). Regardless, as I’ve noted previously sentiment is more of a coincident indicator than a forward looking one, until we get to an extreme which I don’t think we have seen this year.
The 10-DMA of the equity put/call ratio (black/red line) has settled into its normal relationship of a falling ratio coinciding with a rising market. For whatever reason the connection between this indicator and the market has not worked well this year though so I don’t take as much reading from it for now.
More sentiment indicators:
CNN Fear & Greed Index continues to not look like the other sentiment indices despite the SPX hitting record highs although up slightly for the first time in 5 wks to 41 from 38 last week.
As a side note, if you’re wondering the reason for how the index can be in “Fear” since June 10th while the SPX and Nasdaq are hitting all-time highs, it appears it’s due to two components in "extreme fear" related to breadth (net 52wk highs-lows & McClellan Vol Summation Index). Also in "fear" territory are 20-day stock vs bond returns & junk bond spread (vs IG).
While the BofA Bull & Bear Indicator continues its rise since its local bottom in April at 5.0 now up to 6.0 edging close its 3yr high of 6.7 in February.
And Goldman’s sentiment index pulls back two tenths but remains in “stretched” territory.
Didn’t see an update on panic/euphoria this week, from last week.
And Citi’s Panic/Euphoria model remains in Euphoria where it’s been most of the time since the last week of March. As a reminder Citi says readings in Euphoria “generate a better than 80% probability of stock prices being lower one year later.”
While Helene's followers continue their growing bearishness for a 3rd week, now the most bearish since March 16th, after breaking 7wk streak of bullishness 3 wks ago, which was the longest since Oct/Nov (which was 9 consec weeks). When that 9wk streak ended we did see a 2+% pullback but not this time (at least not yet).
Seasonality
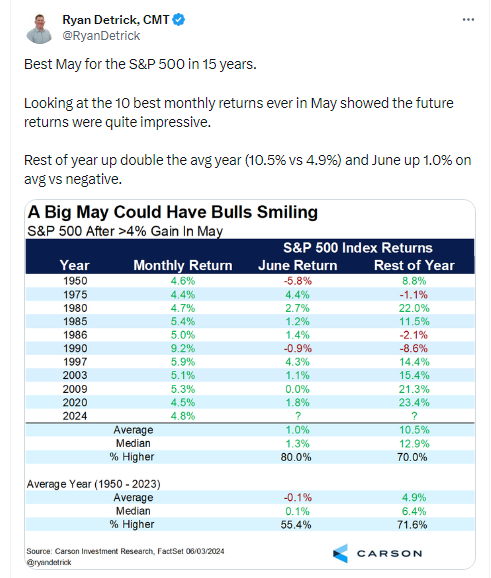
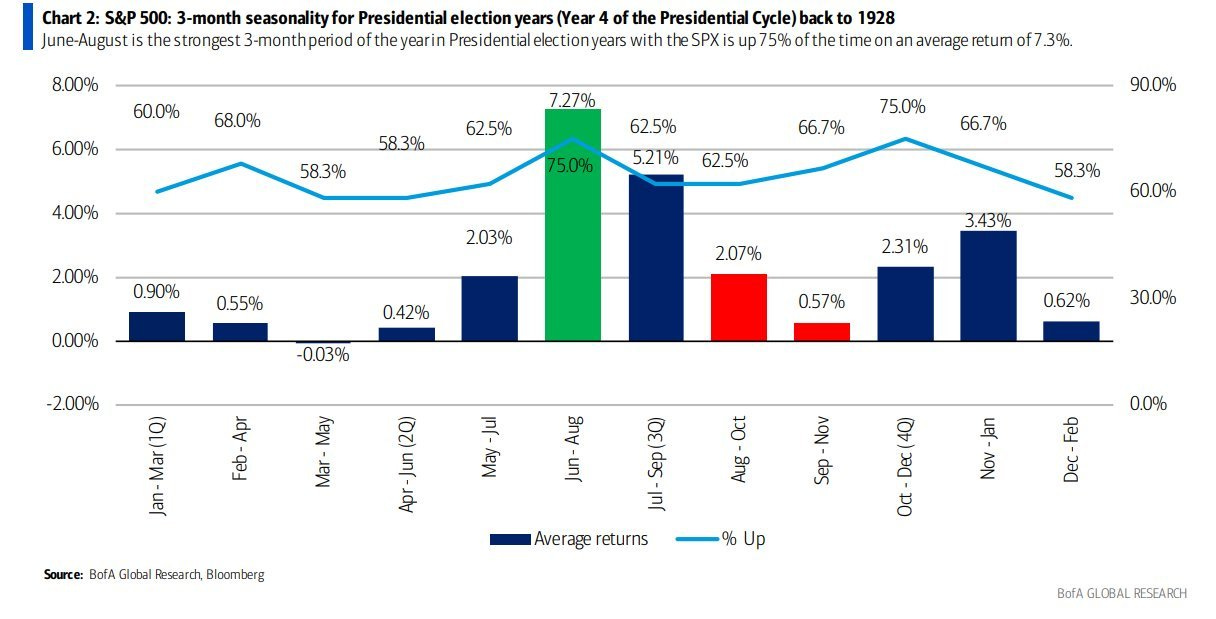
As noted in previous weeks while the May-Nov period is commonly thought of as seasonally weak ("Sell in May” and all that), in reality on average it sees positive returns and also is normally stronger in an election year (at least until around late July). Further as noted four weeks ago both BofA and Carson Research have found presidential years have typically seen “big summer rallies” (maybe that’s what we’re in the midst of?). Shorter term, in an average year (not sliced into Pres election yr, etc.) next week is a good one, which carries through to last 20yrs and/or election yrs from Jeff Hirsch’s work.
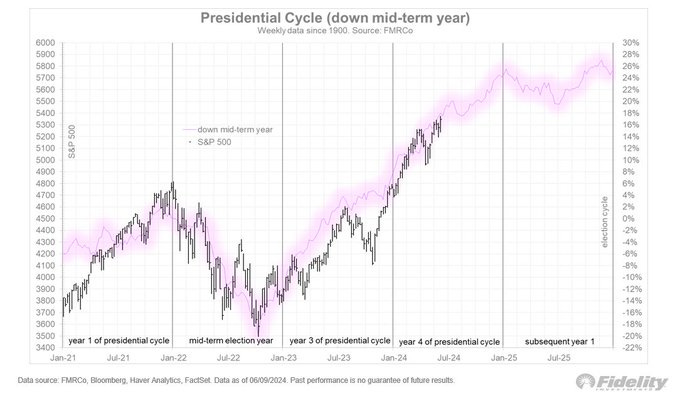
An update from Jurrien on how the $SPX is tracking vs the Presidential cycle w/a down Year 2. As of now, right on track which if it holds through YE would mean another 6% from here (5700).
But while many are feeling bullish for a "summer rally" Jeff Hirsch notes that historically when April, normally a strong month, is down, so are Q2 & Q3.
I'm not sure how Jeff defines "top election yrs" but this Q1 was above even that. But as he notes those outperforming years on avg saw a decline into June before things ramped up in line with the normal election yr seasonality.
For references to all of the “up YTD through Feb” see the March 3rd post. For all the very positive stats through March (strong 1Q, strong two consec quarters, etc.) see the April 14h post.
For the “as January goes so goes the year”, see the February 4th Week Ahead.
Final Thoughts
If you’re a regular reader you know I expected the dual CPI/Fed week 2 weeks ago to set the “underlying tone” for equity markets for the next month, and so far that’s been the case. While mixed (with a better than expected CPI report but more hawkish than expected Fed) that “tone” has broadly been one that is supportive (we took a step closer to rate cuts, the economic data remains healthy but is showing signs of needed cooling, rates have fallen to 2mth lows, etc.). Also supportive has been very little degradation in earnings expectations keeping P/E ratios in arguably fair territory. Sentiment is mostly positive but far from frothy, technicals are not great but that hasn’t been a major obstacle this year, and seasonality is generally favorable. So, as I said last week,
overall, there’s no obvious reason the market should correct beyond “it’s due”. There are of course very serious breadth issues, but we’ve seen that before. At some point that should resolve, but trying to time it is a fool’s errand. That said it certainly would be nice if we could get some participation from the portions of the market that have been lagging, but I’m not holding my breath (or breadth) on that.
We did see some glimmers on the breadth front the end of last week. Here’s hoping those improve. Otherwise, it seems this market is going to drift higher until something unexpected comes along to shake things up, which given the discussion on systematic positioning, could see a quick 3-5% drawdown that would allow us to reset things. What that “something unexpected” is and when it might be coming is obviously uncertain. But it will come, it’s just a matter of time.
Overall, I continue to overall remain bullish, looking to buy any new correction/consolidation that may emerge:
Overall this feels like a bull market (the economy is growing, earnings are growing, the Fed is much more likely to be cutting than hiking as its next move, the technical picture and seasonality are strong overall for this year, balance sheets are solid, there’s lots of liquidity, and there’s lots of stocks other than the biggest ones that are performing well (the equal weight SPX hit a new ATH in March, etc.) So if/when we do get that sharp pullback I would think it will likely be an opportunity to buy (like most sharp pullbacks are), not a reason to run for the hills.
And as always just remember 5-10%+ corrections are just part of the plan.
Portfolio Notes
Exited the SWKS, ADSK and NEE positions, trimmed back CHTR, CHWY. Added to LAZ, GTBIF, AM among some others. Also added some long-dated VIX calls.
Cash = 12% (held mostly in SGOV and MINT but also TLH (if you exclude the longer duration bonds, cash is around 10%)).
Still have some legacy SPX and QQQ shorts that I’ll be taking off on a retest of the breakout.
Positions (after around the top 20 I don’t keep track of their order on a frequent basis as they’re all less than 0.5% of my portfolio).
Core positions (each 5% or more of portfolio total around 20%) Note the core of my portfolio is energy infrastructure, specifically petroleum focused pipelines (weighted towards MLP’s due to the tax advantages). If you want to know more about reasons to own pipeline companies here are a couple of starter articles, but I’m happy to answer questions or steer you in the right direction. https://finance.yahoo.com/news/pipeline-stocks-101-investor-guide-000940473.html; https://www.globalxetfs.com/energy-mlp-insights-u-s-midstream-pipelines-are-still-attractive-and-can-benefit-from-global-catalysts/)
EPD, ET, PAA
Secondary core positions (each at least 0.5% of portfolio, total around 8%)
ENB, GOOGL
For the rest I’ll split based on how I think about them (these are all less than 0.5% of the portfolio each)
High quality, high conviction (long term), roughly in order of sizing
CTRA, DIS, XOM, KMI, SHEL, CVS, KHC, ADNT, T, K, BWA, TRP, SCHW, TLH, APA, ADNT, O, GSK, EQNR, PFE, CMCSA, TPR, OXY, MTB, BAC, VNOM, RHHBY, STLA, BMY, NEM, NTR, E, ING, VZ, DVN, SQM, PFF, TFC, DAL, CI, AM, JWN, VSS, ARCC, LAZ, AES, VOD, FSK, ALB, FIS V, GILD, DAL, BAYRY, ING, HBAN, BTI, RRC, FRT, VICI, FANG, DGS, SNOW, WES, INDA, MPLX, VWAPY, BMWYY, FSK, DDAIF, BUD, KEY, CVE, SWN, SOFI, BEP, BIIB, SAN, TEF, SPG, KVUE, CCJ, KT, PLTR, NEE, CRM, F, TSM, KLG, VNM, AAPL, WCC, MT, MFC, GPN, TD, LVMUY, SWKS, SEE, LYG, OWL, NKE, ADBE, ORCC, EMN, ZS, CHTR, ON, BCE, MDT, MCD, BLK, TSLA, ADSK, TDC, LH, BX, HAS, NOC, ULTA, ETSY, CHDRY, SIG, MSM, TAP.
High quality, less conviction due to valuation
Higher risk due to business or sector issues; own due to depressed valuation or long term growth potential (secular tailwinds), but at this point I am looking to scale out of these names on strength. These are generally much smaller positions outside of the top few.
ILMN, AGNC, PARA, PYPL, URNM, WBA, YUMC, STWD, CFG, ETRN, FXI, ORAN, KSS, CHWY, TIGO, ACCO, RMD, CLB, LUMN, HBI, IBIT, UNG, TCNNF, TCEHY, EEMV, PK, VNM, CURLF, GTBIF, , SABR, NSANY, VNQI, VALE, SBH, ST, WBD, LADR, BNS, EWS, , IJS, NOK, SIL, WVFC, VTRS, NYCB, ABEV, TPIC, PEAK, SEE, LBTYK, DOCU, RBGLY, LAC, CMP, CZR, BBWI, LAC, ZM, CAL, EWZ, CPER, MBUU, TLRY, HRTX
Note: CQP, EPD, ET, MMP, MPLX, PAA, WES all issue K-1s (PAGP is the same as PAA but with a 1099).
Reminder: I am generally a long term investor (12+ month horizon) but about 20% of my portfolio is more short term oriented (just looking for a retracement of a big move for example). This is probably a little more given the current environment. I do like to get paid while I wait though so I am a sucker for a good well supported dividend. I also supplement that with selling calls and puts. When I sell a stock, I almost always use a 1-2% trailstop. If you don’t know what that is, you can look it up on investopedia. But that allows me to continue to participate in a move if it just keeps going. Sometimes those don’t sell for days. When I sell calls or puts I go out 30-60 days and look to buy back at half price. Rather than monitor them I just put in a GTC order at the half price mark.
To subscribe to these summaries, click below (it’s free).
To invite others to check it out,


