

US Advance Goods Trade Balance Dec: -$90.3B (est -$88.1B; prevR -$82.9)
US Advance Goods Trade Balance Dec: -$90.3B (est -$88.1B; prevR -$82.9)
Exports decline and imports rise widening trade deficit; wholesale inventories edge higher but suggest inventory build in 4Q slowed in December.

US Advance Goods Trade Balance Dec: -$90.3B (est -$88.1B; prevR -$82.9)
-Exports of goods for December were $166.8 billion, $2.6 billion less (-1.6%) than November exports.
-Imports of goods for December were $257.1 billion, $4.7 billion more (+1.9%) than November imports.
US Wholesale Inventories (M/M) Dec P: 0.1% (est 0.5%; prevR 0.9%)
US Retail Inventories (M/M) Dec: 0.5% (est 0.2%; prev 0.1%)
Advance Economic Indicators Report (census.gov)


Quick update on the advanced indicators report for December which is a preliminary look at imports and exports for goods (not services) and inventories.
All numbers m/m and seasonally adjusted unless otherwise noted. Again, this does not include services (travel, trade, etc.) which will be reported in a couple of weeks. Also note these are nominal so do not account for price changes or currency differentials.
Exports - Goods exports fell further from the record highs seen in July, falling by -1.6%, led for a second month by industrial supplies (-5.1% in December after -5.2% in November), the largest component and around 40% of all goods exports (autos for comparison are more around 7%). In terms of percentage moves, autos led to the upside (+2.2%). With the decline, the y/y gain was cut to +5.2%. It was 20.8% in August. Table below.
Imports - Imports increased for the third time in the past four months (although the negative month, November, was a dramatic -7.6% drop), moving up by +1.9%. As with exports, industrial supplies was the largest detractor (industrial supplies are around 22% of imports) falling -4.1%. So there seems to be some definite slowing in December in industrial supply use globally. Strength was seen in autos (+9.4%), consumer goods (+6.6%), and “other” goods (+5.0%). Consumer goods are the largest component, around a quarter of total imports. Those had plummeted -13% in November. Y/y imports remain slightly negative (-0.4%) after dipping into negative territory for the first time in 2022 in November. They were +13.1% y/y in August.
With the drop in exports and increase in imports the goods trade deficit widened to $90.2B from $82.9B (as revised) in November which had been the smallest goods deficit since December 2020. That was above estimates for $88.1B, so is a detraction from 4Q GDP, although I’m guessing it was incorporated into the report released the same day.
I’ll discuss inventories after the table.

Inventories
On seasonally adjusted inventories, wholesale was up +0.1% to a new record with durable goods inventories increasing (+1.2%) but non-durable goods inventories declining (-1.6%). This was the lowest wholesale inventory build in a while so perhaps some slowing there. As this component goes into the calculation of GDP (inventory increases are a net positive as they are “production”), that is mildly supportive to 4QGDP which as you may remember was led by an inventory build. So this suggests that was mostly a November and October phenomenon. Wholesale inventories are up 17.8% y/y.

Retail inventories were up 0.5% in December after increasing +0.1% in November but falling -0.4% in October. Autos were up +1.1% and are now up 22.8% y/y (although remain well below 2019 levels as noted further below). Excluding autos, retail inventories were +0.3% m/m. Total retail inventories are up 13.9% y/y down from over 18% in November.

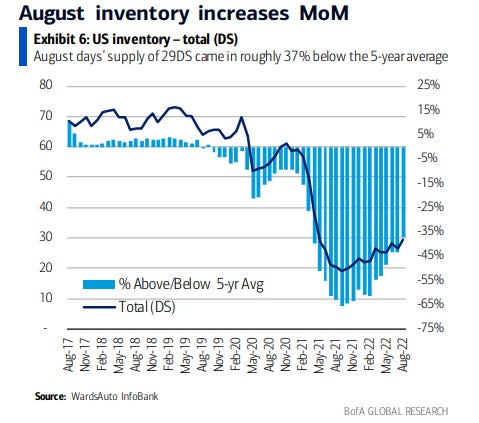
And a quick chart on auto inventories to show how far below “normal” levels those still are (this is from last month).
To subscribe to these summaries, click below.
To invite others to check it out,
To see more content, including summaries of most major U.S. economic reports and my morning and nightly updates go to Neil’s Newsletter Substack for newer posts or https://sethiassociates.blogspot.com for the full history. You can also follow me on Twitter @neilksethi. You can also follow me on Twitter @NeilKSethi